Hispanic Segregation in Metropolitan America: Exploring ...
50
Hispanic Segregation in Metropolitan America: Exploring the Multiple Forms of Spatial Assimilation * John Iceland and Kyle Anne Nelson University of Maryland February 2007 * Direct all correspondence to John Iceland, Sociology Department, 2112 Art/Sociology Building, University of Maryland, College Park, MD 20742-1315, [email protected] . This work was developed under a subcontract with Sabre Systems, Inc. and utilizes funds provided by the Census Bureau. Funding also comes from NIH grant R01 HD 0489047-01.
Transcript of Hispanic Segregation in Metropolitan America: Exploring ...
Hispanic Segregation in Metropolitan America: Exploring
the Multiple Forms of Spatial Assimilation*
John Iceland and Kyle Anne Nelson
University of Maryland
February 2007
* Direct all correspondence to John Iceland, Sociology Department, 2112 Art/Sociology
Building, University of Maryland, College Park, MD 20742-1315, [email protected]. This work
was developed under a subcontract with Sabre Systems, Inc. and utilizes funds provided by the
Census Bureau. Funding also comes from NIH grant R01 HD 0489047-01.
Hispanic Segregation in Metropolitan America: Exploring the Multiple Forms of
Spatial Assimilation
Abstract
This paper investigates patterns of spatial assimilation of Hispanics in U.S. metropolitan areas.
Using restricted-used data from the 2000 Census, we calculate levels of residential segregation,
using the dissimilarity index, of Hispanics by race and nativity and then estimate multivariate
models to examine the effect of group characteristics on these patterns. We use alternative
reference groups in the segregation calculations—Anglos, African Americans, and Hispanics not
of the same race—to obtain a more nuanced view of spatial assimilation. We find that Hispanic
race groups often experience multiple and concurrent forms of spatial assimilation: native-born
White, Black, and other-race Hispanics are all less segregated from both Anglos and African
Americans than the foreign-born of the respective groups. Hispanic race groups also show
particularly low levels of segregation from Hispanics not of their own race, indicating the
importance of pan-Hispanic identity. The one exception to this intra-Hispanic pattern occurs
among native-born Black Hispanics, who are no less segregated from other Hispanic groups than
their foreign-born counterparts. The implication of these findings is that assimilation is reducing
the significance of various color lines in metropolitan America, except for the modest distancing
observed between Black and certain other Hispanic groups.

Hispanic Segregation in Metropolitan America: Exploring the Multiple Forms of
Spatial Assimilation
Hispanics surpassed African Americans as the largest U.S. minority group sometime
around the year 2000. This growth has engendered uncertainty as to the future of Hispanic social
and economic incorporation in the United States. In the residential sphere, Hispanic segregation
from Anglos—while lower than African American segregation—is moderately high, and shows
no sign of decreasing (Iceland, Weinberg, and Steinmetz 2002; Lewis Mumford Center 2001).1
Immigration may in fact be contributing to the continued moderately high levels of segregation,
as immigration often reinforces ethnic enclaves, at least in the short run (Alba and Nee 2003;
Fischer and Tienda 2006).
Looking at the levels of segregation for all Hispanics from others, however, masks the
heterogeneity of the Hispanic population. In the current study, we are particularly interested in
the roles that race and nativity play in shaping the residential patterns of Hispanics. Data from
the 2000 census indicate that 48 percent of Hispanics reported themselves as “White,” 42 percent
as “some other race,” 2 percent as “Black,” and the rest as some other combination of race
categories on the census form (Grieco and Cassidy 2001). Black Hispanics are economically
disadvantaged and more segregated from Anglos than White or other-race Hispanics (Denton
and Massey 1989; Logan 2003).
A closer examination of the residential segregation patterns of Hispanics can provide
insight into the power, and limitations, of spatial assimilation theory. According to this
perspective, we should see a narrowing of group differences over generations (Alba and Nee,
2003). A complete examination of assimilation should consider the extent to which different
groups of Hispanics might be exhibiting varying or multiple forms of assimilation with other

2
groups. Thus, our study is guided by the following questions: To what extent do residential
patterns of Hispanics vary by race and nativity? Among which groups are spatial differences
attenuating? How do other group characteristics affect these patterns? To answer these questions,
we analyze restricted-use 2000 census data to calculate the levels of residential segregation, as
represented by the dissimilarity index, of Hispanics by race and nativity and then estimate
multivariate models to examine the role of other group characteristics.
From a methodological perspective, our study builds on existing research on this topic by
taking advantage of restricted-use decennial census files that allow us to look at the segregation
of Hispanics simultaneously by race, nativity, and in some cases country-of-origin, and to
estimate models that control for group characteristics. Such calculations are simply not possible
with public-use census data, but are important for isolating the role of race and nativity from
other attributes that shape residential patterns. In essence, these data provide us the flexibility to
test theoretical propositions on spatial assimilation in a methodologically rigorous way.
Another unique contribution of our study is the examination of segregation between not
only Hispanics and Anglos, but also between Hispanics and other U.S.-born groups. This allows
us to obtain a more nuanced picture of the different forms of spatial assimilation experienced by
various Hispanic groups. In the conclusion we discuss how the patterns we observe shed light on
the changing nature of racial and ethnic residential divisions and the possible trajectory of the
color line in the coming years.
Background
Residential segregation generally refers to the differential distribution of groups across
space, and is usually thought of in terms of the degree to which various groups reside in different

3
neighborhoods (White 1987). In the U.S., racial and ethnic residential segregation is thought to
affect the range of opportunities available to minority group members (Massey and Denton
1993). As Fischer and Tienda (2006: 101) note, “Residential location is a powerful indicator of
social position because many economic opportunities and social resources, such as affordable
housing, quality schools, public safety, transportation, and recreational and social amenities are
unequally distributed across space.”
In the middle decades of the twentieth century, research on residential segregation in the
U.S. focused primarily on the Black-White residential divide. Since then, however, researchers
have increasingly examined the segregation of other racial and ethnic groups, primarily Asians
and Hispanics. Research has generally found that African Americans are more residentially
segregated from Anglos than Hispanics, and Hispanics are in turn more segregated from Anglos
than Asians (Iceland et al. 2002).
There are two common and competing theoretical approaches to residential segregation:
spatial assimilation and place stratification (Massey 1985; Charles 2003). In the immigrant
incorporation literature, there is a third approach: segmented assimilation. Below we begin by
describing these three theoretical perspectives and then discuss how they apply to Hispanic
residential patterns in particular.
Classic spatial assimilation theory posits that minority groups experience a process
towards integration with a society’s majority group through the adoption of mainstream attitudes,
culture, and human capital attributes (Alba and Nee 2003). Early in this process groups may be
segregated from the majority group for a number of reasons. The low socioeconomic status
(SES) of many minority and immigrant groups may mean that such individuals may simply not
be able to afford to live in the same neighborhoods as more affluent whites (Alba and Logan
4
1991; Clark 1986, 1988; Pascal 1967). People with low levels of human capital may also be
particularly dependent on their ethnic communities (Alba and Nee 2003; Portes and Rumbaut
2006). Social networks—both kin and community—are key factors shaping where internal
migrants and immigrants live (Castles and Miller 2003; Portes and Rumbaut 2006). However,
minority group members are more likely move into other residential areas if and as they become
more socio-economically similar to the majority group. Contemporary assimilation theorists
emphasize that assimilation need not be a one way street, where minority members become more
like majority group members. Rather, assimilation involves a general convergence of social,
economic, cultural, and—the focus here—residential patterns (Alba and Nee 2003).
In contrast, the place stratification perspective emphasizes the role of prejudice and
discrimination in shaping residential patterns (Massey 1985; Charles 2003). Proponents of place
stratification theory assert that in-group preference among majority group members become
institutionalized such that minority group members have more limited opportunities to reside and
work among the majority group. Bobo and Zubrinsky (1996: 884) label residential segregation as
the “‘structural linchpin’ of American race relations” because of systematic differences between
predominantly Anglo neighborhoods and predominantly non-Anglo neighborhoods.
Discriminatory practices in the housing market against African Americans in particular,
as well as Hispanics and Asians, have been documented (Massey and Denton 1993; Ross and
Turner 2005; Turner and Ross 2003; Turner et al. 2002). Over the years these practices have
included the steering of racial groups by real estate agents to certain neighborhoods and away
from others, unequal access to mortgage credit, exclusionary zoning (where groups are restricted
to particular neighborhoods), and neighbors’ hostility (Goering and Wienk 1996; Massey and
Denton 1993; Meyer 2000; Yinger 1995). Research has indicated a decline in (though not the
5
disappearance of) discrimination against African Americans in the housing market in recent
years, perhaps due to changing attitudes in society, the rising economic status of minority
customers, and the continuing effect of the 1968 Fair Housing Act and its enforcement on the
real estate industry (Ross and Turner 2005). From 1989 to 2000 Hispanics experienced mixed
patterns of change in discrimination in the housing market: increases in the rental market but
declines in the sales market (Turner et al. 2002).
The segmented assimilation perspective focuses on divergent patterns of incorporation
among contemporary immigrants (Portes and Zhou 1993; Zhou 1999). The host society offers
uneven possibilities to different immigrant groups, and segmented assimilation theory posits that
recent immigrants are being absorbed by different segments of American society, ranging from
affluent middle-class suburbs to impoverished inner-city ghettos, and that becoming American
may not always be an advantage for the immigrants themselves or for their children. The
segmented assimilation perspective also highlights the differential treatment of the immigrants
by race, reflecting general prejudices of the population (South, Crowder, and Chavez 2005b).
This issue may of course be particularly pertinent to the residential experiences of Hispanics in
the U.S.—the topic to which we now turn.
Hispanic residential segregation patterns
While many empirical studies have found that Hispanic-Anglo residential segregation is
lower than African American-Anglo segregation (Fischer and Tienda 2006; Iceland et al. 2002;
Lewis Mumford Center 2001; Massey and Denton 1987), comparisons of Hispanic racial
subgroups have been relatively rare. This stems in part from the ambiguous nature of racial and
ethnic identity among Hispanics. Collecting race information from Hispanics has historically

6
been problematic given the diversity of origins among Hispanics living in the U.S. and confusion
over the distinction between Hispanic ethnicity and phenotypical race classification in the U.S.
context (Landale and Oropesa 2002; Rumbaut 2006). While the U.S. has a history of
dichotomizing race into White and Black, exemplified by the “one drop rule”—where people
having any African heritage were considered Black—in Latin America race is a multi-category
continuum (Denton and Massey 1989). In addition, many Latin Americans consider themselves
to be a mix of Spanish and Indian ancestry—a category unto its own.
This confusion is reflected in the responses to the race and Hispanic origin questions in
U.S. government surveys. In the response to the question on race in the 2000 Census, for
example, 42 percent of Hispanic respondents reported their race as “Other,” as compared with
just 0.2% of the non-Hispanic population (Grieco and Cassidy 2001; Rumbaut 2006). Rumbaut
(2006: 38) explains that “four centuries of mestizaje (racial mixing) and miscegenation in Latin
America and the Caribbean, as well as differing conceptions of ‘race’” contribute to the
complexity of addressing the role of race in the Hispanic experience.” Only 1.8 percent (roughly
633,000) of Hispanics reported black as their only race in the 2000 Census, and only 6.4 percent
reported two or more race categories (which includes many who reported “White” as one of their
races).
Denton and Massey (1989) examined the interplay of race and ethnicity in shaping the
residential segregation patterns of Caribbean Hispanics in their analysis of 1970 and 1980
Census data. Their findings indicated that Black Hispanics were indeed significantly more
segregated from U.S.-born Whites than White Hispanics and led Denton and Massey to conclude
that race was more important than ethnicity in explaining Hispanic patterns of residential
segregation. They documented that Black Hispanics from the Caribbean were also fairly highly
7
segregated from African Americans, suggesting an adoption of a distinct identity among these
Black Hispanics. In another analysis of 1980 data, White (1987) similarly found that Blacks of
“Spanish” origin were very highly segregated from non blacks of Spanish origin.
Between 1980 and 2000 (the years since the data analyzed by Denton and Massey and
White were collected), there were rapid increases in the native- and foreign-born Hispanic
populations, and unprecedented movement of Hispanics to new growth areas in the U.S.,
primarily in the South and Midwest (Suro and Singer 2002; Singer 2004). This shift in the
composition of the U.S. urban population raises important questions about recent patterns of
integration of Hispanics. Logan (2003) analyzed Census 2000 data and found that non-white
Hispanics continued to be more highly segregated from Whites than White Hispanics, thus
providing evidence that non-white Hispanics may be more similar to African Americans than
White Hispanics in their experience of social and economic disadvantage. South, Crowder, and
Chavez (2005a) find that Puerto Ricans and Cubans with darker skin color are less likely to
move into neighborhoods with Anglos, though skin color appeared to have little effect on
Mexican mobility patterns. White and Sassler (2000) report that Latino immigrant groups with
greater African heritage, mainly Puerto Ricans and Dominicans, were less likely to live in
higher-socioeconomic status neighborhoods in 1980 than other Latino groups, suggesting the
continuing salience of race in shaping residential patterns. Other research has shown that Black
immigrants often develop a shared racial group identity with native-born Blacks over time, even
if the meaning they attach to being Black is not always quite the same (Benson 2006).
Momentarily leaving the issue of race aside, empirical work on the association between
nativity, SES, and residential segregation generally supports spatial assimilation theory.
Segregation is lower for the native-born of ethnic groups than the foreign-born (Denton and

8
Massey 1988; Iceland and Scopilliti 2006), though sometimes the effect of nativity is
overshadowed by other factors, such as ethnicity (White and Sassler 2000; White, Biddlecom,
and Guo 1993). High-SES members of an ethnic group are also less segregated from Whites than
low-SES members (e.g., Denton and Massey 1988; Iceland, Sharpe, and Steinmetz 2005; Iceland
and Wilkes 2006; White, Biddlecom, and Guo 1993). Higher SES Hispanics and those with
greater English language use are also more likely to move into neighborhoods with more Anglos
than low-SES Hispanics with less English language use (South et al. 2005b).
Looking at the role of socioeconomic status is particularly important for examining the
association between race and Hispanic-Anglo segregation because in much of Latin America and
the Caribbean, people who are socio-economically successful may be less likely to identify as
Black (Denton and Massey 1989; Waters 1994). That is, race may refer to both class attainment
and skin color in some circumstances (Williams 1955; Waters 1994). Thus, our study
distinguishes between the role of race and class by including indicators of socioeconomic
attainment.
A final issue relevant for this study is the role of country of origin in shaping residential
patterns. As noted above, many immigrants depend on the preexisting community-based
networks—i.e., networks rooted in their country of origin—when they move to the host country.
This is particularly true among less educated migrants, who rely on kin and friends (rather than
job recruiting agents, for example) who can provide shelter and other kinds of help (Alba and
Nee 1993; Portes and Rumbaut 2006).
A majority of Hispanics in the U.S. in 2000 reported being Mexican (58.5 percent), with
the next largest groups being Puerto Rican (9.6 percent) and Cuban (3.5 percent) (U.S. Census
Bureau, 2001). Cubans are the most likely of the three to self-identify as White (84.4 percent in

9
2000). Puerto Ricans and Mexicans are fairly evenly split between identifying as White and
“Other race” (in the 42 to 47 percent range). Puerto Ricans are more likely to self identify as
Black (5.8 percent identify as such) than Cubans (3.6 percent) or Mexicans (0.7 percent)
(Rumbaut 2006).
Previous research indicated that Puerto Ricans are more segregated from Whites than
Mexicans and are more likely to live in poorer, inner-city neighborhoods (Massey and Denton
1987; Santiago 1992). Puerto Ricans are also less likely than Mexicans or Cubans to move into
neighborhoods with relatively more Anglos and more likely to move into neighborhoods with
more African Americans (South et al. 2005a). The higher segregation from Anglos among Puerto
Ricans than Mexicans may reflect that the former are more likely to have some African ancestry
(Massey and Bitterman 1985). However, Logan (2002) found that by the year 2000, the Puerto
Rican-Anglo dissimilarity score of 56.5 was actually only slightly above the Mexican (53.1) and
Cuban (49.5) dissimilarity scores, showing considerable convergence in segregation from Anglos
over the past two decades. That study did not investigate the factors that might explain various
patterns.
Our analysis contributes to the above literature on the residential segregation of Hispanics
in a couple of ways. Methodologically, one advantage of this investigation is that while previous
studies have calculated the segregation of Hispanics by race (e.g., Logan 2003; Denton and
Massey 1989) or by country of origin (e.g., Logan 2002), none have been able to calculate them
by both due to the lack of such public-use data at the neighborhood level. Indeed, Denton and
Massey (1989: 790) noted this type of data constraint in their study: “By focusing on
“Hispanics,” [as a whole], we do not underestimate the social, economic, and cultural differences

10
between Mexicans, Cubans, Puerto Ricans, and other Spanish origin groups. Rather, our analysis
is limited by the availability of data.”
Perhaps even more importantly, we also calculate our indexes by nativity—a crucial
indicator when examining the spatial assimilation process. We are particularly concerned with
whether residential differences are smaller among the U.S.-born than the foreign-born which
would be consistent with a trend of spatial assimilation across generations of immigrant families
living in metropolitan America. A second methodological advantage is that using the restricted
files also allows us to look at the association between race, nativity, and residential segregation
controlling for a number of covariates—including average group income and English language
ability—which are posited to be quite important in the residential sorting process.
Substantively, our analysis focuses on alternative trajectories of spatial assimilation. That
is, we examine Hispanic segregation by race using alternative reference groups in the segregation
calculations: U.S.-born Anglos, U.S.-born African Americans, and U.S.-born Hispanics of a
different race than the group in question. While some researchers have looked at segregation
using alternative or multiple reference groups (e.g., Denton and Massey 1989; Fischer and
Tienda 2006; White, Kim, and Glick 2005), they have not, due to data limitations in public-use
files mentioned above, examined the role of nativity in explaining these patterns. Why is this
important? While it is informative to know, for example, that Black Hispanics are less segregated
from African Americans than White Hispanics (as documented in the studies above), these
analyses do not shed light on whether we see a reduction in segregation among the native-born as
compared with the foreign-born. This is really the crux of assimilation theory: assimilation is the
attenuation of group differences, usually across generations (Alba and Nee 2003).
11
Moreover, an issue we also examine that has received little attention in the residential
segregation literature is the possibility that Hispanic groups might experience multiple and
concurrent forms of assimilation. Again, adopting a definition of assimilation that denotes a
reduction of group differences, it is possible, for example, that White Hispanics may be
assimilating with either Anglos, African Americans, or U.S.-born Hispanics not of the same
race—suggesting a growth in pan Hispanic identity less dependent on race—or even with all
three at the same time. Studies have found that children of immigrants from Latin America are
less likely to report their race as “White” or “Black” than their parents, and instead are more
likely to choose some larger “Hispanic, Latino” designation (Portes and Rumbaut 2001;
Rumbaut 2006). White, Kim, and Glick (2005) also argue that, in very diverse societies, it has
become increasingly important to recognize that individuals can be integrated with any number
of ethnic groups.
As described in the review of the empirical literature above, we expect assimilation to be
strongest between White Hispanics and Anglos and between Black Hispanics and African
Americans. We may see patterns that fall in between these racially paired groups among other-
race Hispanics, whose racial identification tends to be more fluid and whose socioeconomic
status also falls between that of White and Black Hispanics (Logan 2003; National Research
Council 2006). Hispanics who report being neither Black nor White may also particularly less
segregated from various other Hispanic groups, given that choosing such a racial designation is
perhaps indicative of a stronger general pan-ethnic Hispanic identity and certainly a weaker
identification with traditional White or Black racial markers (Rumbaut 2006).
Indeed, Rumbaut (2006) suggests that children who do not identify as Black or White
might see themselves as in fact belonging to a racialized Hispanic category. The implication of
12
this argument is that, contrary to the predictions of spatial assimilation theory, native-born
Hispanics who identify as neither White nor Black may display relatively high levels of
segregation from Anglos (and/or African Americans), and may in fact be more segregated from
these groups than Hispanic immigrants who have not yet internalized American racial categories.
In short, the goal of our analysis is to critically examine these issues. By looking at the
segregation of Hispanics by race and nativity we hope to gain a deeper understanding of what the
residential assimilation process looks like for different groups of Hispanics in metropolitan
America.
Data and Methods
We use restricted-use data from the 2000 Census to examine the residential patterns of
Hispanics in U.S. metropolitan areas. In essence, our analysis compares levels of residential
segregation between several Hispanic subgroups and native-born Anglos, native-born African
Americans, and native-born Hispanics of a different race from the group in question in all
metropolitan areas where the groups are present in sufficient numbers. Specifically, dissimilarity
indexes are computed for groups that have at least 100,000 members in the United States and at
least 1,000 in a particular metropolitan area—as segregation indexes for small minority
populations are less reliable than those with larger ones.2 We present segregation estimates for
all metropolitan statistical areas (MSAs), primary metropolitan statistical areas (PMSAs), and for
New England states, New England county metropolitan areas (NECMAs) together referred to
hereafter as metropolitan areas (MAs) as defined by the Office of Management and Budget
(OMB) on June 30, 1999. Using this definition, there are 318 MAs in the U.S.

13
To examine the distribution of different groups across neighborhoods within metropolitan
areas, we use census tracts. Census tracts typically have between 2,500 and 8,000 people, are
defined with local input, are intended to represent neighborhoods, and typically do not change
much from census to census, except to subdivide. In addition, census tracts are by far the unit
most often selected by other researchers (e.g., Logan et al. 2004; Massey and Denton 1993).3 We
exclude counts of people in institutional group quarters (such as prisons).
Respondent race and Hispanic ethnicity are determined by 2 questions on the 2000
census. The first question asks: “Is this person Spanish/Hispanic/Latino?” There is an answer
box for “no”, and then additional “yes” boxes where people also indicate if they are Mexican,
Puerto Rican, or Cuban. There is also a write-in box where respondents can identify other
origins. The next question on the census form asks, “What is this person’s race?” There are
answer boxes for White, Black, American Indian or Alaska Native, and a series of boxes for
various Asian groups (e.g., Chinese, Filipino, Japanese, etc.). People can also mark “Some other
race” and, unlike previous censuses, respondents are instructed that they can choose more than
one race. About 6.8 million, or 2.4 percent of the population, reported more than one race in the
2000 census (Jones and Smith 2001).
This study focuses on the residential patterns of those who reported that they were
Hispanic in the first question mentioned above. We look at differences in residential patterns of
Hispanics also by whether they indicated their race to be White alone, Black alone, or some other
race or any combination of races. People are classified as non-Hispanic White (Anglo) or non-
Hispanic Black (African American) in our analysis if they marked only those boxes alone and
also reported being not Hispanic.

14
In analyses when we look at the segregation of foreign-born Hispanics by country of
origin, we use data directly from the question asking “Where was this person born?” There are
two answer boxes, one box for “In the United States”, where people are asked to print the name
of the state, and a second box for “Outside of the United States” where people are asked to print
the name of the foreign country, or Puerto Rico, Guam, etc. As conventionally done in studies of
the foreign-born, our foreign-born population includes people who reported that they were born
outside of the United States, and are either not a citizen or a U.S. citizen by naturalization (this
excludes U.S. citizens who were born abroad of American parents). Hispanic individuals born in
Puerto Rico or other outlying territories of the U.S., although U.S. citizens at birth, are coded as
“foreign-born” in this study based on the shared experiences as newcomers to mainland U.S.
That is, according to the spatial assimilation model, it is reasonable to hypothesize that migrants
from Puerto Rico would be more segregated from Whites than Puerto Ricans born within
mainland states.
The measure of residential segregation we use is the dissimilarity index. The dissimilarity
index (D) is the most commonly utilized measure of residential segregation, and is a measure of
how even the distribution of two groups are within the smaller regions within a larger area
(Denton and Massey 1989; Logan 2002; Iceland et al. 2002). The formula for the dissimilarity
index is presented below, where ‘x’ and ‘y’ represent two population groups:
The dissimilarity index has values ranging from 0 to 1, and suggests the minimum
proportion of a group that would have to move across regions within an area so that each region
could have the same proportion of residents from that group as the total area. A dissimilarity
D x / X - y / Yi ii 1
n
= ∑=
. *5

15
index of 1 indicates complete segregation between two groups such that 100 percent of a group
would have to move in order to comprise the same proportion of the component communities as
in the larger area. Conversely, a dissimilarity index of 0 represents complete integration. For
example, if a metropolitan area has 12 census tracts and 25% of the MA population is Hispanic
and 75% is Anglo, the proportion of the population in each tract would have to equal 25% for the
dissimilarity index to be 0. Conversely, if all Hispanics in the MA lived in three tracts
exclusively and made up those tracts’ entire population, this would indicate total dissimilarity, or
a dissimilarity index of 1.
We also conducted the analyses with the isolation index (the second most commonly-
used segregation index), though due to the length and breadth of the current study we limit our
discussion to dissimilarity. The conclusions do not change much when using the isolation index.4
Our analysis begins with a descriptive look dissimilarity scores by race, nativity, and
country of origin. In particular, we examine the segregation of White, Black, and other-race
Hispanics, by nativity, from U.S.-born non-Hispanic Whites (Anglos), U.S.-born non-Hispanic
Blacks (African Americans), and U.S.-born Hispanics not of one’s own race. The purpose here is
to get a broad sense of what patterns of spatial assimilation we see among various groups of
Hispanics.
It should be noted that here we use “assimilation” in a very precise way: as indicative of
the attenuation of group spatial differences across generations. According to assimilation theory,
we would expect to see lower Hispanic-Anglo segregation scores among native-born Hispanics
than foreign-born ones, regardless of the race of Hispanic respondents, indicating a pattern of
assimilation between first-generation immigrants and U.S.-born generations. Assimilation theory
does allow for differences in the level and extent of change across generations among different

16
groups, but we should still witness this type of attenuation for all groups (Alba and Nee 2003).
We compute Hispanic-African American segregation scores to gauge whether Hispanics, and
Black Hispanics in particular, are more likely to be assimilated by the African American
population than the Anglo population, thus providing some support for segmented assimilation.
Finally, we examine Hispanic-“Hispanic not of own race group” segregation to gauge the extent
of Hispanic pan-ethnicity spans across self-identified racial groups.5 In the descriptive tables we
also show these segregation comparisons by country of origin as the data allow. In particular, we
look at the residential patterns of Mexican, Cubans, and Puerto Ricans by race and nativity to
examine the extent of variation by country of origin.
Our descriptive analysis is followed by generalized linear regression analyses. These shed
light on two related issues: the role socioeconomic status and other group characteristics have in
explaining levels of segregation for various Hispanic groups, and whether the effects of these
group characteristics varies by the reference group used in the segregation calculations. That is,
are high levels of, say, Hispanic income, associated with lower levels of segregation between
Hispanics and Anglos (as predicted by assimilation theory), but associated with higher levels of
segregation between Hispanics and African Americans? Since Black median incomes are lower
than Hispanic ones, we might expect Hispanic income and Hispanic-African American
segregation to be positively associated. We discuss the statistical models in more detail below.
Results
Figures 1a, 1b, and 1c present mean dissimilarity scores of Hispanics, by race and
nativity, from native-born: a) Anglos, b) African Americans, and c) Hispanics not of the same
race group, respectively. As described in the previous section, groups that have at least 100,000

17
members in the United States and at least 1,000 in a particular metropolitan area are included in
the calculations. The differences by nativity discussed here and presented in the figures are each
statistically significant at the p<.01 level. Figure 1a indicates that native-born Hispanics are less
segregated from Anglos than the foreign born—consistent with the predictions of spatial
assimilation theory. However, we also see distinct differences in Hispanic-White segregation by
race. White Hispanics are much less segregated from Anglos (0.47) than Black Hispanics (0.74).
The dissimilarity score for other race Hispanics (0.57) falls between the two groups, though
closer to the White Hispanic score. The general rule of thumb is that dissimilarity scores below
0.30 are considered low, and those above 0.60 are high (Massey and Denton 1993). Among all
groups, the foreign-born are more segregated than the native born.
(Figures 1a, 1b, and 1c here).
Figure 1b, where the reference group African Americans, shares some similarities with
Figure 1a. In particular, U.S. born Hispanics of all groups are less segregated from African
Americans than the foreign-born. This reveals a form of assimilation not discussed in the
previous literature on the segregation of Hispanics: we not only see a generational assimilation of
Hispanics with Anglos, but also with African Americans. The generational differences are
actually quite similar for all three racial categories of Hispanics, and levels of segregation from
African Americans does not substantively differ all that that much by race of the Hispanic group.
As has been shown in previous studies, a comparison of Figure 1a with 1b also indicates
that White Hispanics, particularly the native-born, are less segregated from Anglos than African
Americans, but Black Hispanics are considerably less segregated from African Americans than
Anglos. Other-race Hispanics are fairly similarly segregated from both African Americans and
Anglos, though slightly more so from the latter group.
18
Figure 1c indicates that levels of White and other-race Hispanic segregation from native-
born Hispanics of a different race group are all relatively low—in the 0.21 to 0.32 range. For
these groups we once again see a pattern of assimilation—the native-born are less segregated
from other Hispanic race groups than the foreign-born. This suggests yet another form of
assimilation: a growth in pan-Hispanic neighborhoods less divided by race across generations.
Notably, for Black Hispanics we see a bit of a different pattern. U.S.-born Black
Hispanics are actually more segregated from other U.S.-born Hispanic race groups than the
foreign-born, and levels of segregation are on the whole higher as well. This suggests that Black
Hispanics are not becoming residentially more similar to U.S.-born Hispanics of different races.
Whether this suggests a differential selection into self-identifying as “Black” among native-born
Hispanics who feel apart from other Hispanics in the second and higher generations, or truly
different patterns by nativity and phenotype we cannot say with the data available. In any case,
we do see a markedly different pattern among Hispanics who identify their race as Black.
Table 1 shows results that informed Figure 1 as well as provides more detailed
dissimilarity scores for Mexicans, Cubans, and Puerto Ricans.6 Because there are fewer than
100,000 foreign-born Black Mexicans, Black Cubans, or Black Puerto Ricans in the U.S., we
have no data to present for these specific groups. Table 1 shows Puerto Ricans as a whole to be
slightly more segregated from Anglos (0.60) than Mexicans (0.54) or Cubans (0.54), though
Cubans are the most segregated from African Americans.
Despite some general differences in levels of segregation across the three country-of-
origin groups, we see assimilation patterns among the groups that mirror the overall findings for
Hispanics described above. For example, providing support for the spatial assimilation model,

19
foreign-born Mexicans, Cubans, and Puerto Ricans who are White are more segregated from
Anglos than the native-born of those respective groups.
There is, however, one important assimilation-related pattern by country of origin that
differs from the overall Hispanic one. Contrary to the patterns among all White Hispanics and
White Mexicans in particular, White Cubans and Puerto Ricans show a strong pattern of
generational assimilation with Anglos but not with Hispanics not of the same race. In other
words, this indicates that over generations Cubans and Puerto Ricans who self-identify as White
are becoming residentially more similar to Anglos but not to other non-White Hispanics. In
contrast, White and other-race Mexicans are increasingly likely to live with Hispanics of other
races across generations, suggesting a greater importance of Hispanic origin than race among
Mexicans.
While these descriptive segregation statistics are informative, they do not control for
important group characteristics that might help explain these patterns, such as income and
English language ability. Looking at the relationship between race, nativity, and Hispanic
segregation patterns controlling for such characteristics—and examining the effect of these
characteristics themselves on the assimilation process—is the goal of the following multivariate
analysis.
Specification of the statistical model
To estimate the relationship between segregation, race, and nativity, and other factors, we
estimate the following:
jiijiji eZBXBBY +++= 210
where Yji is the dissimilarity score for metropolitan area j and group of interest i, Xji is a vector
of group i characteristics in metropolitan j, and Zj is a vector of metropolitan characteristics for

20
metropolitan area j. As before, the reference groups for the segregation calculations (Yji) are,
alternately, U.S.-born Anglos, U.S.-born African Americans, and U.S.-born Hispanics not of the
same race as the Hispanic group of interest. We run separate models for White Hispanics, Black
Hispanics, and other-race Hispanics, such that that the groups of interest (i) for the dependent
variable in the first set of models are the native and foreign born of each of those groups. Again,
we are testing whether foreign-born White Hispanics, Black Hispanics, and other-race Hispanics
are more segregated from Anglos, African Americans, and Hispanics of a different race than the
native-born of each of those groups, and the degree to which each group’s characteristics explain
these nativity differences.
For example, when examining the segregation patterns of White Hispanics, for each
metropolitan area where there is at least 1,000 group members present there is an observation
indicating the segregation of native-born White Hispanics and foreign-born White Hispanics
from a particular reference group of interest (e.g., Anglos). This yields up to 2 observations per
metropolitan area. We create a dummy variable indicating whether each particular metropolitan-
level segregation score is for foreign-born White Hispanics or native-born White Hispanics to
see among which group segregation from the reference group is higher. Because the same
metropolitan areas are included twice in the models, we produce corrected standard errors by
using Generalized Linear Regression models that account for the correlated error structure
among the independent variables.
The X-vector variables in the regression models that represent group i characteristics in
metropolitan area j include: group size, English language proficiency (percentage who speak
English very well or well), country of origin (Mexican, Cuban, Puerto Rican, or other) median
household income relative to the reference group, and housing tenure (percentage owning

21
homes).7 Z is a vector of metropolitan area characteristics that have been shown to be associated
with segregation (Frey and Farley 1996; Logan, Stults, and Farley 2004; Wilkes and Iceland
2004). This includes metropolitan area size, percentage of the population that is minority,
percentage of the civilian labor force that is in manufacturing and government, percentage of the
labor force that is in the military, percentage of the population that is over 65 years old, the
proportion of the population 18+ that is enrolled in school, percentage of housing units built in
the last 10 years, the percentage of the metropolitan area population in the suburbs, and region.
All of the regression models are unweighted because our aim is to understand the factors
associated with metropolitan-level variation in segregation patterns. Our models do, however,
contain controls for both the size of the group in question (an Xji variable) and the log of the total
metropolitan population size (a Zi variable).
Table 2 shows the unweighted characteristics for various groups. Specifically, it shows
metropolitan area averages for metropolitan areas where there are at least 1,000 individuals of
the relevant group in question. The median household income for Anglos, at $43,964 in the 2000
census, is higher than the African American median ($27,940) and the Hispanic median
($32,934). Among Hispanics, the U.S.-born tend to have higher median incomes than the
foreign-born except among Black Hispanics. Patterns of home ownership is a little more mixed,
though in all cases all groups of Hispanics are disadvantaged in comparison with the Anglo
population. The majority of foreign-born Hispanics speak English well or very well, however the
proportion of Black foreign-born Hispanics is higher than that of their white and other-race
counterparts. Finally, Table 2 also shows that over half of both White and other-race Hispanics
are of Mexican origin with Puerto Ricans and Cubans comprising considerably smaller
proportions. Among Black Hispanics, approximately one-third of the native-born are of Mexican

22
origin and one-third are of Puerto Rican origin, while among the foreign-born, more than one-
fifth are of Mexican origin, close to one-fifth are of Cuban origin, and nearly half are of “other”
origins, predominantly the Caribbean.
(Table 2 here)
The multivariate results are reported in Tables 3, 4, and 5. Table 3 shows results where
Anglos are the reference group in the dissimilarity calculations, Table 4 has African Americans
as the reference group, and Table 5 has Hispanics not of the same race as the reference group.
Results in Model 1, 3, and 5 of Table 3 essentially confirm the bivariate findings from Table 1.
Native-born White, Black, and other-race Hispanics are less segregated from Anglos than the
foreign-born of the respective groups. For example, U.S.-born White Hispanics have segregation
scores that are, on average, 0.171 points lower than foreign-born White Hispanics. Note that the
nativity difference is largest for White Hispanics and smallest for Black Hispanics, suggesting
greater assimilation among the former group with Anglos than the latter group.
(Table 3 here)
Adding group characteristics in models 2, 4, and 6 narrows the difference between
native-born and foreign-born of each race group, and the difference becomes statistically
insignificant among Black Hispanics and other-race Hispanics. This suggests that nativity
differences are explained in part by group characteristics (the nativity coefficients become
insignificant for Black and other-race Hispanics even before metropolitan characteristics are
included in the models, according to results not shown). We see that for all groups, a higher ratio
of group income to that of Anglos is associated with lower levels of segregation, as the spatial
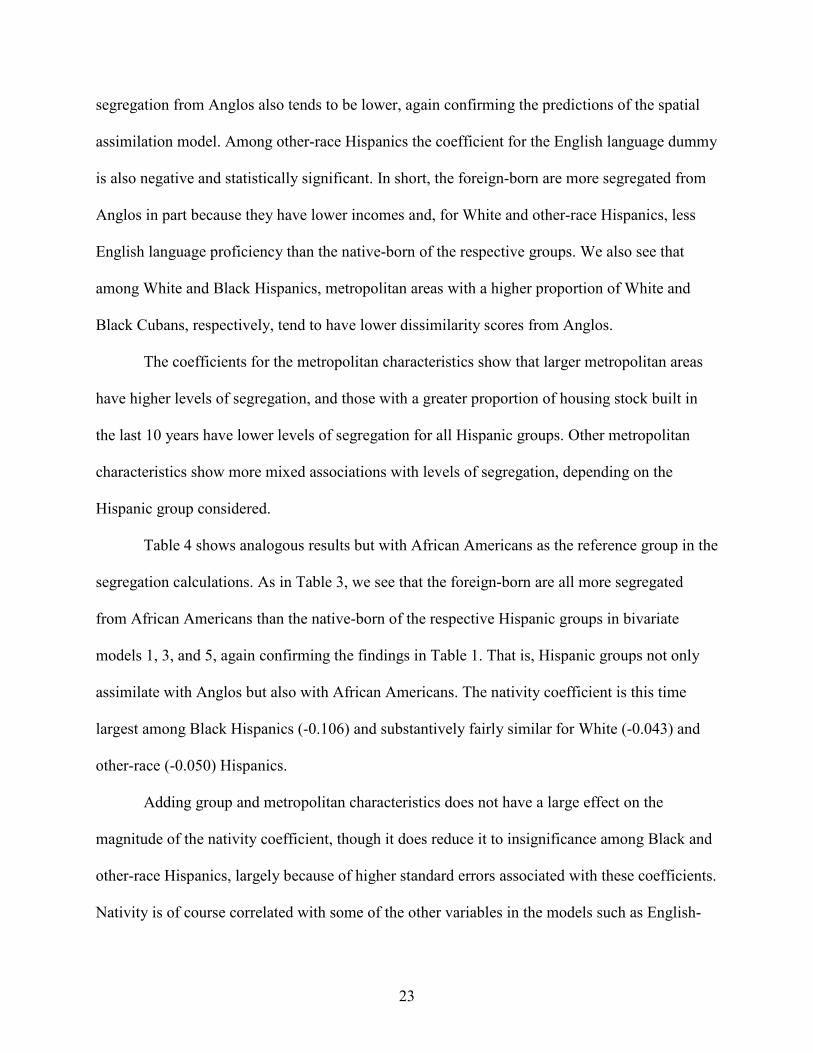
assimilation model would predict. Among White Hispanics, in metropolitan areas where a
greater proportion of White Hispanics own a home and speak English well or very well,
23
segregation from Anglos also tends to be lower, again confirming the predictions of the spatial
assimilation model. Among other-race Hispanics the coefficient for the English language dummy
is also negative and statistically significant. In short, the foreign-born are more segregated from
Anglos in part because they have lower incomes and, for White and other-race Hispanics, less
English language proficiency than the native-born of the respective groups. We also see that
among White and Black Hispanics, metropolitan areas with a higher proportion of White and
Black Cubans, respectively, tend to have lower dissimilarity scores from Anglos.
The coefficients for the metropolitan characteristics show that larger metropolitan areas
have higher levels of segregation, and those with a greater proportion of housing stock built in
the last 10 years have lower levels of segregation for all Hispanic groups. Other metropolitan
characteristics show more mixed associations with levels of segregation, depending on the
Hispanic group considered.
Table 4 shows analogous results but with African Americans as the reference group in the
segregation calculations. As in Table 3, we see that the foreign-born are all more segregated
from African Americans than the native-born of the respective Hispanic groups in bivariate
models 1, 3, and 5, again confirming the findings in Table 1. That is, Hispanic groups not only
assimilate with Anglos but also with African Americans. The nativity coefficient is this time
largest among Black Hispanics (-0.106) and substantively fairly similar for White (-0.043) and
other-race (-0.050) Hispanics.
Adding group and metropolitan characteristics does not have a large effect on the
magnitude of the nativity coefficient, though it does reduce it to insignificance among Black and
other-race Hispanics, largely because of higher standard errors associated with these coefficients.
Nativity is of course correlated with some of the other variables in the models such as English-

24
language ability; in models run without the nativity variable, the association between group
characteristics did not change significantly except in the case of English language ability where
associations became stronger between English language ability and segregation, indicating some
collinearity between English language ability and nativity. Overall, the group characteristics
themselves tend to be statistically insignificant, suggesting that they are not all that helpful in
helping us understand the variation in segregation from African Americans across the
metropolitan areas. The main exception is that among White Hispanics, a higher ratio of group
median income to African American median income is associated with higher segregation. This
is consistent with spatial assimilation in that as shown in Table 2, White Hispanics (both native-
and foreign-born) have higher median incomes than African Americans. Thus, a higher ratio
indicates greater distance from African American median incomes, which in turn is associated
with higher segregation. This coefficient is also positive, but insignificant, for the Black and
other-race Hispanics. Among the metropolitan area controls, we see that segregation from
African Americans is higher in larger metropolitan areas and those in the Midwest for all
Hispanic groups.
(Table 4 here)
Table 5 shows results with native-born Hispanics not of the same race as the reference
group in the dissimilarity score calculations. In other words, White Hispanics are compared to
U.S.-born non-White Hispanics, Black Hispanics are compared to U.S.-born non-Black
Hispanics, and other-race Hispanics are compared to U.S.-born White and Black Hispanics.
Once again confirming results from Table 1, foreign-born White Hispanics and other-race
Hispanics are more segregated from native-born Hispanics of a different race than the native-
born of the respective groups, suggesting a process of spatial assimilation with other Hispanics
25
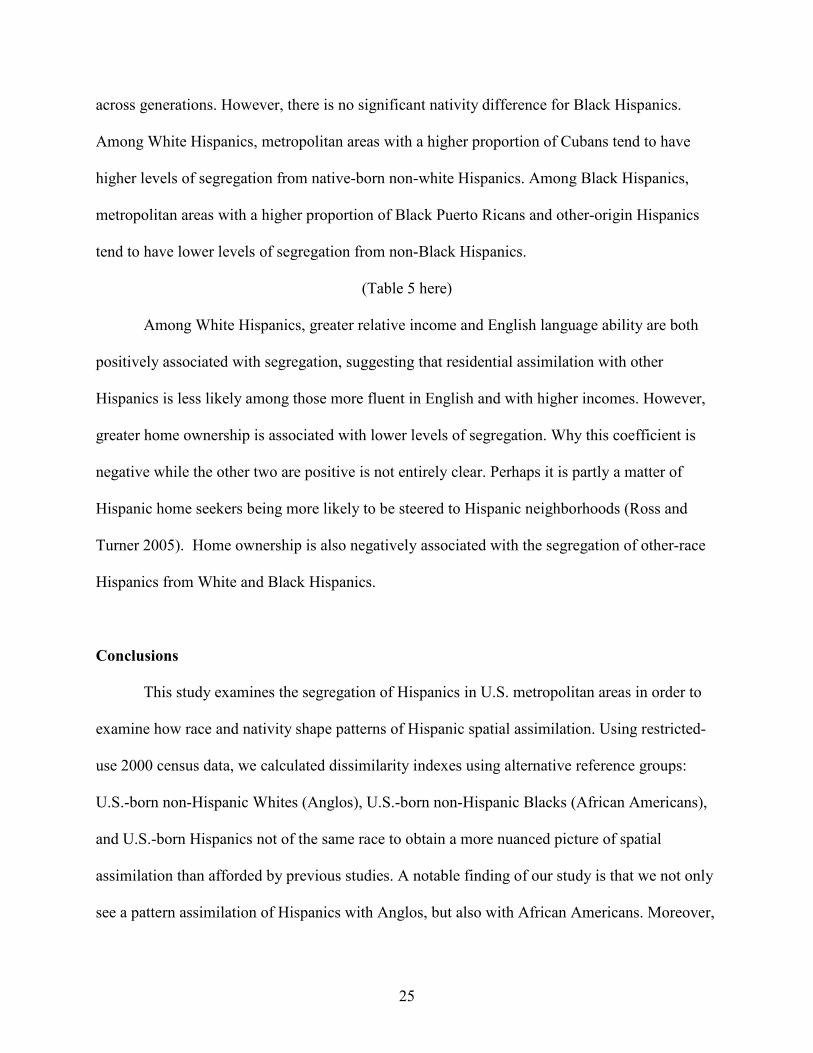
across generations. However, there is no significant nativity difference for Black Hispanics.
Among White Hispanics, metropolitan areas with a higher proportion of Cubans tend to have
higher levels of segregation from native-born non-white Hispanics. Among Black Hispanics,
metropolitan areas with a higher proportion of Black Puerto Ricans and other-origin Hispanics
tend to have lower levels of segregation from non-Black Hispanics.
(Table 5 here)
Among White Hispanics, greater relative income and English language ability are both
positively associated with segregation, suggesting that residential assimilation with other
Hispanics is less likely among those more fluent in English and with higher incomes. However,
greater home ownership is associated with lower levels of segregation. Why this coefficient is
negative while the other two are positive is not entirely clear. Perhaps it is partly a matter of
Hispanic home seekers being more likely to be steered to Hispanic neighborhoods (Ross and
Turner 2005). Home ownership is also negatively associated with the segregation of other-race
Hispanics from White and Black Hispanics.
Conclusions
This study examines the segregation of Hispanics in U.S. metropolitan areas in order to
examine how race and nativity shape patterns of Hispanic spatial assimilation. Using restricted-
use 2000 census data, we calculated dissimilarity indexes using alternative reference groups:
U.S.-born non-Hispanic Whites (Anglos), U.S.-born non-Hispanic Blacks (African Americans),
and U.S.-born Hispanics not of the same race to obtain a more nuanced picture of spatial
assimilation than afforded by previous studies. A notable finding of our study is that we not only
see a pattern assimilation of Hispanics with Anglos, but also with African Americans. Moreover,
26
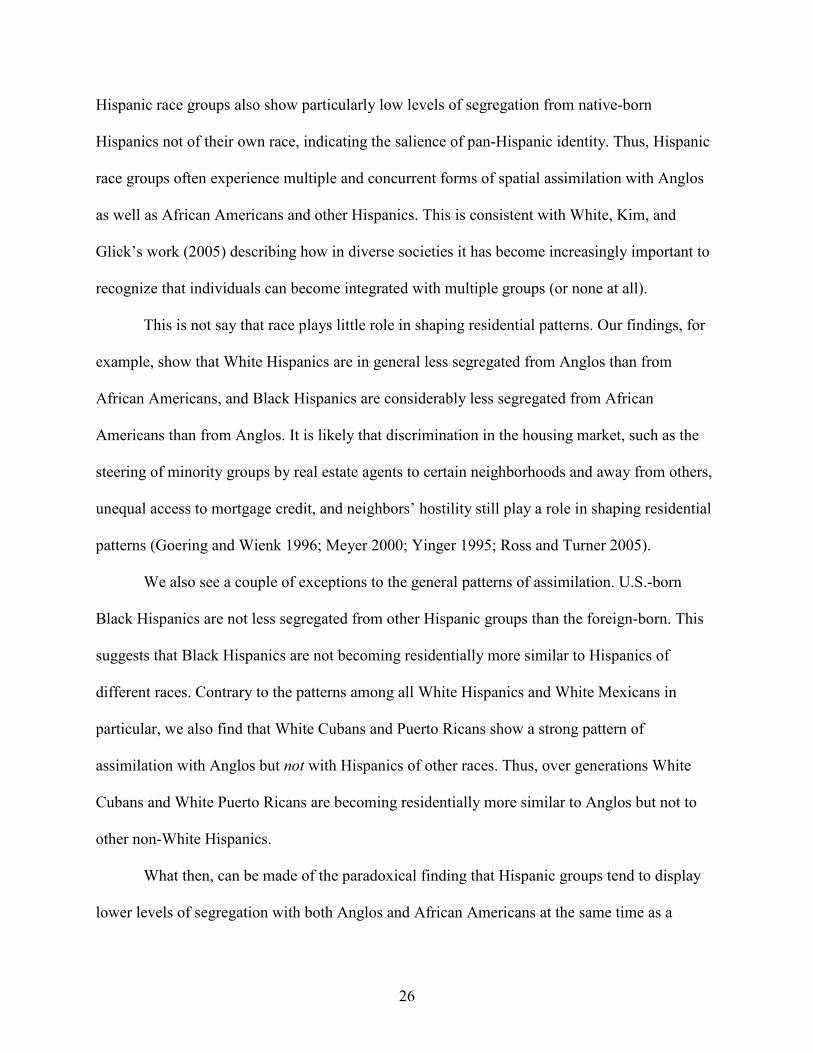
Hispanic race groups also show particularly low levels of segregation from native-born
Hispanics not of their own race, indicating the salience of pan-Hispanic identity. Thus, Hispanic
race groups often experience multiple and concurrent forms of spatial assimilation with Anglos
as well as African Americans and other Hispanics. This is consistent with White, Kim, and
Glick’s work (2005) describing how in diverse societies it has become increasingly important to
recognize that individuals can become integrated with multiple groups (or none at all).
This is not say that race plays little role in shaping residential patterns. Our findings, for
example, show that White Hispanics are in general less segregated from Anglos than from
African Americans, and Black Hispanics are considerably less segregated from African
Americans than from Anglos. It is likely that discrimination in the housing market, such as the
steering of minority groups by real estate agents to certain neighborhoods and away from others,
unequal access to mortgage credit, and neighbors’ hostility still play a role in shaping residential
patterns (Goering and Wienk 1996; Meyer 2000; Yinger 1995; Ross and Turner 2005).
We also see a couple of exceptions to the general patterns of assimilation. U.S.-born
Black Hispanics are not less segregated from other Hispanic groups than the foreign-born. This
suggests that Black Hispanics are not becoming residentially more similar to Hispanics of
different races. Contrary to the patterns among all White Hispanics and White Mexicans in
particular, we also find that White Cubans and Puerto Ricans show a strong pattern of
assimilation with Anglos but not with Hispanics of other races. Thus, over generations White
Cubans and White Puerto Ricans are becoming residentially more similar to Anglos but not to
other non-White Hispanics.
What then, can be made of the paradoxical finding that Hispanic groups tend to display
lower levels of segregation with both Anglos and African Americans at the same time as a
27
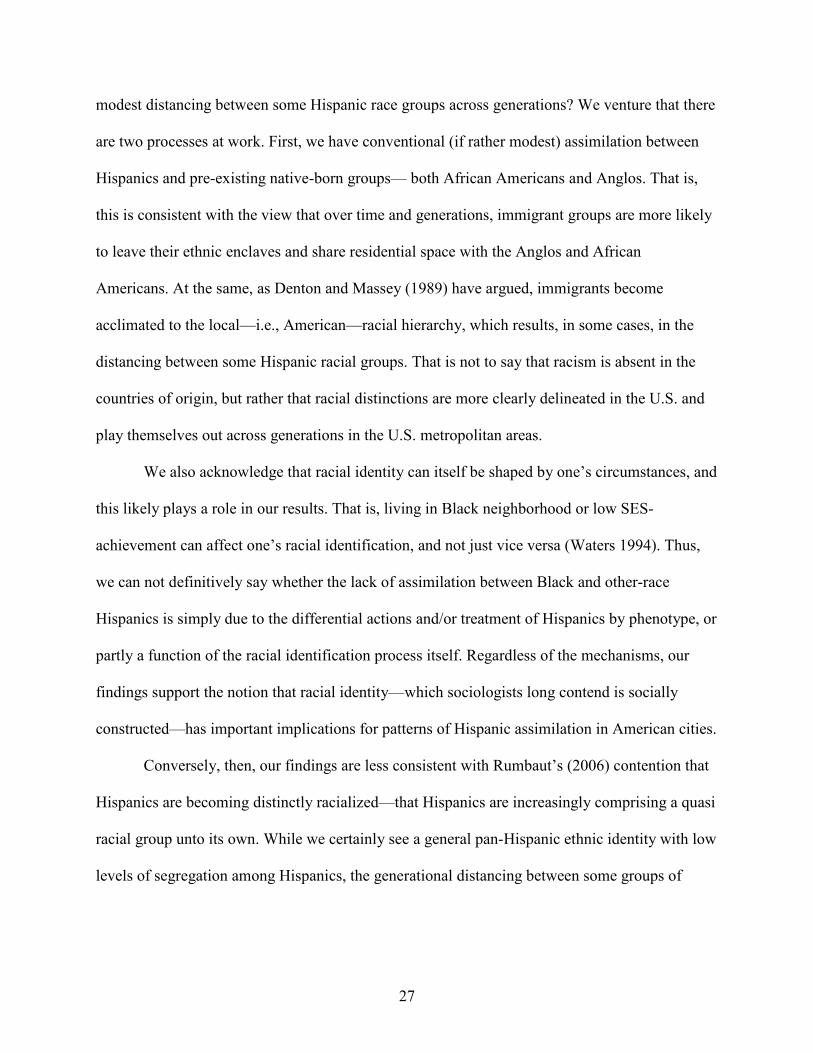
modest distancing between some Hispanic race groups across generations? We venture that there
are two processes at work. First, we have conventional (if rather modest) assimilation between
Hispanics and pre-existing native-born groups— both African Americans and Anglos. That is,
this is consistent with the view that over time and generations, immigrant groups are more likely
to leave their ethnic enclaves and share residential space with the Anglos and African
Americans. At the same, as Denton and Massey (1989) have argued, immigrants become
acclimated to the local—i.e., American—racial hierarchy, which results, in some cases, in the
distancing between some Hispanic racial groups. That is not to say that racism is absent in the
countries of origin, but rather that racial distinctions are more clearly delineated in the U.S. and
play themselves out across generations in the U.S. metropolitan areas.
We also acknowledge that racial identity can itself be shaped by one’s circumstances, and
this likely plays a role in our results. That is, living in Black neighborhood or low SES-
achievement can affect one’s racial identification, and not just vice versa (Waters 1994). Thus,
we can not definitively say whether the lack of assimilation between Black and other-race
Hispanics is simply due to the differential actions and/or treatment of Hispanics by phenotype, or
partly a function of the racial identification process itself. Regardless of the mechanisms, our
findings support the notion that racial identity—which sociologists long contend is socially
constructed—has important implications for patterns of Hispanic assimilation in American cities.
Conversely, then, our findings are less consistent with Rumbaut’s (2006) contention that
Hispanics are becoming distinctly racialized—that Hispanics are increasingly comprising a quasi
racial group unto its own. While we certainly see a general pan-Hispanic ethnic identity with low
levels of segregation among Hispanics, the generational distancing between some groups of

28
Hispanics suggests that traditional racial distinction that are salient in the U.S. more generally are
salient among Hispanics as well.
How these processes will play out over the long run certainly remains in question. We
venture, however, that the multiple forms of assimilation we find will by-and-large reduce the
significance of various color lines in metropolitan America. Both this analysis and other recent
research suggests that immigrant families will tend to live in more integrated environments the
longer that they remain in the U.S.—often as they become more acculturated and gain in
socioeconomic status (Fischer and Tienda 2006; Iceland and Scopilliti 2006; South et al. 2003b).
This is consistent with the view that residential racial and ethnic polarization will likely decline
in the future as majority and minority groups all experience patterns towards a broader
convergence in residential patterns.
Two sets of findings provide reason to be cautious about too firmly drawing this
conclusion. First, despite some declines in African American segregation from others in the
1990s, African Americans and Black Hispanics continued to be highly segregated from Anglos
and other Hispanics. Black-White racial polarization, and the continued—albeit declining—
discrimination against African Americans in the housing market still play a role in shaping
residential patterns (Ross and Turner 2005). Whether the long-run trend of moderate declines in
African American segregation continues and eventually translates into less polarization and
greater integration for Black Hispanics as well will be an important issue to track in the coming
years. It is possible that we could see a hardening of the division between Blacks, including
Blacks Hispanics, and others (Denton and Massey 1989). This would also be consistent with
some research suggesting that Black immigrants develop a shared racial group identity with
29
African Americans over time, though the meaning attached to Black identity often varies
(Benson 2006).
Second, that higher income is associated with lower levels of segregation between all
groups of Hispanics and Anglos in particular has important implications. While it suggests that
spatial assimilation processes are at work that could reduce Hispanic-Anglo segregation over the
longer run, the continued immigration of low-socioeconomic status Hispanics suggests that we
should in fact witness increasing levels of such segregation for Hispanics in the short- (and
medium-) run. Over the long-run, we may see declines in Hispanic-Anglo segregation if second
and third generation Hispanics continue to experience upward mobility (Bean and Stevens 2003).

30
References
Alba, R.D. and J. Logan. 1991. “Variations on Two Themes: Racial and Ethnic Patterns in the
Attainment of Suburban Residence.” Demography 28(3):431-53.
Alba, Richard and Victor Nee. 2003. Remaking the American Mainstream. Cambridge, MA:
Harvard University Press.
Bean, Frank D. and Gillian Stevens. 2003. America’s Newcomers and the Dynamics of Diversity.
New York: Russell Sage Foundation.
Benson, Janel E. 2006. “Exploring the Racial Identities of Black Immigrants in the United
States.” Sociological Forum 21, 2 (June): 219-247.
Bobo, Lawrence and Camille Zubrinsky. 1996. “Attitudes on Residential Integration: Perceived
Status Differences, Mere In-Group Preference, or Racial Prejudice?” Social Forces.
74(3): 883-909.
Castles, Stephen, and Mark J. Miller. 2003. The Age of Migration, 3rd Edition. New York:
Guilford Press.
Charles, Camille Zubrinsky. 2003. “The Dynamics of Racial Residential Segregation.” Annual
Review of Sociology. 29(1): 167-207.
Clark, W.A.V. 1986. “Residential Segregation in American Cities: A Review and
interpretation.” Population Research and Policy Review 5:95-127.
____________. 1988. “Understanding Residential Segregation in American Cities: Interpreting
the Evidence, a Reply to Galster.” Population Research and Policy Review 7:113-21.
Denton, Nancy and Douglas S. Massey. 1988. "Residential Segregation of Blacks, Hispanics,
and Asians by Socioeconomic Status and Generation." Social Science Quarterly. 69: 797-
817.
31
Denton, Nancy and Douglas S. Massey. 1989. “Racial Identity Among Caribbean Hispanics: The
Effect of Double Minority Status on Residential Segregation.” American Sociological
Review. 54 (October): 790-808.
Fischer, Mary J. and Marta Tienda. 2006. “Redrawing Spatial Color Lines: Hispanic
Metropolitan Dispersal, Segregation, and Economic Opportunity” Pp. 100-137 in
Hispanics and the Future of America edited by Marta Tienda and Faith Mitchell.
Washington, DC: The National Academies Press.
Frey, William H. and Reynolds Farley. 1996. "Latino, Asian, and Black Segregation in U.S.
Metropolitan Areas: Are Multiethnic Metros Different?" Demography. 33:35-50.
Frey, W.H. and D. Myers. 2002. “Neighborhood Segregation in Single-Race and Multirace
America: A Census 2000 Study in Cities and Metropolitan Areas.” Fannie Mae
Foundation Working Paper, Washington D.C.
Glaeser, Edward L. and Jacob Vigdor. 2001. “Racial Segregation in the 2000 Census: Promising
News.” Center on Urban and Metropolitan Policy, The Brookings Institution.
http://www.brook.edu/es/urban/census/glaeser.pdf.
Goering, John M. and Ron Wienk (eds.). 1996. Mortgage Lending, Racial Discrimination and
Federal Policy. Washington, DC: Urban Institute Press.
Grieco, Elizabeth, and Rachel C. Cassidy. 2001. Overview of Race and Hispanic Origin: 2000.
Census 2000 Brief # C2KBR/01-1.
Iceland, J., C. Sharpe, and E. Steinmetz. 2005. “Class Differences in African American
Residential Patterns in US Metropolitan Ares: 1990–2000.” Social Science Research
34:252-66.
32
Iceland, J., D.H. Weinberg, and E. Steinmetz. 2002. Racial and Ethnic Residential Segregation
in the United States: 1980-2000. U.S. Census Bureau, Census Special Report, CENSR-3,
Washington, DC: U.S. Government Printing Office.
Iceland, John and Erika Steinmetz. 2003. “The Effects of Using Census Block Groups Instead of
Census Tracts When Examining Residential Housing Patterns.” 2003. U.S. Census
Bureau working paper, July:
http://www.census.gov/hhes/www/housing/resseg/pdf/unit_of_analysis.pdf.
Iceland, John and Rima Wilkes. 2006. “Does Socioeconomic Status Matter? Race, Class, and
Residential Segregation.” Social Problems 52,2:248-273.
Iceland, John and Melissa Scopilliti. 2006. “Immigrant Residential Patterns in U.S. Metropolitan
Areas, 1990-2000.” Population of Association of America presentation, March 30-April
1.
Jones, Nicholas A. and Amy Symens Smith. 2001. “The Two or More Races Population:
2000.” U.S. Census Bureau, Census 2000 Brief, C2KBR/01-6, Washington, DC: U.S.
Government Printing Office.
Landale, Nancy S. and R.S. Oropesa. 2002. “White, Black, or Puerto Rican? Racial Self-
Identification among Mainland and Island Puerto Ricans.” Social Forces, 81(1): 231-254.
Lewis Mumford Center. 2001. “Ethnic Diversity Grows, Neighborhood Integration Lags
Behind.” Report by the Lewis Mumford Center, April 3, 2001 (Revised December 18,
2001).
Logan, John R. 2002. “Hispanic Populations and Their Residential Patterns in the Metropolis.”
Lewis Mumford Center for Comparative Urban and Regional Research.
33
Logan, John R. 2003. “How Race Counts for Hispanic Americans.” Lewis Mumford Center for
Comparative Urban and Regional Research.
Logan, John R., Stults, Brian, and Reynolds. Farley. 2004. “Segregation of Minorities in the
Metropolis: Two Decades of Change.” Demography 41, 1: 1-22.
Massey, D.S. 1985. “Ethnic Residential Segregation: A Theoretical Synthesis and Empirical
Review.” Sociology and Social Research 69:315-50.
Massey, Douglas S. and Brooks Bitterman. 1985. “Explaining the Paradox of Puerto Rican
Segregation.” Social Forces 64:307-331.
Massey, Douglas S. and Nancy A. Denton. 1987. Trends in the Residential Segregation of
Blacks, Hispanics, and Asians: 1970-1980.” American Sociological Review. 52: 802-825.
_________________.1988. “The Dimensions of Residential Segregation” Social Forces 67: 281-
315.
_________________.1993. American Apartheid: Segregation and the Making of the
Underclass. Cambridge: Harvard University Press.
Meyer, Stephen Grant. 2000. As Long As They Don’t Move Next Door: Segregation and Racial
Conflict in American Neighborhoods. Lanham, MD: Rowman and Littlefield.
National Research Council. 2006. Multiple Origins, Uncertain Destinies: Hispanics and the
American Future. Marta Tienda and Faith Mitchell, eds., Washington, DC: The National
Academies Press.
Pascal, A. 1967. The Economics of Housing Segregation. Santa Monica: RAND.
Portes, Alejandro, and Ruben G. Rumbaut. 2001. Legacies: The Story of the Immigrant Second
Generation. Berkeley and New York: University of California Press and Russell Sage
Foundation.

34
____________. 2006. Immigrant America: A Portrait, 3rd Edition. Berkeley, CA: University of
California Press.
Portes, Alejandro and Min Zhou. 1993. “The New Second Generation: Segmented Assimilation
and Its Variants Among Post-1965 Immigrant Youth.” Annals of the American Academy
of Political and Social Science 530 (November): 74-96.
Ross, Stephen L. and Margery Austin Turner. 2005. "Housing Discrimination in Metropolitan
America: Explaining Changes between 1989 and 2000." Social Problems 52, 2: 152-180.
Rumbaut, Ruben G. 2006. “The Making of a People” Pp. 16-66 in Hispanics and the Future of
America edited by Marta Tienda and Faith Mitchell. Washington, DC: The National
Academies Press.
Santiago, Anna. 1992. “Patterns of Puerto Rican Segregation and Mobility.” Hispanic Journal of
Behavioral Sciences 14:107-33.
Singer, Audrey. 2004. The Rise of New Immigrant Gateways. The Brookings Institution Center
on Urban and Metropolitan Policy, The Living Cities Census Series, February.
South, Scott J., Kyle Crowder and Erick Chavez. 2005a. “Migration and Spatial Assimilation
Among U.S. Latinos: Classic Versus Segmented Trajectories.” Demography. 42(3): 497-
521.
South, Scott J., Kyle Crowder and Erick Chavez. 2005b. “Geographic Mobility and Spatial
Assimilation among U.S. Latino Immigrants.” International Migration Review 39,3:577-
607.
Suro, Roberto and Audrey Singer. 2002. “Latino Growth in Metropolitan America: Changing
Patterns, New Locations.” Washington, DC: The Brookings Institution and Pew Hispanic
Center.
35
Turner, Margery A., Stephen L. Ross, George Galster, and John Yinger. 2002. Discrimination in
Metropolitan Housing Markets: National Results from Phase 1 of the Housing
Discrimination Study (HDS). Washington D.C.: U.S. Department of Housing and Urban
Development.
Turner, Margery A. and Stephen L. Ross. 2003. Discrimination in Metropolitan Housing
Markets: Phase 2-- Asians and Pacific Islanders of the HDS 2000. Washington, DC: US
Department of Housing and Urban Development.
U.S. Census Bureau. 2001. “Hispanic or Latino by Specific Origin.” Census 2000 Summary File
1 100-Percent Data. Table PCT11.
Waters, Mary C. 1994. “Ethnic and Racial Identities of Second-Generation Black Immigrants in
New York City.” International Migration Review 28, 4: 795-820.
White, Michael J. 1987. American Neighborhoods and Residential Differentiation. New York:
The Russell Sage Foundation.
White, Michael J., Ann E. Biddlecom, and Shenyang Guo. 1993. “Immigration, Naturalization,
and Residential Assimilation among Asian Americans in 1980.” Social Forces 72, 1: 93-
117.
White, Michael J., Ann H. Him, and Jennifer E. Glick. 2005. “Mapping Social Distance: Ethnic
Residential Segregation in a Multiethnic Metro.” Sociological Methods and Research 34,
2: 173-203.
White, Michael J. and Sharon Sassler. 2000. “Judging Not Only by Color: Ethnicity, Nativity,
and Neighborhood Attainment.” Social Science Quarterly 81, 4: 997-11013.
Wilkes, Rima and John Iceland. 2004. “Hypersegregation in the Twenty-First Century: An
Update and Analysis.” Demography. 41(1): 23-36.
36
Williams, Eric. 1955. “The Contemporary Pattern of Race Relations in the Caribbeans.” Phylon
16:367-79.
Yinger, John. 1995. Closed Doors, Opportunities Lost: The Continuing Costs of Housing
Discrimination. New York: Russell Sage Foundation.
Zhou, Min. 1999. “Segmented Assimilation: Issues, Controversies, and Recent Research on the
New Second Generation.” In The Handbook of International Migration: The American
Experience, edited by Charles Hirschman, Philip Kasinitz, and Josh DeWind. New York:
Russell Sage Foundation.
37
Endnotes
1 In this paper, we use the U.S. government definition of “Hispanic” to denote a person of any race whose origin is
Mexican, Puerto Rican, Cuban, South or Central American, or other Spanish culture (Ramirez 2004). For the
purpose of clarity, we also refer to native-born non-Hispanic Whites as “Anglos” and native-born non-Hispanic
Blacks as “African Americans.”
2 Random factors and geocoding errors are more likely to play a large role in determining the settlement pattern of
group members when fewer members are present, causing these indexes to contain greater volatility (Iceland et al.
2002; Massey and Denton 1988). The 1,000 group population cutoff, while inevitably somewhat arbitrary, is one
chosen by some other studies (Frey and Myers 2002; Glaeser and Vigdor 2001; Iceland and Scopilliti 2006). These
cutoffs were also adopted by agreement with the Census Bureau Disclosure Review Board.
3 Choosing a smaller unit of analysis increases segregation scores because smaller units tend to be more
homogenous. For example, the average metropolitan area dissimilarity score for Blacks was 0.640 when using
census tracts, but moderately higher at 0.669 when using block groups (Iceland and Steinmetz 2003). Census tract
and block-group based scores, however, are very highly correlated (0.99), so it is unlikely that using an alternative
unit would affect conclusions about the relationships studied here.
4 Consistent with the predictions of spatial assimilation, we find that for all groups, the native-born are less
segregated from a given reference group than the foreign born when using the isolation index. The main difference
when using dissimilarity versus isolation is in the overall levels of segregation across different groups. The isolation
index is sensitive to the relative size of the groups in question while the dissimilarity index, as a measure of
evenness, is not. Other factors being equal, the isolation index is higher for larger groups than smaller ones because
it essentially measures, for a typical group member, the average proportion of co-ethnics living in his or her
neighborhood. Indeed, we find that Black Hispanics have lower levels of isolation (but higher levels of dissimilarity)
from other groups than White- and other-race Hispanics. This is likely in large part of function of the fact that Black
Hispanics comprised only 2 percent of all Hispanics in 2000. Results with the isolation index are available upon
request.
5 In order to gauge whether the inclusion of mixed-nativity and/or mixed-race households stemming from young
children (who presumably do not have the option of living elsewhere) residing with parents with different race or
38
nativity characteristics influence segregation scores, we calculated scores and regression analyses omitting all
people under 21 from the calculations (available upon request). The exclusion of those under 21 from the analysis
does not affect the conclusions.
6 Note that Table 1 shows segregation scores for all metropolitan areas where groups meet the population cutoff
criteria, such that there are more metropolitan areas in the “All Hispanic” calculation, for example, than the “Black
Hispanic” one. We ran additional analyses where we used only a constant set of metropolitan areas where all groups
were present in sufficient numbers. In these analyses (available upon request), the patterns were similar to those
shown in Table 1, except that the differences in dissimilarity scores across groups were a little smaller. For example,
in the 31 metropolitan areas where all groups in the top panel of Table 1 were present in sufficient numbers, the
dissimilarity score for all Hispanics was 0.57 (rather than 0.52 shown in Figure 1a) and for White and Other
Hispanics the scores were 0.51 and 0.62, respectively. The scores for these groups tend to be a little higher in the
restricted set of metropolitan areas in part because such metropolitan areas tend to be larger and have higher levels
of segregation more generally.
7 We also ran models with occupation, citizenship, and education variables, but these were highly correlated with
income, English language, and housing tenure. Our findings on the general effects of acculturation and
socioeconomic status variables do not differ much when using alternative model specifications.


Figure 1a. Dissim
ilarity of Hispanics, by Race and Nativity,
from Anglos: 2000
0.52
0.47
0.59
0.47
0.46
0.58
0.57
0.53
0.64
0.74
0.77
0.79
0.0
0
0.1
0
0.2
0
0.3
0
0.4
0
0.5
0
0.6
0
0.7
0
0.8
0
All
His
pani
cs
U.S
.-bor
n
For
eign
-bor
n Whi
te H
ispa
nics
U.S
.-bor
n
F
orei
gn-b
orn
Oth
er ra
ce H
ispa
nics
U.S
.-bor
n
F
orei
gn-b
orn B
lack
His
pani
cs U
.S.-b
orn
F
orei
gn-b
orn
Dissimilarity Score
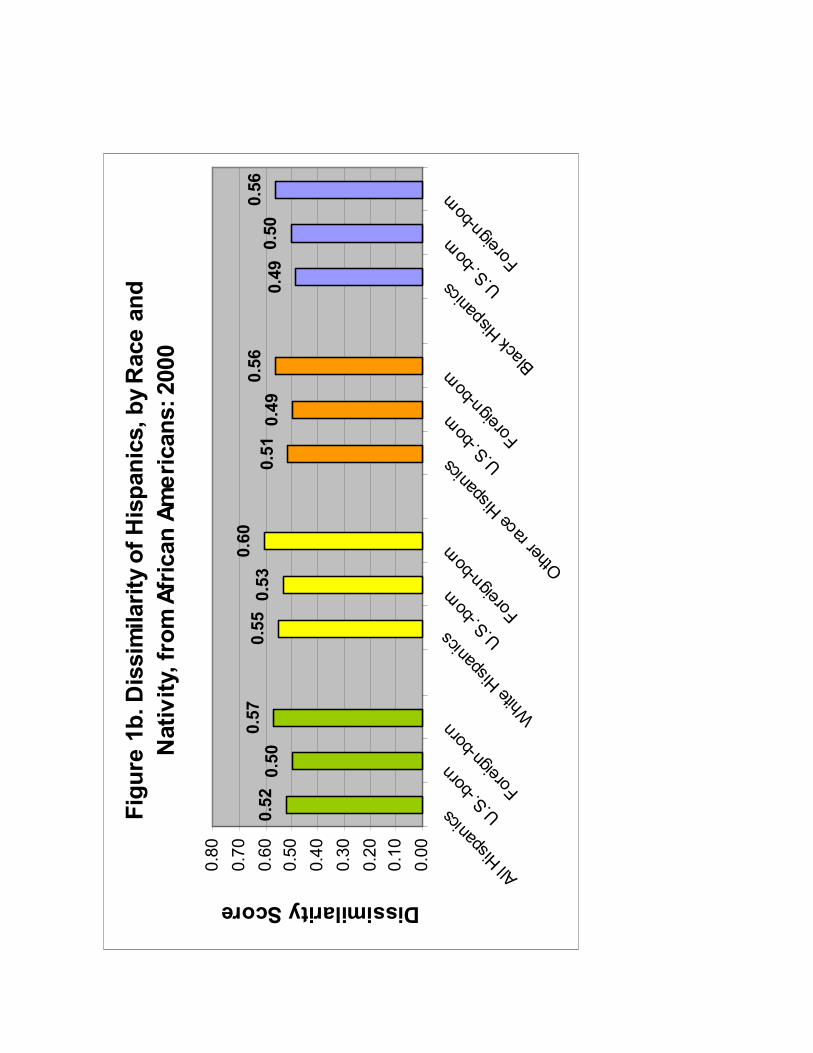
Figure 1b. Dissimilarity of Hispanics, by Race and
Nativity, from African Americans: 2000
0.52
0.50
0.57
0.55
0.53
0.60
0.51
0.49
0.56
0.49
0.50
0.56
0.0
0
0.1
0
0.2
0
0.3
0
0.4
0
0.5
0
0.6
0
0.7
0
0.8
0
All H
ispa
nics
U.S
.-bor
n
For
eign
-bor
n Whi
te H
ispa
nics
U
.S.-b
orn
F
orei
gn-bo
rn
Oth
er ra
ce H
ispa
nics U
.S.-b
orn
F
orei
gn-bo
rn Bla
ck H
ispa
nics
U
.S.-b
orn
F
orei
gn-bo
rn
Dissimilarity Score

Figure 1c. Dissimilarity of Hispanics, by Race and Nativity,
from Native-born Hispanics Not of Same Race: 2000
0.21
0.21
0.28
0.24
0.21
0.32
0.47
0.53
0.49
0.0
0
0.1
0
0.2
0
0.3
0
0.4
0
0.5
0
0.6
0
0.7
0
0.8
0
Whi
te H
ispa
nics
U.S
.-born
F
orei
gn-bo
rn Oth
er ra
ce H
ispa
nics U
.S.-b
orn
For
eign-
born
Bla
ck H
ispa
nics
U.S
.-born
F
orei
gn-bo
rn
Dissimilarity Score
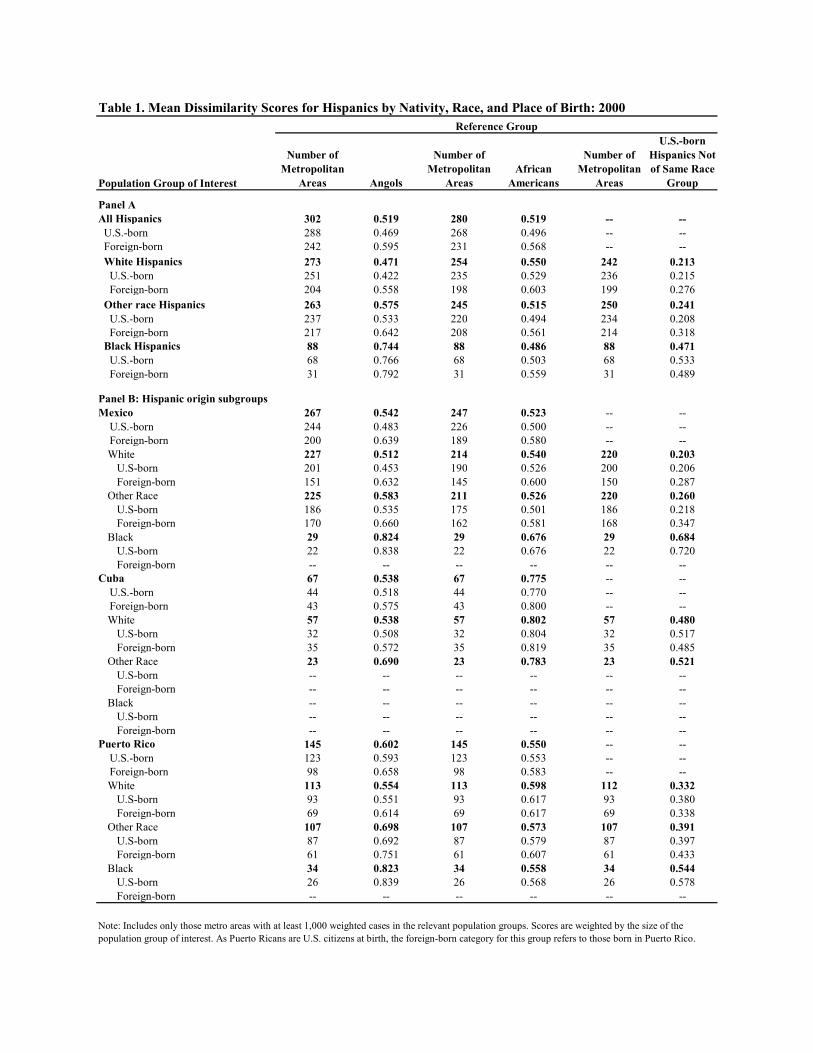
Number of
Metropolitan
Areas Angols
Number of
Metropolitan
Areas
African
Americans
Number of
Metropolitan
Areas
U.S.-born
Hispanics Not
of Same Race
Group
Panel A
All Hispanics 302 0.519 280 0.519 -- --
U.S.-born 288 0.469 268 0.496 -- --
Foreign-born 242 0.595 231 0.568 -- --
White Hispanics 273 0.471 254 0.550 242 0.213
U.S.-born 251 0.422 235 0.529 236 0.215
Foreign-born 204 0.558 198 0.603 199 0.276
Other race Hispanics 263 0.575 245 0.515 250 0.241
U.S.-born 237 0.533 220 0.494 234 0.208
Foreign-born 217 0.642 208 0.561 214 0.318
Black Hispanics 88 0.744 88 0.486 88 0.471
U.S.-born 68 0.766 68 0.503 68 0.533
Foreign-born 31 0.792 31 0.559 31 0.489
Panel B: Hispanic origin subgroups
Mexico 267 0.542 247 0.523 -- --
U.S.-born 244 0.483 226 0.500 -- --
Foreign-born 200 0.639 189 0.580 -- --
White 227 0.512 214 0.540 220 0.203
U.S-born 201 0.453 190 0.526 200 0.206
Foreign-born 151 0.632 145 0.600 150 0.287
Other Race 225 0.583 211 0.526 220 0.260
U.S-born 186 0.535 175 0.501 186 0.218
Foreign-born 170 0.660 162 0.581 168 0.347
Black 29 0.824 29 0.676 29 0.684
U.S-born 22 0.838 22 0.676 22 0.720
Foreign-born -- -- -- -- -- --
Cuba 67 0.538 67 0.775 -- --
U.S.-born 44 0.518 44 0.770 -- --
Foreign-born 43 0.575 43 0.800 -- --
White 57 0.538 57 0.802 57 0.480
U.S-born 32 0.508 32 0.804 32 0.517
Foreign-born 35 0.572 35 0.819 35 0.485
Other Race 23 0.690 23 0.783 23 0.521
U.S-born -- -- -- -- -- --
Foreign-born -- -- -- -- -- --
Black -- -- -- -- -- --
U.S-born -- -- -- -- -- --
Foreign-born -- -- -- -- -- --
Puerto Rico 145 0.602 145 0.550 -- --
U.S.-born 123 0.593 123 0.553 -- --
Foreign-born 98 0.658 98 0.583 -- --
White 113 0.554 113 0.598 112 0.332
U.S-born 93 0.551 93 0.617 93 0.380
Foreign-born 69 0.614 69 0.617 69 0.338
Other Race 107 0.698 107 0.573 107 0.391
U.S-born 87 0.692 87 0.579 87 0.397
Foreign-born 61 0.751 61 0.607 61 0.433
Black 34 0.823 34 0.558 34 0.544
U.S-born 26 0.839 26 0.568 26 0.578
Foreign-born -- -- -- -- -- --
Population Group of Interest
Table 1. Mean Dissimilarity Scores for Hispanics by Nativity, Race, and Place of Birth: 2000
Reference Group
Note: Includes only those metro areas with at least 1,000 weighted cases in the relevant population groups. Scores are weighted by the size of the
population group of interest. As Puerto Ricans are U.S. citizens at birth, the foreign-born category for this group refers to those born in Puerto Rico.
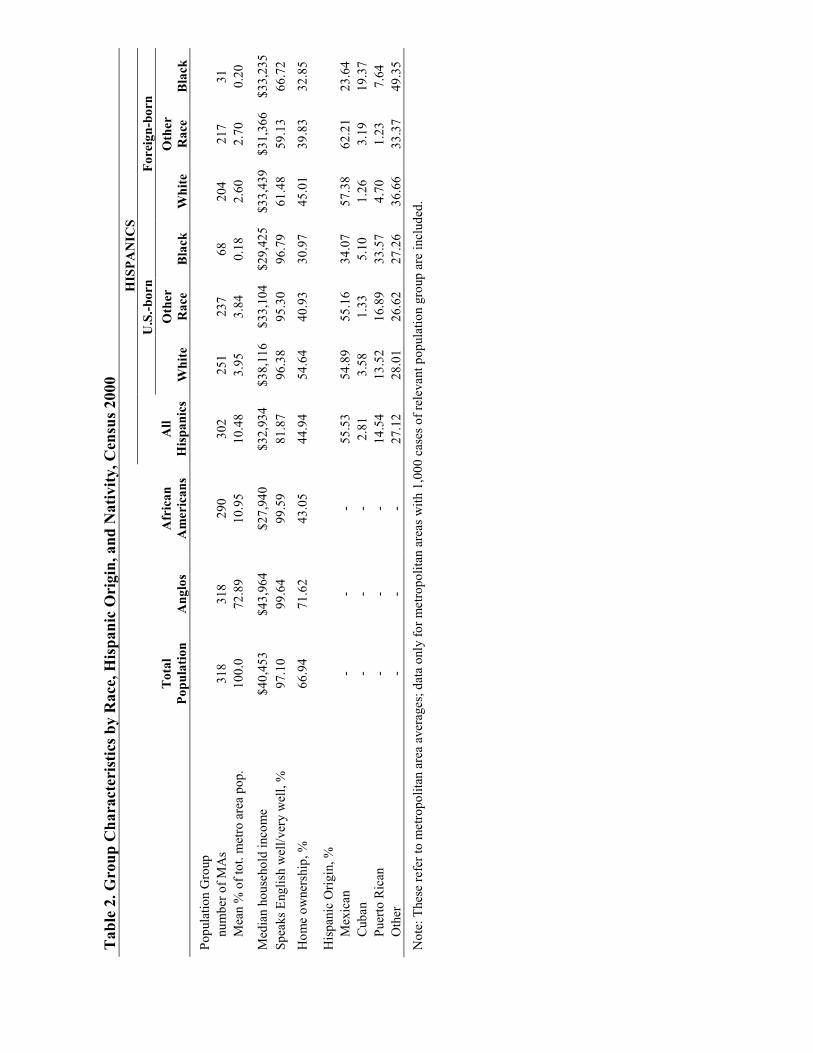
Table 2. Group Characteristics by Race, Hispanic Origin, and Nativity, Census 2000
HISPANICS
U.S.-born
Foreign-born
Total
Population
Anglos
African
Americans
All
Hispanics White
Other
Race
Black
White
Other
Race
Black
Popula
tion G
roup
num
ber
of M
As
318
318
290
302
251
237
68
204
217
31
Mea
n %
of to
t. m
etro
are
a pop.
100.0
72.8
9
10.9
5
10.4
8
3.9
5
3.8
4
0.1
8
2.6
0
2.7
0
0.2
0
Med
ian h
ouse
hold
inco
me
$40,4
53
$43,9
64
$27,9
40
$32,9
34
$38,1
16
$33,1
04
$29,4
25
$33,4
39
$31,3
66
$33,2
35
Spea
ks English
wel
l/ver
y w
ell, %
97.1
0
99.6
4
99.5
9
81.8
7
96.3
8
95.3
0
96.7
9
61.4
8
59.1
3
66.7
2
Hom
e ow
ner
ship
, %
66.9
4
71.6
2
43.0
5
44.9
4
54.6
4
40.9
3
30.9
7
45.0
1
39.8
3
32.8
5
Hispan
ic O
rigin
, %
Mex
ican
-
- -
55.5
3
54.8
9
55.1
6
34.0
7
57.3
8
62.2
1
23.6
4
Cuban
-
- -
2.8
1
3.5
8
1.3
3
5.1
0
1.2
6
3.1
9
19.3
7
Puer
to R
ican
-
- -
14.5
4
13.5
2
16.8
9
33.5
7
4.7
0
1.2
3
7.6
4
Oth
er
- -
- 27.1
2
28.0
1
26.6
2
27.2
6
36.6
6
33.3
7
49.3
5
Note
: Thes
e re
fer to
met
ropolita
n a
rea
aver
ages
; dat
a only
for m
etro
polita
n a
reas
with 1
,000 c
ases
of re
levan
t popula
tion g
roup a
re incl
uded
.

coef
.st
d. er
r.co
ef.
std. er
r.co
ef.
std. er
r.co
ef.
std. er
r.co
ef.
std. er
r.co
ef.
std. er
r.
Inte
rcep
t0.5
31
**
0.0
07
0.4
70
**
0.0
95
0.8
03
**
0.0
16
0.7
68
**
0.1
98
0.5
75
**
0.0
07
0.3
51
**
0.1
16
Nat
ivity
Nat
ive
born
-0.1
71
**
0.0
06
-0.0
96
**
0.0
22
-0.0
54
**
0.0
14
-0.0
68
*0.0
29
-0.1
11
**
0.0
05
0.0
03
0.0
21
Fore
ign b
orn
(om
itte
d)
Oth
er g
roup-s
pec
ific
char
acte
rist
ics
Hispan
ic g
roup/A
nglo
rat
io o
f m
edia
n
house
hold
inco
me
-0.0
97
*0.0
40
-0.1
11
**
0.0
41
-0.1
29
**
0.0
43
% spea
kin
g E
nglish
ver
y w
ell/w
ell
-0.1
35
*0.0
64
0.0
20
0.0
93
-0.2
93
**
0.0
59
% o
wnin
g a
hom
e-0
.127
**
0.0
39
-0.0
27
0.0
57
-0.0
26
0.0
39
Country o
f origin
Mex
ican
(om
itte
d)
Cuban
-0.2
34
**
0.0
66
-0.3
29
**
0.0
93
-0.2
66
0.1
88
Puer
to R
ican
0.0
22
0.0
41
-0.1
44
**
0.0
38
0.0
76
0.0
39
All o
ther
origin
s-0
.047
0.0
41
-0.1
04
**
0.0
38
-0.0
52
0.0
33
Gro
up siz
e (1
0,0
00s)
0.0
00
0.0
01
0.0
00
0.0
06
0.0
00
0.0
00
Met
ropolita
n a
rea
char
acte
rist
ics
Log o
f to
tal popula
tion
0.0
22
**
0.0
05
0.0
38
**
0.0
10
0.0
37
**
0.0
06
% m
inority
0.0
58
0.0
34
-0.2
61
**
0.0
62
0.0
08
0.0
36
% in m
anufa
cturing
0.1
02
0.0
80
0.2
07
0.1
32
0.0
42
0.0
89
% in g
over
nm
ent
-0.2
27
0.1
46
0.0
13
0.1
95
-0.1
26
0.1
55
% in m
ilitar
y-0
.173
0.1
72
-0.7
05
0.3
88
-0.0
64
0.2
17
% o
ver
65 y
ears
old
0.0
88
0.1
30
-0.1
89
0.2
11
0.3
18
0.1
87
% o
f popula
tion e
nro
lled
in c
olleg
e-0
.031
0.1
30
-1.2
61
**
0.4
49
-0.0
12
0.1
38
% o
f housing u
nits built in
las
t 10 y
rs-0
.186
**
0.0
71
-0.3
82
**
0.1
36
-0.2
71
**
0.0
83
% o
f popula
tion in suburb
s -0
.012
0.0
25
-0.0
34
0.0
33
-0.0
12
0.0
28
Reg
ion
Wes
t (o
mitte
d)
Northea
st0.0
73
**
0.0
24
-0.0
10
0.0
26
0.0
92
**
0.0
26
Mid
wes
t0.0
61
**
0.0
12
-0.0
06
0.0
21
0.0
67
**
0.0
13
South
0.0
46
**
0.0
12
-0.0
01
0.0
16
0.0
45
**
0.0
13
Log L
ikel
ihood
DF
174.2
04
78
372.9
43
452
Model
4
450.3
10
Table 3. Generalized Linear Regressions with Levels of Dissimilarity of Hispanics, by Race, from Anglos: 2000
453
610.8
27
434
109.5
93
97
580.5
63
433
**p<0.0
1 *p
<0.0
5
Model
5
Note
s: T
he
unit o
f an
alysi
s is
the
segre
gat
ion sco
re for a
par
ticu
lar gro
up in a
giv
en m
etro
polita
n a
rea.
Incl
udes
met
ropolita
n a
reas
with a
t le
ast 1,0
00 m
ember
s of th
e gro
up in q
ues
tion.
Oth
er-rac
e H
ispan
ics
Model
6M
odel
1M
odel
2
White
Hispan
ics
Bla
ck H
ispan
ics
Model
3
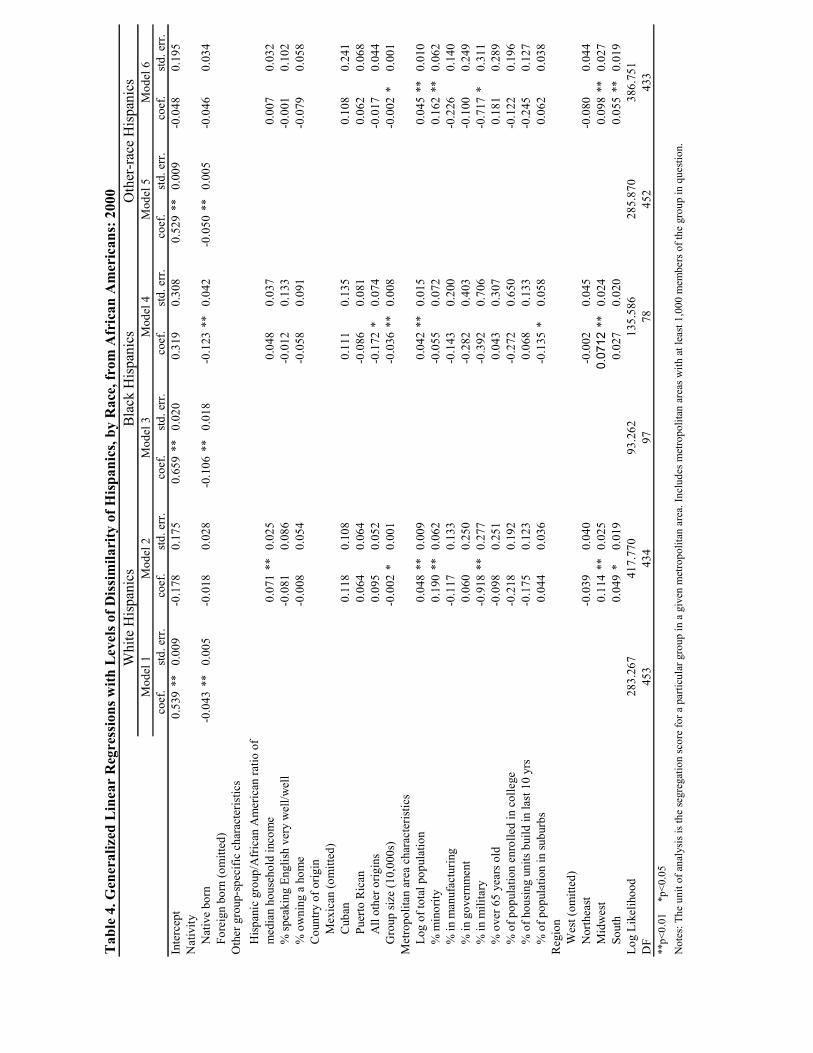
coef
.std. er
r.co
ef.
std. er
r.co
ef.
std. er
r.co
ef.
std. er
r.co
ef.
std. er
r.co
ef.
std. er
r.
Inte
rcep
t0.5
39
**
0.0
09
-0.1
78
0.1
75
0.6
59
**
0.0
20
0.3
19
0.3
08
0.5
29
**
0.0
09
-0.0
48
0.1
95
Nat
ivity
Nat
ive
born
-0.0
43
**
0.0
05
-0.0
18
0.0
28
-0.1
06
**
0.0
18
-0.1
23
**
0.0
42
-0.0
50
**
0.0
05
-0.0
46
0.0
34
Fore
ign b
orn
(om
itte
d)
Oth
er g
roup-s
pec
ific
char
acte
rist
ics
Hispan
ic g
roup/A
fric
an A
mer
ican
rat
io o
f
med
ian h
ouse
hold
inco
me
0.0
71
**
0.0
25
0.0
48
0.0
37
0.0
07
0.0
32
% spea
kin
g E
nglish
ver
y w
ell/w
ell
-0.0
81
0.0
86
-0.0
12
0.1
33
-0.0
01
0.1
02
% o
wnin
g a
hom
e-0
.008
0.0
54
-0.0
58
0.0
91
-0.0
79
0.0
58
Country o
f origin
Mex
ican
(om
itte
d)
Cuban
0.1
18
0.1
08
0.1
11
0.1
35
0.1
08
0.2
41
Puer
to R
ican
0.0
64
0.0
64
-0.0
86
0.0
81
0.0
62
0.0
68
All o
ther
origin
s0.0
95
0.0
52
-0.1
72
*0.0
74
-0.0
17
0.0
44
Gro
up siz
e (1
0,0
00s)
-0.0
02
*0.0
01
-0.0
36
**
0.0
08
-0.0
02
*0.0
01
Met
ropolita
n a
rea
char
acte
ristic
s
Log o
f to
tal popula
tion
0.0
48
**
0.0
09
0.0
42
**
0.0
15
0.0
45
**
0.0
10
% m
inority
0.1
90
**
0.0
62
-0.0
55
0.0
72
0.1
62
**
0.0
62
% in m
anufa
cturing
-0.1
17
0.1
33
-0.1
43
0.2
00
-0.2
26
0.1
40
% in g
over
nm
ent
0.0
60
0.2
50
-0.2
82
0.4
03
-0.1
00
0.2
49
% in m
ilitar
y-0
.918
**
0.2
77
-0.3
92
0.7
06
-0.7
17
*0.3
11
% o
ver
65 y
ears
old
-0.0
98
0.2
51
0.0
43
0.3
07
0.1
81
0.2
89
% o
f popula
tion e
nro
lled
in c
olleg
e-0
.218
0.1
92
-0.2
72
0.6
50
-0.1
22
0.1
96
% o
f housing u
nits build in las
t 10 y
rs-0
.175
0.1
23
0.0
68
0.1
33
-0.2
45
0.1
27
% o
f popula
tion in suburb
s 0.0
44
0.0
36
-0.1
35
*0.0
58
0.0
62
0.0
38
Reg
ion
Wes
t (o
mitte
d)
Northea
st-0
.039
0.0
40
-0.0
02
0.0
45
-0.0
80
0.0
44
Mid
wes
t0.1
14
**
0.0
25
0.0
71
2**
0.0
24
0.0
98
**
0.0
27
South
0.0
49
*0.0
19
0.0
27
0.0
20
0.0
55
**
0.0
19
Log L
ikel
ihood
DF
285.8
70
452
386.7
51
433
Model
5M
odel
6
283.2
67
453
417.7
70
434
93.2
62
97
135.5
86
78
Table 4. Generalized Linear Regressions with Levels of Dissimilarity of Hispanics, by Race, from African Americans: 2000
**p<0.0
1 *p
<0.0
5
Note
s: T
he
unit o
f an
alysi
s is
the
segre
gat
ion sco
re for a
par
ticu
lar gro
up in a
giv
en m
etro
polita
n a
rea.
Incl
udes
met
ropolita
n a
reas
with a
t le
ast 1,0
00 m
ember
s of th
e gro
up in q
ues
tion.
White
Hispan
ics
Bla
ck H
ispan
ics
Oth
er-rac
e H
ispan
ics
Model
1M
odel
2M
odel
3M
odel
4

coef
.std. er
r.co
ef.
std. er
r.co
ef.
std. er
r.co
ef.
std. er
r.co
ef.
std. er
r.co
ef.
std. er
r.
Inte
rcep
t0.3
52
**
0.0
09
-0.2
72
*0.1
36
0.5
98
**
0.0
24
0.5
60
*0.2
35
0.3
88
**
0.0
08
0.0
07
0.1
51
Nat
ivity
Nat
ive
born
-0.0
37
**
0.0
07
-0.1
38
**
0.0
31
0.0
01
0.0
21
-0.0
61
0.0
44
-0.0
88
**
0.0
05
-0.1
22
**
0.0
32
Fore
ign b
orn
(om
itte
d)
Oth
er g
roup-s
pec
ific
char
acte
ristic
s
Hispan
ic g
roup/n
ativ
e-born
Hispan
ics not
of sa
me
race
rat
io o
f m
edia
n h
ouse
hold
inco
me
0.1
22
**
0.0
25
-0.0
35
0.0
49
0.0
49
0.0
41
% spea
kin
g E
nglish
ver
y w
ell/w
ell
0.2
90
**
0.1
00
0.1
57
0.1
37
0.1
00
0.0
95
% o
wnin
g a
hom
e-0
.228
**
0.0
66
-0.0
07
0.0
55
-0.3
04
**
0.0
45
Country o
f origin
Mex
ican
(om
itte
d)
Cuban
0.1
74
**
0.1
15
-0.1
14
0.1
25
-0.0
26
0.1
92
Puer
to R
ican
-0.1
06
0.0
64
-0.3
07
**
0.0
75
0.0
01
0.0
67
All o
ther
origin
s0.0
98
0.0
53
-0.2
23
**
0.0
66
-0.0
20
0.0
41
Gro
up siz
e (1
0,0
00s)
-0.0
02
*0.0
01
-0.0
25
**
0.0
06
0.1
00
0.0
01
Met
ropolita
n a
rea
char
acte
ristic
s
Log o
f to
tal popula
tion
0.0
26
**
0.0
07
0.0
43
**
0.0
12
0.0
32
**
0.0
08
% m
inority
-0.1
68
**
0.0
57
-0.2
66
**
0.0
71
-0.2
25
**
0.0
40
% in m
anufa
cturing
0.2
33
*0.1
06
0.0
28
0.2
02
0.0
73
0.1
22
% in g
over
nm
ent
0.5
49
**
0.1
91
0.0
63
0.3
04
0.7
04
**
0.1
87
% in m
ilitar
y-0
.817
**
0.2
33
-0.5
41
0.6
68
-1.1
84
**
0.2
23
% o
ver
65 y
ears
old
0.0
46
0.2
15
-0.2
05
0.3
11
-0.1
23
0.2
11
% o
f popula
tion e
nro
lled
in c
olleg
e-0
.463
**
0.1
56
-1.6
51
**
0.5
86
-0.5
03
**
0.1
59
% o
f housing u
nits build in las
t 10 y
rs0.0
28
0.0
69
-0.4
05
*0.1
63
-0.1
74
**
0.0
67
% o
f popula
tion in suburb
s 0.0
37
0.0
27
-0.0
88
*0.0
39
0.0
56
*0.0
28
Reg
ion
Wes
t (o
mitte
d)
Northea
st0.0
14
0.0
38
-0.0
59
0.0
38
-0.0
30
0.0
40
Mid
wes
t0.0
83
**
0.0
14
0.0
24
0.0
30
0.0
81
**
0.0
13
South
0.0
73
**
0.0
14
0.0
37
0.0
22
0.0
74
**
0.0
14
Log L
ikel
ihood
DF
498.4
75
433
138.2
23
78
334.5
59
452
467.9
30
434
76.3
95
97
Model
5M
odel
6
Note
s: T
he
unit o
f an
alysi
s is the
segre
gat
ion sco
re for a
par
ticu
lar gro
up in a
giv
en m
etro
polita
n a
rea.
Incl
udes
met
ropolita
n a
reas
with a
t le
ast 1,0
00 m
ember
s of th
e gro
up in q
ues
tion.
**p<0.0
1 *p
<0.0
5
Model
1M
odel
2M
odel
3M
odel
4
295.6
70
453
Table 5. Generalized Linear Regressions with Levels of Dissimilarity of Hispanics, by Race, from Native-Born Hispanics Not of Same Race: 2000
White
His
pan
ics
Bla
ck H
ispan
ics
Oth
er-rac
e H
ispan
ics