
His Majesty Sultan Qaboos bin Said - Taageer Report-2015-English.pdf · 2018-05-11 · to express...
73
Transcript of His Majesty Sultan Qaboos bin Said - Taageer Report-2015-English.pdf · 2018-05-11 · to express...


His Majesty Sultan Qaboos bin SaidOur nation’s prime mover for development


Mission & Vision
Company Information
Board of Directors
Committees
Management
Director’s Report
Management Report
Auditors Report on Corporate Governance
Corporate Governance
Auditor’s Report
Statement of Financial Position
Statement of Comprehensive Income
Statement of Changes in Equity
Statement of Cash Flows
Notes to the Financial Statements
4
5
7
8
9
10
13
16
17
25
27
28
29
30
32
Table of
Contents

ANNUAL REPORT 20154
MISSION
“To play an instrumental role in the
development of the Corporate and SME
sector while cultivating entrepreneurship
culture in society”
VISION
“To be a leading finance
company in the region”

ANNUAL REPORT 2015 5
COMpaNy INfOrMaTION
SCOpE Of aCTIVITIESAuto Finance for passenger cars,
commercial vehicles (prime movers,
trucks, trailers, pickups, etc.) Industrial
equipment and machinery, Home
appliances, furniture, computer and other
electronic items, Heavy equipment, plant
and machinery (dozers, shovels, crushers,
cranes, etc.), Working capital through debt
factoring / bills discounting of receivables
Corporate deposits, “Al Amthal” Auto
Finance, “Al Hal” consumer loans, “Al
Sahal” insurance.
BaNkErSBank Muscat (SAOG)
Bank Dhofar (SAOG)
National Bank of Oman (SAOG)
Oman Arab Bank (SAOC)
Ahli Bank (SAOG)
Bank Sohar (SAOG)
Habib Bank Ltd
Qatar National Bank (Oman)
rEGULaTOry aUTHOrITyCentral Bank of Oman
Capital Market Authority
STaTUTOry aUDITOrSPrice Waterhouse Coopers LLC
INTErNaL aUDITOrS (OUT-SOUrCED)Moore Stephens LLC
LEGaL aDVISOrSRajab Al Khathiri & Associates
rEGISTErED OffICEP.O. Box 200, Postal Code 112, MGM,
Sultanate of Oman
HEaD OffICE - aL kHUWaIrTel : (+968) 24839800, 24839999
Fax : (+968) 24488592
[email protected], www.taageer.com
BraNCH OffICE : AL KHUWAIR:
Tel : (+968) 24839800
Fax : (+968) 24488592
HATAT COMPLEX:
Tel : (+968) 24564561
Fax : (+968) 24564629
SOHAR BRANCH:
Tel : (+968) 26845595
Fax : (+968) 26845535
BARKA BRANCH:
Tel : (+968) 26883603
Fax : (+968) 26883619
NIZWA BRANCH:
Tel : (+968) 25414420
Fax : (+968) 25414425
SALALAH BRANCH:
Tel : (+968) 23296288
Fax : (+968) 23296955


ANNUAL REPORT 2015 7
BOarD Of DIrECTOrS
faisal khamis al HasharChairman
anwar Hilal al JabriDirector
Hussain Mohamed redhaDirector
Saleh Nasser al riyamiDirector
ali ZiraknejadDirector
Engr. fahad Musaed al ahmadiVice Chairman
Mansoor Hamood al amriDirector
khalid Mohamed al HamoodahDirector

ANNUAL REPORT 20158
aUDIT COMMITEE
Saleh Nasser al riyami
Chairman
Mansoor Hamood al amri
Member
khalid Mohamed al Hamoodah
Member
EXECUTIVE COMMITEE
anwar Hilal al Jabri
Chairman
Eng. fahad Musaed al ahmadi
Member
ali ZiraknejadMember
Hussain Mohamed redha
Member
ANNUAL REPORT 2015 9
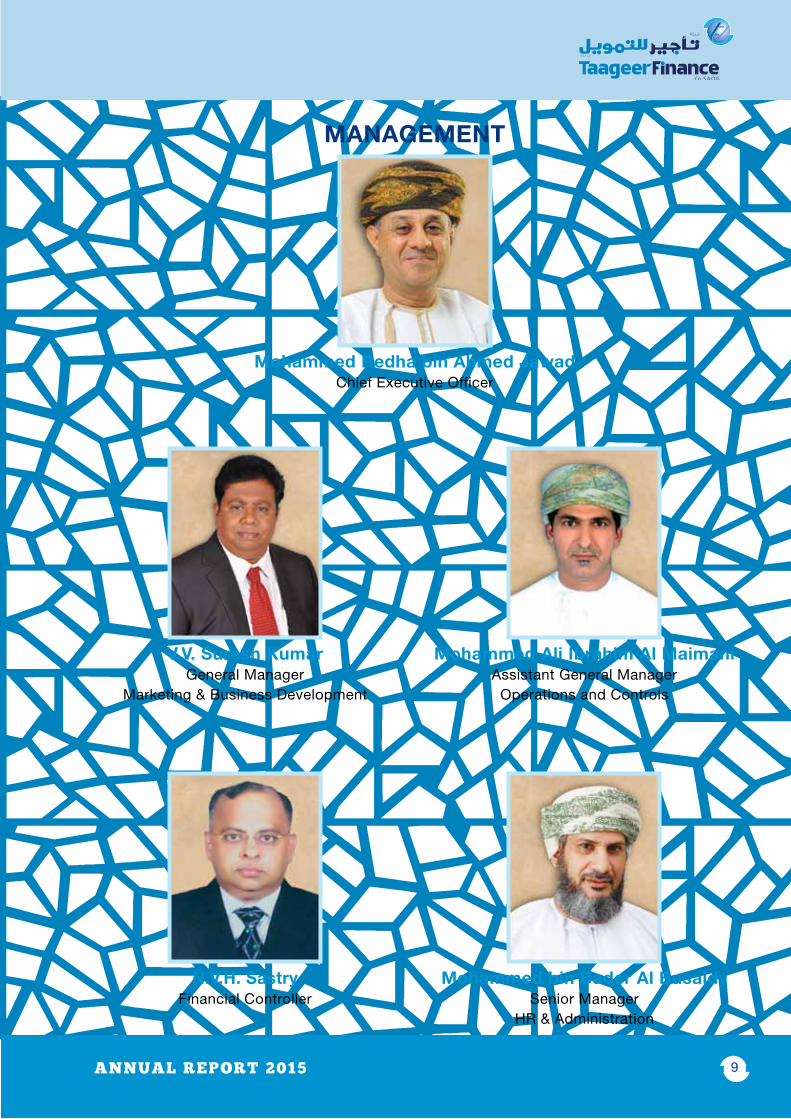
MaNaGEMENT
Mohammed redha bin ahmed JawadChief Executive Officer
V.V. Suresh kumarGeneral Manager
Marketing & Business Development
N.V.H. SastryFinancial Controller
Mohammed ali Ibrahim al MaimaniAssistant General Manager
Operations and Controls
Mohammed bin Bader al BusaidySenior Manager
HR & Administration

ANNUAL REPORT 201510
Dear Shareholders,
On behalf of the Board of Directors of Taageer Finance Company SAOG, I am pleased to present our audited financial statements for the year ended 31st December, 2015.
Company’s performance of 2015
Your Company has registered a Profit after Tax of RO 4.421 million in 2015 as against RO 3.883 Million in 2014. The Company’s net leasing portfolio has grown by 18.03% from RO 107.306 million at 31st December 2014 to RO 126.656 Million at 31st December, 2015. This growth in our portfolio is a direct result of the increased business during the year which had led to a triple fold growth rate as compared to a growth of 5.18% during the previous year. Your company has achieved a return on shareholders’ funds of 12.88% for 2015 as against 11.97% in 2014. You can see a detailed review of the operational results for the Company in the Management Discussion and Analysis Report attached.
Outlook for 2016
Declining Oil prices at the start of the year 2015 caused some concerns but the proactive control measures adopted by the Government have gone a long way to
alleviate these. Some of the steps initiated by the Government include the management of state spending, the reduction of subsidies, an increase in taxation etc. The Government’s five-year economic plan seeks to diversify the Omani economy, targeting sectors such as manufacturing, mining, transport and tourism, and to attract a notable part of the required investments from the private sector.
While the experts believe that the Oil Prices are expected to increase gradually towards the end of year 2016, the Government with its strong vision has already initiated positive steps coupled with private consumption and investments, to boost the economy. The prospects for the leasing and finance industry appears to be good. The experts foresee the GDP increasing at a broadly steady pace of 2.5%.
The competition among finance and leasing companies (FLCs), continued to be intense during the year 2015 and the same trend is expected to continue during the year 2016 as well. Banks have resorted to increasing their lending rates with an expectation of liquidity pressures in the economy. The short-term lending rates by banks have been increasing steadily which has put pressure on borrowing cost for FLCs and poses a
DIrECTOrS’ rEpOrT

ANNUAL REPORT 2015 11
challenge to the business. Due to the overall tightening of liquidity, the Industry could face some more challenges in collection which may result in an increase in NPAs. However, the management team are closely monitoring the situation and will initiate corrective action if necessary.
5-year Business Strategy plan
In view of the competitive business environment and the expected trend going forward, and keeping in view the fact that the full management team with expertise and experience is in place, the recently concluded 5-year strategy plan envisages diversification into new sectors, other than only the Construction and Equipment finance business within the regulatory framework. In addition to this your Company is also actively evaluating various growth options to forge ahead and be a leader in the Industry.
An active and aggressive Marketing and Branding strategy is projected to be adopted during 2016 to forge ahead towards the Vision statement “To be a leading Finance Company in the region”. As part of this, the management team will have a more concentrated business approach to sustain its growth plan. Your Company also understands that this approach needs to be combined with enhancing the IT Infrastructure to embed latest technology options available to ensure utmost customer satisfaction. We are confident that with the strong commitment of the shareholders the business strategy is bound to succeed.
proposed dividend
The Board of Directors is pleased to recommend a cash dividend of 9.4% (RO 2.384 million) for approval by the shareholders at the Annual General Meeting
to be held on March 28, 2016.
paid up capital
With a paid up share capital of RO 25.359 million as at 31st December 2015, your Company is well capitalized and in compliance with the guidelines of the Central Bank of Oman.
Sudan Investment
Your company holds a 5% stake in equity capital of The Arab Leasing Company, Sudan, with a carrying value of RO 582K as at 31st December, 2015.
TALC, Sudan has paid a dividend of RO 31k for the year 2014.
Change in the Composition of the Board
During the year 2015, the new Board of Directors was elected during March 2015 Annual General Meeting. The Audit Committee and Executive Committee were also re-constituted at the Board Meeting held immediately after the Annual General Meeting held on 19th March 2015.
Strengthening Human resources
Your company has continued to invest in Human Resources to sustain its growth in assets.
Your Company strives to establish a recognition, review and learning mechanism by actively engaging the team in the processes by creating a participative atmosphere bringing the best out of them in line with the recently concluded 5-year Strategy Plan. Initiatives have already been taken to equip ourselves with specialized expertise in human resources in line with the new business sectors envisaged in the Strategy Plan.

ANNUAL REPORT 201512
Taageer sees its people as being an integral part of the success of its business model. It constantly looks at the development goals of its employees to enable them to enhance their abilities and achieve measurable and sustainable results.
Corporate Governance
Your company is committed to adhering to the highest standards of Compliance and Corporate Governance. A separate report on Corporate Governance is enclosed.
acknowledgement
On behalf of the Board of Directors, I wish to express sincere gratitude to His Majesty Sultan Qaboos bin Said for his vision and wise leadership.
I would also like to take this opportunity to express our sincere appreciation and acknowledgement for the guidance and support from the Central Bank of Oman, Capital Market Authority and Muscat Securities Market. We are also grateful to our shareholders, bankers, dealers and customers for their continued trust, confidence and support. Finally, the Board would like to appreciate and thank the management and the staff for all their hard work and efforts.
On Behalf of the Board of Directors
faisal al Hashar
Chairman

ANNUAL REPORT 2015 13
Management report contains analysis of important factors underlying the performance of the Company.
Economic outlook
Declining Oil prices has pushed the Government to initiate austerity measures and to look for diversification to reduce reliance on Oil Sector revenues. Oman possess a rich reserve of minerals and the Government has started working towards impetus on mining sector. The potential revenues through Tourism has also been identified. Other than austerity measures, fiscal discipline has also been introduced and the Government has started to introduce various refinements in Taxation and management of subsidies. Reduction in fuel subsidies has resulted in a rise in petrol prices by about 33% in January 2016.
Although there are challenges ahead in the year 2016, the Government possess a strong track record of bouncing back from crisis as has been the case in many such occasions in the past.
Outlook for 2016
A conservative GDP growth rate of about 2.5% has been projected by the Government.
Due to high deficit of RO 3.3 billion for the first time in many years, the Government has initiated controls and fiscal discipline to look for sustainability through diversification. In view of the excellent track record in economic discipline, the Government is confident of raising resources within and outside the country to counter the fiscal pressures.
Despite challenges the key Infrastructure growth has remained undeterred and prestigious and important projects have continued to progress.
potential of financial Sector
The Cash Flow gap in various segments of business, particularly the Small and Medium Enterprises (SMEs) will provide ample scope for financial institutions to provide financial support through pro-active and efficient identification of potential business sources. The Government has always stressed the need upon the Banks and financial institutions to provide all support to facilitate the growth of the SME and also the MSMEs. To provide a positive stimulus to these enterprises the scope and definition of the SMEs has also been widened by policy level changes recently. Although, the competition amongst the Finance & Leasing Companies (FLCs)
MaNaGEMENT rEpOrT

ANNUAL REPORT 201514
continued to be intense during the year 2015 and is expected to prevail for the most part of the year 2016. The FLCs registered a growth of 11.5% during 2015. However, in view of the prevailing economic conditions, the Industry could achieve a growth of 9%. The FLCs would strategize growth depending on the overall economic environment.
Taageer registered a substantial growth in assets size of 18%.
return on shareholders’ funds (rONW)
Company has posted a return of 12.88% on shareholders’ funds.
The RONW is the result of the following components:-
Business volumes and asset growth
Business volumes and asset size have grown by 30% and 18% respectively in 2015.
Cost of funds
Company has managed its borrowing costs which is evident by a reduction in interest costs to RO 2,212K in 2015 as compared to RO 2,276K in 2014, notwithstanding the increase in asset size during 2015. However, this would be closely monitored during the year 2016 as the liquidity pressures on the Banks have pushed up the lending rates.
Non performing assets
During the course of growth in asset size, it is important to ensure that the ratio of non performing assets in total portfolio of the Company does not deteriorate. Ratio of NPAs as % of total assets changed from 7.1% as at 31-12-2014 to 6.3% at 31-12-2015. Company has introduced various operational improvements in the current year to closely monitor the non performing assets in the portfolio.
Operating overheads
Operating overheads constituted 33% of total income from financing activities in 2015 (same as in 2014).
performance snapshot
Key indicators of Company’s operating performance over last 5 years are as under: RO’ 000
particulars 2015 2014 2013 2012 2011
Share capital 25,359 25,359 23,700 21,667 16,667
Net worth 34,312 32,427 31,123 29,386 27,031
Net investment in lease 126,656 107,306 101,958 92,000 83,660
Total borrowings 89,253 71,556 67,299 56,727 49,782
Gross income 11,893 10,908 10,445 10,266 9,758
Profit after tax 4,421 3,883 3,924 3,905 3,216

ANNUAL REPORT 2015 15
Branch network
The Company has always worked towards achieving excellence through customer satisfaction. In order to provide better services to its customers, the Head Office which is now located at a more favourable location to customers at Al Khuwair has contributed effectively towards better customer service.
Currently the company has branches at Al Khuwair, Hatat Complex, Sohar, Nizwa, Barka and Salalah.
risks and concerns
Credit risk
Focus on credit risk is an important part of Risk Management framework as indicated by the Central Bank. Measures such as Loan Review Mechanism, Sectoral caps on lending, Analysis of non-performing assets, risk scoring models help the management to manage credit risk.
Company has initiated a review of its credit policies and procedures to balance risk appetite with requirements of customers and prevailing economic conditions.
Interest rate risk
It is not customary to offer benchmark based lending products to retail & SME customers. Company, however, has interest rate re-pricing clause in agreements with corporate customers. Company is also cautious in its pricing approach which factors interest rate volatility.
Liquidity risk
Liquidity risk arises from inability of the Company to pay its liabilities when they fall due.
In lending business, liquidity risk is inherent due to an element of mis-match in cash flow timings of assets and liabilities. This is mitigated by having adequate lines of credit from the lenders over and above its normal business pattern.
Other risks
Company has insurance cover over its assets.
It has a continuity of management plan, in the event of a sudden gap in leadership level of management.
Company is revamping all operating policies and procedures to identify areas of improvement, standardization and rationalization of its activities.
Business Continuity and Disaster recovery
Your Company has put in place a Disaster Recovery and Business Continuity Plan and steps are being initiated to conduct periodic testing to ensure a state of preparedness.
acknowledgement
On behalf of the management, I thank the Chairman, Vice-Chairman of the Board, Chairman of Audit Committee, Chairman of the Executive committee and Board members for their continuous guidance.
We also take this opportunity to thank our shareholders, our employees and regulatory bodies for their continuous support.
Mohammed redha a. Jawad
Chief Executive Officer

ANNUAL REPORT 201516
ANNUAL REPORT 2015 17
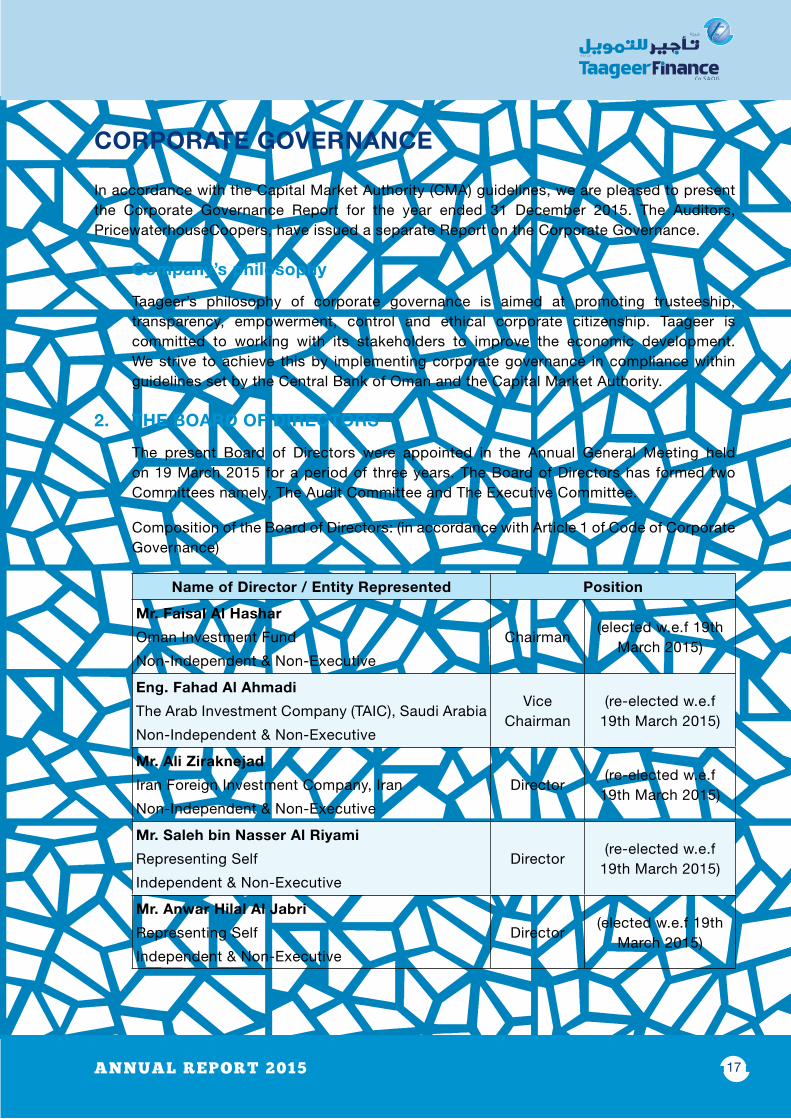
COrpOraTE GOVErNaNCE
In accordance with the Capital Market Authority (CMA) guidelines, we are pleased to present the Corporate Governance Report for the year ended 31 December 2015. The Auditors, PricewaterhouseCoopers, have issued a separate Report on the Corporate Governance.
1. Company’s philosophy
Taageer’s philosophy of corporate governance is aimed at promoting trusteeship, transparency, empowerment, control and ethical corporate citizenship. Taageer is committed to working with its stakeholders to improve the economic development. We strive to achieve this by implementing corporate governance in compliance within guidelines set by the Central Bank of Oman and the Capital Market Authority.
2. THE BOarD Of DIrECTOrS
The present Board of Directors were appointed in the Annual General Meeting held on 19 March 2015 for a period of three years. The Board of Directors has formed two Committees namely, The Audit Committee and The Executive Committee.
Composition of the Board of Directors: (in accordance with Article 1 of Code of Corporate Governance)
Name of Director / Entity represented position
Mr. faisal al Hashar
Oman Investment Fund
Non-Independent & Non-Executive
Chairman(elected w.e.f 19th
March 2015)
Eng. fahad al ahmadi
The Arab Investment Company (TAIC), Saudi Arabia
Non-Independent & Non-Executive
Vice Chairman
(re-elected w.e.f 19th March 2015)
Mr. ali Ziraknejad
Iran Foreign Investment Company, Iran
Non-Independent & Non-Executive
Director(re-elected w.e.f
19th March 2015)
Mr. Saleh bin Nasser al riyami
Representing Self
Independent & Non-Executive
Director(re-elected w.e.f
19th March 2015)
Mr. anwar Hilal al Jabri
Representing Self
Independent & Non-Executive
Director(elected w.e.f 19th
March 2015)

ANNUAL REPORT 201518
Mr. Hussain Mohamed redha
Representing Self
Independent & Non-Executive
Director(re-elected w.e.f
19th March 2015)
Mr. Mansoor Hamood al amri
Ministry of Defence Pension Fund
Non-Independent & Non-Executive
Director(elected w.e.f 19th
March 2015)
Mr. khalid Mohamed al Hamoodah
Representing Self
Independent & Non-Executive
Director(elected w.e.f 19th
March 2015)
Eng. ahmed Hamed al Subhi
Oman Investment & Finance Co. SAOG
Non-Independent & Non-Executive
Chairman(resigned on 19th
March 2015)
Brig. Saif Salim Saif al Harthi
Ministry of Defence, Pension Fund, Oman
Non-Independent & Non-Executive
Director(resigned on 19th
March 2015)
Board of Directors held 6 meetings during the year. The details of members’ participation in the meetings along with their Directorships in other companies in Oman are as follows:
Name of the Director position
Board Meeting attended
Whether attended last aGM
Directorships in other Companies
position in other
Company
Mr. faisal al Hashar
Chairman
519-03-201506-05-201513-07-201528-10-201517-12-2015
No
Rural Area Electricity SAOC
Electricity Holding SAOC
Chairman
Director
Eng. fahad al ahmadi
Vice Chairman
605-02-201519-03-201506-05-201513-07-201528-10-201517-12-2015
Yes --- ---
Mr. ali Ziraknejad
Director
505-02-201519-03-201506-05-201513-07-201528-10-2015
Yes --- ---

ANNUAL REPORT 2015 19
Mr. Saleh bin Nasser al riyami
Director
605-02-201519-03-201506-05-201513-07-201528-10-201517-12-2015
Yes
Oman Ceramic Co. (SAOG)
Al Madina Takaful SAOG
Vice-Chairman
Director
Mr. anwar Hilal al Jabri
Director
406-05-201513-07-201528-10-201517-12-2015
No
Ahli Bank SAOGOminvest SAOGNational Life &
General Insurance SAOC
Dhofar Power Company SAOC
DirectorDirectorDirector
Director
Mr. Hussain Mohamed redha
Director
605-02-201519-03-201506-05-201513-07-201528-10-201517-12-2015
YesNational Life &
General Insurance Company (SAOC)
Director
Mr. Mansoor Hamood al-amri
Director
519-03-201506-05-201513-07-201528-10-201517-12-2015
No --- ---
Mr. khalid Mohamed al Hamoodah
Director
519-03-201506-05-201513-07-201528-10-201517-12-2015
NoMuscat Gases SAOG
NBO GCC FundMuscat Fund
DirectorDirectorDirector
Eng. ahmed Hamed al Subhi
Ex-Chairman
105-02-2015
Yes
Oman Investment Finance Company
(SAOG)Voltamp Energy
(SAOG)
Chairman
Director
Brig. Saif Salim Saif al Harthi
Director1
05-02-2015No --- ---

ANNUAL REPORT 201520
3. aUDIT COMMITTEE
The main role of the Audit Committee is to:
• Assist the Board in assuring the integrity and credibility of the financial reporting process;
• Review the company’s internal financial controls and the company’s internal control and risk management systems;
• Monitor and review the effectiveness of the company’s internal audit function;
• Selecting and evaluating the External Auditors.
During the year 2015, the company appointed Moore Stephens LLC to conduct the Internal Audit of the company along with an in-house Internal Auditor.
The Internal Audit work plan is drawn up in consultation with the Audit Committee. Internal Audit is done on a quarterly basis and a report is submitted to the Audit Committee for their review. The Chairman of the Audit Committee presents to the Board the proceedings of the Audit Committee meeting. The audit covers areas of operations of the company as per the approved internal audit work plan. The Management has responded to the various issues raised by the Internal Auditor and submits a compliance report on the same.
The Audit Committee comprises of three Board members. Audit Committee held five meetings during the year. Details of the members and their attendance in the meetings held are as follows:
Name of the Director position Meetings attended Date of appointment
Mr. Saleh bin Nasser Al Riyami Chairman 3 Nominated on 19th March 2015
Mr. Ali Ziraknejad Chairman 2
29th March 2009 (Resigned from Audit Committee and
nominated to Executive Committee on 19th March
2015)
Mr. Mansoor Hamood Al-Amri Member 3 Nominated on 19th March 2015
Mr. Khalid Mohamed Al Hamoodah Member 3 Nominated on 19th March
2015
Brig. Saif Salim Saif Al Harthi Member 2 29th March 2009 (resigned on 19th March 2015)
Mr. Hussain Mohamed Redha Member 2
22nd July 2014 (Resigned from Audit Committee and
nominated to Executive Committee on 19th March
2015)

ANNUAL REPORT 2015 21
4. Executive Committee
The Executive Committee comprises of four Board members. The main role of the Executive Committee is to;
• Review, recommend and approve / reject credit proposals within specified financial limits;
• Review and recommend the annual budget to the BOD for its approval;
• Review company’s monthly management accounts, its performance vs budget, financial management and operations of the company and recommend to the BOD appropriate action on the issues arising there from;
• Recommend appointment / replacement of senior management of the company (other than CEO, COO and Head of Internal Audit), review compensation related matters recommended by the management and accord approval (within the overall budget sanctioned by the Board).
Executive Committee held four meetings during year. Details of present members and their attendance in the meeting held are as follows:
Name of the Director positionMeetings attended
Date of appointment
Mr. Anwar Hilal Al Jabri Chairman 4 Nominated on 19th March 2015
Eng. Fahad Al Ahmadi Member 4 29 March 2009
Mr. Ali Ziraknejad Member 3 Nominated on 19th March 2015
Mr. Hussain Mohamed Redha Member 4 Nominated on 19th March 2015
Mr. Saleh bin Nasser Al Riyami Member NIL
29th March 2009 (Resigned from Executive Committee
and nominated as Chairman to Audit Committee on 19th
March 2015)
5. remuneration Matters
The Board of Directors has recommended Director’s remuneration of RO 56,000 for the year 2015 (2014 – RO 39,000) in line with the provisions of Article 101 of the Commercial Companies Law of 1974, as per the requirements of Capital Market Authority. The Board was paid sitting fees as per details given herein under as approved in the last AGM held on 19 March 2015.
In the case of institutional representatives on the board, payment of sitting fees have been made to the Director or directly to the institution whose nominee is represented on the Board as per the instruction from the Director or decision of the institution.
The Company held 6 Board meetings during 2015, and RO 60,000 (2014 - RO, 49,000) has been paid towards Directors’ sitting fees.

ANNUAL REPORT 201522
During 2015, 5 Audit Committee meetings were held and RO 15,000 (2014 – RO 10,000) was paid towards Audit Committee sitting fees.
During 2015, 4 Executive Committee meetings were held and RO 11,000 (2014 – RO 10,000) was paid towards Executive Committee sitting fees.
During the year RO 372,819 (2014 – RO 384,728) was paid as salary and related benefits to the six senior most officers of the company. Employment contracts with these officers are in accordance with the labour laws of the Sultanate of Oman.
6. process of Nomination of the Directors
The company follows the provisions of the Commercial Companies Law and the guidelines from the Central Bank of Oman in respect of nomination of the members of the Board of Directors.
7. Means of Communication with the Shareholders
The Company publishes quarterly accounts in two national newspapers and also submits the same to the Muscat Securities Market. Annual report is mailed to all the Shareholders. And other relevant information at Muscat Securities Market (MSM) website (www.msm.gov.om).
8. Market price Data
a. High/Low price and index
The shares of the company are listed on the Muscat Securities Market. Details of market price data during 2015are as follows:
MonthMarket price
(rO) Volume Traded
Index
High Low MSM SectorJan-2015 0.152 0.147 457,084 6,558 8,022
Feb-2015 0.172 0.152 6,256,004 6,559 8,182
Mar-2015 0.167 0.145 5,724,071 6,238 7,705
Apr-2015 0.147 0.142 99,199 6,323 7,733
May-2015 0.142 0.142 31,814 6,388 7,713
Jun-2015 0.150 0.142 182,314 6,425 7,740
Jul-2015 0.146 0.144 27,438 6,558 8,021
Aug-2015 0.145 0.143 120,478 5,872 7,068
Sep-2015 0.142 0.130 231,430 5,788 6,894
Oct-2015 0.135 0.131 241,804 5,928 7,299
Nov-2015 0.134 0.130 98,922 5,548 6,646
Dec-2015 0.131 0.130 28,111 5,406 6,477

ANNUAL REPORT 2015 23
b. Distribution of shares
Name of the shareholders (holding more than 5%)percentage
(%)No. of shares
Oman Investment Fund Holding Co. 33.63 85,287,298
The Arab Investment Co. SAA 18.79 47,637,994
Iran Foreign Investment Co. 12.49 31,685,320
Diwan of Royal Palace- Pension Fund 6.78 17,183,808
Oman Investment & Finance Co. SAOG 6.15 15,599,154
9. Statutory auditors
PwC is a global network of firms operating in 157 countries with more than 208,000 people who are committed to delivering quality in assurance, tax and advisory services. PwC also provides corporate training and professional financial qualifications through PwC’s Academy.
Established in the Middle East for over 40 years, PwC Middle East has firms in Bahrain, Egypt, Iraq, Jordan, Kuwait, Lebanon, Libya, Oman, the Palestinian territories, Qatar, Saudi Arabia and the United Arab Emirates, with around 3,000 people. (www.pwc.com/me).
PwC has been established in Oman for over 40 years and the Firm comprises 3 partners, including one Omani national, and over 140 professionals and support staff. Expert assurance, tax and advisory professionals are able to combine internationally acquired specialist consulting and technical skills with relevant local experience.
PwC refers to the PwC network and/or one or more of its member firms, each of which is a separate legal entity. Please see www.pwc.com/structure for further details.
10. audit fees
During the year 2015, an amount of RO 8,550 has been paid to the statutory auditors or is due to them.
11. Non-Compliance
During the year the company has paid RO. 5,000 to Central Bank of Oman (CBO), RO 1,450 to Capital Market Authority (CMA) as penalties and RO 10,966 to ROP as fines for the periods 2002 to 2006 which were not recoverable from the customers.
Other than the stated above, Taageer is not aware of any other non-compliance with the law, regulation, or any other requirement of a statutory authority, nor has it been subject to penalty for any breach as on 31 December 2015.
ANNUAL REPORT 201524
12. Corporate Social responsibility
Taageer is committed to shoulder its financial responsibility in social sphere. During the financial year 2015, Taageer has contributed sums aggregating to RO 19,520 against an amount of RO. 30,000 approved at AGM on 19 March 2015 to associations engaged in promoting welfare of the Disabled, Elderly Friends, Blind, Diabetic and in spreading cancer awareness.
13. acknowledgement
The Board of Directors acknowledges confirmation of:
• Its responsibility for the preparation of the financial statements in accordance with the applicable standards and rules;
• Review of the efficiency and adequacy of internal control systems of the Company and that it complies with internal rules and regulations;
• There are no material matters that affect the continuation of the Company and its ability to continue its operations during the next financial year.
Saleh bin Nasser al riyamiChairman - audit Committee

ANNUAL REPORT 2015 25

ANNUAL REPORT 201526
Employees Long Service award Ceremony

ANNUAL REPORT 2015 27
STaTEMENT Of fINaNCIaL pOSITION AS AT 31 DECEMBER 2015
2015 2014Note rO’000 RO’000
aSSETSCash and bank balances 4 868 1,712Net investment in finance leases and working capital finance 5 126,686 107,306Other receivables and prepayments 6 667 192Deferred tax 18(f) 289 334Available for sale financial asset 7 582 582Vehicles and equipment 8 326 385Statutory deposit 9 210 170Total assets 129,628 110,681
EQUITy aND LIaBILITIESEQUITyCapital and reservesShare capital 10(a) 25,359 25,359Legal reserve 10(b) 3,150 2,708Fair value reserve 7 63 63Retained earnings 5,740 4,297Total equity 34,312 32,427
LIaBILITIESBank overdrafts and short term loans 11 42,049 36,594Tax payable 18(b) 1,130 1,044Creditors, accruals and other liabilities 14 4,933 5,654Corporate and security deposits 13 4,367 16,159Long term loans 12 42,837 18,803Total liabilities 95,316 78,254Total equity and liabilities 129,628 110,681Net assets per share (baizas) 15 136 128
These financial statements including notes and other explanatory information on pages 6 to 32 which were approved and signed by the Directors on 30th January 2016.
________________ ________________
Chairman Director
The notes and other explanatory information on pages 6 to 32 form an integral part of these financial statements.
Report of the auditors is set forth on page 1.

ANNUAL REPORT 201528
STaTEMENT Of COMprEHENSIVE INCOME FOR THE YEAR ENDED 31 DECEMBER 2015
2015 2014
Note rO’000 RO’000
Income
Finance income 24 11,035 10,127
Interest expense 11,12&24 (2,212) (2,276)
Net income from financing activities 8,823 7,851
Other operating income 17 858 781
9,681 8,632
Expenses
General and administrative expenses 16 (3,629) (3,371)
Depreciation 8 (151) (125)
(3,780) (3,496)
profit before provision for impairment 5,901 5,136
Impairment for finance leasesand working capital finance - net 5(d) (818) (648)
profit before taxation 5,083 4,488
Taxation 18(a) (662) (605)
profit for the year 4,421 3,883
Other comprehensive income to be reclassified to profit or loss in subsequent periods:
Change in fair value of availableforsale financial asset 7 - (209)
Total comprehensive income for the year 4,421 3,674
Basic and diluted earnings per share (baizas) 19 17.67 15.31
The notes and other explanatory information on pages 6 to 32 form an integral part of these financial statements.
Report of the auditors is set forth on page 1.

ANNUAL REPORT 2015 29
STaTEMENT Of CHaNGES IN EQUITy FOR THE YEAR ENDED 31 DECEMBER 2015
Share capital
Legal reserve
Fair value reserve
Retained earnings Total
RO’000 RO’000 RO’000 RO’000 RO’000
At 1 January 2014 23,700 2,320 272 4,831 31,123
Total comprehensive income for the year
Profit for the year - - - 3,883 3,883
Net change in fair value of available for sale financial asset (note 7) - - (209) - (209)
Total comprehensive income for the year - - (209) 3,883 3,674
Transactions with owners:
Transfer to legal reserve (note 10) - 388 - (388) -
Bonus shares issued during the year (note 10) 1,659 - - (1,659) -
Cash dividends (note 10) - - - (2,370) (2,370)
Total transactions with owners 1,659 388 - (4,417) (2,370)
At 31 December 2014 25,359 2,708 63 4,297 32,427
at 1 January 2015 25,359 2,708 63 4,297 32,427Total comprehensive income for the yearProfit for the year - - - 4,421 4,421Total comprehensive income for the year - - - 8,718 36,848Transactions with owners:Transfer to legal reserve (note 10) - 442 - (442) -Cash dividends (note 10) - - - (2,536) (2,536)Total transactions with owners - 442 - (2,979) (2,536)at 31December 2015 25,359 3,150 63 5,740 34,312
The notes and other explanatory information on pages 6 to 32 form an integral part of these financial statements.
Report of the auditors is set forth on page 1.

ANNUAL REPORT 201530
STaTEMENT Of CaSH fLOWS FOR THE YEAR ENDED 31 DECEMBER 2015
2015 2014Note rO’000 RO’000
Operating activitiesProfit before taxation 5,083 4,488adjustments for:Interest expense 2,212 2,276Impairment for finance leases and working capital finance 5(d) 818 648Depreciation 8 151 125Transfers from written off provisions 19 83Provision for end of service benefits 14.1 26 17Profit on sale of vehicle and equipment - (8)Operating cash flows before payment of end of service benefits, interest, income tax and working capital changes 8,309 7,629Changes in working capitalNet investment in lease and working capital finance (20,217) (6,080)Other receivables and prepayments (475) 16Creditors, accruals and other liabilities (736) (189)Net cash (used in)/generated from operations (13,119) 1,364End of service benefits paid 14.1 (11) (12)Income tax paid 18 (d) (531) (545)Interest paid (2,212) (2,276)Net cash used in operating activities (15,873) (1,457)Investing activities Purchase of vehicles and equipment 8 (92) (334)Proceeds from sale ofvehicles and equipment - 8Statutory deposit placed (40) (40)Net cash used in investing activities (132) (366)financing activitiesLong term loans received / (repaid) 24,034 3,599Short term loans received / (repaid) 5,000 (1,800)Corporate and security deposits (repaid) /received (11,792) 2,452Dividends paid 10 (2,536) (2,370)Net cash generated from financing activities 14,706 1,881Net change in cash and cash equivalents (1,299) 58Cash and cash equivalents at the beginning of the year (382) (440)Cash and cash equivalents at the end of the year (1,681) (382)Cash and cash equivalents comprise of:Cash and bank balances 4 868 1,712Bank overdrafts 11 (2,549) (2,094)
(1,681) (282)
The notes and other explanatory information on pages 6 to 32 form an integral part of these financial statements.
Report of the auditors is set forth on page 1.

ANNUAL REPORT 2015 31
Empolyee Training program
ANNUAL REPORT 201532
NOTES TO THE fINaNCIaL STaTEMENTS for the year ended 31 December 2015
1 Legal status and principal activities
Taageer Finance Company SAOG (the Company) is an Omani general joint stock company registered with the Ministry of Commerce on 22 October 2005. The Company was originally incorporated as a closed stock Company on 24 December 2000 and was converted as an Omani general joint stock Company on 21 October 2005 by a resolution of the shareholders passed on 27 August 2005. The Company is engaged in the business of providing leasing, debt factoring, bridge loan and construction loans in the Sultanate of Oman. The Company’s shares are listed on Muscat Securities Market.The registered office of the Company is located at Al Khuwair, Muscat, Sultanate of Oman.
The Company operates in the Sultanate of Oman with a network of six branches (2014 - six branches) and has employed 155 employees as of 31 December 2015 (2014 - 146 employees).
2 Summary of significant accounting policies
The principal accounting policies applied in the preparation of these financial statements are set out below. These policies have been consistently applied to all the years presented, unless otherwise stated.
2.1 Statement of compliance
These financial statements have been prepared in accordance with International Financial reporting Standards (IFRS), applicable regulations of Central Bank of Oman, applicable requirements of the Commercial Companies Law of 1974, as amended and disclosure requirements of the Capital Market Authority of the Sultanate of Oman.
2.2 Basis of preparation
The financial statements have been prepared under the historical cost convention except for available for sale financial asset which is carried at fair value.
The statement of financial position is presented in descending order of liquidity, as this presentation is more appropriate to the Company’s operations.
The preparation of financial statements in conformity with IFRS requires the use of certain critical accounting estimates. It also requires management to exercise its judgement in the process of applying the Company’s accounting policies. Management has used its judgments and made estimates in determining the amounts recognised in the financial statements. The areas involving a higher degree of judgment or complexity or areas where assumptions and estimates are significant to the financial statements are disclosed in note 2.23. Estimates and underlying assumptions are reviewed on an ongoing basis.

ANNUAL REPORT 2015
NOTES TO THE fINaNCIaL STaTEMENTS for the year ended 31 December 2015 (continued)
33
Revisions to accounting estimates are recognised in the period in which the estimate is revised and in any future periods effected.
(a) Standards, amendments and interpretations effective in 2015 and relevant for the Company’s operations:
There are no IFRS or IFRIC interpretations that are effective for the first time for the financial year beginning on or after 1 January 2015 that would be expected to have a material impact on the financial statements of the Company.
(b) Standards, amendments and interpretations to existing standards that are not yet effective and have not been early adopted by the Company:
Certain new accounting standards and interpretations have been published that are not mandatory for the Company’s accounting periods beginning on or after 1 January 2016 and have not been early adopted by the Company. The Company’s assessment of the impact of these new standards and interpretations is set out below.
IFRS 9, ‘Financial instruments’ (effective from 1 January 2018)
In July 2014, the IASB made further changes to the classification and measurement rules and also introduced a new impairment model. These latest amendments now complete the new financial instruments standard. Following the changes approved by the IASB in July 2014, the Company’s management is in the process of assessing the impact of application of changes in IFRS 9 ‘Financial instrument’ on the financial statements of the Company.
IFRS 15, ‘Revenue from contracts with customer’ (effective from 1 January 2018)
The IASB has issued a new standard for the recognition of revenue. This will replace IAS 18 which covers contracts for goods and services and IAS 11 which covers construction contracts. The new standard is based on the principle that revenue is recognised when control of a good or service transfers to a customer – so the notion of control replaces the existing notion of risks and rewards. As the Company’s revenue recognition is governed under IAS 17 “Leases’, therefore, the Company does not expect any significant impact from the application of IFRS 15.
Other standards and interpretations that have been issued but are not yet mandatory, and have not been early adopted by the Company, are not expected to have a material impact on the Company’s financial statements.
2.3 Segment reporting
An operating segment is a component of the Company that engages in business activities from which it may earn revenues and incur expenses, including revenues and expenses

ANNUAL REPORT 2015
NOTES TO THE fINaNCIaL STaTEMENTS for the year ended 31 December 2015 (continued)
34
that relate to transactions with any of the Company’s other components, whose operating results are reviewed regularly by the chief operating decision maker to make decisions about resources allocated to the segment and assess its performance, and for which discreet financial information is available. Segment results that are reported to the chief operating decision maker include items directly attributable to a segment as well as those that can be allocated on a reasonable basis.
The Company is engaged in leasing activities, all of which are carried out in the Sultanate of Oman. Although the Company has retailand corporate customers, the entire lease portfolio is managed internally as one business unit. All the Company’s funding and costs are common and are not allocated between these two portfolios. The financial information that can be separately recognised for retailand corporate portfolios has been disclosed in note 24 to these financial statements.
2.4 foreign currency transactions
Items included in the Company’s financial statements are measured using Rial Omani which is the currency of the Sultanate of Oman, being the economic enivronment in which the Company operates (the functional currency). The financial statements are presented in Rial Omani, rounded to the nearest thousands which is the Company’s functional and presentation currency.
Foreign currency transactions are translated into the functional currency using the exchange rates prevailing at the dates of the transactions. Foreign exchange gains and losses resulting from the settlement of such transactions and from the translation at year-end exchange rates of monetary assets and liabilities denominated in foreign currencies are recognised in the statement of comprehensive income.
2.5 revenue recognition
Assets owned by the Company and subject to finance leases are included in the financial statements as “Net investment in finance leases and working capital” at an amount equivalent to the present value of the future minimum lease payments plus initial direct costs, discounted using the interest rate implicit in the lease, and the difference between the aggregate lease contract receivable and the cost of the leased assets plus initial direct costs is recorded as unearned lease finance income. Initial direct costs include amounts that are incremental and directly attributable to negotiating and arranging a lease. They exclude general overheads such as those incurred by sales and marketing teams. Income from finance leases represents gross earnings on finance leases allocated to the period of the lease using the net investment method, which reflects a constant periodic rate of return.
The lease finance income is recognised in the statement of comprehensive income using the effective interest rate method. The effective interest rate is the rate that exactly discounts the estimated future cash receipts and payments through the expected life of

ANNUAL REPORT 2015
NOTES TO THE fINaNCIaL STaTEMENTS for the year ended 31 December 2015 (continued)
35
the financial asset or liability to the carrying amount of the financial asset or liability. The effective interest rate is established on initial recognition of the financial asset or liability and is not revised subsequently.
Interest on factoring and working capital finance receivables is recognised using the effective interest rate method over the tenure of agreement.
Interest on past due and impaired loans is not recognised to income and is transferred to reserve account. This is reversed from reserve account and is taken to income account when actually received in cash.
Penal charges, lease processing charges, insurance and other operating fees are recognised when realised.
Dividend income is accounted for when the right to receive dividend is established.
2.6 Interest expense
Interest expense is recognised on accrual basis using effective interest rate method.
2.7 Taxation
The tax expense for the year comprises current and deferred tax and is recognised in the statement of comprehensive income except relating to other comprehensive income which is recognised in equity. The current income tax charge is calculated in accordance with Omani tax laws. Current tax is the expected tax payable on the taxable income for the year, using tax rates enacted or substantively enacted at the reporting date, and any adjustments to tax payable in respect of previous years. Management periodically evaluates positions taken in tax returns with respect to situations in which applicable tax regulation is subject to interpretation. It establishes provisions, where appropriate, on the basis of amounts expected to be paid to the tax authorities.
Deferred tax is determined using tax rates (and laws) that have been or are substantially enacted by the reporting date and are expected to apply when the related deferred tax asset is realised or the deferred tax liability is settled. Deferred tax assets are recognised only to the extent that it is probable that future taxable profit will be available against which the temporary differences can be utilised. The carrying amount of deferred tax asset is reviewed at each reporting date and reduced to the extent that it is no longer probable that sufficient taxable profit will be available to allow all or part of the deferred income tax asset to be utilised.
2.8 Vehicles and equipment
Vehicles and equipment are stated at historical cost, less accumulated depreciation and accumulated impairment losses, if any. Historical cost includes expenditure that is directly attributable to the acquisition of the items. Subsequent costs are included

ANNUAL REPORT 2015
NOTES TO THE fINaNCIaL STaTEMENTS for the year ended 31 December 2015 (continued)
36
in the asset’s carrying amount or recognised as a separate asset, as appropriate, only when it is probable that future economic benefits associated with the item will flow to the Company and the cost of the item can be measured reliably. All other repairs and maintenance costs are charged to the statement of comprehensive income during the financial period in which they are incurred. Depreciation on assets is calculated using the straight line method to allocate their cost to their residual values over their estimated useful lives as follows:
Motor vehicles 3 years
Office equipment 4 years
Furniture and fixtures 4 years
The assets’ residual values and useful lives are reviewed, and adjusted if appropriate, at each reporting date. An asset’s carrying amount is written down immediately to its recoverable amount if the asset’s carrying amount is greater than its estimated recoverable amount.
Gains and losses on disposal of vehicles and equipment are determined by comparing the proceeds with the carrying amount and are recognised in the statement of comprehensive income.
2.9 financial assets and liabilities
2.9.1 Non-derivative financial assets
(i) Recognition and measurement of financial assets
The Company initially recognises loans and receivables and deposits on the date that they are originated. All other financial assets are recognised initially on the trade date, which is the date that the Company becomes a party to the contractual provisions of the instrument.
The Company derecognises a financial asset when the contractual rights to the cash flows from the asset expires, or it transfers the rights to receive the contractual cash flows on the financial asset in a transaction in which substantially all the risks and rewards of ownership of the financial asset are transferred. Any interest in transferred financial assets that is created or retained by the Company is recognised as a separate asset or liability. The Company classifies non-derivative financial assets into the following categories:loans and receivables and available for sale financial assets.
(a) Loans and receivables
Loans and receivables are non-derivative financial assets with fixed or determinable payments that are not quoted in an active market. Such assets are recognised

ANNUAL REPORT 2015
NOTES TO THE fINaNCIaL STaTEMENTS for the year ended 31 December 2015 (continued)
37
initially at fair value plus any directly attributable transaction costs. Subsequent to initial recognition, loans and receivables are measured at amortised cost using the effective interest rate method, less any accumulated impairment losses. Loans and receivables comprise net investment in finance lease, working capital finance, other receivables, statutory deposits and cash and bank balances.
(b) Available for sale financial assets
Available for sale financial assets are non-derivatives that are either designated in this category or not classified in any of the other categories.
Available for sale financial assets are initially recognised at fair value including transaction costs. Such financial assets are subsequently carried at fair value, unless fair value cannot be reliably determined in which case these financial assets are measured at cost less accumulated impairment losses if any. Changes in the fair value of availableforsale financial assets are recognised in equity as “fair value reserve”.
The fair values of quoted investments are based on current bid prices. If the market for a financial asset is not active, and for unlisted securities, the Company establishes fair value by using valuation techniques. These include the use of recent arm’s length transactions, reference to other instruments that are substantially the same and discounted cash flow analysis, making maximum use of market inputs and relying as little as possible on entity-specific inputs.
On derecognition or impairment, the cumulative gain or loss previously recognised in “fair value reserve” within equity, is recognised in the statement of comprehensive income for the year.
(ii) Derecognition of financial assets
A financial asset (in whole or in part) is derecognised where:
• the right to receive cash flows from the asset have expired; or
• the Company has transferred its rights to receive cash flows from the asset or has assumed an obligation to pay the received cash flows in full without material delay to a third party under a ‘pass through’ arrangement; and
• either (i) the Company has transferred substantially all the risks and rewards of ownership, or (ii) the Company has neither transferred nor retained substantially all the risks and rewards of the assets but has transferred control over the asset or a proportion of the asset.

ANNUAL REPORT 2015
NOTES TO THE fINaNCIaL STaTEMENTS for the year ended 31 December 2015 (continued)
38
2.9.2 Non-derivative financial liabilities
The Company initially recognises debt securities issued and subordinated liabilities on the date that they are originated. All other financial liabilities are recognised initially on the trade date, which is the date that the Company becomes a party to the contractual provisions of the instrument. The Company derecognises a financial liability when its contractual obligations are discharged, cancelled or expired.
The Company classifies non-derivative financial liabilities into the other financial liabilities category. Such financial liabilities are recognised initially at fair value plus any directly attributable transaction costs. Subsequent to initial recognition, these financial liabilities are measured at amortised cost using the effective interest rate method.Other financial liabilities comprise long term loans, bank overdrafts and short term loans, corporate and security deposits and creditors accrued and other liabilities.
2.9.3 Impairment of financial assets
The Company assesses at each reporting date whether there is objective evidence that a financial asset or group of financial assets is impaired. A financial asset or group of financial assets is impaired and an impairment loss is incurred if, and only if, there is objective evidence of impairment as a result of one or more events that occurred after the initial recognition of the asset (a ‘loss event’) and that loss event (or events) has an impact on the estimated future cash flows of the financial asset or group of financial assets that can be reliably estimated. Objective evidence that a financial asset or group of financial assets is impaired includes observable data that comes to the attention of the Company about the following loss events:
• significant financial difficulty of the obligor;
• a breach of contract, such as a default in rental payment;
• the Company granting to the customer, for economic or legal reasons relating to the customer’s financial difficulty, a concession that the lender would not otherwise consider;
• it becoming probable that the customer will enter bankruptcy or other financial reorganisation; and
• observable data indicating that there is a measurable decrease in the estimated future cash flows from a group of financial assets since the initial recognition of those assets, although the decrease cannot yet be identified with the individual assets in the group, including adverse changes in the payment status of the debtor, or national or local economic conditions that correlate with defaults on the assets in the Company.

ANNUAL REPORT 2015
NOTES TO THE fINaNCIaL STaTEMENTS for the year ended 31 December 2015 (continued)
39
The Company first assesses whether objective evidence of impairment exists individually for financial assets that are individually significant, and individually or collectively for financial assets that are not individually significant. If the Company determines that no objective evidence of impairment exists for an individually assessed financial assets, whether significant or not, it includes the financial assets in a group of financial assets with similar credit risk characteristics and collectively assesses them for impairment.
assets Carried at amortised Cost
If there is objective evidence that an impairment loss on financial assets carried at amortised cost has been incurred, the amount of the loss is measured as the difference between the assets’ carrying amount and the present value of estimated future cash flows (excluding future credit losses that have not been incurred) discounted at the financial asset’s original effective interest rate. The carrying amount of the asset is reduced through the use of an impairment allowance and the amount of the loss is recognised in the statement of comprehensive income.
The calculation of present value of estimated future cash flows of a collateralised financial asset reflects the cash flows that may result from foreclosure less costs for obtaining and selling the collaterals, whether or not foreclosure is probable.
For the purposes of a collective evaluation of impairment, financial assets are grouped on the basis of similar credit risk characteristics (i.e. on the basis of the Company’s grading process that considers asset type, industry, past-due status and other relevant factors). Those characteristics are relevant to the estimation of future cash flows for groups of such assets by being indicative of the debtors’ ability to pay all amounts due according to the contractual terms of the assets being evaluated.
Future cash flows for a group of financial assets that are collectively evaluated for impairment are estimated on the basis of the contractual cash flows associated with the assets and the Company’s historical loss experience for assets with credit risk characteristics similar to those in the group. Historical loss experience is adjusted on the basis of current observable data, including peer statistics, to reflect the effects of current conditions that did not affect the period on which the historical loss experience is based and to remove the effects of conditions in the historical period that do not exist currently.
Estimates of changes in future cash flows for groups of assets should reflect, and be directionally consistent with, changes in related observable data from period to period (for example, payment status or other factors indicative of changes in the probability of losses in the group and their magnitude). The methodology and assumptions used for estimating future cash flows are reviewed regularly by the Company and, if required, revised in order to reflect in loss estimates any changes in actual loss experience.
When a financial asset is uncollectible, it is written off against the related provision for impairment. Such financial assets are written off after all the necessary procedures have been completed and the amount of the loss has been determined. Subsequent recoveries

ANNUAL REPORT 2015
NOTES TO THE fINaNCIaL STaTEMENTS for the year ended 31 December 2015 (continued)
40
of amounts previously written off are recognised as other income in the statement of comprehensive income in the year of receipt.
renegotiated installment finance debtors
The Company may restructure / reschedule loans at the request of customers. This may involve extending the payment arrangements and the agreement of new loan conditions. Once the terms have been renegotiated, the loan is no longer considered past due subject to regulatory guidance. Management continuously reviews renegotiated loans to ensure that all criteria are met and that future payments are likely to occur. The loans continue to be subject to an individual or collective impairment assessment, calculated using the loan’s original effective interest rate.
2.10 Impairment of non-financial assets
The carrying amounts of the Company’s non-financial assets other than deferred tax assets, are reviewed at each reporting date to determine whether there is any indication of impairment. If any such indication exists, then the asset’s recoverable amount is estimated. An impairment loss is recognised if the carrying amount of an asset exceeds its estimated recoverable amount.
The recoverable amount of an asset is the greater of its value in use and its fair value less costs to sell. In assessing value in use, the estimated future cash flows are discounted to their present value using a pre-tax discount rate that reflects current market assessments of the time value of money and the risks specific to the asset.
2.11 Cash and cash equivalents
Cash and cash equivalents include cash in hand and current account with banks including deposits with a maturity of three months or less from the date of placement. Bank overdrafts that are repayable on demand and form an integral part of the Company’s cash management are included as a component of cash and cash equivalents for the purpose of the statement of cash flows.
2.12 Share capital
Ordinary shares are classified as equity. Incremental costs directly attributable to the issue of ordinary shares are recognised as a deduction from equity, net of any tax effects.
2.13 Borrowings
Borrowings, which include corporate and security deposits, are recognised initially at fair value, net of transaction costs incurred. Borrowings are subsequently stated at amortised cost; any difference between the proceeds (net of transaction costs) and the redemption value is recognised in the statement of comprehensive income over the period of the borrowings using the effective interest rate method.

ANNUAL REPORT 2015
NOTES TO THE fINaNCIaL STaTEMENTS for the year ended 31 December 2015 (continued)
41
2.14 End of service benefits and leave entitlements
Provision for end of service indemnity for non-Omani employees has been made in accordance with the terms of the Oman Labour Law 2003 and its amendments and is based on current remuneration rates and cumulative years of service at the statement of financial position date. Employee’s entitlements to annual leave and leave passage are recognised when they accrue to the employees up to the reporting date. These accruals are included in current liabilities, while that relating to end of service benefits is disclosed as a non-current liability.
Contributions to a defined contribution retirement plan for Omani employees in accordance with the Omani Social Insurance Law of 1991 are recognised as an expense in the statement of comprehensive income as incurred.
In accordance with the provisions of IAS 19, Employee benefits’ management carries an exercise to assess the present value of the Company’s obligations as of reporting date, in respect of employees’ end of service benefits payable will not materially differ from the provision made under the Oman aforesaid Labour Law. Under this method, an assessment is made of an employee’s expected service period with the Company and the expected basic salary at the date of leaving the service, discounted over the period of remaining expected period using the country’s risk free rate.
2.15 Creditors, accruals and other liabilities
Creditors, accruals and other liabilities are recognised initially at fair value and subsequently measured at amortised cost using the effective interest rate method. Liabilities are recognised for amounts to be paid for goods and services received, whether or not billed to the Company.
2.16 Dividend distribution
Dividend distribution to the Company’s shareholders is recognised as a liability in the financial statements in the period in which the dividends are approved by the Company’s shareholders.
2.17 Earnings per share
The Company presents basic and diluted earnings per share (EPS) data for its ordinary shares. Basic EPS is calculated by dividing the profit or loss attributable to ordinary shareholders of the Company by the weighted average number of ordinary shares outstanding during the year. Diluted EPS is determined by adjusting the profit or loss attributable to ordinary shareholders and the weighted average number of ordinary shares outstanding for the effects of all dilutive potential ordinary shares.

ANNUAL REPORT 2015
NOTES TO THE fINaNCIaL STaTEMENTS for the year ended 31 December 2015 (continued)
42
2.18 Directors’ remuneration and sitting fees
The Directors’ remuneration is governed as set out in the Commercial Companies Law, regulations issued by the Capital Market Authority and the Articles of Association of the Company.
The Annual General Meeting determines and approves the remuneration and the sitting fees for the Board of Directors and its sub-committees provided such fees, in accordance with Article 106 of the Commercial Companies Law of 1974 as amended, shall not exceed 5% of the annual net profit after deduction of the legal reserve and the optional reserve and the distribution of dividends to the shareholders provided that such fees does not exceed RO 200,000. The sitting fee for each Director does not exceed RO 10,000 in one year.
2.19 Offsetting
Financial assets and financial liabilities are only offset and the net amount reported in the statement of financial position when there is a legally enforceable right to set off the recognised amounts and the company intends to either settle on a net basis, or to realise the asset and settle the liability simultaneously.
2.20 provisions
Provisions are recognised when the Company has a present (legal or constructive) obligation arising from a past event, and the costs to settle the obligation are both probable and able to be reliably measured.
2.21 Commitments
Commitments for outstanding forward foreign exchange contracts are disclosed in these financial statements at contracted rates. Lease commitments are stated at contracted values at year end.
2.22 fair value estimates
The fair value of financial assets and liabilities that are not traded in an active market is determined by using estimated discounted cash flows.
The nominal value less impairment provision of other receivables and payables are assumed to approximate their fair values. The fair value of borrowing for disclosure purposes is estimated by discounting the future contractual cash flows at the current market interest rate that is available to the Company for similar financial instruments.
2.23 Critical accounting estimates and judgements
The preparation of financial statements in conformity with IFRS requires the use of certain critical accounting estimates. The estimates and associated assumptions are based on historical experience and various other factors that are believed by the Company to be

ANNUAL REPORT 2015
NOTES TO THE fINaNCIaL STaTEMENTS for the year ended 31 December 2015 (continued)
43
reasonable under the circumstances, the results of which form the basis of making the judgments about carrying values of assets and liabilities that are readily apparent from other sources. Actual results may differ from these estimates.
Estimates and judgements are continuously evaluated and are based on historical experience and other factors, including expectations of future events that are believed to be reasonable under the circumstances. The estimates and assumptions that have a significant risk of causing a material adjustment to the carrying amounts of assets within the next financial period are discussed below:
key sources of estimation uncertainty
The key assumptions concerning the future, and other key sources of estimation uncertainty at the reporting date, that have a significant risk of causing a material adjustment to the carrying amounts of assets and liabilities within the next financial year, are set out below.
(a) fair value estimation
For investments traded in organised financial markets, fair value is determined by reference to quoted market bid prices at the close of business on the statement of financial position date, adjusted for transaction costs necessary to realise the asset.
For unquoted investments a reasonable estimate of the fair value is determined by reference to the market value of a similar investment or is based on the expected discounted cash flows. Fair value cannot be reliably measured for certain unquoted foreign investments. Such investments are measured at cost. The fair value of interest-bearing items is estimated based on discounted cash flows using interest rates for items with similar terms and risk characteristics.
(b) Impairment losses on investment in finance leases and working capital finance
The Company reviews its investment in finance debtors to assess impairment periodically. In order to assess the impairment, the Company follows guidelines issued by Central Bank of Oman and the requirements of applicable IFRSs. In determining whether an impairment loss should be recorded in the statement of comprehensive income, the Company makes judgments as to whether there is any observable data indicating that there is a measurable decrease in the estimated future cash flows from a portfolio of debtors before the decrease can be identified with an individual debtor in that portfolio. This takes into consideration factors such as any deterioration in industry, collateral value and technological obsolescence, as well as identified structural weaknesses or deterioration in cash flows. The methodology and assumptions used for estimating both the amount and timing of future cash flows are reviewed regularly to reduce any differences between loss estimates and actual loss experience.
ANNUAL REPORT 2015
NOTES TO THE fINaNCIaL STaTEMENTS for the year ended 31 December 2015 (continued)
44
(c) Deferred taxation
Uncertainties exist with respect to the interpretation of tax regulations and the amount and timing of future taxable income. Given the wide range of business relationships and nature of existing contractual agreements, differences arising between the actual results and the assumptions made, or future changes to such assumptions, could necessitate future adjustments to tax income and expense already recorded. The Company establishes provisions, based on reasonable estimates, for possible consequences of finalisation of tax assessments of the Company. The amount of such provisions is based on various factors, such as experience of previous tax assessments and differing interpretations of tax regulations by the taxable entity and the responsible tax authority.
Deferred tax assets are recognised for all unused tax losses to the extent that it is probable that taxable profit will be available against which the losses can be utilised. Significant management judgment is required to determine the amount of deferred tax assets that can be recognised, based upon the likely timing and level of future taxable profits together with future tax planning strategies.
3 financial risk management
3.1 financial risk factors
The Company’s activities expose it to variety of financial risks: market risk (including price risk, foreign currency risk and interest rate risk), credit risk and liquidity risk. The Company’s overall risk management programme focuses on the unpredictability of financial markets and seeks to minimise potential adverse effects on the financial performance of the Company.
The Company aims to follow a strategy of minimising risk in order to reduce its vulnerability to adverse market conditions and this is reflected in the risk appetite set by the Board of Directors and implemented by management. The low assumption of risk is mainly achieved through diversification of the asset portfolio.
The Company has risk management function to oversee the risk management programme. In addition oversight is provided by the Asset Liability Management Committee which includes representation from credit, treasury and risk management function. The Company has independent policies and procedures which address credit risk, liquidity risk and market risk, which arise from the Company’s business.
(a) Market risk
Market risk is the risk that changes in market prices, such as foreign exchange rates and financing rates will affect the Company’s income or the value of its holdings of financial instruments. The objective of market risk management is to manage and

ANNUAL REPORT 2015
NOTES TO THE fINaNCIaL STaTEMENTS for the year ended 31 December 2015 (continued)
45
control market risk exposures within acceptable parameters, while optimising the return on risk.
(i) price risk
Price risk is a risk that fair value of financial instrument will fluctuate because of changes in market prices (other than those arising from interest rate risk or currency risk).As at 31 December 2015, a 5% change in the fair value of available for sale financial asset will result in RO 29,000 (2014 - RO 29,000) change in the Company’s fair value reserve and net equity of the Company.
(ii) foreign currency risk
Foreign currency risk is the risk arising from future commercial transactions or recognised financial assets or liabilities being denominated in a currency that is not the Company’s functional currency. The majority of the Company’s transactions are denominated in the functional currency. The functional currency is effectively fixed to the US Dollar and accordingly foreign exchange risk is considered minimal.
(iii) Interest rate risk
Interest rate risk is the uncertainty of future earnings resulting from fluctuations in interest rates. The risk arises when there is a mismatch in the assets and liabilities, which are subject to interest rate adjustment within a specified period. The most important sources of interest rate risk are the Company’s borrowings where fluctuations in interest rates, if any, are reflected in the results of operations.
Interest rate gap is a common measure of rate risk. A positive gap occurs when more assets than liabilities are subject to rate change during a prescribed period of time. A negative gap occurs when liabilities exceed assets subject to rate changes during a prescribed period of time. It includes the Company’s financial instruments at carrying amounts, categorised by the earlier of contractual repricing or maturity dates.
The Company’s leasing activities carry fixed rate of interest, hence, these activities do not expose the Company to interest rate risk. Borrowings at variable rates of interest expose the Company to cash flow interest rate risk. The interest rates on short-term borrowings with banks are subject to change upon re-negotiation of the facilities which takes place on an annual basis in the case of overdrafts and at more frequent intervals in the case of short-term loans. The Company does not hedge against its cash flow and fair value interest rate risk.
The Company uses sensitivity analysis to analyse variable cost of borrowings. Management estimates that the Company’s variable interest costs are sensitive to the extent that a change in 50 basis points in the average funding cost would change interest cost on

ANNUAL REPORT 2015
NOTES TO THE fINaNCIaL STaTEMENTS for the year ended 31 December 2015 (continued)
46
borrowings by RO 0.446 million (2014 - RO 0.358 million). The Company’s exposure to interest rate risk is shown under note 25(a) to these financial statements.
(b) Credit risk
Credit risk is the risk that one party to a financial instrument will fail to discharge an obligation and cause the other party to incur a financial loss. Credit risk is crucial for the Company’s business; therefore management carefully manages its exposure to credit risk.
Credit risk measurement
The Company’s credit policy aims to ensure that the target portfolio credit loss will be less than 1% of the portfolio increase for the current year. The Board of Directors periodically reviews this loss norm along with the management.
In case of the portfolio of exposure to small and medium size enterprises (SMEs), the credit risk for individual counterparties are assessed at inception of the lease through a grading methodology based on repayment history along with financial evaluation of borrowers as per risk grading model as approved by the board of directors of the Company.
Credit risk in the case of the retail portfolio is assessed at the inception of the lease on the basis of the net disposable income of the counterparty, stability of employment in case of salaried clients and income levels from business /other sources for other categories of customers.
Credit risk control and mitigation policies
The Company has established credit policies and procedures to manage credit exposure including evaluation of lease, credit worthiness, credit approvals, assigning credit limits, obtaining securities such as lien on title on leased assets, security deposits, personal guarantees and mortgages over properties.
Exposure to credit risk is managed through regular analysis of the ability of lessees to meet repayment obligations.
Working capital finance and factoring receivables includes amounts advanced to clients in respect of debts factored interest on the amounts advanced and related charges. In the event of default in settlement of debts factored by customers of the client, the Company has recourse to the client.
The Company has clear policies in place to identify early warning signals and to initiate appropriate and timely remedial actions. Some of the early warning indicators are listed below:

ANNUAL REPORT 2015
NOTES TO THE fINaNCIaL STaTEMENTS for the year ended 31 December 2015 (continued)
47
• frequent dishonour of cheques;
• inability to reach the customer over phone or in person;
• lack of response to written communications;
• utilised limits in excess of authorised limits as disclosed by BCSB data;
• inability to obtain current financials; and
• adverse market feedback.
Maximum exposure to credit risk before collateral held or other credit enhancements:
2015 2014rO’000 RO’000
ExposureBank balances 827 1,691Statutory deposit 210 170Net investment in finance leases and working capital finance 126,686 107,306Available for sale financial asset 582 582Other receivables 16 16Total exposure 128,321 109,765
The above table represents a worst case scenario of credit risk exposure of the Company at 31 December 2015 and 2014 without taking into account any collateral held. The Company holds enforceable collaterals against net investments in finance lease to mitigate credit risk exposure.
Management is confident in its ability to continue to control and sustain acceptable exposure of credit risk to the Company resulting from its net investment in finance leases, statutory deposits and advances. For bank balances and security deposits, the Company deals with banks having a minimum short term grading of P-2.
Concentration of credit risk
Concentration of credit risk arises when a number of counter-parties are engaged in similar business activities, or activities in the same geographic region, or have similar economic features that would cause their ability to meet contractual obligations to be similarly affected by changes in economic, political or other conditions. Concentrations of credit risk indicate the relative sensitivity of the Company’s performance to developments affecting a particular industry or geographical location.
Concentrations of credit risk (whether on or off statement of financial position) that arise from financial instruments exist for groups of counter-parties when they have similar economic characteristics that would cause their ability to meet contractual obligations to

ANNUAL REPORT 2015
NOTES TO THE fINaNCIaL STaTEMENTS for the year ended 31 December 2015 (continued)
48
be similarly affected by changes in economic or other conditions. The analysis of credit risk is given below:
(i) Customer concentration
2015 2014
rO’000 RO’000
Gross investment in finance leases:
Individual 61,535 43,303
Corporate 86,546 81,307
148,081 124,610
Working capital finance and factoring receivables:
Individual - -
Corporate 5,788 5,044
5,788 5,044
Economic sector concentration of gross investment in finance leases and working capital finance
2015 2014
rO’000 RO’000
Gross investment in finance leases:
Manufacturing 5,623 5,815
Trading and construction 9,920 11,853
Services 71,003 63,639
Individual 61,535 43,303
148,081 124,610
Working capital finance and factoring receivables:
Manufacturing - 3
Trading and construction 1,416 1,946
Services 4,372 3,095
5,788 5,044

ANNUAL REPORT 2015
NOTES TO THE fINaNCIaL STaTEMENTS for the year ended 31 December 2015 (continued)
49
(iii) Geographical concentration
The Company only carries out business within the Sultanate of Oman and geographical exposure is within thecountry.
(c) Liquidity risk
Liquidity risk is the risk that the Company will be unable to meet its net funding requirements. Liquidity risk can be arise by market disruptions or credit downgrades, which may result in unavailability of certain sources of funding.
Sources of funding are regularly reviewed by the management, diversification through long-term and short-term borrowings, increasing the number of lenders, developing additional products like corporate deposits, seeking fixed interest rates for longer tenure, etc.
Fund management has been carried out by treasury function. It includes managing and monitoring day to day cash flows and funding needs. This is achieved through maintaining approved credit facilities to cover net future funding needs and monitoring cash flows projections. The maturity profile of the Company’s financial liabilities and net-settled derivative financial liabilities is set out under note 25(b) to these financial statements.
3.2 fair values estimation
The carrying amounts, less any estimated credit adjustments, for financial assets and liabilities with a maturity of less than one year are assumed to approximate their fair values. The fair values of long-term bank borrowings is considered to approximate their carrying amounts as these carry interest rates in line with current market rates or interest rates linked to LIBOR. The fair value of fixed deposits is not considered to be materially different from their carrying amount in view of the duration of these deposits which does not exceed 2 years.
Except for available for sale financial asset, the Company’s financial instruments are not carried in the statement of financial position at fair value. The Company’s all financial assets (other than available for sale financial assets) and financial liabilities are carried in the statement of financial position at amortised cost.
3.3 Capital management
The Company’s objectives when managing capital are to safeguard the Company’s ability to continue as a going concern in order to provide returns for shareholders and benefits for other stakeholders and to maintain an optimal capital structure to reduce the cost of capital.
In order to maintain the capital structure and to confirm to regulations, the Company may take appropriate strategic decisions.

ANNUAL REPORT 2015
NOTES TO THE fINaNCIaL STaTEMENTS for the year ended 31 December 2015 (continued)
50
Central Bank of Oman (CBO) requires all finance and leasing companies to maintain a minimum paid up capital of RO 25 million by 2016.
Gearing ratio
The Company’s Board Executive Committee reviews the capital structure on a quarterly basis. As part of this review, the committee considers the cost of capital and the risks associated with each class of capital. The Company has a limit of gearing ratio of 5 times as stipulated by the Capital Adequacy norms specified by the Central bank of Oman.
The gearing ratio including proposed cash dividend at the year-end was as follows:
2015 2014rO’000 RO’000
Total liabilities (RO’000) 95,316 78,254
Net equity (RO’000) 34,312 32,427
Net debt to net equityratio (times) 2.78 2.41
4 Cash and bank balances
2015 2014rO’000 RO’000
Current accounts 827 1,691Cash in hand 41 21
868 1,712
5 Net investment in finance leases and working capital finance
2015 2014
rO’000 RO’000
Gross investment in finance lease 148,081 124,610
Working capital finance and factoring receivables 5,788 5,044
Unearned lease income (18,834) (14,976)
135,035 114,678
Provision for impairment of lease receivables and Working capital finance (7,578) (6,741)
Unrecognised contractual income (771) (631)
126,686 107,306

ANNUAL REPORT 2015
NOTES TO THE fINaNCIaL STaTEMENTS for the year ended 31 December 2015 (continued)
51
(b) The table below represents analysis of gross lease receivables and present value of lease receivables for each of the following periods:
Up to 1 year
>1 year to 3
years>3 years Total
rO’000 rO’000 rO’000 rO’000
at 31 December 2015
Gross lease receivables and working capital finance
60,177 66,588 27,104 153,869
Present value of lease receivables 52,948 58,589 23,498 135,035
At 31 December 2014
Gross lease receivables and working capital finance
55,507 56,750 17,397 129,654
Present value of lease receivables 49,096 50,195 15,388 114,678
(c) The movement of unearned lease income during the year was as follows:
2015 2014
rO’000 RO’000
At 1 January 14,976 14,035
Additions during the year 14,705 11,127
Recognised during the year (10,847) (10,186)
At 31 December 18,834 14,976
(d) The movement in the provision for impairment of lease receivables and working capital finance during the year was as follows:
2015 2014
rO’000 RO’000
At 1 January 6,741 6,010
Charged during the year - net 818 648
Transferred from written-off provisions 19 83
At 31 December 7,578 6,741

ANNUAL REPORT 2015
NOTES TO THE fINaNCIaL STaTEMENTS for the year ended 31 December 2015 (continued)
52
(e) The movement in the unrecognised contractual income on lease finance and working capital during the year was as follows:
2015 2014
rO’000 RO’000
At 1 January 631 636
Charged during the year 278 270
Released during the year (138) (275)
At 31 December 771 631
As a matter of policy, the Company considers waiver / write-off or settlement only in such cases where it is satisfied that the recovery of the full outstanding liabilities from the borrower is not possible in the normal course of business or out of the securities realisation or through enforcement of the guarantee (wherever available) and that legal action will not yield higher recoveries after considering the time and costs involved.
Proposals for waivers / write-offs are not formula driven and are decided on a case by case basis after weighing all pros and cons. The rationale is invariably documented. In all cases, the Company aims to recover the maximum value through enforcement of collaterals / guarantees of guarantors, etc.
At 31 December 2015, impaired lease contract receivables and working capital receivables on which interest has been reserved or on which interest is not being accrued amount to approximately RO 8.154million (2014- RO 7.890 million). Interest is reserved by the Company against lease contract receivables and working capital receivables which are impaired, to comply with the rules, regulations and guidelines issued by the CBO.
The Company has made appropriate provision against impaired assets, which are secured against leased assets. At 31 December 2015, impairment losses would have increased by RO 4.291 million had benefit of collateral not been obtained by the Company for the impaired leases. Out of the total provision of RO 7.578 million (2014 - RO 6.741 million) for impairment, RO 5.222 million (2014 - RO 4.047 million) is against specific impaired finance leases and RO 2.356 million (2014 - RO 2.694 million) is portfolio provision and RO 0.771 million (2014 - RO 0.631 million) is unrecognised contractual income. Further information on the provisioning for impairment is given in note 5(d) to these financial statements.
The Company also takes into account the regulations issued by the Central Bank of Oman for assessing the provisioning requirements. Rentals overdue by 1 day but less than 90 days are considered past due and not impaired, unless other objective information is available to classify the receivable as impaired.

ANNUAL REPORT 2015
NOTES TO THE fINaNCIaL STaTEMENTS for the year ended 31 December 2015 (continued)
53
An analysis of impaired and non-impaired portfolio of lease finance and working capital is summarised below:
2015 2014
rO’000 RO’000
Neither past due nor impaired 115,467 95,885
Past due but not impaired 11,414 10,903
Impaired 8,154 7,890
Gross investment in finance leases and working capital finance 135,035 114,678
Provision for impairment of finance lease receivables and working capital finance (7,578) (6,741)
Unrecognised contractual income (771) (631)
Net investment in finance leases and working capital finance 126,686 107,306
past due but not impaired
2015 2014
rO’000 RO’000
Past due up to 30 days 6,077 5,645
Past due 30 - 60 days 3,592 2,846
Past due 60 - 89 days 1,745 2,412
11,414 10,903
Impaired
2015 2014
rO’000 RO’000
Specially mentioned (past due 90 - 179 days) 1,541 2,485
Substandard (past due 180 - 269 days) 699 590
Doubtful (past due 270 - 364 days) 618 991
Loss (more than 364 days) 5,296 3,824
8,154 7,890
Investment in lease finance and working capital finance rescheduled / restructured
Restructuring activities include extended payment arrangements, approved

ANNUAL REPORT 2015
NOTES TO THE fINaNCIaL STaTEMENTS for the year ended 31 December 2015 (continued)
54
external management plans, modification and deferral of payments. Restructuring policies and practices are based on indicators or criteria which, in the judgment of local management, indicate that payment will most likely continue.These policies are kept under continuous review. Restructured / rescheduled loans amounted to RO 378,509 at 31 December 2015 (2014-RO 349,455). Out of these four contracts (2014 - one contract) amounting to RO 367,268 are classified as Special Mention as on 31 December 2015 (2014 -RO 32,663). During the year, the Company has made an appropriate additional provision for impairment on its rescheduled/restructured lease contracts in accordance with circular dated 27 December 2015 issued by the Central Bank of Oman.
6 Other receivables and prepayments
2015 2014
rO’000 RO’000
Prepaid expenses 253 176
Unamortised dealer commission 398 -
Other receivables 16 16
667 192
7 available for sale financial asset
2015 2014
rO’000 RO’000
The Arab Leasing Company Limited
582 582
The movements in investment in securities classified as available for sale investment during the year is as follows:
2015 2014
rO’000 RO’000
At 1 January 582 791
Unrealised loss during the year - (209)
582 582
This represents unquoted investment classified as available for sale. As at 31 December 2015, the management of the company considers carrying amount of the investment approximate to its fair value. The fair value of the investment is determined based on theunaudited financial statements of the investee company as of 30 September 2015

ANNUAL REPORT 2015
NOTES TO THE fINaNCIaL STaTEMENTS for the year ended 31 December 2015 (continued)
55
using valuation techniques.As at 31 December 2015 and 2014, cost of investments was RO 519,000 whereas accumulated fair value reserve was RO 63,000.
8 Vehicles and equipment
Motor vehicles
Office equipment
furniture and fixtures Total
rO’000 rO’000 rO’000 rO’000Cost At 1 January 2015 71 727 465 1,263Additions during the year - 90 2 92at 31 December 2015 71 817 467 1,355
accumulated depreciationAt 1 January 2015 61 543 274 878Charge for the year 9 82 60 151at 31 December 2015 70 625 334 1,029
Net book valueat 31 December 2015 1 192 133 326
Motor vehicles
Office equipment
Furniture and fixtures Total
RO’000 RO’000 RO’000 RO’000
Cost
At 1 January 2014 85 560 298 943
Additions during the year - 167 167 334
Disposals during the year (14) - - (14)
At 31 December 2014 71 727 465 1,263
Accumulated depreciation
At 1 January 2014 64 470 233 767
Charge for the year 11 73 41 125
Write offs (14) - - (14)
At 31 December 2014 61 543 274 878
Net book value
At 31 December 2014 10 184 191 385

ANNUAL REPORT 2015
NOTES TO THE fINaNCIaL STaTEMENTS for the year ended 31 December 2015 (continued)
56
9 Statutory deposit
The Company is required to maintain a deposit of RO 210,000 (2014 - RO 170,000) with the Central Bank of Oman in accordance with the applicable licensing regulations. During the year, the deposit earned interest at the rate of 1% (2014 - 1.5%) per annum. In accordance with circular number FM 29 issued by the Central Bank of Oman on 15 June 2011, the Company has to increase statutory deposit by RO 40,000 every year to RO 250,000 before the end of year 2016.
10 Shareholders’equity
(a) Share capital
The authorised share capital of the Company comprises 300,000,000 ordinary shares of RO 0.100 each (2014 - 300,000,000 ordinary shares of RO 0.100 each). The Company’s issued and fully paid-up share capital comprises of 253,590,000 ordinary shares of RO 0.100 each (2014 -253,590,000 ordinary shares of RO 0.100 each). Central Bank of Oman’s requirement related to minimum paid up capital is set out under note 3.3 to these financial statements.
At 31 December, the shareholders who own 10% or more of the Company’s share capital were:
2015 2014
Share holding % Shares held
Share holding % Shares held
Oman Investment Fund 33.63 85,287,298 33.63 85,287,298
Arab Investment Company S.A.A 18.79 47,637,994 18.79 47,637,994
Iran Foreign Investment Company
12.49 31,685,320 12.49 31,685,320
(b) Legal reserve
In accordance with article 106 of the Commercial Companies Law of 1974, as amended annual appropriations of 10% of the profit for the year, are made to this legal reserve until the accumulated balance of the reserve is equal to one third of the Company’s paid up share capital. This reserve is not available for distribution.
(c) proposed dividend
Dividend is not accounted for until it has been approved at the Annual General

ANNUAL REPORT 2015
NOTES TO THE fINaNCIaL STaTEMENTS for the year ended 31 December 2015 (continued)
57
Meeting. Board of Directors on 30 January 2016, recommended 9.40% cash dividend amounting to RO 2,384 million (2014 - cash dividend RO 2.536 million) for shareholders’ approval at the AGM.
The financial statements for the year ended 31 December 2015 do not reflect this resolution, which will be accounted for in shareholders’ equity as an appropriation of retained profits for the year ending 31 December 2016.
11 Bank overdrafts and short term loans
The Company availed short term borrowing facilities from various commercial banks. The contractual limits of these borrowings are approximately RO 62.32 million (2014 - RO 54.55 million), which are entirely secured against pari-passu charges over the finance lease and working capital finance receivables of the Company. Interest on bank overdraft and short term bank loans ranged between 2.36% to 5.75% (2014 - 2.47% to 5.75%) per annum. Maturities of the bank overdrafts and short term loans are disclosed in note 25(b) to these financial statements.
The table below indicates the composition of the bank overdrafts and short term loans as at 31 December:
2015 2014
rO’000 RO’000
Bank overdrafts 2,549 2,094
Short-term loans 39,500 34,500
42,049 36,594
12 Long term loans
The Company has entered into long term loan facility agreements with commercial banks. The aggregate contractual limits of long term loans is RO 47.105 million (2014 - RO 45.52 million). These loans carry interest at rates ranging between 2.7% to 4.0% (2014 - 2.7% to 4.0%) per annum and are secured by a pari-passu charge over the total assets of the Company. The maturity dates of the afore mentioned facilities range from January 2016 to December 2018.
Current portion of long term loans as at 31 December 2015 amounted to RO 42.84 million (2014 - RO 18.80 million).
There is no default or breach of terms and conditions of the loan agreements during the year ended 31 December 2015 and 2014.

ANNUAL REPORT 2015
NOTES TO THE fINaNCIaL STaTEMENTS for the year ended 31 December 2015 (continued)
58
13 Corporate and security deposits
2015 2014
rO’000 RO’000
Corporate deposits 4,235 16,027
Security deposits 132 132
4,367 16,159
The Company accepts term deposits from corporate customers in accordance with the Central Bank of Oman guidelines for a minimum period of 12 months. The interest rates on corporate and security deposits ranges between 2.1% to 5.3% per annum (2014 2.25% to 5.0% per annum).
Security deposits are obtained against the working capital, factoring and lease facilities and include a deposit of RO 2,000 (2014 - RO 2,000) which is interest free.
14 Creditors, accruals and other liabilities
2015 2014rO’000 RO’000
Leased assets payable 3,753 4,242Accruals for expenses 768 769Accrued financial charges 253 458End of service benefits (note 14.1) 95 80Other liabilities 64 105
4,933 5,654
14.1 End of service benefits
This represents long term employees’ benefit. The movement in employees’ end of service benefits during the year is as follows:
2015 2014
rO’000 RO’000
At 1 January 80 75
Expense recognised in the statement of comprehensive income (note 16.1)
26 17
Payments during the year (11) (12)
At 31 December 95 80

ANNUAL REPORT 2015
NOTES TO THE fINaNCIaL STaTEMENTS for the year ended 31 December 2015 (continued)
59
15 Net assets per share (baizas)
Net assets per share is calculated by dividing the net assets at the yearend by the number of shares outstanding as follows:
2015 2014
rO’000 RO’000
Net assets (RO’000) 34,312 32,427
Number of ordinary shares outstanding at 31 December (Numbers 000)
253,590 253,590
Net assets per share (baizas) 135 128
16 General and administrative expenses
2015 2014
rO’000 RO’000
Personnel costs (note 16.1) 2,630 2,436
Occupancy costs 262 254
Communication costs 174 123
Professional fees and subscriptions 142 154
Directors’ remuneration and sitting fees (note 21) 142 108
Printing and stationery expenses 65 51
Advertising and sales promotion 63 86
Travelling expenses 59 61
Collection and recovery expenses 21 8
Donations 20 5
IT maintenance and license fees 18 11
Annual general meeting expenses 7 22
Insurance 6 2
Other office expenses 20 50
3,629 3,371

ANNUAL REPORT 2015
NOTES TO THE fINaNCIaL STaTEMENTS for the year ended 31 December 2015 (continued)
60
16.1 Components of personnel costs
2015 2014
rO’000 RO’000
Wages and salaries 2,150 1,979
Other benefits 326 349
Contribution to the Public Authority for Social Insurance 128 91
Charge for end of service benefits (note 14.1) 26 17
2,630 2,436
17 Other operating income
2015 2014
rO’000 RO’000
Insurance charges 373 220
Services charges 350 355
Foreclosure charges 103 72
Dividend and other income 32 33
Liabilities no longer payable written back - 101
858 781
18 Taxation
(a) Components of income tax expense:
2015 2014
rO’000 RO’000
Current tax - current year 617 565
Deferred tax- current year 45 40
Income tax expense 662 605
(b) Breakup of tax liability is as follows:
2015 2014
rO’000 RO’000
Current liability
Current year 617 565
Prior years 513 479
1,130 1,044

ANNUAL REPORT 2015
NOTES TO THE fINaNCIaL STaTEMENTS for the year ended 31 December 2015 (continued)
61
(c) Reconciliation of tax expense
The Company has provided for taxation in accordance with the income tax laws of the Sultanate of Oman at the rate of 12% of taxable profits in excess of RO 30,000. The following is a reconciliation of income taxes calculated on accounting profits at the applicable tax rates with the income tax expense for the year:
2015 2014
rO’000 RO’000
Accounting profit before taxation 5,083 4,488
Income tax expense computed at applicable tax rates 606 535
Items not deductible (net) in determining taxable profits 11 30
Tax effect of deferred tax assets 45 40
Income tax expense 662 605
(d) The movement in taxation liability is as follows:
2015 2014
rO’000 RO’000
At 1 January 1,044 1,024
Current tax for the year 617 565
Paid during the year (531) (545)
At 31 December 1,130 1,044
(e) Status of the tax assessments
The tax returns of the Company for the tax years 2010 to 2014 have not yet been agreed with the Secretariat General for Taxation at the Ministry of Finance. The Company has taken the effect in current year for all open tax assessments based on finalisation of that assessment. The management is of the opinion that any other additional taxes, if any, related to the open tax years would not be significant to the Company’s financial position as at 31 December 2015.
(f) Deferred tax asset
Deferred income taxes are calculated on all temporary differences using a principal tax rate of 12 % (2014 - 12%). Deferred tax assets and the deferred tax charge in the statement of comprehensive income are attributable to provisions. Details of recognised deferred tax asset are as follows:

ANNUAL REPORT 2015
NOTES TO THE fINaNCIaL STaTEMENTS for the year ended 31 December 2015 (continued)
62
1 January 2015
recognised in statement of
comprehensive income
31 December
2015
rO’000 rO’000 rO’000
Vehicles and equipment 11 (5) 6
Provision for impairment of lease receivables 323 (40) 283
Deferred tax asset 334 (45) 289
1 January 2014
Recognised in statement of
comprehensive income
31 December
2014
RO’000 RO’000 RO’000
Vehicles and equipment 4 7 11
Provision for impairment of lease receivables 370 (47) 323
Deferred tax asset 374 40 334
19 Basic and diluted earnings per share (baizas)
Basic earnings per share is calculated by dividing the net income attributable to shareholders of the year by the weighted average number of shares arrived after taking effect of bonus shares issued during the year 2015.
2015 2014rO 000 RO 000
Profit for the year (RO’000) 4,421 3,883
Weighted average number of shares (Numbers 000) 253,590 253,590
Basic earnings per share (baizas) 17.67 15.31
No figure for diluted earnings per share has been presented because the Company has not issued any instruments which would have an impact on earnings per share when exercised.

ANNUAL REPORT 2015
NOTES TO THE fINaNCIaL STaTEMENTS for the year ended 31 December 2015 (continued)
63
20 related party transactions
Related parties comprise the shareholders, directors, key business personnel and business entities in which they have the ability to control or exercise significant influence in financial and operating decisions. Pricing policies and terms of these transactions are approved by the Company’s management.
The Company maintains significant balances with these related parties which arise in the normal course of business and are entered into at terms and condition which the management considers to be comparable with those adopted for arm’s length transactions with third parties.
The Company has entered into transactions in the ordinary course of business with other related parties in which certain directors have a significant influence and with senior management. The terms and conditions of these transactions are mutually agreed. During the year, the following transactions were carried out with related parties:
2015 2014rO 000 RO 000
Transactions with related parties:Interest on corporate deposits 53 282Occupancy costs 140 130Finance income 1 1
related party balances:Net investment in finance leases 16 18Corporate and security deposits - 6,350Available for sale financial asset 582 582
21 Compensation of key management personnel
Key management personnel are those persons having authority and responsibility for planning, directing and controlling the activities of the Company, directly or indirectly, including any Director (whether executive or otherwise). The remuneration of directors and other members of key management during the year was as follows:
2015 2014rO 000 RO 000
Salaries and other benefits to key management personnel 373 385
Directors’ remuneration (note 16) 56 39
Directors’ sitting fees (note 16) 86 69

ANNUAL REPORT 2015
NOTES TO THE fINaNCIaL STaTEMENTS for the year ended 31 December 2015 (continued)
64
22 Contingent liabilities
The Company has given counter guarantee to a commercial bank to the extent of RO 373,650 (2014 - RO 483,354) in respect of performance bonds, advance payment guarantees, letter of credits, etc. issued by the banks on behalf of the Company’s customers.
23 fair value information
Based on the valuation methodology outlined below, the fair value of all on and off-statement of financial position financial instruments at 31 December 2015 is considered by the management not to be materially different to their carrying values.
Estimation of fair values
The following summarises the major methods and assumptions used in estimating the fair value of assets and liabilities:
Investment in finance leases and working capital finance
Fair value is calculated based on discounted expected future principal and interest cash flows. Repayments are assumed to occur at contractual repayment dates, where applicable. For finances that do not have fixed repayment dates or that are subject to prepayment risk, repayments are estimated based on experience in previous periods when interest rates were at levels similar to current levels, adjusted for any differences in interest rate outlook. Expected future cash flows are estimated considering credit risk and any indication of impairment. Expected future cash flows for homogeneous categories of finances are estimated on a portfolio basis and discounted at current rates offered for similar loans to new borrowers with similar credit profiles. The estimated fair values of finances reflect changes in credit status since the finances were made and changes in interest rates in the case of fixed rate loans.
Corporate and security deposits
The estimated fair value of fixed-maturity deposits is based on discounted cash flows using rates currently offered for deposits of similar remaining maturities. The value of long-term relationships with depositors is not taken into account in estimating fair values.
available for sale financial asset
Fair value is calculated based on discounted expected future cash flows which are based on dividends received historically by the Company. The cash flows have been discounted using market rate of interest.

ANNUAL REPORT 2015
NOTES TO THE fINaNCIaL STaTEMENTS for the year ended 31 December 2015 (continued)
65
Off-statement of financial position financial instruments
No fair value adjustment is made with respect to credit-related off statement of financial position financial instruments, which include counter guarantees and standby letters of credit, as the related future income streams materially reflect contractual fees and commissions actually charged at the reporting date for agreements of similar credit standing and maturity.
fair value versus carrying amounts
The fair value of the financial assets and liabilities approximates their carrying value as stated in the statement of financial position.
fair value measurements recognised in the statement of financial position:
The following table provides an analysis of financial instruments that are measured subsequent to initial recognition at fair value, grouped into Levels 1 to 3 based on the degree to which the fair value is observable:
• Level 1 fair value measurements are those derived from quoted prices (unadjusted) in active markets for identical assets or liabilities;
• Level 2 fair value measurements are those derived from inputs other than quoted prices included within Level 1 that are observable for the asset or liability, either directly (i.e. as prices) or indirectly (i.e. derived from prices); and
• Level 3 fair value measurements are those derived from valuation techniques that include inputs for the asset or liability that are not based on observable market data (unobservable inputs).
2015Level 1 Level 2 Level 3 TotalrO’000 rO’000 rO’000 rO’000
Available for sale financial asset
Un-quoted investment - - 582 582
2014
Level 1 Level 2 Level 3 Total
RO 000 RO 000 RO 000 RO 000
Available for sale financial asset
Un-quoted investment - - 582 582
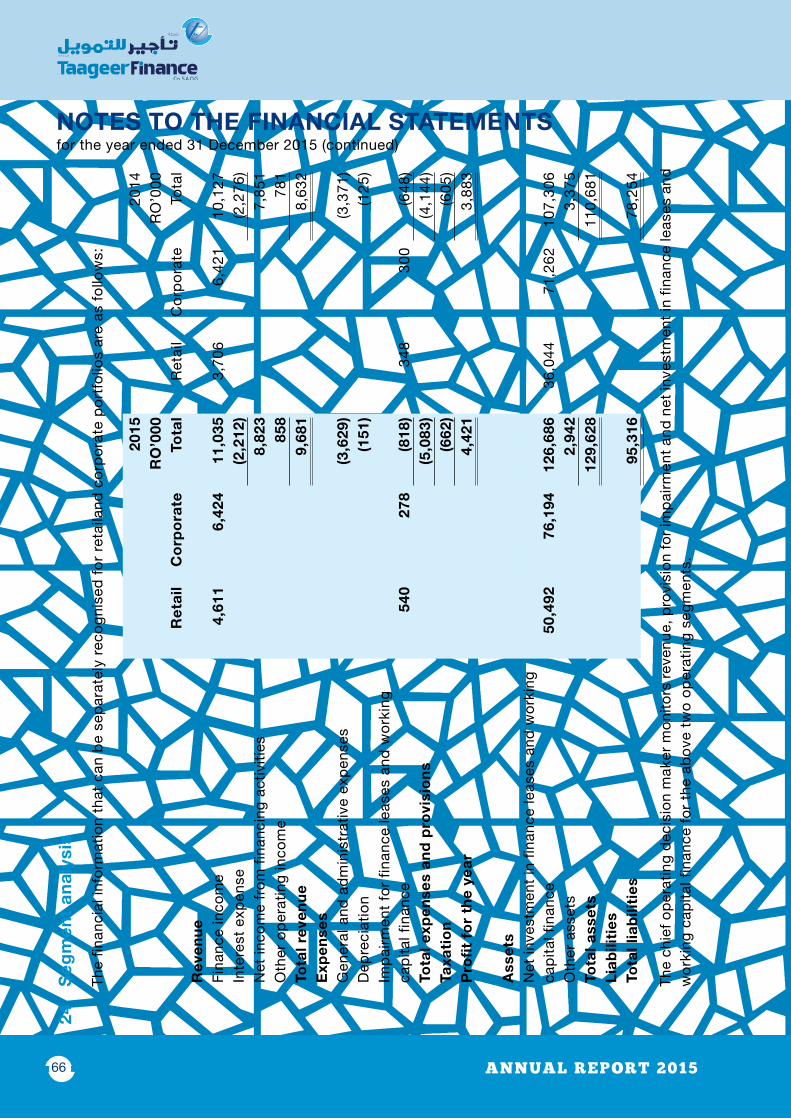
ANNUAL REPORT 2015
NOTES TO THE fINaNCIaL STaTEMENTS for the year ended 31 December 2015 (continued)
66
24
Seg
men
t an
alys
is
Th
e fin
anci
al in
form
atio
n th
at c
an b
e se
par
atel
y re
cogn
ised
for
ret
aila
nd c
orp
orat
e p
ortf
olio
s ar
e as
fol
low
s:
2015
20
14r
O’0
00R
O’0
00r
etai
lC
orp
ora
teTo
tal
Ret
ail
Cor
por
ate
Tota
lr
even
ueFi
nanc
e in
com
e4,
611
6,42
411
,035
3,70
66,
421
10,1
27In
tere
st e
xpen
se(2
,212
)(2
,276
)N
et in
com
e fr
om f
inan
cing
act
iviti
es8,
823
7,85
1O
ther
op
erat
ing
inco
me
858
781
Tota
l rev
enue
9,68
18,
632
Exp
ense
sG
ener
al a
nd a
dm
inis
trat
ive
exp
ense
s(3
,629
)(3
,371
)D
epre
ciat
ion
(151
)(1
25)
Imp
airm
ent
for
finan
ce le
ases
and
wor
king
ca
pita
l fin
ance
540
278
(818
)34
830
0(6
48)
Tota
l exp
ense
s an
d p
rovi
sio
ns(5
,083
)(4
,144
)Ta
xati
on
(662
)(6
05)
pro
fit
for
the
year
4,42
13,
883
ass
ets
Net
inve
stm
ent
in f
inan
ce le
ases
and
wor
king
ca
pita
l fin
ance
50,4
9276
,194
126,
686
36,0
4471
,262
107,
306
Oth
er a
sset
s2,
942
3,37
5To
tal a
sset
s12
9,62
811
0,68
1Li
abili
ties
Tota
l lia
bili
ties
95,3
1678
,254
Th
e ch
ief o
per
atin
g d
ecis
ion
mak
er m
onito
rs re
venu
e, p
rovi
sion
for
imp
airm
ent a
nd n
et in
vest
men
t in
finan
ce le
ases
and
w
orki
ng c
apita
l fin
ance
for
the
ab
ove
two
oper
atin
g se
gmen
ts.

ANNUAL REPORT 2015
NOTES TO THE fINaNCIaL STaTEMENTS for the year ended 31 December 2015 (continued)
67
25
fina
ncia
l Ins
trum
ents
and
fin
anci
al r
isk
man
agem
ent
(a)
Inte
rest
rat
e ris
k
Th
e ta
ble
bel
ow s
umm
aris
es th
e C
omp
any’
s ex
pos
ure
to in
tere
st ra
te ri
sks.
Incl
uded
in th
e ta
ble
are
the
Com
pan
y’s
asse
ts a
nd li
abili
ties
at c
arry
ing
amou
nts,
cat
egor
ised
by
the
earli
er o
f con
trac
tual
rep
risin
g or
mat
urity
dat
es a
s on
31
Dec
emb
er 2
015
and
201
4:
0 -
30
day
s31
- 1
80
day
s18
1 -
365
day
s1
- 3
year
sO
ver
3 ye
ars
No
n in
tere
st
rate
se
nsit
ive
Tota
l
rO
000
rO
000
rO
000
rO
000
rO
000
rO
000
rO
000
31 D
ecem
ber
201
5fi
nanc
ial a
sset
sC
ash
and
ban
k b
alan
ces
--
--
-86
886
8N
et
inve
stm
ent
in
finan
ce
leas
es
and
wor
king
cap
ital f
inan
ce5,
623
22,7
9721
,265
54,9
7822
,023
-12
6,68
6
Oth
er r
ecei
vab
les
--
--
-16
16A
vaila
ble
for
sal
e fin
anci
al a
sset
--
--
-58
258
2S
tatu
tory
dep
osit
--
--
-21
021
0To
tal f
inan
cial
ass
ets
5,62
322
,797
21,2
6554
,978
22,0
231,
676
128,
362
fina
ncia
l lia
bili
ties
Ban
k ov
erd
raft
s an
d
shor
t te
rm
loan
s17
,620
24,4
29-
--
-42
,049
Cre
dito
rs,
accr
uals
an
d
othe
r lia
bili
ties
--
--
-4,
838
4,83
8
Cor
por
ate
and
sec
urity
dep
osits
322,
265
2,07
0-
--
4,36
7Lo
ng t
erm
loan
s-
14,8
0716
,194
11,8
36-
-42
,837
Tota
l fin
anci
al li
abili
ties
17,6
5241
,501
18,2
6411
,836
-4,
838
94,0
91In
tere
st r
ate
sens
itiv
e g
ap(1
2,02
9)(1
8,70
4)3,
001
43,1
4222
,023
(3,1
62)
Cum
ulat
ive
gap
(12,
029)
(30,
733)
(27,
732)
15,4
1037
,433
34,2
71

ANNUAL REPORT 2015
NOTES TO THE fINaNCIaL STaTEMENTS for the year ended 31 December 2015 (continued)
68
0 -
30
day
s31
- 1
80
day
s18
1 -
365
day
s1
- 3
year
sO
ver
3 ye
ars
Non
in
tere
st
rate
se
nsiti
veTo
tal
RO
000
RO
000
RO
000
RO
000
RO
000
RO
000
RO
000
31 D
ecem
ber
201
4Fi
nanc
ial a
sset
sC
ash
and
ban
k b
alan
ces
--
--
-1,
712
1,71
2N
et
inve
stm
ent
in
finan
ce
leas
es
and
wor
king
cap
ital f
inan
ce5,
119
21,3
4720
,086
47,5
9813
,156
-10
7,30
6O
ther
rec
eiva
ble
s-
--
--
1616
Ava
ilab
le f
or s
ale
finan
cial
ass
et-
--
--
582
582
Sta
tuto
ry d
epos
it-
--
--
170
170
Tota
l fin
anci
al a
sset
s5,
119
21,3
4720
,086
47,5
9813
,156
2,48
010
9,78
6
Fina
ncia
l lia
bili
ties
Ban
k ov
erdr
afts
and
sho
rt te
rm lo
ans
20,1
4816
,466
--
--
36,5
94C
redi
tors
, acc
rual
s an
doth
er li
abili
ties
--
--
-5,
574
5,57
4C
orp
orat
e an
d s
ecur
ity d
epos
its2,
032
4,15
08,
400
1,57
7-
-16
,159
Long
ter
m lo
ans
-5,
625
5,00
38,
175
--
18,8
03To
tal f
inan
cial
liab
ilitie
s22
,180
26,2
2113
,403
9,75
2-
5,57
477
,130
Inte
rest
rat
e se
nsiti
ve g
ap(1
7,06
1)(4
,874
)6,
683
37,8
4613
,156
(3,0
94)
32,6
56C
umul
ativ
e ga
p(1
7,06
1)(2
1,93
5)(1
5,25
2)22
,594
35,7
5032
,656
N
et in
vest
men
t in
fin
ance
leas
e an
d w
orki
ng c
apita
l fin
ance
car
ries
an in
tere
st r
angi
ng b
etw
een
3.00
% t
o 19
.00%
(2
014
-3.3
4% t
o 16
.53%
) p
er a
nnum
. In
tere
st r
ates
for
all
othe
r in
tere
st b
earin
g fin
anci
al a
sset
s an
d f
inan
cial
lia
bili
ties
are
dis
clos
ed in
the
res
pec
tive
note
s to
the
se f
inan
cial
sta
tem
ents
.
(b)
Liq
uid
ity r
isk
Th
e am
ount
s d
iscl
osed
in
tab
le b
elow
ana
lyse
s th
e C
omp
any’
s as
sets
and
lia
bili
ties
as o
n 31
Dec
emb
er 2
015
and
201
4 in
to r
elev
ant
mat
urity
gro
upin
gs b
ased
on
the
rem
aini
ng p
erio
d a
t th
e re
por
ting
dat
e to
the
con
trac
tual
m
atur
ity d
ate.
The
am
ount
s d
iscl
osed
are
the
cont
ract
ual u
ndis
coun
ted
cas
h flo
ws.
Bal
ance
s d
ue w
ithin
12
mon
ths
equa
l the
ir ca
rryi
ng b
alan
ces,
as
the
imp
act
of t
he d
isco
untin
g is
not
sig
nific
ant.

ANNUAL REPORT 2015
NOTES TO THE fINaNCIaL STaTEMENTS for the year ended 31 December 2015 (continued)
69
0 -
30
day
s31
- 1
80
day
s18
1 -
365
day
s1
- 3
year
sO
ver
3 ye
ars
No
n-fi
xed
mat
urit
yTo
tal
rO
000
rO
000
rO
000
rO
000
rO
000
rO
000
rO
000
2015
fina
ncia
l ass
ets
Cas
hand
ban
k b
alan
ces
--
--
--
868
Net
in
vest
men
t in
fin
ance
le
ases
an
d w
orki
ng c
apita
l fin
ance
5,62
322
,797
21,2
6554
,978
22,0
23-
126,
686
Oth
er r
ecei
vab
les
--
--
-16
16A
vaila
ble
for
sal
e fin
anci
al a
sset
--
--
-58
258
2S
tatu
tory
dep
osit
--
--
-21
021
0N
on-
fina
ncia
l ass
ets
Pre
pay
men
ts-
--
--
651
651
Def
erre
d t
ax-
--
--
289
289
Vehi
cle
and
eq
uip
men
t-
--
--
326
326
Tota
l ass
ets
5,62
322
,797
21,2
6554
,978
22,0
232,
074
129,
628
Eq
uity
Sha
re c
apita
l and
res
erve
s-
--
--
34,3
1234
,312
Fina
ncia
l lia
bili
ties
Ban
k ov
erdr
afts
and
sho
rt te
rm lo
ans
17,6
2024
,429
--
--
42,0
49C
redi
tors
, acc
rual
s an
d ot
her l
iabi
litie
s-
--
--
-4,
838
Cor
por
ate
and
sec
urity
dep
osits
322,
265
2,07
0-
--
4,36
7Lo
ng t
erm
loan
s-
14,8
0716
,194
11,8
3642
,837
No
n-fi
nanc
ial l
iab
iliti
esE
nd o
f se
rvic
e b
enef
its-
--
-95
-95
Tax
pay
able
1,13
0-
--
--
1,13
0To
tal e
qui
ty a
nd li
abili
ties
18,7
8241
,501
18,2
6411
,836
9534
,312
129,
628
Liq
uid
ity
gap
(13,
159)
(18,
704)
3,00
143
,142
21,9
28(3
2,23
8)-
Cum
ulat
ive
liqui
dit
y g
ap(1
3,15
9)(3
1,86
3)(2
8,86
2)14
,280
36,2
08-
-

ANNUAL REPORT 2015
NOTES TO THE fINaNCIaL STaTEMENTS for the year ended 31 December 2015 (continued)
70
0 -
30
day
s31
- 1
80
day
s18
1 -
365
day
s1
- 3
year
sO
ver
3 ye
ars
Non
-fix
ed
mat
urity
Tota
lR
O 0
00R
O 0
00R
O 0
00R
O 0
00R
O 0
00R
O 0
00R
O 0
0020
14Fi
nanc
ial a
sset
sC
ash
and
ban
k b
alan
ces
1,71
2-
--
--
1,71
2N
et
inve
stm
ent
in
finan
ce
leas
es
and
wor
king
cap
ital f
inan
ce5,
119
21,3
4720
,086
47,5
9813
,156
-10
7,30
6O
ther
rec
eiva
ble
s-
--
--
1616
Ava
ilab
le f
or s
ale
finan
cial
ass
et-
--
--
582
582
Sta
tuto
ry d
epos
it-
--
--
170
170
Non
-fin
anci
al a
sset
sP
rep
aym
ents
--
--
-17
617
6D
efer
red
tax
--
--
-33
433
4Ve
hicl
e an
d e
qui
pm
ent
--
--
-38
538
5To
tal a
sset
s6,
831
21,3
4720
,086
47,5
9813
,156
1,66
311
0,68
1
Eq
uity
Sha
re c
apita
l and
res
erve
s-
--
--
32,4
2732
,427
Fina
ncia
l lia
bili
ties
Ban
k ov
erdr
afts
and
sho
rt te
rm lo
ans
20,1
4816
,446
--
--
36,5
94C
redi
tors
, acc
rual
s an
d ot
her l
iabi
litie
s2,
465
3,10
9-
--
-5,
574
Cor
por
ate
and
sec
urity
dep
osits
2,03
24,
150
8,40
01,
577
--
16,1
59Lo
ng t
erm
loan
s-
5,62
55,
003
8,17
5-
-18
,803
Non
-fin
anci
al li
abili
ties
End
of
serv
ice
ben
efits
--
--
-80
80Ta
x p
ayab
le1,
044
--
--
-1,
044
Tota
l eq
uity
and
liab
ilitie
s25
,689
29,3
3013
,403
9,75
2-
32,5
0711
0,68
1Li
qui
dity
gap
(18,
858)
(7,9
83)
6,68
337
,846
13,1
56(3
0,84
4)-
Cum
ulat
ive
liqui
dity
gap
(18,
858)
(26,
841)
(20,
158)
17,6
8830
,844
--
Th
e C
omp
any
hasu
nutil
ised
cre
dit
faci
litie
s as
at
rep
ortin
g d
ate
to m
itiga
te t
he im
pac
t of
neg
ativ
e m
ism
atch
.
26
Co
rres
po
ndin
gfi
gur
es
C
erta
in c
orre
spon
din
g in
form
atio
n ha
s b
een
recl
assi
fied
to
conf
orm
to
the
pre
sent
atio
n ad
opte
d i
n th
ese
finan
cial
st
atem
ents
. The
rec
lass
ifica
tion
imp
act
on t
he r
epor
ted
pro
fit o
r eq
uity
is n
ot c
onsi
der
ed a
s m
ater
ial.
Rep
ort
of t
he a
udito
rs is
set
for
th o
n p
age
1.

ANNUAL REPORT 2015 71
Corporate Social responsibility(al Noor association for the Blind)

ANNUAL REPORT 201572
45th National Day Celebration, 18th November 2015