CIB TG66 North America Webinar 2010-10-12 4 Evangelina Hirata

A COMPARISON OF TWO VISUAL SURVEY TECHNIQUES
FOR FISH POPULATIONS
S. Laurie Sanderson, Project Director
and Allan C. Solonsky
with
J e f f M. Burgett Janice S. Hirata
Kay N. Kadowaki K u r t E. Kawamoto Dennis L. Kees Cynthia L. Kleh
Frank W. Rumbaugh Victor ia M. Sanborn
Student-Originated Studies Program National Science Foundation
Grant No. SPI-7905347
Marine Affairs Coordinator S t a t e of H a w a i i
Task Order No. 195
May 1980

TABLE O F CONTENTS
ABSTRACT . . . . . . . . . . . . . . . . . . . . . . . . . . . . . . . 1
I . INTRODUCTION . . . . . . . . . . . . . . . . . . . . . . . . . . . 2
I1 . FIELD METHODS
A . P a r t i c i p a n t P r e p a r a t i o n . . . . . . . . . . . . . . . . . . . . 5
B . Fish Surveys
1 . B r o c k Surveys . . . . . . . . . . . . . . . . . . . . . . . 6
2 . Jones a n d T h o m p s o n S u r v e y s . . . . . . . . . . . . . . . . . 6
3 . M o d i f i c a t i o n s . . . . . . . . . . . . . . . . . . . . . . . 7
4 . H a n a u m a B a y F i e l d w o r k . . . . . . . . . . . . . . . . . . . 8
5 . M o l o k a i F i e l d w o r k . . . . . . . . . . . . . . . . . . . . . 8
C . A l g a e and C o r a l Surveys . . . . . . . . . . . . . . . . . . . . 10
. I11 S T A T I S T I C = METHODS . . . . . . . . . . . . . . . . . . . . . . 1 2
I V . RESULTS AND DISCUSSION
A . C o r r e l a t i o n B e t w e e n M e t h o d s . . . . . . . . . : . . . . . . . . 15 B . C o r r e l a t i o n Within M e t h o d s . . . . . . . . . . . . . . . . . . 17
C . N u m b e r of Species O b s e r v e d . . . . . . . . . . . . . . . . . . 19
D . Minimal N u m b e r of R e p l i c a t e Surveys . . . . . . . . . . . . . . 2 0
E . O b s e r v e r D i f f e r e n c e s . D a i l y D i f f e r e n c e s . . . . . . . . . . . . 2 2
. . . . . F . Sens i t i v i t y to D i s t i n c t i o n s B e t w e e n Fish C o m m u n i t i e s 2 5
. V SUMMARY AND CONCLUSIONS . . . . . . . . . . . . . . . . . . . . . 28
ACKNOWLEDGEMENTS . . . . . . . . . . . . . . . . . . . . . . . . . . . 43
REFERENCES C I T E D . . . . . . . . . . . . . . . . . . . . . . . . . . . 45
APPENDIX A . . . . . . . . . . . . . . . . . . . . . . . . . . . . . . 47
APPENDIX B . . . . . . . . . . . . . . . . . . . . . . . . . . . . . . 54

LIST OF TABLES
. . . . . 1. Procedure for conducting of f i s h surveys a t Hanauma Bay 32
Appendix A
A. Coordinates and depths for Molokai survey s i t e s . . . . . . . . . 52
Appendix B
A. Percent cover of predominant coral species and substrata a t Molokai s i t e s . . . . . . . . . . . . . . . . . . 58
B. Percent cover of predominant algae species and substrata a t Molokai s i t e s . . . . . . . . . . . . . . . . . . 62
C. Predominant f i s h species a t Molokai s i t e s by percent of t o t a l number of individual f i s h . . . . . . . . . . 67

LIST OF FIGURES
1 . Mapof theHawai ian Islands . . . . . . . . . . . . . . . . . . . 33
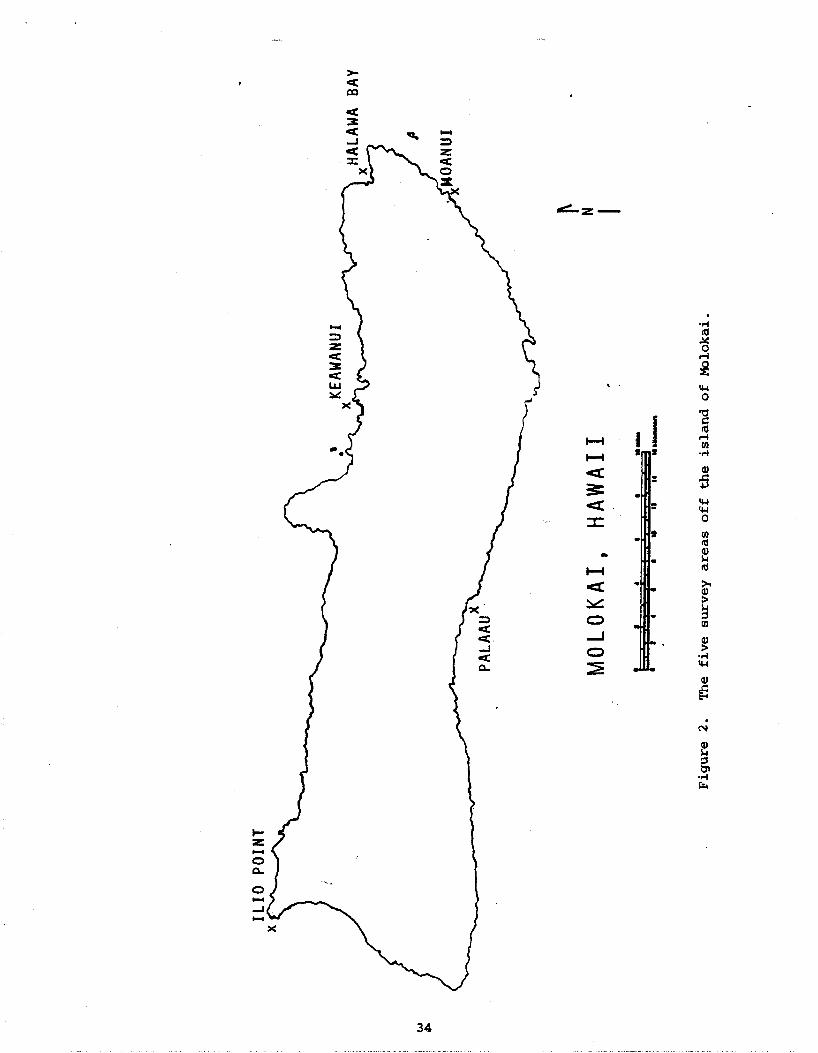
2 . The f i v e survey areas off the i s land of Molokai . . . . . . . . . 34
4 . Frequency histogram f o r da ta col lected . . . . . . . . . by two observer teams a t f i v e areas off Molokai 36
5 . Frequency d i s t r i bu t ions f o r cor re la t ion coe f f i c i en t s calculated between methods . . . . . . . . . . . . . . . . . . . . 37
6 . ist tog ram of cor re la t ion coef f ic ien ts . . . . . . . . . . . . . . . . . . . . calculated within methods 38
7 . Frequency d i s t r i bu t ions f o r cor re la t ion coe f f i c i en t s calculated between Jones and Thompson surveys and between Brock surveys . . . . . . . . . . . . . . . . . . . . . . 39
8 . Sample of a cumulative species-repl icate curve . . . . . . . . . . 40
9 . Frequency d i s t r i bu t ions f o r cor re la t ion coe f f i c i en t s calculated between Jones and Thompson surveys . . . . . . . . . . 4 1
10 . Frequency d i s t r i bu t ions f o r cor re la t ion coef f ic ien ts calculated between s ing le surveys and
. . . . . . . . . . . . . . . . . . . . . between averaged surveys 42
Appendix A
. . . . . . . . . . . . . . . . . . . . . . A . Survey s i t e s a t P a l a a u 47
B . Survey s i t e s a t Moanui . . . . . . . . . . . . . . . . . . . . . . 48
. . . . . . . . . . . . . . . . . . . . C . Survey s i t e s a t Halawa Bay 49
D . Survey s i t e s atKeawanui . . . . . . . . . . . . . . . . . . . . . 50
E . Survey s i t e s a t I l i o P o i n t . . . . . . . . . . . . . . . . . . . . 51
iii

A . Dendrogram of cora l surveys . . . . . . . . . . . . . . . . . . . 56
B . Simi l a r i t yma t r ix f o r coral surveys . . . . . . . . . . . . . . . 57
. C Dendrogram of algae surveys . . . . . . . . . . . . . . . . . . . 60
D . Simi la r i ty matrix f o r algae surveys . . . . . . . . . . . . . . . 61
E . Dendrogram of f i s h surveys . . . . . . . . . . . . . . . . . . . . 65
F . Simi la r i ty matrix f o r f i s h surveys . . . . . . . . . . . . . . . . 66

ABSTRACT
Two visual census techniques f o r describing and quantifying f i s h communities, the "Brock method" and the "Jones and Thompson method," were compared i n terms of r e p l i c a b i l i t y , observer b ias , minimal number of rep l ica te surveys required t o adequately represent the species composition of a spec i f i c f i s h community under study, da i ly var ia t ions i n the data , and s e n s i t i v i t y t o d i s t i nc t ions between f i s h communities. In addit ion, the degree of cor re la t ion between surveys of the two methods was calculated. More than 250 surveys of each method were conducted a t f i ve s i t e s o f f Molokai, Hawaii and a t Hanauma Bay off Oahu, Hawaii.
Molokai res idents have voiced concern regarding the increasing and conf l ic t ing uses of marine resources. Since coas ta l zone management decisions made by government agencies a r e based i n p a r t on marine resource assessments, baseline da ta on f i s h , algae, and cora l populations were acquired a t the f i v e previously unstudied Molokai s i t e s .
Spearman rank cor re la t ion coef f ic ien ts were calculated between s ing le surveys of each method and between the averages of four r ep l i ca t e surveys of each method. These analyses w e r e performed on the abundance ranking of each species recorded by the two survey techniques. When four surveys were averaged, an increase i n the cor re la t ion within methods was r e f l ec t ed i n an increase i n the cor re la t ion between methods. This d i r e c t re la t ion- ship suggested t h a t r ep l i ca t e surveys of each method-approached accuracy.
The cor re la t ion coef f ic ien ts f o r Jones and Thompson surveys were s ign i f i can t ly lower than those fo r Brock surveys, indicat ing t h a t t he r e s u l t s of Jones and Thompson surveys were more var iable . A s i gn i f i can t dif ference between data col lected by d i f f e r e n t Jones and Thompson observers suggested t h a t observer b i a s was responsible i n p a r t f o r the lower r ep l i cab i l i t y .
The mean number of species recorded per survey and the t o t a l number of species recorded per s i t e were approximately equal f o r the two methods. Consequently, the minimal number of r ep l i ca t e surveys required t o ade- quately represent the species composition of the community under study would be approximately equal fo r the two methods. There were no s t a t i s - t i c a l l y s ign i f i can t da i ly var ia t ions i n the data. The two methods were equally sens i t ive t o d i s t i nc t ions between f i s h connnunities.
Both the Brock method and the Jones and Thompson method a re va l id v i sua l survey techniques. When an area is under intensive study and repl icable surveys a r e e s sen t i a l , the Brock method should be used. I n cases where the length of each individual f i s h must be noted t o obtain biomass approximations, the Brock method must be used. When ava i lab le f i e l d time is minimal and the main object ive is t o character ize f i s h com- munities so t h a t s i t e s can be dist inguished on t h a t bas i s , the Jones and Thompson method is more cost-effective. The Jones and Thompson method would a l so be preferred when bottom time is a c r i t i c a l l y l imi t ing f a c t o r o r when conditions of strong current , heavy surge, o r extreme v e r t i c a l r e l i e f p rohib i t the s e t t i n g of a t r ansec t l i ne .

I. INTRODUCTION
The 1,207 km of coas t l ine surrounding the Hawaiian Is lands a re an
invaluable l oca l and nat ional resource i n terms of commercial and subsis-
tence f i s h e r i e s , aquaculture, t ranspor ta t ion , waste disposal , rec rea t ion ,
and tourism. As the res iden t population and the number of v i s i t o r s r i s e
s t ead i ly , increasing and of ten conf l ic t ing demands a re made on marine
resources. Consideration of the impact of these demands requires a
knowledge of basel ine conditions i n the nearshore environment. Coastal
zone management decisions made by government agencies a re based i n p a r t
on marine resource assessments, including censuses of f i s h , a lgae, and
cora l populations.
Numerous survey techniques have been described (Russell , Talbot,
Anderson, & Goldman, 1978) bu t comparisons between these techniques a r e
lacking and information on r e l a t i v e s e l e c t i v i t y o r b i a s is not ava i lab le .
To assure a sound data base, comparative s tud ies of survey methodologies
a r e needed.
Two frequently employed v i sua l survey techniques f o r f i s h populations,
t he "Brock method" (Brock, 1954) and the "Jones and Thompson method"
(Jones & Thompson, 1978) were compared i n terms of r e p l i c a b i l i t y , observer
b i a s , minimal number of r e p l i c a t e surveys required t o adequately represent
t he species composition of the s p e c i f i c f i s h community under study, d a i l y
var ia t ions i n the data, and s e n s i t i v i t y t o d i s t i nc t i ons between f i s h
communities. In addi t ion, the degree of cor re la t ion between surveys of
the two methods was calculated. These comparisons were made using more
than 500 surveys conducted i n cora l , boulder, b a s a l t pavement, and l i m e -
s tone pavement hab i t a t s .

2 In contras t t o the i s land of Oahu [land area of 1,535 km (Armstrong,
19731, estimated 1978 population of 719,600 (S ta te of Hawaii Department of
2 Planning and Economic Development, 1979)], the i s land of Molokai (676 km ,
population of 6,200) i s i n the e a r l y s tages of urban development (Figure 1).
The r u r a l l i f e s t y l e of the res iden ts t r a d i t i o n a l l y involves a c u l t u r a l
communion with the ocean which includes a p a r t i a l food subsistence. The
res iden ts have recent ly voiced concern regarding the increasing uses of
marine resources, including commercial and l o c a l f i sh ing , establishment
of conservation and management d i s t r i c t s , and erosion r e su l t i ng from
shorel ine development and agr icu l tu re .
In 1977, Fred D. Bicoy, Coordinator of the Molokai Community Action
Council, met with o ther community leaders t o i den t i fy the f i v e survey areas
of highest p r i o r i t y : Palaau, Moanui, Halawa Bay, Keawanui, and I l i o Point
(Figure 2) . Residents a r e concerned about the exten t of commercial f i sh ing
which is done i n the shallow waters of Palaau mudflats. A t Moanui, r e s i -
dents have suggested t h a t t he area ins ide and/or outs ide the reef be
designated a management o r conservation d i s t r i c t . Halawa Valley i s an
a rea of proposed r e s o r t development. Molokai res iden ts a r e i n t e r e s t ed i n
the e f f e c t s which the l imited publ ic access t o I l i o Point and Keawanui
has had on f i s h populations a t these s i t e s . I l i o Point i s access ible only
t o four-wheel-drive vehicles with permission from Molokai Ranch. Keawanui
is access ible only v i a hiking t r a i l s and boats. During the winter months,
sea condit ions usually prevent boat access t o Keawanui.
Replicate surveys of the Brock method and the Jones and Thompson
method conducted a t the f i v e Molokai s i t e s not only provided da ta f o r a
comparison of the methods but f u l f i l l e d a need f o r quan t i t a t i ve assess-
ments of the f i s h , algae, and co ra l populations a t the s i t e s . P r io r t o

the Molokai fieldwork, data for the method comparison were acquired on
Oahu a t a site i n Hanauma Bay.

11. FIELD MEX"I'ODS
A. Par t i c ipan t Preparation
Accurate and rapid i den t i f i ca t i on of organisms i n the f i e l d i s
e s s e n t i a l t o v i sua l survey work. With ass is tance from facu l ty and s t a f f
a t the University of Hawaii, an in tens ive t r a in ing program was designed
t o include f i s h , algae, and cora l i den t i f i ca t i on courses and survey
methodology t r a in ing sessions. S. L. Sanderson and A. C. Solonsky
completed such t r a in ing i n March 1978 and designed and d i rec ted the
t r a in ing program f o r the o ther e igh t p ro j ec t pa r t i c ipan t s from October
1978 through May 1979.
A Hawaiian Reef Fish ' ~ d e n t i f i c a t i o n Course was one aspect of t h i s
program and was offered through the Waikiki Aquarium. It covered t he
taxonomy and ecology of 175 species from 45 famil ies . The t r a in ing pro-
gram a l so included a Hawaiian Algae Iden t i f i ca t i on Course which was
s imi la r ly offered through the Waikiki Aquarium. This course encompassed
110 species from 4 phyla. The t r a in ing i n cora l i den t i f i ca t i on involved
the study of 35 co ra l species from 10 famil ies . References, 35 mm s l i d e s ,
f i e l d t r i p s t o r ee f s , and a v i s i t t o one of the more complete cora l
co l lec t ions i n the s t a t e served a s a ids .
From January t o May 1979, f i s h survey methodology t r a in ing sess ions
were held a t Hanauma Bay, a marine conservation d i s t r i c t with consider-
able d ive r s i t y and abundance of f i s h . A l l p a r t i c ipan t s were c e r t i f i e d i n
the use of SCUBA, and a l l surveys w e r e conducted with SCUBA t o permit
surveyors t o swim d i r e c t l y above the substratum.
B. Fish Surveys
Modifications of the Brock method and the Jones and Thompson method
were used during dayl ight hours. Both methods u t i l i z e d 50 meters of a

non-floating synthet ic l i n e . Data were recorded by species name on pre-
p r in ted underwater paper at tached t o cl ipboards. Transcription of da ta
from underwater paper t o computer-coded sheets took place immediately
following completion of the surveys a t each s i t e .
1. Brock Surveys
In the Brock surveys, two people swam abreas t , one on each s ide of
the l i n e , and recorded each individual f i s h seen within 2 . 5 m of t h e i r
s i de of the l i n e and 2 m above the substratum. The observers began the
survey simultaneously a t one end of the l i n e and did not h a l t u n t i l t he
survey was completed a t the o ther end of the l i n e . Fish which crossed
the l i n e were recorded only on the s ide where they or iginated. Depth,
v i s i b i l i t y , and the time required t o complete the survey were recorded.
During t ranscr ip t ion , the two observers combined t h e i r da ta t o a r r i v e a t
t he t o t a l number of individuals of each species s e e n - i n the area 5 m
across the l i ne .
2 . Jones and Thompson Surveys
In the Jones and Thompson surveys, one person ( the observer) recorded
species seen i n the area 5 m across the l i n e and 2 m above the substratum
while the o ther person ( the t i m e monitor) followed the observer and gave
a t a c t i l e s igna l a t the end of each of twelve one-minute i n t e rva l s .
During the f i r s t i n t e rva l , a value of twelve was assigned t o each species
seen. During the second in t e rva l , a value of eleven was given t o pre-
viously unseen species. The observer continued t o ass ign successively
lower values t o new species seen i n successive t i m e i n t e rva l s u n t i l a
cumulative l is t w i t h species labeled from twelve t o one was obtained.
This method is based on the assumption t h a t the species which a r e
m o s t abundant w i l l be encountered within the e a r l i e s t time in t e rva l s .
The observer swam slowly enough t o record species i n the order i n which

they were encountered. When the end of the l i n e was reached before the
twelve minutes were over, the observer swam back along the l i n e and
continued t o record species f o r the remaining t i m e i n t e rva l s .
The Jones and Thompson method i s appropriate f o r use only a t s i t e s
& where the survey can be completed over a uniform substratum type. Varia-
t i o n s i n the subs t ra ta , and there fore i n the h a b i t a t , which occur over
the course of observation may cause inaccurate abundance rankings. For
example, i f the observer s w i m s over co ra l rubble during the f i r s t ha l f
of the survey and boulders during the second h a l f , those species which
frequent boulder hab i t a t s w i l l be given a low abundance ranking regard-
l e s s of t h e i r ac tua l abundance.
3. Modifications
For purposes of comparison, both the Brock and the Jones and Thompson
methods were modified. The o r ig ina l ly described Jones and Thompson method
d id not u t i l i z e a t r ansec t l i ne . The observer was allowed t o s w i m ran-
domly within the physical confines of the s p e c i f i c reef under study.
However, we conducted surveys of both methods over the same l i ne s . To
ensure t h a t the t r ansec t l i n e could be s e t over a cons i s ten t substratum,
a 50 m l i n e was used r a t h e r than Brock's 500 yd l i n e . Nolan and Taylor
( i n press) concluded t h a t the optimal compromise between e f f o r t and
accuracy i n t h e i r use of the Brock method on shallow co ra l r ee f s was
achieved with a 50 m t ransec t .
O u r preliminary surveys on Hawaiian r ee f s indicated t h a t the majori ty
of species present were seen within the f i r s t t en minutes of observation.
Therefore, f o r the Jones and Thompson surveys, one-minute i n t e r v a l s were
used i n place of the o r i g i n a l ten-minute i n t e rva l s . In te rva l s of one
minute duration enabled the observer t o record an abundance ranking.

4 . Hanauma Bay Fieldwork
Throughout the eleven days of fieldwork during June 1979 a t Hanauma
Bay on Oahu, two p a i r s of p a r a l l e l 50 m l i n e s were s e t end t o end over a
uniform substratum. The l i n e s i n each p a i r , designated Lines One and
Two and Lines Three and Four, were approximately 7 m apart (Figure 3 ) .
On a l l the days of surveying, the beginning and the end of each l i n e
were attached t o the same coralheads. Surveys were begun approximately
t en minutes a f t e r the l i n e s had been s e t . Four two-person teams--A, B,
C, and D--remained constant throughout the Hanauma fieldwork, a s did the
ro l e s of observer and time monitor f o r the Jones and Thompson surveys.
On a given day, Teams A and B surveyed on one p a i r of l i n e s while
Teams C and D surveyed on the other p a i r of l i n e s . The teams a l t e rna t ed
between surveying Lines One and Two and surveying Lines Three and Four.
Each team performed both the Brock and the Jones and- Thompson methods
on each of the two l i n e s and repeated t h i s procedure f o r a t o t a l of e i g h t
surveys per team per day (Table 1).
5 . Molokai Fieldwork
Depth, water c l a r i t y , and amount of su i tab le (non-sand) subs t r a t a
were l imi t ing f ac to r s i n the se lec t ion of spec i f i c survey s i t e s . To
f a c i l i t a t e the required r epe t i t i ve diving, dives were made no deeper
than 60 f e e t . The use of v i sua l census methods a s described i n t h i s
r epo r t necess i ta ted a minimum v i s i b i l i t y of 2.5 m. Due t o l imi ted
v i s i b i l i t y , i t was n o t possible t o survey the waters d i r e c t l y over the
Palaau mudflats o r the nearshore waters i n Halawa Bay.
Sand subs t ra ta a r e r e l a t i v e l y barren of algae and co ra l cover.
Fish species which a re c h a r a c t e r i s t i c of sand hab i t a t s a re free-ranging
and d i f f i c u l t t o census. Consequently, surveys were not conducted over
sand substra ta .

Surveys on Molokai were conducted i n bas i ca l l y the same manner a s
were the Hanauma surveys. The char te r of the R/V Machias from July 1
through July 18, 1979 permitted the co l lec t ion of basel ine data a t s i t e s
which a re d i f f i c u l t t o survey with a shore-based operation due t o rough
sea conditions and/or l imited overland access. S i t e s with su i t ab l e depth,
water c l a r i t y , and subs t ra ta were se lec ted from an i n f l a t a b l e boat.
Coordinates were recorded based on radar observation from R/V Machias.
A t each s i t e , one p a i r of p a r a l l e l 50 m l i n e s was s e t approximately 7 m
apar t and surveys were begun immediately. Wo two-person teams and one
sa fe ty diver remained constant throughout the Molokai fieldwork, a s d id
the ro l e s of observer and time monitor f o r the Jones and Thompson surveys.
Each observer conducted both one Brock and one Jones and Thompson survey
on each of the two l i n e s f o r a t o t a l of four surveys per s i t e . Schools
o r unusual species occurring more than 2 .5 m from the l i n e were noted
bu t were not included i n the data analyses.
Molokai surveys were conducted a t a t o t a l of 33 s i t e s from 5 areas--
Palaau, Moanui, Halawa Bay, Keawanui, and I l i o Point (see Appendix A f o r
maps). A cora l , an a lgae, and a f i s h dendrogram were p lo t t ed t o de te r -
mine the s imi l a r i t y pa t te rns among these s i t e s . The cora l dendrogram
and the algae dendrogram were derived from the raw da ta acquired during
the 33 coral and 33 algae surveys. These raw da ta consisted of the
species observed and the number of quadrat points which each species
occupied. The f i s h dendrogram was derived from da ta obtained by aver-
aging the four Brock surveys conducted a t each s i t e . Brock surveys were
averaged by summing the number of f i s h recorded f o r each species and
dividing the sum by four.
The dendrograms a re discussed i n Appendix B. In general , the s i t e s
c lus te red according t o the a rea i n which they were located. With the
9

exception of Keawanui, each Molokai area can be considered a s a h a b i t a t
d i s t i n c t from the o ther Molokai a reas studied.
C. Algae and Coral Surveys
The algae and cora l surveys were done i n conjunction with the f i s h
surveys a t each Molokai s i t e t o allow f o r a comparison of a lgae, co ra l ,
and f i s h populations. Upon completion of the f i s h surveys, algae and
co ra l surveys were conducted by two observer p a i r s and one sa fe ty d iver
on one of the two 50 m l i n e s s e t over a uniform substratum type by the
f i s h surveyors.
A modified point-quadrat method was used (Goodall, 1952). The 0.5 m
2 by 0.5 m quadrat (0.25 m ) consisted of a square of lead-weighted PVC
tubing and equid i s tan t points formed by in t e r sec t i ng monofilament l i n e s .
Twenty-five equid i s tan t po in t s were used f o r the algae surveys; nine f o r
the coral . Most cora l colonies were l a rge r than the algae, necess i ta t ing
the wider spacing of po in t s i n the co ra l quadrat.
The 50 m l i n e was numbered a t 1 m i n t e rva l s , Pr io r t o each algae
and cora l survey, random numbers between 0 and 50 were obtained from a
random number tab le . During the algae surveys, the quadrat was placed
d i r e c t l y on the substratum a t each of four random numbers along the l i n e
and the a lga occurring under each of the twenty-five points was recorded
by species on pre-printed underwater paper a t tached t o clipboards. A
2 t o t a l of 1.0 m (four quadrats) was surveyed per s i t e .
During the cora l surveys, the quadrat was placed a t each of ten
random numbers along the Line, and the cora l species occurring under each
of the nine equid i s tan t points was recorded on underwater paper. To
2 obtain an adequate number of po in t s , 2.5 m ( t en quadrats) were surveyed
per s i t e .

In the absence of algae and/or cora l , the type of substratum under
the points was recorded ( i . e . sand, cora l rubble, boulder, s i l t , lime-
stone pavement, o r ba sa l t pavement). The general cha rac t e r i s t i c s of each
s i t e , including substratum type, were noted and photographed. Unidentified
species were col lected f o r laboratory iden t i f i ca t ion . Algae were preserved
i n 10% formalin and/or pressed on herbarium paper; cora l s were bleached
i n sodium hypochlorite solut ion. Transcription of data from underwater
paper t o computer-coded sheets took place immediately a f t e r each survey.

111. STATISTICAL METHODS
To determine the cor re la t ion between p a i r s of Brock surveys, between
p a i r s of Jones and Thompson surveys, and between p a i r s consis t ing of one
Brock and one Jones and Thompson survey, Spearman rank cor re la t ion coef f i -
c i en t s were calculated from the raw data. For each survey, the species
seen w e r e ranked a s explained below. The differences between the rank
assigned t o each species i n one survey and the rank assigned t o each of
the same species i n the other survey were then calculated. The cor re la t ion
coef f ic ien t (r 1 between the two surveys was computed using the equation S
where d equals the difference between the ranks f o r each species and n
equals the number of dif ferences calculated.
For each Brock survey, the species seen were ranked according t o the
number of individual f i s h of t h a t species recorded by the observers.
The rank of 1 was assigned t o the most abundant species , the rank of 2
t o the second m o s t abundant species , e t c . I f two o r more species were
observed t o be equally abundant, their ranks were averaged. For example,
i f an equal number of individual f i s h were recorded f o r the species with
ranks 3 and 4, those species would receive a t i e d rank of 3.5.
For each Jones and Thompson survey, the species seen were ranked
according t o the time i n t e rva l number recorded by the observer. Tied
ranks were frequently assigned t o species recorded using the Jones and
Thompson method. For example, i f three species w e r e encountered within
the f i r s t t i m e i n t e rva l and, therefore , had a t i m e i n t e rva l number of
twelve, those species were assigned a t i e d rank of 2. For surveys of
e i t h e r method, when a species was observed during one survey but not
during the other , t h a t species was assigned the highest rank i n the

survey during which it was not observed. The use of Spearman rank corre-
l a t i o n coef f ic ien ts permitted the numbers of individual f i s h obtained
from Brock surveys t o be ranked independently of the time i n t e r v a l numbers
obtained from Jones and Thompson surveys.
The possible values f o r t h i s cor re la t ion coe f f i c i en t range from -1.0
t o +1.0, with -1.0 representing an inverse re la t ionsh ip between the species
abundances recorded during the two surveys, 0 representing the lack of a
re la t ionsh ip , and +1.0 representing a d i r e c t re la t ionsh ip . A t ab le of
c r i t i c a l values f o r Spearman rank cor re la t ion coe f f i c i en t s provided p
values f o r the cor re la t ion coef f ic ien ts computed between surveys. In
the calculat ion of these cor re la t ion coe f f i c i en t s , t i e s frequently
occurred i n the species ranks f o r surveys of both methods. Although a
formula has been described (Lehmann, 1972) which takes i n t o account the
occurrence.of such t i e s by providing a means of ca lcu la t ing the conse-
quent lower s t a t i s t i c a l s ignif icance of the cor re la t ion coe f f i c i en t s ,
the use of t h i s formula was not deemed t o be of s u f f i c i e n t importance t o
t h i s study. The p values f o r the cor re la t ion coef f ic ien ts reported
throughout t h i s study are cons i s ten t ly lower than they would have been
i f the t i e d ranks had been taken i n t o account.
We p lo t t ed frequency d i s t r i bu t ions t o i l l u s t r a t e the frequency of
cor re la t ion coef f ic ien ts which were within ranges from 0 t o 1.0. Fre-
quency d i s t r i bu t ions of cor re la t ion coef f ic ien ts calculated from da ta
co l lec ted by d i f f e r en t observers o r i n d i f f e r e n t hab i t a t s were compared
using Chi-square t e s t s of independence (Sokal & Rohlf , 1969) . Based on
the n u l l hypothesis of the independence of the var iables (observers o r
h a b i t a t s ) , expected frequencies were computed. The g~odness of f i t of
the observed frequencies t o the expected frequencies was then tes ted .
A low l eve l of s ignif icance indicated t h a t the var iables were independent

and that there were no statistically significant differences between the
frequency distributions under comparison. When a high level of signifi-
cance was obtained, the null hypothesis was rejected.

I V . RESULTS AND DISCUSSION
A. Correlation Between Methods
Data col lected by two observer teams on a t o t a l of f i f t y ' l i n e s s e t a t
f i ve areas off Molokai over a period of f i f t e e n days were used t o t e s t the
agreement between the Brock and the Jones and Thompson methods. Spearman
rank cor re la t ion coef f ic ien ts were calculated between a s ing le Brock survey
and a s ing le Jones and Thompson survey, both of which were conducted by one
observer team on one l i n e approximately f i f t e e n minutes apar t . Brock
surveys were usually completed within s i x t o t en minutes while Jones and
Thompson surveys were conducted f o r twelve one-minute in te rva l s . P r io r t o
calculat ion of the cor re la t ion coe f f i c i en t s , the da ta obtained from each
Jones and Thompson survey were computer-edited t o include only those species
which were recorded within the number of minutes necessary t o complete the
corresponding Brock survey. Calculations w e r e consequently not based on
an a rb i t r a ry number of Jones and Thompson time in t e rva l s .
Low cor re la t ion coef f ic ien ts between and within methods were frequently
due i n p a r t t o f i s h belonging t o p a r t i c u l a r families. Species which a re
generally not t e r r i t o r i a l o r which have extensive home ranges ( i . e . members
of the famil ies Carangidae, Kyphosidae, and Scaridae) tended t o s w i m
sporadically through the survey areas so t h a t t h e i r recorded abundance may
not have been representat ive of t h e i r ac tua l abundance. Nocturnal predators
(i . e . members of the famil ies Muraenidae and Holocentridae) and o ther
secre t ive species ( i . e . members of the famil ies Gobiidae and Blenniidae)
a r e d i f f i c u l t t o survey accurately and were therefore a l so encountered
less consis tent ly .
Figure 4 is a frequency histogram f o r the ninety-nine cor re la t ion
coef f ic ien ts calculated from data co l lec ted by two observer teams a t f i ve

areas off Molokai. Forty-five percent of the cor re la t ion coe f f i c i en t s were
within the range of 0.41 t o 0.60. Sixty-six percent were s t a t i s t i c a l l y
s ign i f i can t (&. 01) . In a Chi-square t e s t of independence, no s t a t i s t i c a l l y
s ign i f i can t di f ferences (F-.975) were found between the frequency d i s t r i -
butions f o r the two observer teams, ind ica t ing t h a t the degree of cor re la t ion
between methods d id not change with d i f f e r e n t observers.
From sixteen t o forty-three cor re la t ion coef f ic ien ts were calculated
between methods f o r each of four Molokai areas. Due t o time cons t ra in t s
i n the f i e l d , da ta were avai lable f o r the calculat ion of only four corre-
l a t i o n coe f f i c i en t s f o r Keawanui. A s discussed on page 10, each Molokai
area can be considered a s a h a b i t a t d i s t i n c t from the o the r Molokai a reas
studied. Using a Chi-square t e s t of independence, no s t a t i s t i c a l l y s ign i -
f i c a n t di f ferences ( ~ 5 . 9 ) w e r e found i n the cor re la t ion coe f f i c i en t s from
the f ive areas , ind ica t ing t h a t the cor re la t ion between methods d id not
vary s ign i f i can t ly with hab i t a t .
Data co l lec ted by four observer teams on four l i n e s a t Hanauma Bay
over a period of eleven days were used i n the same manner t o determine the
cor re la t ion between methods. The s o l i d curve i n Figure 5 is the frequency
d i s t r i bu t ion f o r the 160 cor re la t ion coe f f i c i en t s calculated from these
data. Sixty-nine percent of these cor re la t ion coe f f i c i en t s were s t a t i s t i -
c a l l y s ign i f i can t (=.OS). These da ta a r e s imi la r t o the da ta presented
i n Figure 4.
Spearman rank cor re la t ion coe f f i c i en t s were a l so calculated between
the average of four Brock surveys and the average of four Jones and
Thompson surveys, a l l of which were conducted by one observer team on one
p a i r of l i n e s a t Hanaum+ Bay during one day. Surveys of one method w e r e
begun approximately t h i r t y t o forty-five minutes apa r t and surveys a l t e rna t ed
between methods according t o the schedule i n Table 1. Brock surveys were

averaged by sunning the number of f i s h recorded for each species and
dividing the sum by four. A s imilar procedure, s d n g the time in terval
number for each species, was used t o average Jones and Thompson surveys.
Due t o the mobility of f ishes and t o the specif ic f i e l d conditions during
the survey, observations which are not representative of the s i t e under
study may be recorded. By putting such atypical observations in to proper
perspective, the averaging procedure increased the correlation between
methods. The broken curve i n Figure 5 is the frequency distr ibut ion fo r
the thir ty-six correlation coeff icients calculated between the averages of
Brock and of Jones and Thompson surveys. A l l of these correlation coeffi-
c ients were s t a t i s t i c a l l y s igni f icant ( ~ 5 . 0 1 ) .
B. Correlation Within Methods
The degree of correlation between repeated surveys of one method is
a measure of the repl icabi l i ty of surveys of t h a t method. Data collected
by four observer teams on four l ines a t Hanauma Bay over a period of eleven
days were used t o determine the repl icabi l i ty of Brock and of Jones and
Thompson surveys. Spearman rank correlation coeff icients were calculated
between pai rs of Brock surveys and between pai rs of Jones and Thompson
surveys. The surveys i n each pa i r were conducted by one observer team on
one l ine and were begun approximately one hour apart.
In Figure 6 , each bar represents the correlation coeff icients obtained
between two Brock surveys and between two Jones and Thompson surveys, a l l
of which were conducted by one observer team on one l ine during a single
day. The correlation coefficients for Brock surveys were consistently
higher than those for Jones and Thompson surveys (Wilcoxon signed rank
test, p~.0005), indicating t h a t the Brock surveys were more replicable.
For the Brock surveys, seventy percent of the correlation coeff icients

were greater than 0.50 while f o r the Jones and Thompson surveys only
eleven percent were grea te r ( so l id curves i n Figure 7 ) . Eighty-eight
percent of the correla t ion coef f ic ien ts between Brock surveys were s t a t i s -
t i c a l l y s ign i f i can t (pL.01). In cont ras t , pL.01 fo r only thir ty- three
percent of the Jones and Thompson surveys.
Similar r e s u l t s were obtained from data col lected by two observer
teams on a t o t a l of f i f t y l i n e s s e t a t f i ve areas off Molokai. Using a
Chi-square t e s t of independence, no s t a t i s t i c a l l y s ign i f i can t dif ferences
( ~ 1 . 5 ) were found between the frequency d i s t r i bu t ions f o r the two observer
teams, indicat ing t h a t the degree of cor re la t ion within methods did not
change with d i f f e r en t observers.
Between e igh t and twenty-one cor re la t ion coef f ic ien ts were calculated
f o r each method a t each of four Molokai areas. Two cor re la t ion coe f f i c i en t s
were calculated f o r each method a t Keawanui . In a Chi-square t e s t of
independence, no s t a t i s t i c a l l y s ign i f i can t dif ferences ( ~ 5 . 9 ) were found
i n the coef f ic ien ts from the f i ve areas , indicat ing t h a t the r e p l i c a b i l i t y
of the methods did not vary s ign i f i can t ly with habi ta t . Larger sample s i ze s
a r e needed f o r more def in i t ive r e su l t s .
The Hanauma Bay da ta were used t o ca lcu la te cor re la t ion coe f f i c i en t s
between the average of four Brock surveys conducted by one observer team
on one p a i r of l i n e s during one day and the average of four Brock surveys
conducted by the same observer team on the same p a i r of l i n e s during a
d i f f e r en t day. Correlation coef f ic ien ts were a l so calculated between the
averages of Jones and Thompson surveys. Data from d i f f e r en t days were
used because it was not feas ib le t o conduct e igh t Brock and e igh t Jones
and Thompson surveys on the same p a i r of l i n e s during the same day.
In Figure 7 , the broken curves a r e frequency d is t r ibu t ions f o r t he
twenty-four correla t ion coef f ic ien ts calculated between averaged surveys

of each method. A l l of these correlation coefficients were s t a t i s t i c a l l y
s ignif icant ( ~ 5 . 0 1 ) . The sol id curves are frequency distr ibut ions f o r the
thir ty-six correlation coeff icients calculated between pai rs of surveys
of each method. The surveys i n each pa i r were conducted by one observer
team on one pai r of l ines during one day. The frequency distr ibut ions fo r
the averaged surveys plot ted to the r igh t of the dis tr ibut ions fo r the
single surveys (pL.005). indicating tha t the correlation within methods
increased signif icant ly a s a r e su l t of the averaging procedure.
C. Number of Species Observed
Results of correlated analyses of variance showed no s t a t i s t i c a l l y
s ignif icant differences ( p s 1) a t each of four areas on Molokai and a t
Hanauma Bay between the mean number of species recorded per Brock survey
and the mean number recorded per Jones and Thompson survey. A t only one
Molokai area, Halawa Bay, was there a s ignif icant difference ( ~ 2 . 0 5 )
between the average of 29.50 species observed per Brock survey and the
average of 27.75 species observed per Jones and Thompson survey. This
difference may be due to the boulders as large as 2.5 m i n diameter which
comprised the substratum a t the Halawa survey s i t e s and which tended t o
create more of a blind spot for the single Jones and Thompson observer
than for the team of two Brock observers.
Results of an additional correlated analysis of variance showed no
s t a t i s t i c a l l y s ignif icant differences (p5.5) a t each of the f ive Nolokai
areas and a t Hanauma Bay between the t o t a l number of species recorded
during Brock surveys and the t o t a l number recorded during Jones and
Thompson surveys. To avoid basing the above analyses on an arb i t rary
number of Jones and Thompson t i m e intervals , the data obtained from each
Jones and Thompson survey were computer-edited t o include only those species

which were recorded within the number of minutes necessary t o complete
the corresponding Brock survey.
D. Minimal Number of Replicate Surveys
In vegetation ecology when sampling for recurring plant assemblages,
it is common practice t o determine the minimal sample area of a community.
Minimal area is defined as "the smallest area on which the species compo-
s i t ion of the cotmiunity i n question is adequately represented" (Mueller-
Dombois & Ellenberg, 1974, p. 47) . For surveys of consistent s ize, t h i s
smallest area can be equated with the smallest number of replicate surveys
required t o adequately represent the species composition of the community
under study.
Minimal area is determined from a cumulative species-area curve on
which survey areas of increasing s ize are plotted on the abscissa against
number of species observed. Similarly, the m i n i m a l number of replicate
surveys can be determined from a cumulative species-replicate curve on
which an increasing number of replicates is plotted against number of
species observed (Figure 8 ) . To identify the minimal number of replicates,
the slope of the species-replicate curve must eventually approach zero.
Near the point where the species-replicate curve becomes almost horizontal,
a sufficient number of replicates w i l l have been conducted to adequately
represent species composition. Each additional replicate may yield one
o r two previously unrecorded species but these few species w i l l compose
only a small fraction of the t o t a l number observed in the community.
Engen (1976) reported a formula for the estimation of points on the
species-area curve. Using Engen's approach, species-replicate curves were
plotted for Brock and for Jones and Thompson surveys a t each of the f ive
Molokai areas. Prior to the estimation of points, the data obtained from

each Jones and Thompson survey were edi ted t o include only those species
which were recorded within the number of minutes necessary t o complete the
corresponding Brock survey.
Although the f ive Molokai areas can be considered a s f ive d i s t i n c t
habi ta t s , the substratum a t each area was not homogeneous and surveys were
conducted i n d i f fe rent subhabitats. Consequently, several f i s h communities
were surveyed a t each area. Since the surveys were not actual r ep l i ca t e s ,
the species-replicate curves f o r each area did not reach a plateau.
Additional surveys conducted i n d i f f e ren t subhabitats yielded observations
of additional species, resu l t ing i n a s teep slope f o r the curve. When
d i f fe rent subhabitats are studied and a species-replicate curve is p lo t ted
f o r the overa l l habi ta t , the curve w i l l reach a plateau only i f a very
large number of surveys are conducted.
Jones and Thompson used the P s t a t i s t i c of Gaufin, Harris, and Walter k
(1956) "to determine the number of rep l ica te 50-min counts considered
necessary t o account f o r 90% o r more of the ubiquitous species i n a comu-
ni ty" (Jones & Thompson, 1978, p. 163). This s t a t i s t i c required t h a t Jones
and Thompson designate a p r i o r i the number of surveys which would be ade-
quate t o account fo r 100% of the species i n the communities under study.
Since t h i s assumption would not have been r e a l i s t i c i n our study, we used
Engen's approach ra ther than the Gaufin s t a t i s t i c .
The species-replicate curves f o r the two methods a t each of the
Molokai areas were similar. This r e s u l t is consistent with the f a c t t h a t
there w e r e generally no s igni f icant differences between the mean number of
species recorded per Brock survey and the mean number recorded per Jones
and Thompson survey o r between the t o t a l number of species recorded a t each
area during Brock surveys and the t o t a l number recorded during Jones and
Thompson surveys (page 19) . In each area, previously unseen species were
2 1

observed a t approximately equal r a t e s during surveys of both methods.
Therefore, it can be predicted t h a t the minimal number of repl icate surveys
required t o adequately represent the species composition of the community
under study would not d i f fe r s ignif icant ly between the two methods.
The Gaufin s t a t i s t i c was developed as a cr i te r ion for evaluating the
efficiency of different sampling devices and does not require assumptions
"concerning the randomness of sampling o r the dis tr ibut ion or r e l a t ive
abundances of the species" (Gaufin e t a l . , 1956, p. 648) . As with the
Engen method, minimal number of repl icates required t o adequately represent
species composition is not necessarily related t o accuracy i n determination
of s p ~ c i e s abundance.
E. Observer Differences, Daily Differences
Dendrograms were employed t o identify s imi lar i ty patterns among
surveys conducted by various observers on various days. The time in terval
numbers assigned t o each species during Jones and Thompson surveys o r the
numbers of individual f i s h recorded for each species during Brock surveys
were subjected t o s imi lar i ty t e s t s (Mueller-Dombois & Bridges, 1975).
The dendrograms were derived from an unweighted pair-group cluster ing
(McCaxnon & Wenninger, 1970) of pairwise s imi lar i ty coeff icients (Bray &
Curtis, 1957) . Four dendrograms were plot ted t o determine the extent t o which the
conducting of surveys by d i f ferent observers and during d i f ferent days
was evident i n the data collected. Each dendrogram was based on a t o t a l
of twenty surveys of one method conducted by four observer teams during
f ive different days on one l ine a t Hanauma Bay. Two of the dendrograms
consisted of Brock surveys and two of Jones and Thompson surveys. For
each method, one dendrogram was drawn of surveys conducted on Line ltvo

and the o ther dendrogram of surveys conducted on Line Four. Since a l l
four t ransec t l i n e s a t Hanauma Bay were located i n one hab i t a t , the
dendrograms of the two l i n e s were s imilar .
For a l l four dendrograms, the s i m i l a r i t y values between surveys
ranged from 54% t o 88%, indicat ing t h a t the surveys which comprised each
dendrogram shared very s imilar proper t ies . In addit ion, t h i s r e l a t i v e l y
narrow range of s imi l a r i t y values demonstrated t h a t the l imited var ia t ion
between the surveys i n each dendrogram was r e l a t i v e l y consis tent .
In Chi-square t e s t s of independence, the frequency of simple c l u s t e r s
of two surveys conducted by the same observer team i r respec t ive of day was
not s t a t i s t i c a l l y s ign i f i can t ( ~ 2 . 5 ) . For both the Brock and the Jones
and Thompson methods, the use of d i f f e r en t observers on d i f f e r e n t days w a s
generally not r e f l ec t ed i n dendrograms of the data col lected.
The Hanauma Bay da ta were examined fu r the r t o resolve the s ignif icance
of the difference between data co l lec ted by d i f f e r en t observers using the
Jones and Thompson method. Spearman rank cor re la t ion coef f ic ien ts were
calculated between the average of four surveys conducted by one observer
on one p a i r of l i n e s during one day and the average of four surveys
conducted by a d i f f e r en t observer on the same p a i r of l i n e s during a
d i f f e r en t day. Data from d i f f e r en t days were used because it was not
feas ib le t o conduct e igh t Brock and e igh t Jones and Thompson surveys
on the same p a i r of l i n e s during the same day.
The so l id curve i n Figure 9 is the frequency d i s t r i bu t ion f o r these
cor re la t ion coef f ic ien ts while the broken curve is the frequency d i s t r i -
bution fo r correla t ion coef f ic ien ts calculated i n the above manner from
surveys conducted by the same observer on the same p a i r of l i n e s during
d i f f e r en t days. The r e s u l t s of a,&i-square t e s t of independence showed
t h a t the frequency d i s t r i bu t ion of the cor re la t ion coef f ic ien ts f o r same

observers is signif icant ly shif ted t o the r ight (p<.005) of the frequency - distr ibut ion for different observers, indicating tha t there was a s igni-
f icant difference between data collected by different observers using the
Jones and Thompson method.
Observer differences were not a s s ignif icant i n the dendrograms
because the dendrograms were computed from single surveys whereas the
correlation coeff icients plotted i n Figure 9 were calculated from averaged
surveys. The observer bias became more distinguishable as a r e su l t of the
averaging procedure which reduced the deviation from a central tendency.
The lower repl icabi l i ty of Jones and Thompson surveys compared t o Brock
surveys (page 17) is indicative of the degree of inherent va r i ab i l i ty i n
data collected using the Jones and Thompson method. Due t o t h i s inherent
var iabi l i ty , most observer bias w i l l be indistinguishable when a limited
number of Jones and Thompson surveys are conducted b'y dif ferent observers.
When a large number of surveys are involved, observer bias w i l l become
signif icant . Thompson and Schmidt (1977) used Spearman rank correlation coeff i-
c ients to test the agreement between surveys conducted by d i f ferent
observers a t the same s i t e s . Individual species scores were summed from
eight repl icate fifty-minute surveys conducted by each of two observers.
A correlation coefficient of 0.92 (pL.001) was calculated between the
sunmted species scores for each observer. In contrast, the correlat ion
coeff icients which we calculated between the average of four surveys
conducted by one observer and the average of four surveys conducted by a
d i f ferent observer (sol id curve in Figure 9) ranged from 0.42 t o 0.80.
Observer bias may have been more evident i n our study due to our use
of one-minute tim intervals rather than the ten-minute in tervals used by
Thompson and Schmidt. In our s tudies on Hawaiian coral reefs , w e found

t h a t the majority of f i s h species were recorded within the f i r s t ten
minutes. The use of longer time intervals by Thompson and Schmidt may
have decreased observer bias by reducing the importance of the order i n
which observers recorded species. The use of shorter t i m e in tervals may
increase observer bias while also increasing the resolution of the method
i n determining re la t ive abundances of species.
The calculations described above for Jones and Thompson surveys were
repeated for Brock surveys. No s t a t i s t i c a l l y s ignif icant differences
(p5.5) were found between the frequency distr ibut ion for surveys conducted
by the same observer and the frequency distr ibut ion for surveys conducted
by different observers.
F. Sensi t ivi ty t o Distinctions Between Fish Communities
In the four dendrograms discussed above, each based on twenty surveys
of one method (page 2 2 ) , the lowest s imilar i ty values ranged from 54% t o
63%. Since the surveys comprising each dendrogram were conducted on one
transect l ine , the s imi lar i ty values between surveys should ideal ly have
been 100%. O f course, the mobility of f ishes, as well as va r i ab i l i ty i n
f i e l d conditions on the f ive days and var iab i l i ty between the four observer
teams, caused the s imi lar i ty values t o be l e s s than 100%. A d ispar i ty
between surveys which should ideal ly have 100% similar i ty indicates t h a t
there ex i s t s a l imi t of sens i t iv i ty to differences between surveys from
di f ferent s i t e s . For example, i f under certain f i e l d conditions surveys
of one method from one s i t e are only 50% similar, then under those
conditions the method cannot be re l i ed upon t o distinguish between d i f fer -
ent s i t e s which are 75% similar.
The lowest s imi lar i ty values of 54%-63% can be considered as the
lower l i m i t of the sens i t iv i ty of the survey methods, under the speci f ic

f i e l d conditions of t h i s study, t o changes i n a f i s h community a t a s ingle
s i t e through t i m e or t o differences between f i sh communities a t d i f ferent
s i t e s . If f i sh communities a t d i f ferent times o r d i f ferent s i t e s were
l e s s than 54% similar, surveys conducted by the four observer teams used
i n t h i s study under the f i e l d conditions encountered would have provided ,
data suff icient t o detect the difference. I f f i sh communities were more
than 54% similar, dis t inct ions between the cornunities may not have been
accurately recorded.
In each of the f ive Molokai areas studied, between one and nine pa i r s
of transect l ines were set a t speci f ic s i t e s . A t each s i t e , each observer
team conducted one Brock and one Jones and Thompson survey on each of the
two l ines for a t o t a l of four surveys. Ikndrograms were used t o determine
the extent t o which the s i t e s could be distinguished on the basis of these
surveys.
Each of four dendrograms was comprised of thirty-four surveys of one
method conducted by one observer team--two surveys a t each of seventeen
sites--over a period of fourteen days. In the two Brock dendrograms, the
surveys from 47% of the s i t e s clustered together as simple pairs . No 1
similar i ty patterns in the form of simple pa i r s were found among the
surveys from the other sites. In the two Jones and Thompson dendrograms,
the surveys from 62% of the s i t e s clustered as simple pairs. In a Chi-
square t e s t of independence, the difference between the number of s i t e s
ident if ied as simple pa i r s f o r the two methods was not s t a t i s t i c a l l y
s ignif icant (P(. 5)
While dis t inct ions could be made between only half the s i t e s on the
basis of the s imi lar i ty pat terns i n the dendrograms, it should be noted
that the dendrograms were comprised of s ingle surveys rather than averaged
surveys. As previously discussed (page 171, observations which are not

representative o f the s i t e under study may be recorded during s ingle
surveys. I t is expected that a greater number of s i t e s could be d i s t in-
guished using dendrograms comprised of averaged surveys.

V. SUMMARY AND CONCLUSIONS
The degree of correlation between repeated surveys of one method i s
a measure of the replicabil i ty of surveys of that method. However, repli-
cabil i ty i s not necessarily related to accuracy. Surveys could be repli-
cable yet be consistently inaccurate. Can conclusions regarding accuracy
be reached?
For both single surveys and averaged surveys, the degree of corre-
lat ion between methods approximated the degree of correlation within methods.
When four surveys were averaged, an increase i n the correlation within
methods was reflected i n an increase i n the correlation between methods
(Figure 10). This d i rect relationship suggested that replicate surveys of
each method approached accuracy.
The degree of accuracy towards which replicate surveys of the two
' methods converge is, of course, limited by any systematic errors which are
present i n both methods. For example, both methods tend to under-represent
cryptic species so that the degree of accuracy approached does not include
an accurate representation of such species. The use of additional survey
methods with different systematic errors would aid i n identifying the
systematic biases present i n the other methods under consideration as well
as aid i n defining the degree of accuracy towards which the other methods
are converging. For example, the use of an ichthyocide following replica-
tions of the Brock and the Jones and Thompson methods would provide
information regarding the relat ive accuracy of these three methods i n
representing cryptic species.
I f replicate surveys of each wthod approached accuracy, it can be
further inferred that the lower replicabil i ty of Jones and Thompson surveys
compared to Brock surveys was due t o lower accuracy of Jones and Thompson

surveys. The significant difference between data collected by different
observers using the Jones and Thompson method indicated that observer bias
was responsible in part for the lower accuracy of Jones and Thompson
surveys. The greater observer bias in Jones and Thompson surveys compared
to Brock surveys may be due to the use of only one observer in the Jones
and Thompson method. By combining the data collected by the two observers
employed in the Brock method, the effects of observer bias may be lessened.
Prior to their participation in this study, the observers had been
involved in a comprehensive training program and had acquired approximately
equal experience in fish identification and visual surveying. The degree
of correlation between methods or within the Brock method did not change
significantly with the use of different observers. Similarly, the degree
of correlation between methods or within either method did not change
significantly in different habitats. The relatively-constant frequency
distributions of correlation coefficients suggested that there were no
observer characteristics which affected the replicability of Brock surveys
and no habitat characteristics which affected the replicability of surveys
of either method.
The mean number of species recorded per survey and the total number
of species recorded per site were approximately equal for the two methods.
Consequently, the minimal number of replicate surveys required to ade-
quately represent the species composition of the community under study
would be approximately equal for the two methods. Observer bias in the
Jones and Thompson method did not involve exclusion of species but rather
occurred in the assigning of time interval numbers to species.
A Jones and Thompson survey can be completed in fewer than half the
man-hours needed to conduct a Brock survey. As originally decribed by
Jones and Thompson, it is not necessary to set a transect line and one

person can serve as both observer and time monitor. Although Jones and
Thompson surveys were l e s s replicable and l e s s accurate than Brock surveys,
Jones and Thompson surveys were equally adequate i n distinguishing between
d i f ferent s i t e s . The combining of data collected by several Jones and
Thompson observers would increase accuracy by decreasing observer bias .
However, the increase i n man-hours of e f f o r t would have t o be considered.
A representative Brock survey can be conducted i n more than one
habitat i f the transect l i n e i s s e t where the substratum is representative
of the species and proportions of coral and algae present i n the general
area. However, a s discussed on page 7, i f a Jones and Thompson survey
was conducted i n more than one habitat , the time interval numbers assigned
t o species would be dependent on the time interval when the observer swam
over the par t icular substratum type character is t ical ly inhabited by those
species regardless of t h e i r actual abundances. The ones and Thompson
observer must take care to avoid swimming through more than one habi ta t
per survey.
Due t o tine constraints, we were not able t o t e s t a modification of
the Jones and Thompson method which we propose fo r use i n areas with more
than one habitat type, such as a reef extending from shore t o a depth of
20 matars. Rather than assigning a single time interval number t o each
species, the observer would record every species seen i n each time in terval .
The underwater survey sheet would be arranged with columns for time in tervals
and rows f o r species names. The observer would simply place a checkmark
next to the species name i n the column corresponding t o the appropriate
time interval. During transcript ion of the data a f t e r the dive, the
number of checkmarks recorded fo r each species would be total led. An
indication of the re la t ive abundance of species i n an area with d i f fe ren t
substrata would be obtained. Without the modification described here, it

would be necessary t o conduct a separate survey i n each habi ta t and data
regarding the re la t ive abundance of species from di f ferent habitats would
not be available.
This modification requires t h a t the number of t i m e in tervals which
the observer spends in each habitat be proportional t o the frequency of
occurrence of tha t habitat re la t ive t o other habitats i n the area under
study. The observer would need to distinguish between d i f ferent habi ta ts
but would not need t o r e s t r i c t observation t o one habitat .
Both the Brock method and the Jones and Thompson method are valid
visual survey techniques. When an area is under intensive study and
replicable surveys are essent ial , the Brock method should be used. I n
cases where absolute abundances are required o r where the length of each
individual f i s h must be noted t o obtain biomass approximations, the Brock
method must be used. When available f i e l d time is minimal and the main
objective is t o characterize f i s h communities so tha t s i t e s can be d is t in-
guished and compared on tha t basis , the Jones and Thompson method is more
cost-effective. The Jones and Thompson method would also be preferred
when bottom time is a c r i t i c a l l y l imiting factor o r when conditions of
strong current, heavy surge, o r extreme ver t ica l r e l i e f prohibi t the
se t t ing of a t ransect l ine .

PROCEDUR3 FOR CONDUCTING OF FISH SURVEYS
AT HANAUMA BAY
OBSERVER TEAM A CONDUCTED OBSERVER TEAM B CONDUCTED
1. Jones and Thompson on Line 1 while Brock on Line 2
2. Brock on Line 1 while Jones and Thompson on Line 2
3 . Brock on Line 2 while Jones and Thompson on Line 1
4. Jones and Thompson on Line 2 while Brock on Line 1
5. 1 through 4 (repeated) while 1 through 4 (repeated)
Table 1. During the fieldwork a t Xanauma Bay, each observer team performed both the Brock and the Jones and Thompson methods on each of the two l i n e s and repeated t h i s procedure for a t o t a l of e igh t surveys per team per day.