
HINVA - High lift INflight VAlidation - Project Overview ... · American Institute of Aeronautics...
27
American Institute of Aeronautics and Astronautics 1 HINVA - High lift INflight VAlidation - Project Overview and Status R. Rudnik 1 DLR, German Aerospace Center, 38108 Braunschweig, Germany D. Reckzeh 2 and Airbus Operation, 28199 Bremen, Germany J. Quest 3 ETW, European Transonic Windtunnel, D-51147 Cologne, Germany The objective of the joint research project HINVA is to significantly enhance the accuracy and reliability of the prediction and assessment of the aerodynamic performance of civil aircraft with deployed high lift devices. To achieve this goal the most advanced numerical and experimental simulation methods currently in industrial use are to be validated against flight test data focusing on the maximum lift regime. The project is building up on experiences and findings gained in related European project like EUROLIFT and of GARTEUR studies. DLR’s flight test aircraft Airbus A320-200 ATRA serves as a common configurative basis for the three methodology areas flight test, high Re-No testing in the European Transonic Windtunnel ETW, and numerical simulation using DLR’s TAU code. The baseline device setting corresponds to the landing configuration. Also the cruise configuration is investigated. A core element of the project is the generation of a dedicated fully harmonized validation database consisting of wind tunnel and corresponding flight test data. Using the unique advantages of all three methodology areas in a synergetic way allows to determine qualitatively as well as quantitatively the dominant aerodynamic phenomena in the maximum lift regime for such type of aircraft. The findings will feed a new simulation strategy for the use and application of numerical tools as well as cryogenic testing to determine maximum lift in terms of lift coefficient and angle of attack within accuracy margins of the industrial high lift design process. The project is subdivided into three main workpackages: ATRA flight test, ETW wind tunnel test, and CFD simulations. The specification of the baseline geometry and the CAD models is widely finished. Comprehensive numerical simulations have been carried out to support the flight test instrumentation. The flight test planning and development of the flight test instrumentation is in progress in a close workshare between Airbus and DLR to prepare the first flight test campaign. Nomenclature A = reference area greek symbols b = wing span = angle of attack C p = pressure coefficient f = flap deflection angle C L = total lift coefficient s = slat deflection angle C D = total drag coefficient = aspect ratio 1 Head Transport Aircraft, Institute of Aerodynamics and Flow Technology, Lilienthalplatz 7, 38112 Braunschweig, Germany, Member AIAA 2 Technology Integration Platform Leader OAD, Airbus Operations, Airbus-Allee 1, 28199 Bremen, Germany, Member AIAA 3 Chief Aerodynamicist, European Transonic Windtunnel, Ernst-Mach Strasse, D-51147 Cologne, Germany, Associated Fellow AIAA
Transcript of HINVA - High lift INflight VAlidation - Project Overview ... · American Institute of Aeronautics...

American Institute of Aeronautics and Astronautics
1
HINVA - High lift INflight VAlidation - Project Overview and Status
R. Rudnik1 DLR, German Aerospace Center, 38108 Braunschweig, Germany
D. Reckzeh2 and Airbus Operation, 28199 Bremen, Germany
J. Quest3 ETW, European Transonic Windtunnel, D-51147 Cologne, Germany
The objective of the joint research project HINVA is to significantly enhance the accuracy and reliability of the prediction and assessment of the aerodynamic performance of civil aircraft with deployed high lift devices. To achieve this goal the most advanced numerical and experimental simulation methods currently in industrial use are to be validated against flight test data focusing on the maximum lift regime. The project is building up on experiences and findings gained in related European project like EUROLIFT and of GARTEUR studies. DLR’s flight test aircraft Airbus A320-200 ATRA serves as a common configurative basis for the three methodology areas flight test, high Re-No testing in the European Transonic Windtunnel ETW, and numerical simulation using DLR’s TAU code. The baseline device setting corresponds to the landing configuration. Also the cruise configuration is investigated. A core element of the project is the generation of a dedicated fully harmonized validation database consisting of wind tunnel and corresponding flight test data. Using the unique advantages of all three methodology areas in a synergetic way allows to determine qualitatively as well as quantitatively the dominant aerodynamic phenomena in the maximum lift regime for such type of aircraft. The findings will feed a new simulation strategy for the use and application of numerical tools as well as cryogenic testing to determine maximum lift in terms of lift coefficient and angle of attack within accuracy margins of the industrial high lift design process. The project is subdivided into three main workpackages: ATRA flight test, ETW wind tunnel test, and CFD simulations. The specification of the baseline geometry and the CAD models is widely finished. Comprehensive numerical simulations have been carried out to support the flight test instrumentation. The flight test planning and development of the flight test instrumentation is in progress in a close workshare between Airbus and DLR to prepare the first flight test campaign.
Nomenclature A = reference area greek symbols b = wing span = angle of attack Cp = pressure coefficient f = flap deflection angle CL = total lift coefficient s = slat deflection angle CD = total drag coefficient = aspect ratio
1 Head Transport Aircraft, Institute of Aerodynamics and Flow Technology, Lilienthalplatz 7, 38112 Braunschweig, Germany, Member AIAA 2 Technology Integration Platform Leader OAD, Airbus Operations, Airbus-Allee 1, 28199 Bremen, Germany, Member AIAA 3 Chief Aerodynamicist, European Transonic Windtunnel, Ernst-Mach Strasse, D-51147 Cologne, Germany, Associated Fellow AIAA
American Institute of Aeronautics and Astronautics
2
c = chord length = taper ratio FTI = Flight Test Instrumentation = engine bypass ratio F/T = Flight Test HS = Horizontal stabilizer subscripts h = height ail = aileron IPCT = Image Pattenr Correlation Technique eng = engine M = Mach number f = flap PIV = Particle Image Velocimetry fu = fuselage Re = Reynolds number based on cref max = maximum of a specific quantity s = half span ref = reference quantity SPT = Stereo Pattern Tacking s = slat T = temperature = free stream value VS = Vertical stabilizer w = width
I. Introduction and Background HE HINVA project is set-up to significantly enhance the predictive capabilities of the currently most advanced methods for the determination of the high lift performance of transport aircraft, featuring complex 3D CFD
simulations1, 2, 3, and flight Reynolds-number-testing in cryogenic test facilities4, 5. The project is funded as part of the German aeronautics research program LuFo IV. Therefore, especially methods, tools, and applications with a high scientific and technical relevance for the national aviation industry, the research institutions, and universities are considered. The aerodynamic focus lies on the analysis of maximum lift, and, closely related to this, the analysis of the onset, extent, and growth of flow separations with angle of attack in the low speed flight regime. In contrast to similar research activities in this field over the last two decades, the reference and benchmark to assess the predictive capabilities is a dedicated high lift flight test being an integral and essential part of the project. The numerical simulations are based on the DLR TAU-code, the experimental investigations are scheduled for the ETW, and the flight test will be carried out using DLR’s Advanced Technology Research Aircraft ATRA, an Airbus A320-200. Due to the challenging task of preparing and conducting flight tests, the scope of the project is limited to maximum lift and related aerodynamic phenomena. Other important issues of low speed high lift aerodynamics, such as the determination of the overall drag representative for the take-off performance, are not addressed in this phase of the project.
The reason and underlying main justification for such type of activity is that both, the numerical as well as the experimental simulation approach, have revealed deficiencies to determine absolute values for maximum lift performance and lift increments at representative high lift flight conditions in the industrial design process for high lift systems. Maximum lift predictions are still characterized by considerable deviations from final performance flight test results in positive and negative directions. The same holds for the angle of attack at which maximum lift occurs, max, which is as important and sensitive. In industrial process chains, e.g. at Airbus, high lift performance is at present determined prior to performance flight testing in a complementary use of different wind tunnel facilities for the whole Reynolds-number range, models of various scales, and numerical simulations6.
On the other hand, numerical methods and wind tunnel testing have reached a considerable degree of maturity in the demanding task of predicting of high lift increments based on national and international research efforts7, 8. In addition to pure validation of CFD methods, complementary use of both approaches, CFD and wind tunnel testing, is increasingly used to gain mutual benefits and to efficiently improve both approaches9. This approach is extended within HINVA to include high lift flight testing for validation purposes using extensive CFD-based support to prepare, schedule, and assess the flight test results.
In the past two major flight test campaigns have been carried out for high lift conditions to provide both, validation datasets and deeper inside into the aerodynamic phenomena. In Europe, flight tests have been conducted in the late 1980s within the framework of the GARTEUR High Lift Action Group AD(AG08), using an Airbus A310-300 in high lift configuration10. Within the AD(AG08), the flight test activities were coordinated by MBB, a founding company of Airbus-Industrie. A special focus was laid on the determination of Mach and Reynolds number effects on the high lift performance and the corresponding scaling laws11. A take-off and a landing configuration were flight tested. As far as flight test instrumentation is concerned, a representative wing section at 59% span and a slat only section at 64.5% span have been equipped with pressure holes integrated in a belt for steady measurements and Endevco transducers for unsteady pressure measurements. Hotfilms were applied to the slat at both sections. For off-body measurements two boundary layer probes were mounted on the suction side of the
T
American Institute of Aeronautics and Astronautics
3
main wing and the slat, and another one in the slat cove. Accompanying the flight tests, wind tunnel tests were conducted using two 2-dimensional wing section models of different size, as well as the large half model M139 of the Airbus A310 as part of AG(AG08). Tests were carried out in various European wind tunnel facilities, all at sub-scale Reynolds-numbers. In the follow-on action groups AD(AG13)12 and AD(AG25)13, the wind tunnel test data for the 2D section were used for the validation of CFD-codes. To the knowledge of the authors, the wind tunnel data of the Airbus A310 half model M139, as well as the flight test data have not been used for CFD validation purposes.
Comprehensive investigations with a variety of measurement techniques have also been carried out in the U.S. in the early 1990s under the coordination of NASA, testing the Boeing 737-100 TRSV (Transport System Research Vehicle) in high lift configuration14. As for the GARTEUR flight tests, a representative midspan wing station has been selected for surface pressure and skin-friction measurements. In addition, flow visualization has been carried out. Boundary layer profiles have been recorded as well as boundary-layer states using hot films. In a later phase of the program, aeroelastic deformations have been detected along the full chord near the midpsan station using an optical system. The flight test data have been used in follow-on studies for understanding and validation of transition phenomena and their prediction, and for the validation of CFD-methods using the 2-dimensional approach15, 16.
In terms of performance validation, both high lift flight test programs have provided basically 2-dimensional data of representative swept-back wing sections including all elements of the respective high lift system. This is in accordance to the level of development and maturity of CFD methods at that time. CFD simulations based on RANS-equations were being established in the 1990s with 2-dimensional airfoil computations, while 3-dimensional computations of full aircraft in high lift configuration were limited to pilot applications17. Given the considerable efforts in development of CFD flow solvers, grid generations systems, and high performance computing resources over the last two decades, and today’s industrial demands on the increasing applications and reliability of CFD simulations of full aircraft configurations in an industrial context6, 18, the afore mentioned flight test data don’t comply with the present requirements on CFD validation for complex high lift configurations. Besides the fact that the availability of the test data is limited to the shareholders of the programs, a further problem of these validation datasets, being recorded about two decades ago, is that they are often not available in digital form, like the data of the GARTEUR flight test program.
Despite the lack of suitable flight test data, CFD methods for high lift simulations have been intensively validated with wind tunnel test data through various collaborative projects. As mentioned before, 2-dimensional applications for multielement airfoils have been the basis for the numerical investigations in the GARTEUR action groups AD(AG13) and AD(AG25). Together with AD(AG36)19, where the ONERA AFV wind tunnel model featuring a 3-element swept back wing with constant chord has been computed as a first step towards three-dimensional applications, these action groups laid the foundation for the subsequent studies within the EC projects EUROLIFT (European High Lift Programme) and EUROLIFT II20. In EUROLIFT21, lasting from 2000-2003, a wing-body configuration being representative for commercial aircraft with deployed high lift devices was considered, designated as KH3Y or DLR F11 for the corresponding wind tunnel model. Accompanying wind tunnel studies were carried out based on the F11 half model in an industrial atmospheric wind tunnel of Airbus and in the ETW providing test data for a broad Reynolds number range up to flight conditions21,22. The complexity of the configuration was then increased by including engine/airframe integration effects in the follow-on project EUROLIFT II23, lasting from 2004-2007. Again detailed studies concerning Reynolds number scaling effects have been conducted in the ETW24. In addition to force, moment, and pressure data, various advanced measurement techniques provided deformation and transition information and served to enhance the maturity and the value of cryogenic testing of high lift configurations. Despite reasonable qualitative agreement throughout the CFD validation studies in these projects, larger than acceptable differences of the absolute results were observed between the CFD results and the wind tunnel data in many cases. To identify the origins for these deviations requires detailed verification studies of the numerical methods on the one hand, as well as identification of detrimental influences due to wall interference and half model mounting influences in the test-set up on the other hand. While the first aspect is addressed for the DLR TAU-code throughout continuous code development activities at DLR and its partner25, the second aspect has been addressed e.g. in the EC-project FLIRET (Flight Reynolds Number Testing) in a synergetic use of experimental and numerical methods26. Among other methods, the DLR-TAU code has been used to investigate such influences in the ETW, providing a valuable preparation for the studies in the present project9.
Considering these and other studies in the research field revealed that for the required further development of the analysis and prediction tools numerical simulation and cryogenic wind tunnel testing, a concerted action is required to validate the results of both methods with high quality validation data of flight tests on a common configuration. Without such validation data for a real flying aircraft, the tools for aerodynamic prediction of the aircraft in high lift configuration can hardly be further improved. Additional validation data from wind tunnel alone, as produced in past validation exercises, cannot bridge the knowledge gap in this case. Also the highest-fidelity testing using half
American Institute of Aeronautics and Astronautics
4
models in ETW can currently not model the behavior of the flying aircraft in sufficient conformity. As a result from this situation unintended margins in the predicted aircraft performance have to be preserved, which result in an over-dimensioning of the high-lift system, resp. the complete aircraft wing configuration with subsequent penalties in weight and costs, i.e. economic and ecologic performance27. To resolve the problem and provide the “missing link” in tool development, a dedicated in-flight validation exercise is seen as mandatory. The project HINVA is set-up to provide such high lift flight test results and at the same time carry out an ETW wind tunnel test and CFD simulations of various degrees of sophistication on a specific configuration. This is regarded as the most promising approach to identify deficiencies of the prediction tools and assess ways to improve the simulation quality for absolute values of the aerodynamic coefficients as well as for lift increments beyond the current state-of-the-art. The outcome of the project will then serve to significantly reduce risk and uncertainties in maximum lift predictions, allowing the required gains in structures and system weight and thus improved aircraft performance in the design of high lift systems as outlined in Ref. 28. This paper describes preparing activities in all three main areas of the project.
II. Project Approach, Objectives, and Structure The most important and at the same time challenging part of the HINVA project is the generation of a
comprehensive and reliable flight test dataset to achieve a significantly higher level of fidelity in high-lift simulation and subsequently a more optimized and therefore more economically and ecologically efficient aircraft design. This objective is to be reached by a synergetic and carefully adjusted combination of all three considered methods, i.e. flight testing, wind tunnel testing, and CFD simulations in one single project. Previous validation projects such as EUROLIFT have clearly shown the benefits of integrating the generation of validation data and their use in one project in order to guarantee a proper and common understanding of the requirements and drawbacks of the single methods and enable a detailed scrutinizing of the generated datasets by the involved experts for the single methods.
The main requirements concerning aerodynamic data for the validation of CFD methods and comparison to ETW wind tunnel data are:
- Aerodynamic forces in the linear and nonlinear lift range, - Deformation effects of the overall wing and the deployed high-lift devices, - Aerodynamic surface flow measurements including aerial surface pressures over the full wing span, skin
friction, and transition measurements and aerial flow visualization for separation detection, - Off-body measurements to measure boundary layer profiles, confluence, and extent of separation normal to
the surface, as well as vortex structures and velocity fields, - Flight conditions, aircraft attitude and position and information about the flight dynamics behavior for the
flight in the nonlinear range and its limitations. The availability of such type of dataset is a prerequisite to allow for a correct modeling of the (deformed) aircraft
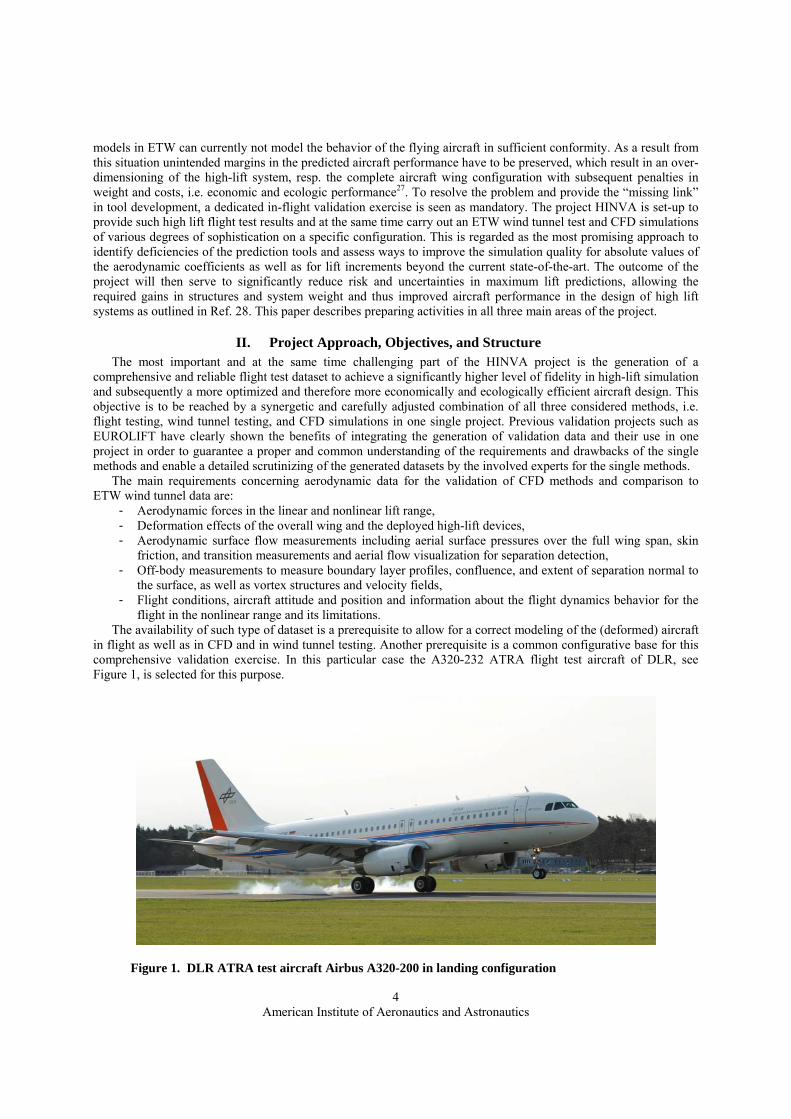
in flight as well as in CFD and in wind tunnel testing. Another prerequisite is a common configurative base for this comprehensive validation exercise. In this particular case the A320-232 ATRA flight test aircraft of DLR, see Figure 1, is selected for this purpose.
Figure 1. DLR ATRA test aircraft Airbus A320-200 in landing configuration

American Institute of Aeronautics and Astronautics
5
As outlined before the technical objective of the project is the reliable determination of maximum lift and the angle of attack at which it is reached. In certification flight tests the high lift performance of the aircraft is determined by flying defined stall maneuvers. With respect to the aerodynamic layout of the high lift system, the attainable maximum lift is of special relevance for the landing configuration. But also the maximum lift of the cruise configuration in low speed high lift conditions is of relevance for the aircraft certification. With the high lift devices retracted, this configuration represents a geometrically less complex configuration characterized by a different type of stall and separation onset. Thus, it is a valuable alternative configuration to benchmark the numerical capabilities, and is therefore also scheduled to be investigated in the project.
According to the design perspective, the requirements on the deviation of the maximum lift determination with CFD-methods and in the wind tunnel experiment can be quantified to be smaller than 2% for CL,max and max . Both methods will consider static aeroelastic deformation of the high lift wing. For the numerical approach this will be accomplished by a coupled fluid-structural interaction approach, for the experimental studies the deformation behaviour will be measured in the wind tunnel and during the flight tests. It is an essential aspect of the current project to underline that a thorough validation and assessment of the predictive capabilities of the methods requires more than just analyzing deviations of the predicted performance values to flight test data. The validation data should allow to prove that the simulation also captures all relevant flow phenomena that drive the stall of the configuration consistently. Taking into account the geometric complexity of a configuration with deployed high lift devices and the broad variety of involved aerodynamic phenomena makes this quite a challenging task. As important is the analysis of uncertainties in the application of the numerical and experimental methods and techniques. While this is more and more established for numerical applications29, it is regarded essential to look in detail into effects of geometrical simplifications and accuracy limitations of the experimental techniques beyond evaluating repeatability.
The approach outlined above is reflected in the project structure. Four main workpackages are established:
- Workpackage WP 1: ATRA Flight Testing
- Workpackage WP 2: Wind tunnel Testing in ETW
- Workpackage WP 3: Numerical Simulation
- Workpackage WP 4: Simulation Strategy In addition to classical numerical simulations for performance prediction and phenomenological investigations,
WP 3 is also supporting the preparation of the wind tunnel and flight test campaigns by dedicated numerical investigations. The main deliverable of the project will be to feed these findings and the technical expertise into a dedicated simulation strategy, addressed in WP 4, to improve the predictive capabilities for high lift flows of both, numerical and experimental methods and drive further development trends in both methodical fields.
The project is coordinated by the Institute of Aerodynamics and Flow Technology of DLR in Braunschweig. Associated main partners are Airbus Operations and ETW. According to the research character of the project, special scientific tasks are subcontracted to German universities with acknowledged expertise in the respective fields. The academic partners are listed below:
- Technical University of Berlin, Institute of Aeronautics and Astronautics (TU-B, ILR)
- Technische Universität Braunschweig, Institute of Fluid Mechanics (TU-BS, ISM)
- University of Stuttgart, Institute of Aerodynamics and Gas Dynamics, (U-ST, IAG) In contrast to many of the international projects and workshops for code validation with benchmark activities
based on a variety of different methods and tools, the baseline methods are pre-assigned with the DLR-TAU code as the basis for the numerical investigations and the ETW for the experimental studies according to special character of the research project HINVA.
III. Aircraft Specification and Configuration The baseline configuration for all experimental and numerical activities in HINVA is an Airbus A320-200,
representing a single-aisle twin-jet short-to-medium range commercial airliner. The main aircraft dimensions according to Ref. 30 and 31 are listed in Table 1. The specific version of the aircraft is given by the fact that DLR’s Advanced Technology Research Aircraft ATRA is used for the flight test campaigns. This has certain implications for the details of the configuration. The -200 version of the A320 was modified with small fences mounted at the wing tip. The ATRA test aircraft is an Airbus A320-232, indicating that the aircraft is equipped with IAE V2527-A5

American Institute of Aeronautics and Astronautics
6
engines by International Aero Engines AG32. As visible in Figure 1, this type of engine is featuring a long-cowl nacelle with internal mixing of primary and secondary airflows, whereas the alternative engine option CFM International CFM 56-5A/B has a short cowl nacelle with external mixing of the airflows. According to Ref. 33, the take-off thrust amounts to 110.3 KN. The engine has a moderate bypass ratio of 4.8, representative for a typical turbofan engine. The maximum take-off weight amounts to 73.5 tons. The main outer dimensions of the engine are also listed in Table 1:
Table 1: Main dimensions of Airbus A320-232 aircraft
wing span, b = 2s [m] 34,10
wing reference area, A [m2] 122,4
reference chord, cref [m] 4.19
aspect ratio, [-] 9.4
taper ratio, [-] 0.246
¼ chord sweep, 25 [o] 25
horizontal stabilizer width, wHS [m] 12,45
vertical stabilizer height, hVS [m] 5.87
fuselage length, l fu [m] 37.57
fuselage width, w fu [m] 3.95
fuselage height, hfu (abv. ground) [m] 11.76
distance between engine axes [m] 11.51
overall engine length, leng [m] 3.20
engine width, weng [m] 1.68
The design of the high lift system for the Airbus A320 is described in Ref. 34, some further details are found in
Ref. 35. The baseline high lift layout of the A320 was designed at BAe Weybridge, Great Britain, strongly relying on wind tunnel tests and supported by theoretical methods, ranging from 2-dimensional inviscid singularity methods to quasi 3-dimensional panel methods based on the viscid-inviscid interaction. Having considered slats and Krüger flaps in the design phase, as well as single and double slotted flap systems, the final high lift design is characterized by a nearly full span leading edge slat and a continuous single slotted trailing edge flap, as shown in the planform view with deployed high lift devices in Figure 2.
Figure 2: Planform view of the A320-200 with deployed high lift devices in landing configuration

American Institute of Aeronautics and Astronautics
7
The leading edge slat has one inboard segment and four outboard segments with very little chord taper. The spanwise gaps between the outboard segments are sealed for most of the slat chord. In the CAD representation the outer slat segments are modeled continuously in spanwise direction without in-between gaps. As can be seen in the CAD model of the full configuration in Figure 3, two supporting slat tracks per segment are used for the four outboard segments, while the inboard slat is mounted on two pairs of tracks. The slat actuation is done by a circular track supported by rotary drives.
Figure 3. Bottom view of the A320-200 with deployed high lift devices in landing configuration The trailing edge Fowler flap consists of an inboard and an outboard segment without a thrust gate. Making use
of the comparable deep rear section of the airfoil aft of the rear spar allows a simple low weight flap system with high aerodynamic performance34. The flap kinematic is characterized by a link/track system actuated by a rotary drive27. The kinematic system is covered by three flap-track fairings. In addition, a moveable pylon-extension fairing is used at the end of the pylon. As for the A321, the spanwise lift distribution is improved by an aileron droop26. For HINVA, the reference high lift setting is the landing configuration. As an alternative high lift configuration also the approach setting might be regarded. The corresponding deflection angles are listed in Table 2.
Table 2: Deflection angles of the Airbus A320-232
high lift setting Approach (config. 3) Landing (full)
slat deflection angle, s [o] 22 27
flap deflection angle, f [o] 20 40
aileron droop, ail [o] 0 5
The turbofan engines on the A320 are installed in a close-coupled way, see Figure 4. MBB in Germany was
responsible for the investigation of engine/airframe interference effects on the low speed high lift performance. In contrast to the preceding Airbus aircraft A300 and A310, the close vertical coupling of the engine requires a slat-cutout causing distinct losses in maximum lift, see Ref. 11 and Ref. 26. The slat/pylon junction was especially designed to alleviate these losses. A result of this study is the so-called beret-basque fairing on top of the pylon at the intersection with the wing, designed to optimize the effects of the spanwise gap of the inboard slat at the pylon. Another one is the nacelle strake, which is mounted in the baseline configuration on the upper inboard side of the nacelle in order to alleviate interference effects of the nacelle inboard vortex at the rear part of the fixed wing suction side behind the nacelle. Both devices can be seen in the CAD-model in Figure 4. In addition to adapting the wing/pylon/slat intersection, an inboard slat horn next to the side of body is mounted to stabilize the inboard slat edge vortex. The related design aspects are described in Ref. 36, a more general description is found in Ref. 11. The geometry of the wing/pylon/slat intersection is accurately modeled in the CAD description of the configuration including the spanwise gaps at the inboard and outboard side of the nacelle.
The project activities are focusing on the landing (full) configuration as the most relevant setting for the detailed analysis of maximum lift. Due to the fact that that flight test data are used for validation, the complete aircraft

American Institute of Aeronautics and Astronautics
8
configuration with deployed high lift devices, tracks and fairings, including the empennage is the geometric baseline reference, as shown in Figure 2 to Figure 4. Including the empennage and trim effects is a major difference with respect to previous high lift validation exercises.
Figure 4. Front view of the A320-200 with deployed high lift devices in landing configuration
Special attention is paid to incorporate as much geometric details as possible in the baseline configuration. For
the computation of the wind tunnel scenario in the ETW, the landing configuration will be considered without the empennage corresponding to the classical wall mounted half model set-up. In order to investigate an alternative high lift configuration and corresponding maximum lift performance increments, either a different high lift setting (approach) will be considered or the integration of specific lift enhancing modifications like a second nacelle strake or an enlarged slat horn. This issue is under discussion and not finally decided. The major configurative variation is represented by the cruise configuration with retracted high lift devices. Besides the different lift, speed and -regime of the cruise configuration, largely different stall and separation tendencies are observed compared to the high lift case. Again, the full cruise configuration including empennage will be considered. This configuration will not be wind tunnel tested. More details about the considered configuration and the CAD set-up are described in Ref. 37.
IV. Workpackage 1 – ATRA Flight Testing The rationale for the scheduled flight tests is to improve offsets between absolute flight test data, wind tunnel
and CFD results. Due to its purpose, regular flight test data for performance determination are usually limited with respect to the extent, repeatability, and flight test instrumentation (FTI). Insofar these data do not comply with the requirements of CFD and wind tunnel validation. Moreover, maximum lift is determined in flight as part of a maneuver, in which the stall condition is provoked during a weakly dynamic process. In wind tunnel (especially in pitch-pause mode) and CFD simulation distinct points on the lift curve are simulated to determine the stall. A major open issue is to link the stall determination in flight to steady or quasi-steady conditions, as typically used in wind tunnel and CFD simulations.
In addition to these issues, oftentimes the exact geometry of the high-lift configuration in flight is not exactly known, although some efforts have been made to resemble best the aircraft geometries in CFD and wind tunnel-models in the previous studies. Small discrepancies, e.g. in the representation of the wing twist or in the device settings (gap, overlap, deflection angle), are known to have a strong impact on the aerodynamic performance, especially in the nonlinear region of the lift curve and at its borders, i.e. in stall. Thus, major technical targets for the flight tests are to determine the deformation effects of the overall wing and also of the deployed devices in sufficient detail. Facing the actually required accuracy of the aerodynamic data, geometrical details like surface roughness, steps, and sealing deficiencies and other surface imperfections, and, as far as possible, the influence of the FTI itself are to be recorded and investigated by the numerical methods for the specific test aircraft under consideration. Furthermore, the correct description of the dynamic behavior of the aircraft entering the nonlinear lift range and its limits has to be explored. Many of these issues are at present not modeled consistently in CFD and in wind tunnel testing. They are seen as potential “missing links” to resolve the deficiencies in the simulation capabilities.

American Institute of Aeronautics and Astronautics
9
For the flight test activity two flight test campaigns are scheduled. This is reflected in the rather simple workpackage structure with three tasks:
- Task 1.1: Flight Test F/T 1
- Task 1.2: Flight Test F/T 2
- Task 1.3: Analysis and Refurbishment of F/T Data
The general approach is to apply widely matured in-flight measurement techniques for flight test campaign F/T 1 and to focus on more advanced techniques in F/T 2. In the next chapters the contents of both flight tests and the corresponding flight test instrumentation will be outlined and some considerations and the status of the preparations described in some detail. Due to the chronological sequence of the project activities a natural focus is laid on the first flight test campaign, scheduled for 2012. For F/T 1 the following measurement techniques are schedule to be implemented:
- Static and dynamic pressure measurement
- Transition measurement
- Aerial flow visualisation
- Wing deformation measurements
For the tests a mix of stall maneuvers and tests at stabilized points is scheduled for two aircraft weights and three aerodynamic configurations of the aircraft at different speeds and altitudes. A sketch of the resulting Mach and Reynolds number range is shown in Figure 5 for both, the high lift and the cruise configuration. The test data for the stall maneuver will be recorded over time to document as exact as feasible the maneuver itself and the development of the wing aerodynamics during the stall. An appropriate number of repeats will be flown to provide data with the required fidelity.
Figure 5. Scheduled Mach and Reynolds number range for the flight tests in F/T 1 The FTI will be applied to both wings, with the port wing being equipped with instrumentation for pressure and
transition measurements, and the starboard wing with the equipment for the optical test techniques, respectively. An overview of the instrumentation of the ATRA test aircraft for F/T 1 is sketched in Figure 6. The set-up and status of preparation will be outlined for each measurement techniques and briefly described hereafter.

American Institute of Aeronautics and Astronautics
10
Figure 6. Flight test instrumentation overview for F/T 1 Static and dynamic pressure measurement For the static pressure measurements the main wing, slat and flap will be equipped with 5 pressure belts, and the horizontal stabilizer (HS) with two pressure belts. The belts cover both sides of the wing and of the HS with a total of about 340 pressure taps on the wing (including slat and flap) and nearly 60 pressure taps on the HS. Figure 6 shows the positions of the pressure belts on the wing and on the HS. The spanwise belt positions for the wing with relative to the half span are 15%, 25%, 40%, 62%, and 84%. These positions have been chosen to capture critical areas on the high lift wing’s suction side at the wing-body intersection and close to the engine position where significant changes of the pressure distributions have been computed and at parts of the outer wing, which are rather unaffected by 3-dimensional effects. As outlined in the introduction it is regarded essential to have sufficient spanwise pressure sections in order to validate the prediction capabilities against the spanwise load situation and its changes over the angle of attack range. For the HS two sections at 45% and 67.5% half span have been selected in order to be outside of the fuselage boundary layer as well as sufficiently far away from the HS tip area. A main objective for the HS pressure detection is to capture the interference of the main wing wake with the HS. The definition of the spanwise positions and the chordwise distribution of the pressure belts on wing and HS have been carried out based on comprehensive numerical studies, conducted in Task 3.1. The belts on the main wing will be segmented in such a way, that the belt segment around the D-nose will be removed to switch the aircraft configuration from a high lift setting to the cruise setting. Special housings for pressure scanner and control units are designed and constructed at DLR, see Figure 7, and will be mounted inside the port wing, slat and flaps and connected to the data acquisition system inside the cabin. In addition two pressure scanners units are used for the HS. The design for the routing diagrams for the electrical wires and pneumatic tubing is in progress. Fit checks have been carried out on the aircraft to define the final locations for the belts and inspect the installation situation on the wing and its elements and on the HS including operational limitations for the application.
The installation of the components of the data a data acquisition system acquisition, i.e. a special PC for controlling and data collection, monitor, keyboard and the power supply system are located specially designed and manufactured racks in the cabin. The data acquisition PC is connected to the basic FTI of the airplane to ensure synchronous data acquisition.

American Institute of Aeronautics and Astronautics
11
Figure 7. CAD model of the housing for the pressure scanner units and the corresponding hardware For dynamic pressure measurements 16 Kulite sensors will be integrated into the pressure belts in order to
measure the degree of unsteadiness in areas where separation are anticipated. Their positions are indicated in Figure 6.
Transition measurements using hot film arrays
Hot film arrays will be installed on the main wing in order to measure the transition location in two spanwise locations of ATRA’s port wing on all high lift elements. This is a task of the Technical University of Berlin with its broad experience in flight experiments38, 39. It is intended to identify the boundary layer state and, as far as possible, the mechanism of transition. About 90 hot films sensors are scheduled to be used. Figure 6 depicts the location of the hot film-arrays on the high lift wing in two sections at 21.5% and 58% half span of the port wing. The arrays will be applied to the surface using suitable glue or adhesives. Additionally, small temperature sensors will be placed nearby the arrays in each stage. The main leads of all sensors have to be routed over the wing’s surface. A suitable routing with low interference of the aerodynamics in the critical arrays is currently being investigated. The lead wires will be connected to the conducting paths near the fuselage and will either be routed into the cabin through seals inside the main landing gear bay or through seals inside a dummy window. As a consequence of the long sensor wiring, constant temperature anemometers (CTA) are needed to operate in symmetrical mode to ensure unrestricted functionality. Thus, an additional compensation wiring of the same length as the sensor wiring needs to be placed inside the main landing gear bay to expose the sensor wiring as close as possible to the environmental conditions. As an effect the electrical characteristics of both wirings are nearly the same. A test installation in a climate test chamber of DLR to measure the sensor resistance under flight conditions is shown in Figure 8.
Figure 8. Test installation of a hot film sensor of TU-Berlin with electrical wiring
American Institute of Aeronautics and Astronautics
12
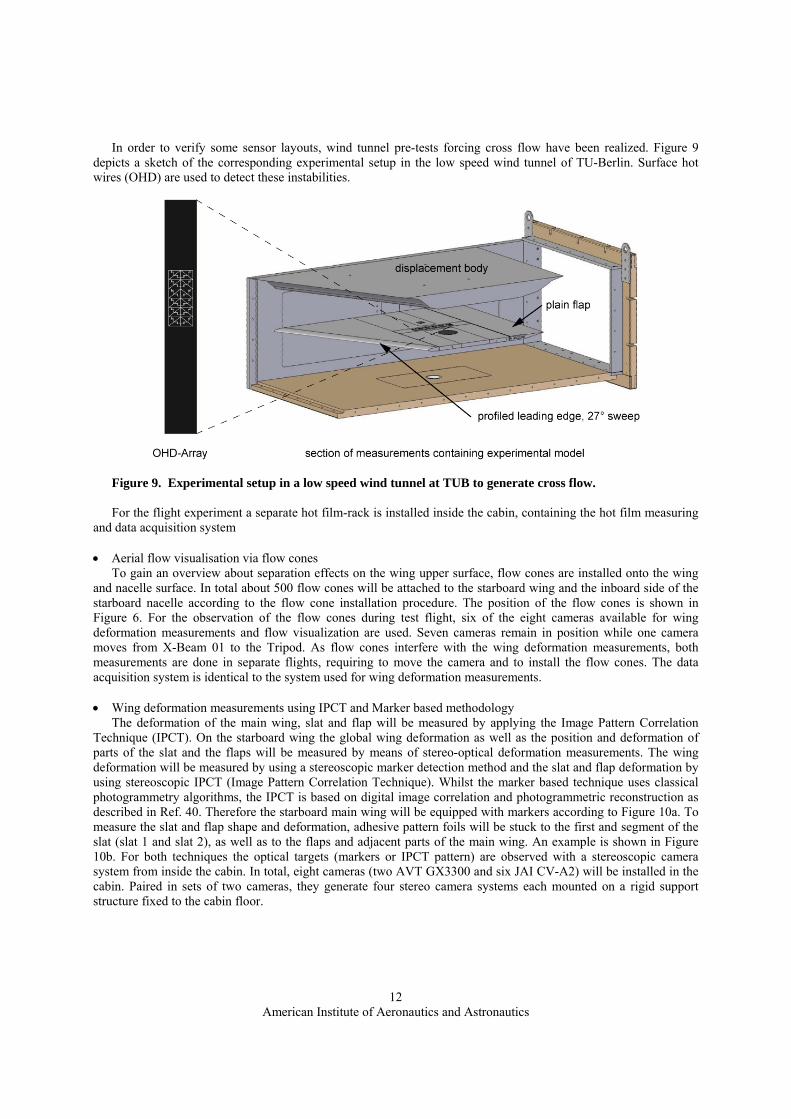
In order to verify some sensor layouts, wind tunnel pre-tests forcing cross flow have been realized. Figure 9 depicts a sketch of the corresponding experimental setup in the low speed wind tunnel of TU-Berlin. Surface hot wires (OHD) are used to detect these instabilities.
Figure 9. Experimental setup in a low speed wind tunnel at TUB to generate cross flow.
For the flight experiment a separate hot film-rack is installed inside the cabin, containing the hot film measuring
and data acquisition system
Aerial flow visualisation via flow cones To gain an overview about separation effects on the wing upper surface, flow cones are installed onto the wing
and nacelle surface. In total about 500 flow cones will be attached to the starboard wing and the inboard side of the starboard nacelle according to the flow cone installation procedure. The position of the flow cones is shown in Figure 6. For the observation of the flow cones during test flight, six of the eight cameras available for wing deformation measurements and flow visualization are used. Seven cameras remain in position while one camera moves from X-Beam 01 to the Tripod. As flow cones interfere with the wing deformation measurements, both measurements are done in separate flights, requiring to move the camera and to install the flow cones. The data acquisition system is identical to the system used for wing deformation measurements.
Wing deformation measurements using IPCT and Marker based methodology
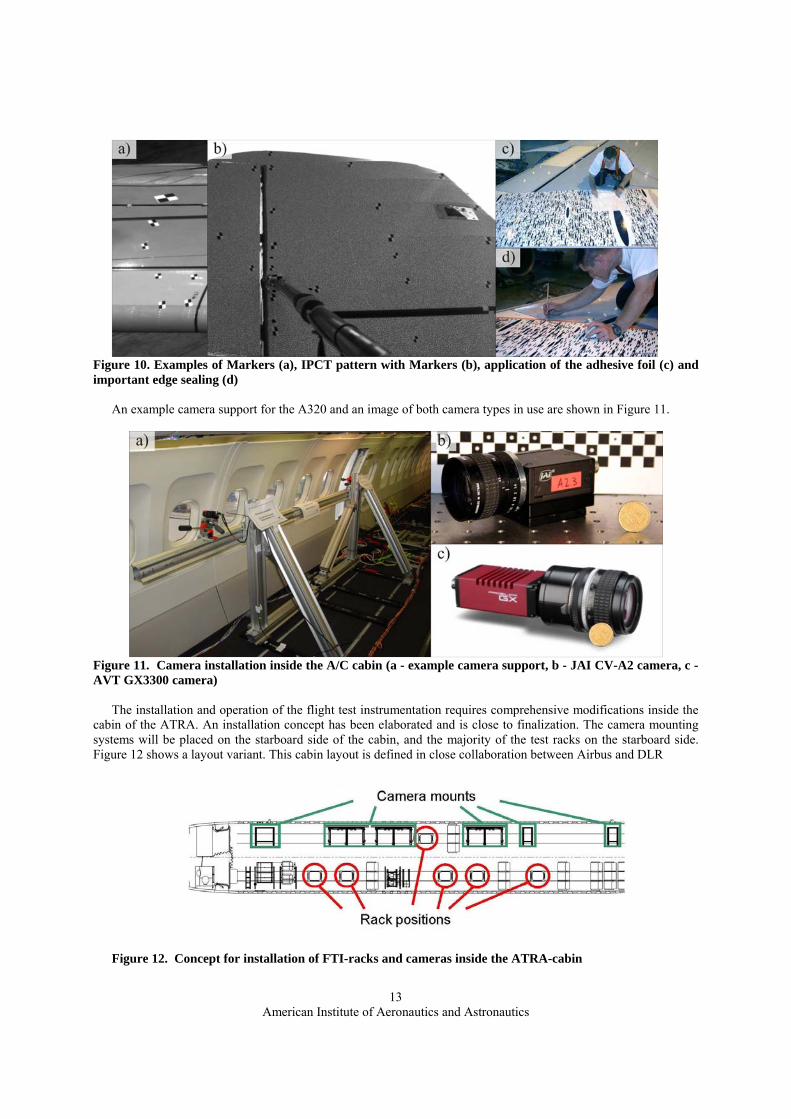
The deformation of the main wing, slat and flap will be measured by applying the Image Pattern Correlation Technique (IPCT). On the starboard wing the global wing deformation as well as the position and deformation of parts of the slat and the flaps will be measured by means of stereo-optical deformation measurements. The wing deformation will be measured by using a stereoscopic marker detection method and the slat and flap deformation by using stereoscopic IPCT (Image Pattern Correlation Technique). Whilst the marker based technique uses classical photogrammetry algorithms, the IPCT is based on digital image correlation and photogrammetric reconstruction as described in Ref. 40. Therefore the starboard main wing will be equipped with markers according to Figure 10a. To measure the slat and flap shape and deformation, adhesive pattern foils will be stuck to the first and segment of the slat (slat 1 and slat 2), as well as to the flaps and adjacent parts of the main wing. An example is shown in Figure 10b. For both techniques the optical targets (markers or IPCT pattern) are observed with a stereoscopic camera system from inside the cabin. In total, eight cameras (two AVT GX3300 and six JAI CV-A2) will be installed in the cabin. Paired in sets of two cameras, they generate four stereo camera systems each mounted on a rigid support structure fixed to the cabin floor.
American Institute of Aeronautics and Astronautics
13
Figure 10. Examples of Markers (a), IPCT pattern with Markers (b), application of the adhesive foil (c) and important edge sealing (d)
An example camera support for the A320 and an image of both camera types in use are shown in Figure 11.
Figure 11. Camera installation inside the A/C cabin (a - example camera support, b - JAI CV-A2 camera, c - AVT GX3300 camera)
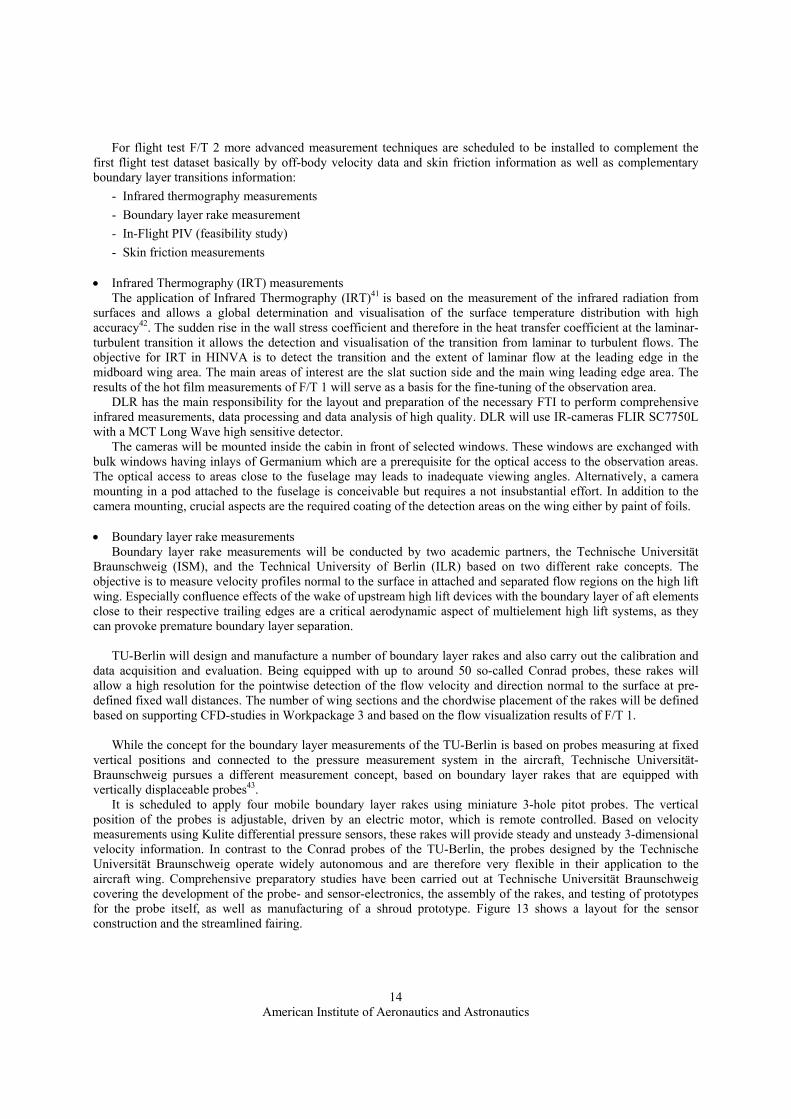
The installation and operation of the flight test instrumentation requires comprehensive modifications inside the cabin of the ATRA. An installation concept has been elaborated and is close to finalization. The camera mounting systems will be placed on the starboard side of the cabin, and the majority of the test racks on the starboard side. Figure 12 shows a layout variant. This cabin layout is defined in close collaboration between Airbus and DLR
Figure 12. Concept for installation of FTI-racks and cameras inside the ATRA-cabin
American Institute of Aeronautics and Astronautics
14
For flight test F/T 2 more advanced measurement techniques are scheduled to be installed to complement the first flight test dataset basically by off-body velocity data and skin friction information as well as complementary boundary layer transitions information:
- Infrared thermography measurements
- Boundary layer rake measurement
- In-Flight PIV (feasibility study)
- Skin friction measurements
Infrared Thermography (IRT) measurements The application of Infrared Thermography (IRT)41 is based on the measurement of the infrared radiation from
surfaces and allows a global determination and visualisation of the surface temperature distribution with high accuracy42. The sudden rise in the wall stress coefficient and therefore in the heat transfer coefficient at the laminar-turbulent transition it allows the detection and visualisation of the transition from laminar to turbulent flows. The objective for IRT in HINVA is to detect the transition and the extent of laminar flow at the leading edge in the midboard wing area. The main areas of interest are the slat suction side and the main wing leading edge area. The results of the hot film measurements of F/T 1 will serve as a basis for the fine-tuning of the observation area.
DLR has the main responsibility for the layout and preparation of the necessary FTI to perform comprehensive infrared measurements, data processing and data analysis of high quality. DLR will use IR-cameras FLIR SC7750L with a MCT Long Wave high sensitive detector.
The cameras will be mounted inside the cabin in front of selected windows. These windows are exchanged with bulk windows having inlays of Germanium which are a prerequisite for the optical access to the observation areas. The optical access to areas close to the fuselage may leads to inadequate viewing angles. Alternatively, a camera mounting in a pod attached to the fuselage is conceivable but requires a not insubstantial effort. In addition to the camera mounting, crucial aspects are the required coating of the detection areas on the wing either by paint of foils.
Boundary layer rake measurements
Boundary layer rake measurements will be conducted by two academic partners, the Technische Universität Braunschweig (ISM), and the Technical University of Berlin (ILR) based on two different rake concepts. The objective is to measure velocity profiles normal to the surface in attached and separated flow regions on the high lift wing. Especially confluence effects of the wake of upstream high lift devices with the boundary layer of aft elements close to their respective trailing edges are a critical aerodynamic aspect of multielement high lift systems, as they can provoke premature boundary layer separation.
TU-Berlin will design and manufacture a number of boundary layer rakes and also carry out the calibration and
data acquisition and evaluation. Being equipped with up to around 50 so-called Conrad probes, these rakes will allow a high resolution for the pointwise detection of the flow velocity and direction normal to the surface at pre-defined fixed wall distances. The number of wing sections and the chordwise placement of the rakes will be defined based on supporting CFD-studies in Workpackage 3 and based on the flow visualization results of F/T 1.
While the concept for the boundary layer measurements of the TU-Berlin is based on probes measuring at fixed
vertical positions and connected to the pressure measurement system in the aircraft, Technische Universität-Braunschweig pursues a different measurement concept, based on boundary layer rakes that are equipped with vertically displaceable probes43.
It is scheduled to apply four mobile boundary layer rakes using miniature 3-hole pitot probes. The vertical position of the probes is adjustable, driven by an electric motor, which is remote controlled. Based on velocity measurements using Kulite differential pressure sensors, these rakes will provide steady and unsteady 3-dimensional velocity information. In contrast to the Conrad probes of the TU-Berlin, the probes designed by the Technische Universität Braunschweig operate widely autonomous and are therefore very flexible in their application to the aircraft wing. Comprehensive preparatory studies have been carried out at Technische Universität Braunschweig covering the development of the probe- and sensor-electronics, the assembly of the rakes, and testing of prototypes for the probe itself, as well as manufacturing of a shroud prototype. Figure 13 shows a layout for the sensor construction and the streamlined fairing.

American Institute of Aeronautics and Astronautics
15
Figure 13. Sketch of the pitot probe of Technische Universität Braunschweig and oil flow study of the fairing
On the right hand side an oilflow picture of wind tunnel studies is shown, which have been carried out the small wind tunnel of Technische Universität Braunschweig in order to investigate appropriate outer shapes for the fairing.
A crucial aspect for the probe application will be to identify suitable application and wiring concepts for both types of boundary layer rakes. Corresponding studies are ongoing.
Feasibility study on In-Flight PIV
In addition to the more or less classical flow measurement techniques a feasibility study of the application of in-flight PIV to measure the flow field in the vicinity of the strake vortex above the wing. Thematically this corresponds to novel PIV-measurements in HINVA under cryogenic conditions in the ETW, described in chapter V, to reveal phenomena of engine/airframe interference effect for flight Reynolds numbers. Providing such data would allow to consistently investigate, compare, and assess the numerical capabilities of important stall-relevant vortex related flow phenomena for all three methods under investigation in HINVA. Nevertheless, as outlined below the step from the first successful demonstrations of the In-flight PIV technique to the required application with a large commercial aircraft is very challenging and connected with various risks with regard of flight approval of the test technique and other issues. Therefore, a feasibility study appears the right approach to explore the potential and identify crucial aspects.
The first successful application of the PIV in flight was performed in September 2009 during the EC-project AIM (Advanced In-flight Measurement Techniques) and is described in Ref. 44. To perform in-flight PIV measurements particles in the flow (e.g. cloud particles) are illuminated by a laser and recorded by at least one camera, both installed behind the windows inside the cabin. Figure 14 shows an example installation in the DLRs Dornier Do228-101.
Figure 14. In-flight PIV setup inside the DLR Do228-101 aircraft cabin and sketch of the PIV laser light sheet

American Institute of Aeronautics and Astronautics
16
With this PIV setup a cut-out of the flow field around the aircraft can be measured in a non-intrusive way. Figure 15 shows as a sample an instantaneous velocity vector field of in-flight PIV measurement as part of the AIM project.
Figure 15. Sample of instantaneous velocity vector field of in-flight PIV measurement
Skin friction measurements The Technical University of Berlin (ILR) is responsible for skin friction measurement on the high lift wing. The
objective is to detect local separation and determine the magnitude of the wall shear stress. As for the boundary layer rake measurements, the observation areas will be defined based on supporting CFD studies and the results of the flow visualization in F/T 1. Typical areas of interest are the trailing edge regions of the fixed wing and the flap. It is scheduled to apply a mix of Preston tubes and advanced delta hotfilm probes to determine skin friction values and direction45. As Preston tubes don’t provide a directional information of the wall shear stress, delta hotfilms can be used in a complementary way to measure the shear stress with full directional information. Moreover, the Preston tubes provide valuable flow information to calibrate the delta hotfilms. Crucial points for an application in a flight test are the sensitivity of the delta hotfilms with respect to vibrations and their general handling, as the film height is less than 50μm. Moreover, the susceptibility of the delta hot films to humidity limits the operational conditions. For both types of sensors application concepts will have to be carefully elaborated and demonstrated in preparing wind tunnel test at the TU- Berlin prior to the second flight test campaign. The application of the measurement techniques has been successfully demonstrated in previous large scale flight test experiments 46.
V. Workpackage 2 – ETW Wind Tunnel Testing The European Transonic Windtunnel (ETW) facility in Cologne, Germany, is a high Reynolds number transonic
wind tunnel using nitrogen as the test gas. High Reynolds numbers are achieved under the combined effects of low temperatures and moderately high pressures. ETW has a closed aerodynamic circuit with a Mach number range from M = 0.15 to 1.3. The test section is 2.00 m high, 2.40 m wide, and equipped with removable inserts in the bottom wall and the side walls. For high lift testing usually the solid wall option is selected. Due to the complexity and large variety of high-lift configurations, the wind tunnel optimization and verification plays a central role for high-lift aerodynamic design validation and derivation of aerodynamic data. Besides large amounts of testing in more cost-efficient low-Reynolds-number facilities, the testing in ETW became of central importance, as it is the only European facility, which has the ability to simulate relevant aircraft at flight Reynolds numbers. Even if the amount of configuration variations has to be balanced against the significant testing effort in a cryogenic facility, the results represent the key benchmark for the validity of the complete set of testing results from other facilities. However, in comparison to flight test data an improvement of the reliability of the results still for maximum lift and incidence of stall onset is requested. A general question is to what extent and accuracy half model results can not only provide lift increments, but also contribute to the prediction of absolute lift values.
The objectives for the ETW test are twofold, both elements shall be briefly described in the following.

American Institute of Aeronautics and Astronautics
17
A major objective is to generate a unique validation data set for the ATRA in high lift configuration. For this purpose a single entry is scheduled. For the tests an existing Airbus A320 half model for cryogenic testing, designated as K3DY, will be the basis. The model is shown in Figure 16.
Figure 16. K3DY model in the ETW test section The K3DY model will be significantly refurbished. A main element of the modification is to design a new high
lift wing with a more representative jig-shape for the high lift load situation than the one used for the existing model. The shape of the new wing will be representative for a high lift stall situation. The required data will be provided from the IPCT-deformation measurements of the first flight test campaign F/T 1 in Workpackage 1. Accompanying fluid-structure interaction simulations based on the finite element model of the model wing will be carried out in Workpackage 3 to ensure, that the deformations of the model wing under aerodynamic loads in the ETW test section will exhibit the desired deformation behavior of the real aircraft wing. The wing deformation and device setting will also be measured during the wind tunnel tests.
The model will be available in two high lift configurations/settings. Furthermore, a new flow-through nacelle is
required, being representative for the IAE 2500-A5 engine. The contours of the flow-through-nacelle have been specified by Airbus, the CAD model is generated at DLR. The nacelle is equipped with three chordwise pressure sections and additional tabs on the upper part of outer inlet contour around the strake position. The construction and manufacture is the nacelle is in progress. Dedicated efforts will be devoted to the assessment of the geometric representation of the wind tunnel model compared to the real aircraft geometry, e.g. at slat tracks or with respect to external routing of pressure tube bundles. As common practice for high lift half model testing the empennage of the real aircraft is neglected for the wind tunnel model. The definition of the peniche height will be revisited, taking into account recent numerical investigations that have been carried out in a national47, and international framework9. Figure 17 shows as an example wall streamlines on the DLR-F11 high lift configuration for three different heights of the peniche interface between model and wind tunnel wall. The influence on the development of the vortices at the wing-body junction is clearly visible. The studies have been carried out by DLR as part of the EC-project FLIRET (Flight Reynolds Number Testing)26. The findings will be evaluated to define on optimized peniche height for the present investigations on the K3DY model in HINVA.

American Institute of Aeronautics and Astronautics
18
Figure 17. TAU-computations of wall streamlines for different peniche heights on a high lift research configuration DLR-F119
For the test in ETW the following measurement techniques are schedule to be implemented:
- Static pressure measurements
- Transition measurement
- Deformation measurements
- Aerial velocity measurements based on PIV Static pressure measurements
The new model will be equipped with about 450 pressure holes in 5 spanwise sections and in rows along the wing span. The spanwise and chordwise positions of the pressure tabs are chosen to be identical to the location of the pressure holes in the belts on the wing of the test aircraft. All elements are equipped with pressure tabs, as well as the nacelle. Transition measurements
The laminar to turbulent transition is detected by means of Temperature Sensitve Paint (TSP). Up to 4 cameras are available at ETW to observe the painted surface of the model. A number stabilized point of characteristic angles of attack up to stall conditions will be evaluated. Deformation measurements
The deformation is observed based on the Stereo-Pattern Tracking (SPT) technique and its enhanced version, ESPT. Main areas of interest are the twist and bend of the fixed wing and the flap. The flap gap is also scheduled to be monitored for defined stabilized flow conditions. The technique delivered quite satisfying result in a similar set-up in studies of the EC-project EUROLIFT II24. Aerial velocity measurements based on PIV
The engine/airframe interference is know to be crucial for the high lift performance of commercial jet aircraft with under-the-wing mounted high bypass engines11. An essential issue for the validation of CFD-codes in this context is to detect the aerodynamic interaction of the nacelle and strake vortices with the boundary layer in the aft part of the fixed wing’s suction side. Particle image velocimetry represents a suitable tool to provide 3-component velocity information in almost arbitrarily orientated cross-sections of the flowfield. The ability to observe relevant regions of the flowfield for these effects could be successfully demonstrated in the EC-project EUROLIFT II, where 5 sections perpendicular to the model longitudinal axis have been observed48. The wind tunnel tests were carried out on the DLR-F11 high lift configuration for low-Reynolds number conditions in the atmospheric wind tunnel of Airbus in Bremen. On the other side, investigations of the stall characteristics on this configuration revealed significant Reynolds number effects49. There is at present no evidence, to what extent the sensitive formation of the

American Institute of Aeronautics and Astronautics
19
strake vortex, its spatial development and interference with the fixed wing boundary layer is affected by Reynolds number scaling effects.
Based on the significant progress to apply the PIV technique in a cryogenic wind tunnel environment50, a PIV application is also scheduled for the ETW test of the K3DY configuration to provide the missing flowfield information at flight conditions in at least two sections above the high lift wing. In the context of the preparation and maturation of the cryo-PIV technique, the challenging set-up of the camera system including a suitable mirror arrangement and a suitable thermal protection concept has been addressed. Successful test could be carried out as described in Ref. 50. Figure 18 shows the optical arrangement of these tests outside the test section of ETW.
Figure 18. Optical arrangement the application of cryo PIV for a pre-test in the ETW The second focus of the research activities in Workpackage 2 lies on the improvement of the corrections of wall
interference effects. Different correction methods will be analyzed and compared to flight test and corresponding numerical results in order to check and improve the correction methods for the specific situation at ETW.
To carry out the experimental activities in Workpackage 2 as outlined above a similar workpackage structure as
for the flight test activities is chosen.
- Task 2.1: Refurbishment of Existing ETW Test Data
- Task 2.2: ETW Wind tunnel Test W/T 1
- Task 2.3: Analysis and Assessment of W/T Data In contrast to Workpackage 1, where two test campaigns are scheduled, a single test entry is foreseen in the wind
tunnel workpackage focusing exclusively on testing at flight Reynolds numbers. The activities the layout and construction of the wind tunnel model have been recently launched with the model manufacture scheduled for 2012, and the EW test entry is scheduled for early 2013.
VI. Workpackage 3 – Numerical Simulation The numerical workpackage is of central importance as it has strong links to both experimental workpackages 1
and 2. The numerical activities are subdivided in 6 Tasks, as listed below:
- Task 3.1: CFD-Studies - A320 F/T
- Task 3.2: CFD-Studies - ETW-W/T
- Task 3.3: Wing/HS Interference & Trim
American Institute of Aeronautics and Astronautics
20
- Task 3.4: CL,max - Determination, CFD
- Task 3.5: CL,max - Determination, CFD-CSM
- Task 3.6: Maneuversimulation - Stall (CFD-CSM-FM)
The tasks can be grouped in three main thematic areas. Task 3.1 and 3.2 are intended to provide direct support for the respective experimental activities in Workpackage 1 (Task 3.1) and Workpackage 2 (Task 3.2). In Task 3.3 numerical studies for the investigation of the aerodynamic interference between wing and horizontal stabilizer and its impact on the overall load balance around maximum lift is investigated. Task 3.4 through Task 3.6 represent the virtual validation studies of the numerical methods. The level of sophistication of the numerical simulation is subsequently increased in these Tasks, stating from a standard CFD approach dealing with rigid configurations in Task 3.3, over maximum lift computations based on a fluid-structure interaction approach in task 3.4, to the most sophisticated numerical approach in task 3.6, with the objective to simulate the stall maneuver as flown throughout the flight test and considering the flexible (static aeroelastic effects only) full aircraft on a predefined trajectory. A more comprehensive description of the set-up and recent results of the numerical activities in Workpackage 3 of HINVA are given in Ref. 37. In the present context, only a brief overview is given with some examples of the numerical studies conducted so far in the various tasks.
As mentioned in the introduction, all mono- and multidisciplinary numerical studies are based on DLR’s TAU code, a finite volume code system to solve the Reynolds-averaged Navier-Stokes equations for compressible flows on unstructured hybrid grids51. The standard solver uses an edge-based dual-cell approach, i.e. a vertex-centred scheme, where inviscid terms are computed employing either a second-order central scheme or a variety of upwind schemes using linear reconstruction for second-order accuracy. Viscous terms are computed with a second-order central scheme. Scalar or matrix artificial dissipation can be selected as well as a variety of turbulence models ranging from simple algebraic models to implicit Reynolds-Stress models. The code has been developed at DLR52, 53 and is used in the aeronautics industry and by national and international academic research partners. At Airbus, the code is used among other purposes for high lift system design and related flow simulations on complex commercial aircraft configurations.
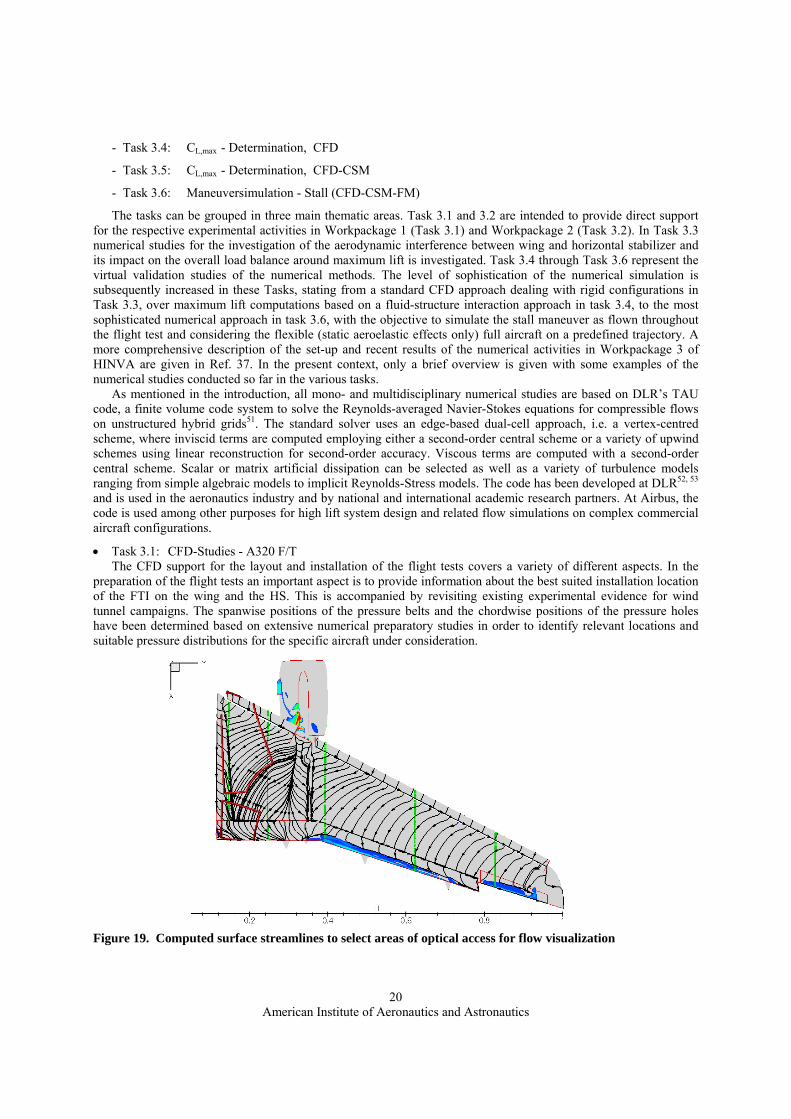
Task 3.1: CFD-Studies - A320 F/T The CFD support for the layout and installation of the flight tests covers a variety of different aspects. In the
preparation of the flight tests an important aspect is to provide information about the best suited installation location of the FTI on the wing and the HS. This is accompanied by revisiting existing experimental evidence for wind tunnel campaigns. The spanwise positions of the pressure belts and the chordwise positions of the pressure holes have been determined based on extensive numerical preparatory studies in order to identify relevant locations and suitable pressure distributions for the specific aircraft under consideration.
Figure 19. Computed surface streamlines to select areas of optical access for flow visualization

American Institute of Aeronautics and Astronautics
21
Another important activity was devoted to investigations of the expected transition location on all elements of the high lift configuration for selected angles of attack to guide the placement of the hot films for F/T 1. For this purpose the transition module of the TAU- code has been used for a full high lift configuration. At present, it takes into account Tollmien-Schlichting transition, transiton by crossflow instabilities, and transition by laminar separation54. Attachment line transition has been estimated separately by evaluating and checking for the Reynolds number for the attachment line flow based on the leading edge radius criterion according to Pfenniger.
Further activities of Task 3.1 concern supporting evaluation of the separation scenario on the inner wing surface. In Figure 19 an example of computed wall streamlines is shown, which is used to check and adjust the camera observation areas. Future studies will be devoted to the determination of the influence of the installed FTI on the aerodynamic properties by simulation the high lift wing with and without pressure belts
Task 3.2: CFD-Studies - ETW-W/T The set-up fort the supporting CFD-simulations for the ETW testing is comparable to that of Task 3.1. Main
objectives are to assess the wall interference in the closed test section and to investigate the influence of different peniche heights in order to find the best compromise between heaving the model out of the tunnel’s wall boundary layer and spurious aerodynamic effects by vortex interactions due to the modified fuselage cross section. Figure 20 shows a sketch of an in-tunnel computation of DLR considering a half model high lift configuration in the ETW test section. The cross section, the nozzle area, as well as the downstream part of the tunnel duct including the mounting device have been simulated 9.
Figure 20. TAU simulation of a half model configuration in the ETW test section On the right hand side a surface grid of the model and the tunnel duct is depicted. In contrast to free-flight
simulations, the grids have to be regenerated for each angle of attack due to the changing geometric situation. Using the Chimera grid approach, as shown on the upper right picture, combines a constant high grid quality in the proximity of the model for all angles of attack with an effective grid generation process.
Task 3.3: Wing/HS Interference & Trim The investigations of the interference of the wing with the horizontal stabilizer are conducted by two academic
partners. The University of Stuttgart carries out numerical studies for the cruise configuration, while the Technische Universität Braunschweig investigates the reference high lift configuration. Baseline grids are provided by DLR. Both partners modify the grids with their own tools to allow the requested wake resolution. Areas with structured grids are inserted in the baseline grid in regions of the computational domain that are sensitive for the interaction. Figure 21 shows a corresponding cut of the grid of the cruise configuration as part of preparatory studies by the University of Stuttgart and the area of modification. The cut on the left hand side depicts the initial grid, and the one ion the right hand side the modified grid region. The sections of the wing and the HS are visible, two.

American Institute of Aeronautics and Astronautics
22
Figure 21. Grid modification in the wake of the wing in cruise configuration by U-Stuttgart
Figure 22 depicts cross section of the baseline and a modified grid perpendicular to the longitudinal axis of the high lift configuration as part of the work carried out by the Technische Universität Braunschweig. The grid modification focuses on a well known deficiency of the grid generation system in use at DLR with respect to the so-called chopping of structured prism layers in corners of the configuration. The inserted grid area reveals improved regular grids especially at the junction of HS and fuselage. On the right hand side resulting isobars and streamlines are shown on the surface of the HS as a result of a TAU computation by Technische Universität Braunschweig on the modified grid.
Figure 22. Modification of the grid at the fuselage and HS intersection for the high lift configuration by Technische Universität Braunschweig

American Institute of Aeronautics and Astronautics
23
Task 3.4: CL,max -Determination, CFD In Task 3.4, the baseline CFD activities are carried out. This comprises several subtasks. The first step is the
compiling and refurbishment of CAD data (CATIA V5) by DLR and Airbus for the ATRA test aircraft with all its components and for the geometry of the wind tunnel model. A major advantage is the access to the test aircraft during fit checks and the ability to look in detail on consistency and simplifications of the complete geometry data set. The second major subtask is the generation of numerical grids. The commercial grid generation package Centaur55 is at present the tool of choice to generate grid for complex configurations at DLR and Airbus. Comprehensive numerical studies have been carried out to analyze the flow features and grid resolution requirements of the ATRA high lift and cruise configuration at low speed high lift flow conditions. The resulting baseline grid for the full high lift configurations consists of more than 80mil. grid points, while for the cruise configuration grid slightly below 30mil. points are used. This has turned out to be currently the best compromise between grid resolution and computational effort taking into account the large number of computations that are scheduled in the test case matrix of Workpackage 3. At present the Solar grid generation package56 is also being investigated at DLR to explore its capabilities for high quality hybrid unstructured grid around various aircraft configurations. As part of grid generation studies within HINVA, DLR succeeded in generating a SOLAR grid for a complete transport aircraft configuration with deployed high lift devices, empennage, and geometric details, such as slat tracks. Figure 23 shows the corresponding surface grids of comparable resolution and overall grid point number for the full A320 high lift configuration, generated with the two afore mentioned grid generation tools.
Figure 23. Surface grids for the full A320 high lift configuration generated with different gridding tools Figure 24 shows an example of the subsequent step of CFD computations. The preliminary computations of the ATRA configurations have been used to elaborate a suitable set-of numerical parameters and assess the simulation
Figure 24. Cross section cut at a midchord and an evaluation of the vortex development
American Institute of Aeronautics and Astronautics
24
quality at a variety of relevant flow features, such as the resolution of vortices at the engine/pylon/wing intersection. For this set-up rigid geometries are considered according to the standard approach to compute lift polars. Concnering turbulence model the original Spalart-Allmaras model serves as the baseline option. An implicit full Reynolds Stress model developed at DLR is also evaluated in order to assess the potential improvements due to the turbulence model for the present maximum lift computations.
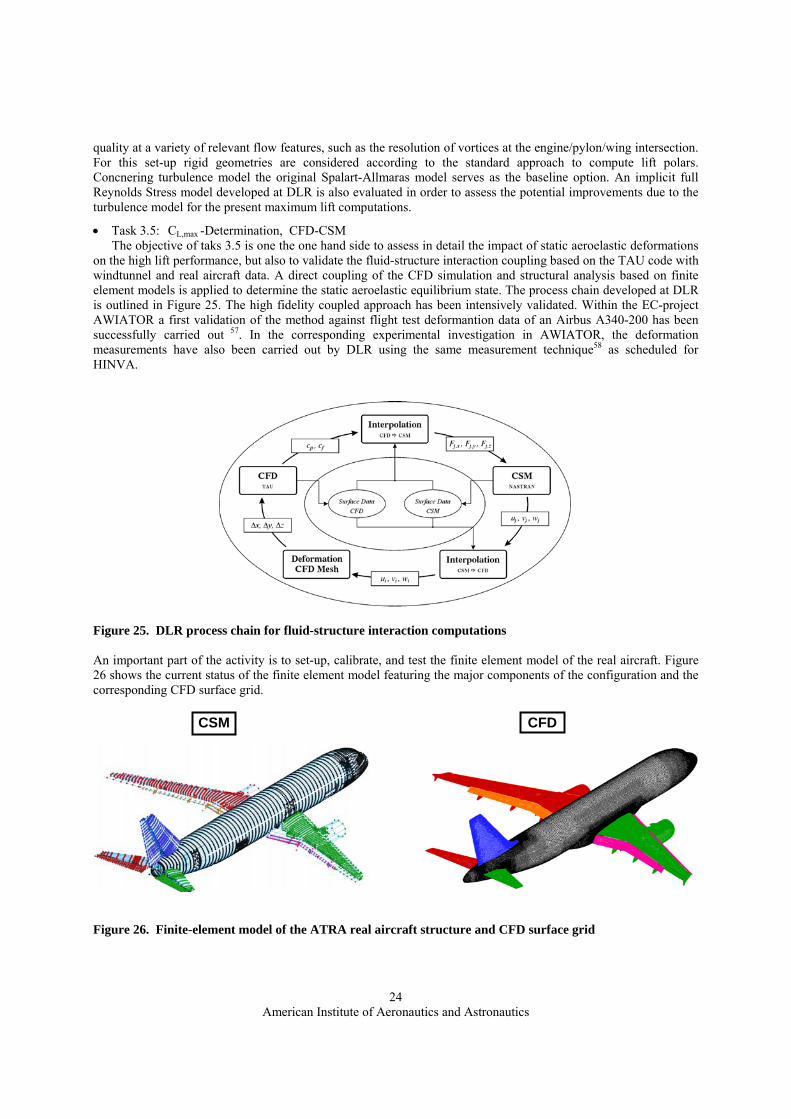
Task 3.5: CL,max -Determination, CFD-CSM The objective of taks 3.5 is one the one hand side to assess in detail the impact of static aeroelastic deformations
on the high lift performance, but also to validate the fluid-structure interaction coupling based on the TAU code with windtunnel and real aircraft data. A direct coupling of the CFD simulation and structural analysis based on finite element models is applied to determine the static aeroelastic equilibrium state. The process chain developed at DLR is outlined in Figure 25. The high fidelity coupled approach has been intensively validated. Within the EC-project AWIATOR a first validation of the method against flight test deformantion data of an Airbus A340-200 has been successfully carried out 57. In the corresponding experimental investigation in AWIATOR, the deformation measurements have also been carried out by DLR using the same measurement technique58 as scheduled for HINVA.
Figure 25. DLR process chain for fluid-structure interaction computations An important part of the activity is to set-up, calibrate, and test the finite element model of the real aircraft. Figure 26 shows the current status of the finite element model featuring the major components of the configuration and the corresponding CFD surface grid.
Figure 26. Finite-element model of the ATRA real aircraft structure and CFD surface grid
CFDCSM

American Institute of Aeronautics and Astronautics
25
Task 3.6: Maneuver Simulation - Stall (CFD-CSM-FM) The maneuver simulation scheduled in Tasks 3.6 represents the highest degree of sophistication of the numerical
studies in HINVA. The information of the flight parameters, such as aircraft attitude and altitude, will be evaluated to define a guided maneuver that will be the basis for a coupled computation considering the aeroelastic deformation of the aircraft and the flight mechanics parameters during the stall maneuvers. The comparison to the results of the computations in Tasks 3.4 and 3.5 will reveal to what extend the high lift performance is influenced by effects of changing onflow parameters and the weakly unsteady change in the global aerodynamics on the high lift system throughout the stall maneuver. The general set-up of the TAU-code with the coupling of the disciplines including the flight mechanics module has been established in preceding national projects. The computations will be started when the flight test data are available and evaluated.
VII. Conclusion and Outlook The research project HINVA is set-up to improve the capabilities of modern CFD methods and flight Reynolds
number wind tunnel testing for the reliable prediction of low speed maximum lift on commercial aircraft high lift configurations. Essential cornerstones are dedicated flight tests on the ATRA Airbus A320-200 research aircraft of DLR, to be prepared and conducted in close collaboration between Airbus and DLR. All three method blocks are closely aligned and strongly support each other. The range of variations in methods, parameters, and numerical approaches is limited to focus on the challenging targets of the project and make best use of indispensible preceding studies and development activities in national and international projects that have matured the methods in use to be ready for the present task. Comprehensive activities have been carried out by the involved partners in all three workpackages. Main results are outlined and presented in the paper in all methodological and technical fields, describing the level of preparation presently ach ieved. The detailed preparation of the first flight test in 2012 is entering the decisive phase. A successful flight test is the major milestone to continue with the intended validation efforts for the validation of the numerical methods, but at the same time a main prerequisite for the wind tunnel test activities, due to the link with the flight test deformation information.
Acknowledgments The research work discussed in the paper is funded as part of the German Aeronautical Research Program LuFo
IV. The authors are grateful to be selected to receive the funding for the present research project. Special thanks to all involved HINVA partners for their engagement and the technical contributions.
References 1Rumsey, L. R., Ying, S. X., “Prediction of high lift: review of present CFD capability”, Progress in Aerospace Sciences,
Vol. 38, Iss. 2, pp. 145 - 180, 2002 2J.B. Vos, A. Rizzi, D. Darracq, E.H. Hirschel, “Navier–Stokes solvers in European aircraft design”, Progress in Aerospace
Sciences, Vol. 38, Iss. 8, pp. 610 - 697, 2002 3Rudnik, R., Eliasson, P. and Perraud, J. “Evaluation of CFD methods for transport aircraft high lift systems”, The
Aeronautical Journal, Vol. 109, 2005, No. 1092, pp. 53-64, 2005 4D. Reckzeh, H. Hansen, “High Reynolds-Number Windtunnel Testing for the Design of Airbus High-Lift Wings”, in New
Results in Numerical and Experimental Fluid Mechanics V, Notes on Numerical Fluid Mechanics and Multidisciplinary Design, 2006, Volume 92/2006, 1-8, DOI: 10.1007/978-3-540-33287-9_1, 2006
5Quest, J., Hansen, H., Mesuro, G.G., “First Measurements on an Airbus High Lift; Configuration at ETW up to Flight Reynolds Number”, AIAA-2002-0423, 2002
6Reckzeh, D, “Aerodynamic Design of the High-Lift Wing for a Megaliner Aircraft”, Aerospace Science & Technology; pp. 107 – 119, 2003
7Thibert, J. J., “The GARTEUR High Lift Research Programme”, AGARD-CP-515 High Lift System Aerodynamics, 1993, pp. 16-1 – 16-21, 1993
8Rudnik, R., Thiede, P., “European Research on High Lift Aircraft Configurations in the EUROLIFT Projects”, CEAS/KATnet Conference on Key Aerodynamic Technologies, CP, 2005, pp. 16.1-16.8., 2005
9Melber-Wilkending, S., Wichmann, G., „Application of Advanced CFD Tools for High Reynolds Number Testing“, AIAA 2009-418, 2009
10G. Dargel, H. Schnieder, „GARTEUR AD(AG08) – Final Report”, GARTUER TP-043, November 1989 11Haines, A. B., “Scale Effects at High Lift and Low Speeds”, AGARD-AG-323 Scale Effects on Aircraft and Weapon
Aerodynamics edited by Young, A. D., 1999, pp. 27 – 65 12A.D. Welte et. al., ‘Analysis of the Reynolds Number and Mach Number Effects and of the 2D-3D Correlation based on
Measurements and on Computed Results for the GARTEUR Take-off Configuration, GARTUER TP-082, July 1994

American Institute of Aeronautics and Astronautics
26
13X Lindblad, I. A. A., de Cock, K. M. J., ‘CFD Prediction of Maximum Lift of a 2D High Lift Configuration’, AIAA-99-3180, 1999
14Yin, L.P. et.al., “Overview of the NASA B737-100 High-Lift Flight Research Program“, ICAS Paper 94-1.1.2 (1994) 15Yip LP, van Dam CP, Whitehead JH, Hardin JD, et.al., “The NASA B737-100 high-lift flight research programme –
measurements and computations. Aeronaut J. 1995;99:372–86. 16R.C. Potter and C.P. van Dam “Viscous-Flow Analysis of a Subsonic Transport Aircraft High-Lift System and Correlation
with Flight Data”, NASA CR-199610, 1995 17Ch. L. Rumsey, S. X. Ying “Prediction of high lift: review of present CFD capability”, Progress in Aerospace Sciences,
Volume 38, Issue 2, February 2002, Pages 145-180 18D. Ball, “Recent Applications of CFD to the Design of Boeing Commercial Transports”, in High-performance computing
of industrial flows, ed. by J.-M. Buchlin, P. Rambaud, Ph. Planquart, VKI LS 2009-05, hardcover, 1 volume, ISBN 978-2-930389-93-1
19P. Eliasson, F. Moens, H. Jakob, C. Newbold and H. Maseland. “3D High-Lift Computations”. FOI Memo 784, GARTEUR TP-133, March 2004.
20Rudnik, R., Thiede, P., „European Research on High Lift Aircraft Configurations in the EUROLIFT Projects”, CEAS/KATnet Conference on Key Aerodynamic Technologies, CP, 2005, pp. 16.1-16.8.
21H.Hansen, P. Thiede, R. Rudnik, F. Moens and J. Quest. “Overview about the European High Lift Research Programme EUROLIFT”. AIAA 2004-767, 42nd AIAA Aerospace Sciences Meeting and Exhibit. Reno(Nevada), January 2004.
22J. Quest, M. C. Wright, et.al. “First Measurements on an Airbus High Lift Configuration at ETW up to Flight Reynolds Number“, AIAA-2002-0423, 40th AIAA Aerospace Sciences Meeting and Exhibit. Reno(Nevada), January 2002.
23Rudnik, R., H. Frh. v. Geyr, „The European High Lift Project EUROLIFT II – Objectives, Approach, and Structure“, AIAA 2007-4296 (2007)
24R. Rudnik, Germain, E., „Reynolds-Number Scaling Effects on the EUROPEAN High Lift Configurations”, Journal of Aircraft, Vol. 46, No. 4, July-August 2009, pp. 1140-1151. (2009)
25Kroll, N. und Becker, K. und Rieger, H. und Thiele, F., “MEGADESIGN and MegaOpt - German Initiatives for Aerodynamic Simulation and Optimization in Aircraft Design”, Springer-Verlag Berlin, Heidelberg. ISBN 978-3-642-04092-4. ISSN 1612-2909, 2009
26W. Kühn, “Flight Reynolds Number Testing – The European Project FLIRET”, European Congress on Computational Methods in Applied Sciences and Engineering, STS-12, June 30 – July 5, 2008, Venice, Italy, 2008
27Van Dam, C. P., “The aerodynamic design of multi-element high-lift systems for transport airplanes”, Progress in Aerospace Scienes, 38, 2002, pp. 101–144.
28Flaig A, Hilbig R., “High-lift design for large civil aircraft”, AGARD High-Lift System Aerodynamics, CP 515, Sept. 1993, pp. 31-1–31-12.
29Eisfeld, B., “The German National Joint Project MUNA: Management and Minimization of Uncertainties and Errors in Numerical Aerodynamics”, in: Proceedings. 5th European Conference on Computational Fluid Dynamics, ECCOMAS CFD, 14-17 Jun 2010, Lisbon. ISBN 978-989-96778-1-4.
30European Aviation Safety Agency, “EASA Type-Certificate Data Sheet No. EASA.A.064 for AIRBUS A318 - A319 - A320 - A321”, TCDS No.: A.064, Iss. 07, 2011
31K. Hünecke, „Die Technik des modernen Verkehrsflugzeuges“, Motorbuch Verlag, 2008, ISBN 978-3-613-02896-8 32IAE, “V2500 - The engine of choice for Airbus A319, A320, and A321, Boeing MD-90 twinjet, Airbus Corporate Jetliner”,
engine fact sheet, www.i-a-e.com 33European Aviation Safety Agency, “EASA Type-Certificate Data Sheet IM.E.069 - IAE V2500-A5 & -D5 series engines”,
TCDS IM.E.069, Iss. 01, 2010 34J.R. Wedderspoon, “The High-Lift Development of the A320 Aircraft”, ICAS-86-2.3.2 (1986). 35P. K. C. Rudolph, “High-Lift Systems on Commercial Subsonic Airliners”, NASA Contractor Report 4746, Sept. 1996 36Schwetzler, D., “Improvement of Maximum Lift in Flight by Optimization of Vortex Flow”, Procceding of the High-Lift
and Separation Control Conference, Univ. of Bath, United Kingdom, 29.-31. March 1995, pp. 4.1-4.10, 1995. 37N. F. Bier, D. Rohlmann, et. Al. “Numerical Maximum Lift Predictions of a Realistic Commercial Aircraft in Landing
Configuration", 50th AIAA Aerospace Sciences Meeting Including the New Horizons Forum and Aerospace Exposition, January 2012, Nashville, TN, AIAA-2012-0279, 2012
38Suttan, J., Baumann, M., Fühling, S., Becker, S., Lienhart, H. and Stemmer, C., „In–Flight Research on Boundary Layer Transition - Works of the DFG–University Research Group”, in New Results in Numerical and Experimental Fluid Mechanics (NNFM 60). Vieweg Verlag, 343-350. 1997
39Peltzer, I.; Suttan, J. & Nitsche, W., “Low and High Speed Flight Experiments on Transition Detection”, Journal of Aircraft, 2008, 45, 1937-1944
40F. Boden, T. Kirmse, T. Weikert, T. Wolf, C. Petit, H. W. Jentink, H.W: “Application of a new optical Measurement Technique for Non-Intrusive Wing Deformation Measurement on a Large Transport Aircraft.” 21st SFTE (EC) Symposium, 3. - 6. October 2010, Vergiate (VA) Italy.
41Quast, A., Detection of Transition by Infrared Image Technique, IEEE publication CH2449-7/87, ICIASF, 1987 42U. Fey, K. de Groot, Y. Le Sant, Thermography as a Tool in Wind Tunnel Testing, European Windtunnel Association
(EWA), ANE3-CT-2004-502889, Network of Excellence, Priority 4, Aeronautics and space, Deliverable 2.10
American Institute of Aeronautics and Astronautics
27
43M. Wermes, „Konstruktion und Aufbau einer verfahrbaren Grenzschichtsonde für Flugmessungen“, (German) Deutscher Luft- und Raumfahrtkongress, Bremen, Germany, 27-29. September 2011, Proceeding, paper no. 1476, 2011
44C. Politz, R. Konrath, A. Schröder, J. Agocs, F. Boden, A. Grüttemann, M. Kreienfeld: “Particle Image Velocimetry - Development and Certification of a Promising Tool for In-Flight Flow Flied Measurements.” 21st SFTE (EC) Symposium, 3. - 6. October 2010, Vergiate (VA), Italy.
45Nitsche W., Haberland C., Thünker R.: “Comparative Investigations on Friction Drag Measuring Techniques in Experimental Aerodynamics”, 14th Congress of the international council of the aeronautical sciences (ICAS), Toulouse, France, 1984, pp. 391-402, (1984)
46I. Peltzer, J. Suttan, W. Nitsche, “Application of Different Measuring Techniques for Transition Detection in Low and High Speed Flight Experiments”, 25th Congress of International Council of the Aeronautical Sciences, 3 - 8 September 2006, Hamburg, Germany , Paper ICAS 2006-3.3.1, 2006
47Melber-Wilkending, S.; Wichmann, G., „Project ForMEx - A new CFD approach for transposition of Wind Tunnel data towards Flight Conditions“, 15th AG STAB/DGLR Symposium Darmstadt, 29.11 - 1.12.2006, in Notes on Numerical Fluid Mechanics and Multidisciplinary Design,Volume 96, pp. 113-126, 2008.
48Neitzke, K.-P., Rudnik, R., Schröder, A., “Low Speed Validation Tests on Engine/Airframe Integration Within the EC Project EUROLIFT II”, AIAA Meeting Paper, AIAA 2005-3704, 2005.
49Rudnik, R., „Stall Behaviour of the EUROLIFT High Lift Configurations” , AIAA 2008-0836 (2008) 50J. Quest, R. Konrath, “Accepting a Challenge - The Development of PIV for Application in pressurized cryogenic Wind
Tunnels”, AIAA-2011-3726, 29th Applied Aerodynamics Conference, 27-30th June 2011, Honolulu, Hawaii, 2011 51D. Schwamborn, T. Gerhold, R. Heinrich, “The DLR TAU-Code: Recent Applications in Research and Industry,
Proceedings on CD of the European Conference on Computational Fluid Dynamics ECCOMAS CDF 2006, 2006. 52Kroll, N., Rossow, C. C., Becker, K., Thiele, F.,”The MEGAFLOW Project”, Aerospace Science and Technology, Vol. 4,
pp. 223-237, 2000. 53Kroll, N., Becker, K. Rieger, H. Thiele, F., “Ongoing Activities in Flow Simulation and Shape Optimization within the
German MEGADESIGN Project”, Annual meeting of the International Council of the Aeronautical Sciences (ICAS), Hamburg, Germany, 2006.
54Krimmelbein, N., Krumbein, A., “Automatic Transition Prediction for Three-Dimensional Configurations with Focus on Industrial Application”, Journal of Aircraft, Vol. 48, No. 6, November-December 2011, pp. 1878-1887. DOI: 10.2514/1.56700
55CentaurSoft,: “CENTAUR Software”. http://www.centaursoft.com, retrieved May 2011. 56M. Leatham, S. Stokes, J. A. Shaw, J. Cooper, J. Appa and T. Blaylock, “Automatic Mesh Generation for Rapid-Response
Navier-Stokes Calculations”, AIAA Fluids 2000, Paper AIAA-2000-2247, 19th-22nd June 2000, Denver. 57Keye, S., „Fluid-Structure-Coupled Analysis of a Transport Aircraft and Comparison to Flight Data“, AIAA-2009-4198
(2009) 58Kirmse, T., Wagner, A. „Advanced Methods for In-Flight Flap Gap and Wing Deformation Measurements in the Project
AWIATOR“, Proceedings of the First CEAS European Air and Space Conference, 2007-09-10 - 2007-09-13, Berlin (Germany), ISSN 0700-4083, pp. 1-6, (2007)


