SCAG Region Heavy Duty Truck Model Southern California Region Heavy Duty Truck Model.

HINO ReportApril 1, 2005 to March 31, 2006
Hino Motors Annual Report

01
I would like to use this occasion to sincerely thank our stakeholders for their steady support and the
special patronage afforded the Company in its activities.
I sometimes request the permission of customers of the Company to let me share a ride on their
trucks during a late-night haul over the expressway. I am doing this because I believe invaluable insight can
be gained from listening to the drivers who steer these trucks. Truly understanding what customers want,
and fulfilling these needs through technology and services. This is our mission.
In fiscal year 2005, we were able to increase sales and earnings despite headwinds that were stronger than
expected, such as increased expenses from efforts at quality enhancement and long-term cost
reduction, and high crude oil prices leading to weak sales in the Asian region.
To an extent, we are satisfied with what we achieved, but the satisfaction could be even greater yet. In
Japan and overseas, we will continue to focus our energies on our customer relationships, and as Hino
Motors Ltd. aspire to gain the support of customers worldwide.Hino Motors, Ltd.President
To ourStakeholders
02
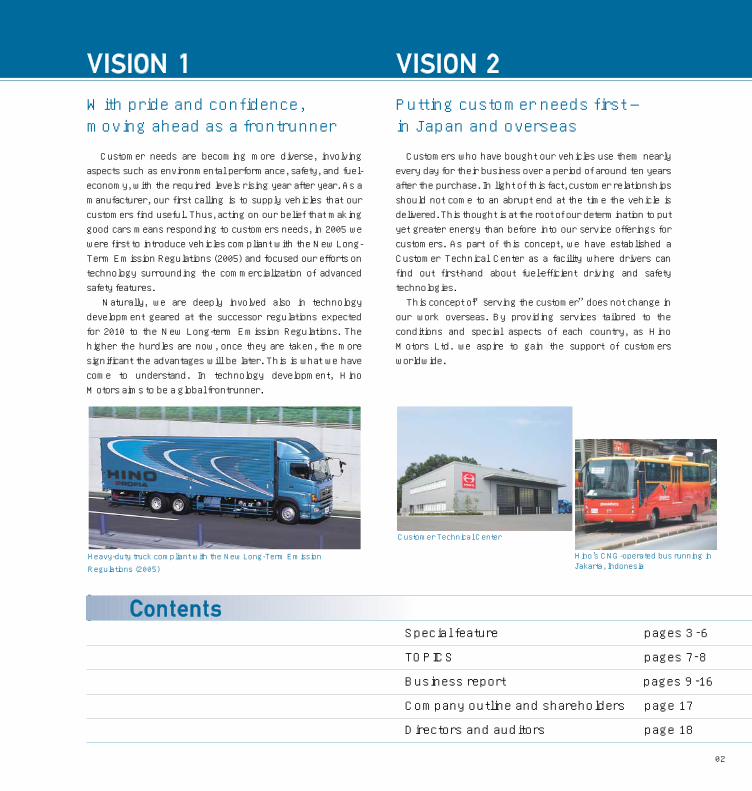
Customer needs are becoming more diverse, involvingaspects such as environmental performance, safety, and fuel-economy, with the required levels rising year after year. As amanufacturer, our first calling is to supply vehicles that ourcustomers find useful. Thus, acting on our belief that makinggood cars means responding to customers needs, in 2005 wewere first to introduce vehicles compliant with the New Long-Term Emission Regulations (2005) and focused our efforts ontechnology surrounding the commercialization of advancedsafety features.Naturally, we are deeply involved also in technology
development geared at the successor regulations expectedfor 2010 to the New Long-term Emission Regulations. Thehigher the hurdles are now, once they are taken, the moresignificant the advantages will be later. This is what we havecome to understand. In technology development, HinoMotors aims to be a global frontrunner.
With pride and confidence, moving ahead as a frontrunner
Putting customer needs first ―in Japan and overseas
VISION 1
VISION 2
Heavy-duty truck compliant with the New Long-Term EmissionRegulations (2005)
Hino’s CNG-operated bus running inJakarta, Indonesia
Customer Technical Center
Special feature pages 3 -6
TOPICS pages 7-8
Business report pages 9 -16
Company outline and shareholders page 17
Directors and auditors page 18Contents
Customers who have bought our vehicles use them nearlyevery day for their business over a period of around ten yearsafter the purchase. In light of this fact, customer relationshipsshould not come to an abrupt end at the time the vehicle isdelivered. This thought is at the root of our determination to putyet greater energy than before into our service offerings forcustomers. As part of this concept, we have established aCustomer Technical Center as a facility where drivers canfind out first-hand about fuel-efficient driving and safetytechnologies.This concept of“serving the customer”does not change inour work overseas. By providing services tailored to theconditions and special aspects of each country, as HinoMotors Ltd. we aspire to gain the support of customersworldwide.

Scenes and impressions demonstrating Hino’s technological capabilities, high safety levels, concern for theenvironment, and spirit of challenge.Hino remains committed to its efforts as a global frontrunner in matters of safety and environmental protection.
Special Feature 1: Hino launches vehicles compliant with the New Long-Term Emission Regulations (2005)
Special Feature 2: Establishment of Hino’s Customer Technical Center
Special Feature 3: Symbol for Hino’s spirit of challenge: the Paris Dakar Rally
03

and enhanced gas mileage are difficult to reconcile. Nomatter how large the emission reduction, if gas mileage andengine performance fall off, the product will not find marketacceptance. The impetus to overcoming this problem camefrom realizing an engine featuring low revolution and hightorque. Using proprietary technology of the Company suchas high-pressure common-rail fuel injection systems andelectronically controllable nozzle turbochargers, the HinoMotors developed an engine capable of generating hightorque also at low revolution through highly accurate enginecontrol. Additionally, the Company further refined its EGRsystem for reducing NOx.As a characteristic of the vehicles that Hino Motors devel-oped for the New Long-Tem Emission Regulations (2005),increased fuel efficiency and engine performance have beenachieved in addition to environmental performance compliant
with regulations. As an“environmental frontrunner,”the Company will persistalso in the future in itsefforts to further enhancetruck and bus performance.
04
The Company has been promoting market launches oftrucks and buses compliant with the New Long-TemEmission Regulations (2005) implemented October 1, 2005.Compared with the previous New Short-Term EmissionRegulations(2003), the New Long-Tem Emission Regulationsreduce particulate matter (PM) by 85% and nitroxide (NOx) by40%, and are therefore called the world’s most rigorous bythe Ministry of Land, Infrastructure and Transport.Hino Motors has launched vehicles compliant with the
New Long-Tem Emission Regulations in five categories,starting with the large-sized route bus in January 2005,followed by a heavy-duty truck, medium-duty truck, large-sized touring coach, and small-sized route bus. In developingthese new vehicle types,the Company did not justonly meet regulations,but also took a proactivestance toward enhancinggas mileage.The consensus has
been that emission cuts
Special Feature 1 Hino launches vehicles compliant with the New Long-Term Emission Regulations (2005)
SpecialF
eature
In time for the New Long-Term Emission Regulation, the Company developed vehicles compliant with the newrules, including heavy-duty truck, medium-duty truck, large-sized touring coach, large-sized route bus, and small-sizedroute bus. Each vehicle features not only enhanced environmental performance but in direct relation to CO2reduction also offers fuel efficiency, combined with engine performance.
Reconciling environmentalperformance and fuel efficiency
Heavy-duty truck Medium-duty truck “Non-step”large-sized route bus
Large-sized touring coach Small-sized“non-step”route bus

05
The Customer Technical Center for training in fuel-saving andsafe driving for customers was established in June 2005 onthe premises of the Company’s Hamura plant. It is the firstcustomer-dedicated permanent facility in Japan that isdirectly operated by a vehicle manufacturer. As part of Hino’s customer support activities so far, training
sessions for fuel-saving and safe driving were previouslyoffered approximately 70 times a year using the Gozenyamaproving ground. In recent years, however, there has been asurge in inquiries for training sessions surrounding costreduction and accident prevention. In order to adequatelyaccommodate this customer requirement, the Company saw aneed for a dedicated training installation available for use at anytime, and decided to go ahead with this new facility.The center features a 1.2km
long track loop as well as atraining building with exhibitionspace and a conference room forup to fifty participants, amongother facilities. With the focus ontraining in fuel saving and safedriving, the Center offers programssuch as instruction in the particulars ofenvironmental regulations and explanations on
the latest technologies of the Company. By providingmultiple kinds of training corresponding to customers’requirements, the Company seeks to inform customers onhow best to use Hino vehicles, and will work to fulfill itssocial mission as a manufacturer to reduce environmentalpollution, help save on fuel expenses, and stamp outaccidents.As a frontrunner in environmental protective technologies, theCompany has put significant effort into developing enginepower trains that feature superior fuel efficiency andenvironmental performance, and aware of its leadership insafety matters has promoted the commercialization of
numerous safety technologies.The establishment of the Customer
Technical Center will widen the reach ofthe Company’s endeavors thus far fromdevelopment and manufacture into therealm of after-sales support service. As afrontrunner in environmental pro-tective technologies and safety, HinoMotors will through actions ofpractical significance continue to
contribute to society.
To give customers a facility for driving, learning, and testing, available at any time ― this is the concept. Interest in fuel-saving and safe driving has been on the rise more than before. In order to respond to this need, the Company newlyestablished the Customer Technical Center as a dedicated training facility for customers. The Center is also Japan’sfirst permanent training facility for customers that is directly operated by a vehicle manufacturer.
Establishment of the Customer Technical Center
Center Office Presentation room
Test driving track
Training in fuel-saving driving for customers
Track loop (1.2km)
Slope (5%)
S-curve
Demonstration space
Center office
SpecialF
eature
06
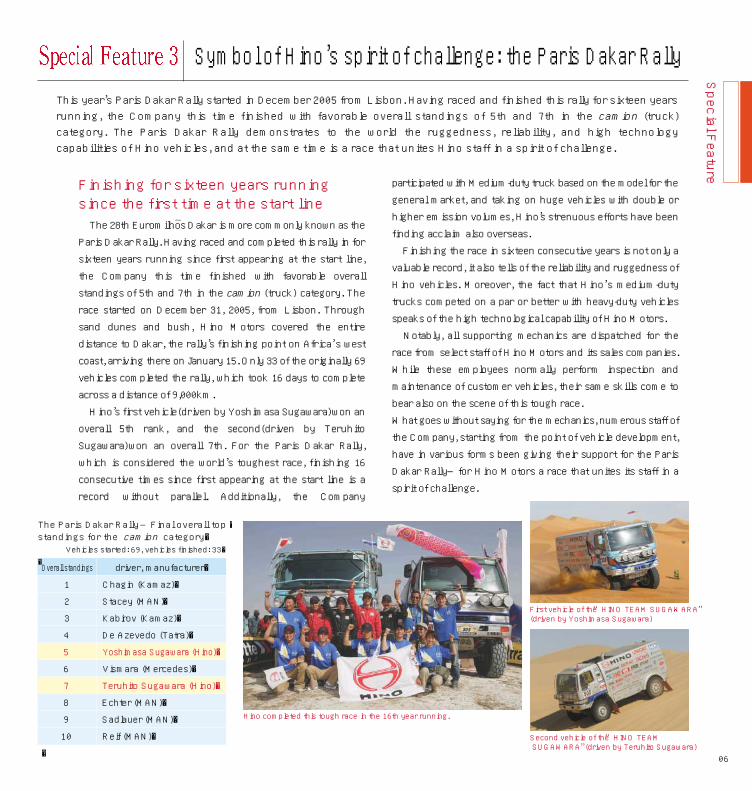
The 28th Euromilhos Dakar is more commonly known as theParis Dakar Rally. Having raced and completed this rally in forsixteen years running since first appearing at the start line,the Company this time finished with favorable overallstandings of 5th and 7th in the camion (truck) category. Therace started on December 31, 2005, from Lisbon. Throughsand dunes and bush, Hino Motors covered the entiredistance to Dakar, the rally’s finishing point on Africa’s westcoast, arriving there on January 15. Only 33 of the originally 69vehicles completed the rally, which took 16 days to completeacross a distance of 9,000km.Hino’s first vehicle(driven by Yoshimasa Sugawara)won an
overall 5th rank, and the second(driven by TeruhitoSugawara)won an overall 7th. For the Paris Dakar Rally,which is considered the world’s toughest race, finishing 16consecutive times since first appearing at the start line is arecord without parallel. Additionally, the Company
participated with Medium-duty truck based on the model for thegeneral market, and taking on huge vehicles with double orhigher emission volumes, Hino’s strenuous efforts have beenfinding acclaim also overseas. Finishing the race in sixteen consecutive years is not only avaluable record, it also tells of the reliability and ruggedness ofHino vehicles. Moreover, the fact that Hino’s medium-dutytrucks competed on a par or better with heavy-duty vehiclesspeaks of the high technological capability of Hino Motors.Notably, all supporting mechanics are dispatched for the
race from select staff of Hino Motors and its sales companies.While these employees normally perform inspection andmaintenance of customer vehicles, their same skills come tobear also on the scene of this tough race.What goes without saying for the mechanics, numerous staff ofthe Company, starting from the point of vehicle development,have in various forms been giving their support for the ParisDakar Rally―for Hino Motors a race that unites its staff in aspirit of challenge.
This year’s Paris Dakar Rally started in December 2005 from Lisbon. Having raced and finished this rally for sixteen yearsrunning, the Company this time finished with favorable overall standings of 5th and 7th in the camion (truck)category. The Paris Dakar Rally demonstrates to the world the ruggedness, reliability, and high technologycapabilities of Hino vehicles, and at the same time is a race that unites Hino staff in a spirit of challenge.
Finishing for sixteen years runningsince the first time at the start line
Symbol of Hino’s spirit of challenge: the Paris Dakar Rally
Hino completed this tough race in the 16th year running.
First vehicle of the“HINO TEAM SUGAWARA”(driven by Yoshimasa Sugawara)
Second vehicle of the“HINO TEAMSUGAWARA”(driven by Teruhito Sugawara)
SpecialF
eature
~
Overall standings driver, manufacturer�
1 Chagin (Kamaz)�
2 Stacey (MAN)�
3 Kabirov (Kamaz)�
4 De Azevedo (Tatra)�
5 Yoshimasa Sugawara (Hino)�
6 Vismara (Mercedes)�
7 Teruhito Sugawara (Hino)�
8 Echter (MAN)�
9 Sadlauer (MAN)�
10 Reif (MAN)�
�
The Paris Dakar Rally ―Final overall top �standings for the category� Vehicles started: 69, vehicles finished: 33��
camion

07
Topics
TOPICS
Activities in fiscal year 2005
August 22, 2005, marked the sales launch of Hino’s large-sized touring coach after its first full model change in fifteenyears and compliant with New Long-Tem EmissionRegulations (2005). This vehicle offers excellent environmental performancethanks to the adoption of the DPR clean diesel system, whilesafety features underwentenhancement in active andpassive safety aspects,including functions anddesigns devised to reducedriver fatigue and vulner-ability of passenger seats incase of vehicle rollover.Moreover, vibration was
reduced by around 30%compared with the previousmodel by using a newly
developed suspension. This bus provides mobility in acomfortable space excelling in ambience and drivability due toenhanced direct safety and turning performance as well as airconditioning performance. Moreover, with approximately 13% improved gas mileage
from the adoption of a new engine and lower running costthanks to a new-type airconditioner, the vehicle hasoutstanding cost-saving fea-tures.Thus, the touring coachoffers yet greater value toeveryone in bus operations,and in future will take thelead in bus travel.
In the period September 22-24, 2005, the JATA WorldTravel Fair 2005 took place at Tokyo Big Sight. This event is atravelfest-type fair for the travel and tourist industries in
Japan and overseas. Hino Motorsparticipated for the first time as abus manufacturer with the large-sized touring coach. Nothing shortof a full success, visitors waiting inline for a test ride were impressedwith the innovative design andeager to take a ride.
The large-sized touring coach was honored with the fiscal year2005 Good Design Award. Based on a design conceptcombining vibrant energy and a sense of hospitality, theinnovative style reflects exhilaration with the joy of travel.Going forward, Hino Motorswill persist in its undividedeffort to build motor vehiclesthat value people and theenvironment.
First exhibition at the JATA WorldTravel Fair as a bus manufacturer
The large-sized touring coach honoredwith the Good Design Award
The Company launched theSuper High-Deck and High-Deckseries. The 9-meter long High-Deck Short series was launchedon February 20, 2006.
Not alone good looks, but also high quality, ease of use, and product balance arecriteria.
Approximately 800 organizations and companies participated in 2005, comprisingtourism-related bodies, corporations, and travel agencies from around the world.
Sales launch of large-sized touring coach compliantwith New Long-Term Emission Regulations (2005)

08
Topics
Activities in fiscal year 2005
TOPICS
The award this year was conferred on the Company forbeing first in the world to mass-produce DPR and otheradvanced technologies and for playing a leading role in
contributing to the reduction ofCO2, as well as in appreciation ofresulting significant multipliereffects. Going forward, HinoMotors will continue with tech-nology innovation to support itscustomers and to reduce theburden on the environment.
Since its inception in 1991, the Hino Motors Green Fundhas on the basis of its fundamental principle of harmonybetween society and environment implemented actions such asaiding activities and research surrounding the preservation ofnature, afforestation of thenatural environment, andenvironment-related eventsusing the Hino Green Fund(HGF)Forest. This latestaward honors efforts thathave continued for manyyears to protect the naturalenvironment.
Hino Motors honored with“the 37th IchimuraPrize in Industry”for development of ultra-low emission diesel engine for large-sized commercial vehicles
Development of VSC vehicle stabilitycontrol system for heavy-duty tractorsHeavy-duty tractors pulling trailers with bulk cargo volumesare the vehicles on which logistics turn. In order to increase theirsafety, the Company developed and commercialized thevehicle stability control system VSC*2, which detects inadvance and warns the driver of trailer instability on slipperyroads, and enables highly effective vehicle control throughcoordinated actionbetween engineoutput control andtractor-trailer ABSoperation. This sys-tem was first to o-btain approval ofthe National Landand TransportationMinistry.
The Company developed the world’s first brake system forheavy-duty trucks designed to reduce rear-end collisiondamage, dubbed PCS for“Pre-Crash Safety.”This systemswas first launched as an application to the heavy-duty trucks.Thanks to a forward-irradiating milliwave radar with superior
sensitivity for object iden-tification, the PCS systemdetects stationary vehiclesor obstructing objects onthe road ahead also inadverse weatherconditions. If the on-boardcomputer discerns acollision hazard, a warningis sounded and brakingaction in two stages willlower vehicle speed, thusreducing damage potentialfrom a rear-end collision.
Hino’s activities as a frontrunner in safety
Hino Motors Green Fund honored with the Minister of the Environment Award 2005,“the EnvironmentalConservation Distinguished Service Award”
■Safety action (VSC development tailored to actual accident conditions)
Serious stand-alone �accidents of �combination vehicles�1st rank: Rollover�2nd rank: Jack knife *3��
Staves off 70% of serious �stand-alone accidents of �combination vehicles
VSC�
Other accidents 9%�Side impact� 6%
Rear-end �collision 15%�
Jack knife 21%�
Rollover�49%�
Total of �33 �
accidents�
・Actual conditions of serious� accidents of combination vehicles
※3
The Minister of the Environment Award 2005was conferred June 6, 2005.
*2. VSC (Vehicle Stability Control) is positioned as a key technology for reducing traffic accidents at Toyota Group.
*3.“Jack knife”refers to a situation that occurs on slippery roads when the tail end of a trailer breaks out sideways and skids forward, closing on the tractor.
“The Ichimura Prize in Industry” honors company managements and technologydevelopers for contributions or meritorious actions serving the advancement ofindustry through the development of outstanding technologies in Japan.
PCS*1 brake system for reduced rear-end collision damage
■Flow chart of rear-end collision damage reduction
*1. Co-developed with Toyota Motor
●Approaching a stationary vehicle:
The milliwave radar is constantly checking road safety ahead.
If the driver fails to notice the stationary vehicle, driver and following vehicles are alerted by a warning signal and light braking action.
If the computer discerns a high possibility of a rear-end collision, strong braking action follows.
●Approaching a slowing vehicle:
The milliwave radar is constantly checking road safety ahead.
Scanning Cruise II operates when approaching a slow-moving vehicle (if Scanning Cruise II is switched on).
On further closing in on the vehicle ahead, a warning signal and PCS braking action occur.
“Beep!”
“Beep!”
Braking action
Light braking action
Strong braking action

Business Report for Fiscal Year 2005
Business R
eport for Fiscal Y
ear 2005
0
20000
40000
60000
80000
100000
120000
0
200000
400000
600000
800000
1000000
1200000
Highlights
Financial Results in Fiscal Year 2005
Consolidated�
�Net sales: ¥1,196.9 billion�
Ordinary income: ¥42.1 billion�
Net income: ¥28.7 billion
Non-consolidated
Sales: ¥919.9 billion�
Ordinary income: 38.5 billion�
Net income: ¥21.7 billion
The Japanese economy in the term under review moved along a recovery trend, despite surging prices for crude oil and raw materials, etc., supported by rising capital expenditure on the back of improved corporate profits and helped by personal consumption.�The Company's business mainstay in domestic operations saw total demand in the markets for large and medium-size trucks increase 5.9% from a year earlier to 105,504 units amid heightened replacement demand in response to new environmental regulations such as the Automotive NOx and PM Law, as well as the New Long-Term Emission Regulations of 2005. Also in the market for small-size trucks, total demand increased 2.6% to 117,094 units.�Domestic sales of trucks and buses of the Company increased 11.2% on the year to 56,356 units. Furthermore, overseas sales reached a historical high of 45,894 units, reflecting an increase of 2.4% on the year, thanks to sales expansion in North America as well as in Near and Middle East.�As a result, combined domestic and overseas sales of trucks and buses rose 7.1% on the year to 102,250 units. In commissioned vehicle production for Toyota Motor
Corp., production of the Hilux Pick-up truck was terminated at the end of June 2005. Furthermore, with production of the FJ Cruiser started in January 2006, total production came to 188,779 units, reflecting a 23.9% decline on the year. ��Owing to the increase in unit sales centered on domestic operations, net sales for the term under review increased 5.9% on the year to ¥1,196.9 billion. Operating profit grew 5.7% on the year to ¥40.5 billion, and net income for the period increased 62.4% to ¥28.7 billion.�Going forward, in step with rising personal consumption and capital expenditure in the Japanese economy, the outlook is for a sustained moderately-paced recovery centered on private sector demand. At the same time, while keeping a watchful eye on the economic recovery, caution is required amid rising interest rates and concerns over additional increases in crude oil and raw materials prices.�The Company will continue with further advances in rationalization and in this way work to strengthen management practices and enhance financial results.��
0
10
20
30
40
50
60
70
80
●Domestic vehicle unit sales increased amid growing replacement demand in response to new� environmental regulations�●Vehicle sales at overseas operations reached a historical high of 45,000 units despite weak Asian� markets thanks to rising sales in North America and Middle East
09

Financial Highlights (Consolidated)
Financial H
ighlights (C
onsolidated
)
Truck and bus unit sales (in units)
Net sales (millions of yen)
Ordinary income and net income (millions of yen)
Net income per share (yen)
2002
60,485
87,018
102,250
16,582
20022003 20032004 20050
10,000
20,000
30,000
40,000
50,000
0
20000
40000
60000
80000
100000
120000
0
20,000
40,000
60,000
80,000
100,000
120,000
0
10
20
30
40
50
60
70
0
200000
400000
600000
800000
1000000
1200000
0
200,000
400,000
600,000
800,000
1,000,000
1,200,000
2002
850,317
1,051,5861,130,100
1,196,972
8.38
58.86
30.35
49.51
20022003 20032004
2004
20042005
(Fiscal year)
(Fiscal year) (Fiscal year)
(Fiscal year)2005
2005
25,743
2,069
32,673
342,508
114,185
393,624
388,610
150,341
512,635
408,196
181,749
540,155
399,586
198,490
598,896
35,776
2,916
48,326
44,818
3,108
47,560
45,894
3,255
53,101
Domestic truck sales Domestic bus sales Overseas sales
Domestic Overseas Toyota-related
95,486
Ordinary income Net income
4,959
44,566
34,023
39,75142,131
17,672
28,704
0
10
20
30
40
50
60
70
80
10

Consolidated Balance Sheets
March 31, 2006 March 31, 2005 March 31, 2006 March 31, 2005
�
400,903�
39,347�
248,796�
1,214�
85,856�
11,868�
18,916�
△5,097�
414,621�
317,039�
99,665�
89,345�
15,559�
1,316�
101,609�
9,543�
16,289�
15,275�
446�
568�
81,292�
64,923�
9,293�
2,051�
13,472�
△8,448�
�
�
815,524
(Millions of Yen)� (Millions of Yen)�
(Liabilities)�
Current liabilities�
Trade notes and accounts payable�
Short-term debt�
Commercial paper�
Current portion of long-term debt�
Other accounts payable�
Accrued income taxes�
Accrued bonuses�
Warranty allowance�
Other current liabilities�
Long-term liabilities�
Long-term debt�
Deferred income taxes�
Deferred income taxes related to unrealized gain on land revaluation�
Accrued employees' retirement benefits�
Other long-term liabilities�
Total liabilities�
(Minority shareholder's interests)�
Minority interests in consolidated subsidiaries�
(Shareholders' equity)�
Common stock�
Additional paid-in capital�
Retained earnings�
Net unrealized gain on land revaluation�
Net unrealized gain on available-for-sale securities�
Cumulative translation adjustment�
Treasury common stock, at cost�
Total shareholders' equity�
Total liabilities, minority interests, and shareholders' equity
�
461,517�
178,042�
156,476�
52,000�
9,020�
10,875�
6,313�
3,962�
6,065�
38,760�
104,191�
50,571�
10,845�
4,684�
37,469�
619�
565,708�
�
12,980�
�
72,717�
64,307�
78,422�
6,356�
21,716�
△6,442�
△241�
236,835�
815,524
Account Account
�
432,979�
37,398�
268,111�
―�
99,829�
14,784�
17,357�
△4,502�
479,937�
341,258�
102,678�
95,772�
18,561�
5,117�
94,770�
24,358�
18,219�
17,481�
182�
555�
120,459�
109,521�
4,801�
1,790�
11,823�
△7,476�
�
�
912,916
�
477,445�
194,135�
162,292�
37,000�
5,334�
10,111�
12,770�
4,266�
7,733�
43,801�
143,300�
63,740�
20,217�
3,753�
36,188�
19,399�
620,745�
�
15,164�
�
72,717�
64,307�
105,702�
1,529�
37,006�
△3,966�
△289�
277,005�
912,916
(Assets)�
Current assets�
Cash and deposits�
Trade notes and accounts receivables�
Marketable securities�
Inventories�
Deferred income taxes�
Others�
Allowance for doubtful accounts�
Fixed assets�
Tangible fixed assets�
Buildings and structures�
Machinery and transportation equipment�
Tools and fixtures�
Lease assets�
Land�
Construction in progress�
Intangible fixed assets�
Software�
Consolidated adjustment account�
Other�
Investments and other assets �
Investment securities�
Long-term loans�
Deferred income taxes�
Other investments and assets�
Allowance for doubtful accounts �
�
�
Total assets
Note: All amounts rounded down to full millions of yen.
Consolidated
Balan
ce Sheets
11

Consolidated Statements of Income(Millions of Yen)� (Millions of Yen)�
(Millions of Yen)�
(Ordinary income (loss))�
Operating income (loss)�
Operating income�
Net sales�
Operating expenses�
Cost of sales�
Selling, general and administrative expenses�
Operating profit�
Non-operating income (loss)�
Non-operating income�
Interest and dividend income�
Equity in earnings of affiliated companies�
Miscellaneous income�
Non-operating expenses�
Interest expense�
Miscellaneous expenses�
Ordinary income�
�
(Extraordinary income (loss))�
Extraordinary income�
Gain on sales of fixed assets�
Gain on sales of investment securities�
Other extraordinary income�
Extraordinary losses�
Loss on impairment of fixed assets�
Loss on sales and disposal of property, plant and equipment�
Loss on write-down of inventories�
Other extraordinary losses�
Net income before income taxes and minority interests�
Income taxes�
Income taxes, deferred�
Minority interests income of consolidated subsidiaries�
Net income
1,130,100�
1,091,764�
969,273�
122,490�
38,336�
�
5,479�
2,582�
783�
2,113�
4,064�
2,150�
1,913�
39,751�
�
�
1,195�
601�
―�
594�
10,603�
4,380�
3,023�
1,357�
1,841�
30,343�
11,875�
△113�
908�
17,672
1,196,972�
1,156,449�
1,020,985�
135,464�
40,522�
�
6,734�
2,829�
714�
3,189�
5,125�
3,006�
2,118�
42,131�
�
�
3,725�
2,180�
536�
1,008�
3,514�
76�
2,048�
―�
1,389�
42,341�
18,271�
△5,669�
1,035�
28,704
Note: All amounts rounded down to full millions of yen.��
Consolidated Statem
ent of Income, Shareholder's Equity, C
ash Flows
�
Consolidated Statements of Shareholder's Equity
(Additional-paid in capital)�
Additional paid in capital at beginning of year�
Additional paid in capital at end of year�
(Retained earnings)�
Retained earnings at beginning of year�
Increase in retained earnings�
Decrease in retained earnings�
Retained earnings at end of year
�64,307�64,307�
�63,337�18,775�3,691�78,422
�64,307�64,307�
�78,422�32,134�4,853�
105,702Note: All amounts rounded down to full millions of yen.
Consolidated Statements of Cash Flows
(Operating activities)�
Net income before income taxes and minority interests�
Depreciation and amortization�
Loss on impairment of fixed assets�
Increase in notes and accounts receivable�
Increase in inventories�
Increase in notes and accounts payable�
Income taxes paid�
Others�
Sub-total �
(Investing activities)�
Purchase of property, plant and equipment�
Purchase of intangible fixed assets�
Others�
Sub-total�
(Financing activities)�
Net increase (decrease) in short-term debt�
Net (increase) decrease in commercial paper�
Proceeds from issuance of long-term debt�
Repayments of long-term debt�
Dividends paid�
Others�
Sub-total�
Effect of exchange rate changes on cash and cash equivalents�
Net increase (decrease) in cash and cash equivalents�
Cash and cash equivalents at beginning of year�
Cash and cash equivalents at end of year
�30,343�35,535�4,380�
△10,437�△11,674�12,603�
△19,700�3,028�44,078�
�△53,262�△8,258�5,179�
△56,341��
△18,520�7,000�28,427�△9,685�△3,445�199�3,975�△61�
△8,349�47,280�38,931
�42,341�39,483�76�
△14,336�△11,185�12,153�
△11,919�△1,468�55,145�
�△63,355�△6,466�19,882�
△49,939��
2,177�△15,000�18,135�△8,958�△4,019�△41�
△7,706�460�
△2,040�38,931�36,890
Note: All amounts rounded down to full millions of yen.��
�
Account Account
Account
Year ended �March 31, 2006
Year ended �March 31, 2006
Year ended �March 31, 2005
Year ended �March 31, 2005
Year ended �March 31, 2006
Year ended �March 31, 2005
12

Financial Highlights (Non-consolidated)
Shipments of trucks and buses (in units)
Financial H
ighlights (N
on-consolidated
)
2002 2003 2004
Production of commissioned vehicles� (in units; excluding supplies and parts for overseas production)�
191,743
59,724
25,463
251,765
306,852
354,181
392,984427,638 478,720
344,709 289,903
5,725
5,675
2,100
32,161
49,003
2,889
36,019
47,745
3,105
43,157
87,91194,007
54,642
3,276
42,792
100,710
659,342
855,876893,819 919,945
222,676
248,012
2002
2002
20022003
2003
20032004
2004
2004
2005
2005
2005
2005
12,638 16,961
Net sales (millions of yen)
Ordinary income and net income �(millions of yen)�
16,451
8,342
32,076
9,463
30,026
10,263
21,783
Ordinary income Net income
Truck (domestic) Buses (domestic) Exports Trucks and buses Consignment Engines Components Others
62,361
44,086
45,64752,468 72,000
0
100
200
300
400
500
600
0
5
10
15
20
25
30
35
40
0
10
20
30
40
50
60
0
5000
10000
15000
20000
25000
30000
35000
40000
0
50000
100000
150000
200000
250000
0
50,000
100,000
150,000
200,000
250,000
0
20,000
40,000
60,000
80,000
100,000
120,000
0
200,000
400,000
600,000
800,000
1,000,000
50,914
57,389 56,366
188,779
0
10,000
20,000
30,000
40,000 38,541
(Fiscal year) (Fiscal year)
(Fiscal year) (Fiscal year)
13

Financial H
ighlights (N
on-consolidated
)
2002 2003 2004
2002
2002
20022003
2003
20032004
2004
2004
2005
2005
2005
2005
Net income per share (yen)
Dividend payout ratio (%)
Net assets per share (yen)
Equity ratio (%)
14.3216.16 17.54
37.63
406.65434.52 451.04
505.10
0
100
200
300
400
500
600
100
200
300
400
500
600
0
5
10
15
20
25
30
35
40
0
10
20
30
40
50
60
0
5000
10000
15000
20000
25000
30000
35000
40000
0
50000
100000
150000
200000
250000
0
10
20
30
40
50
60
0
34.436.4
33.6
23.9
50.748.3 47.6 48.5
0
5
10
15
20
25
30
35
40
0
10
20
30
40
(Fiscal year)
(Fiscal year)
(Fiscal year)
(Fiscal year)
14

Non-Consolidated Balance Sheets
(Assets)�
Current assets�
Cash and deposits�
Trade notes receivable�
Trade accounts receivable�
Marketable securities�
Finished goods�
Raw materials�
Work in progress�
Supplies�
Prepaid expenses�
Deferred income taxes�
Short-term loans�
Others�
Allowance for doubtful accounts�
Fixed assets�
Tangible fixed assets�
Buildings�
Structures�
Machinery and equipment�
Vehicles and transportation equipment�
Tools�
Lease assets�
Land�
Construction in progress�
Intangible fixed assets�
Software�
Rights of facility utilization�
Other fixed assets�
Investments and other assets�
Investment securities�
Shares in subsidiaries and investments�
Long-term loans�
Long-term prepaid expenses�
Other investments and assets�
Allowance for doubtful accounts�
Total assets
235,690�
4,857�
2,881�
147,071�
1,199�
14,478�
248�
14,920�
2,390�
67�
7,269�
31,026�
9,382�
△102�
308,318�
158,822�
46,669�
8,645�
52,861�
2,832�
10,539�
232�
31,956�
5,085�
14,709�
14,646�
2�
60�
134,786�
55,808�
60,737�
15,054�
839�
8,364�
△6,017�
544,009
(Millions of yen)� (Millions of yen)�
(Liabilities)�
Current liabilities�
Notes payable�
Trade accounts payable�
Commercial paper�
Current portion of long-term debt�
Other accounts payable �
Accrued expenses�
Accrued income taxes�
Deposits�
Warranty allowance�
Other current liabilities�
Long-term liabilities�
Long-term debt�
Deferred income taxes�
Accrued employees' retirement benefits�
Other long-term liabilities�
Total liabilities�
(Shareholders' equity)�
Common stock�
Additional paid-in capital�
Capital reserves�
Retained earnings�
Legal reserve of retained earnings�
Voluntary reserve of retained earnings�
Reserve for fixed asset reduction entry�
General reserve�
Unappropriated earnings for the year�
�
Net unrealized gain on available-for-sale securities�
Treasury common stock�
Total shareholders' equity �
�
�
�
�
Total liabilities and shareholders' equity
�
214,757�
6,047�
114,413�
52,000�
3,443�
7,911�
19,773�
3,451�
1,001�
6,065�
649�
70,065�
43,884�
8,585�
17,515�
80�
284,822�
�
72,717�
64,307�
64,307�
104,015�
7,103�
83,217�
4,327�
78,890�
13,694�
�
18,339�
△192�
259,186�
�
�
�
�
544,009
Account
�
251,200�
6,791�
3,134�
170,811�
―�
17,327�
273�
16,729�
2,521�
70�
9,065�
15,260�
9,361�
△147�
347,082�
165,609�
46,923�
8,619�
55,693�
3,153�
12,712�
7�
32,049�
6,448�
16,772�
16,709�
2�
60�
164,700�
77,662�
64,815�
19,097�
791�
8,380�
△6,045�
598,282
213,206�
2,501�
124,514�
37,000�
862�
7,357�
21,187�
10,363�
939�
7,733�
745�
94,893�
60,237�
16,782�
17,794�
80�
308,099�
�
72,717�
64,307�
64,307�
121,588�
7,103�
89,088�
4,198�
84,890�
25,396�
�
31,804�
△234�
290,183�
�
�
�
�
598,282Non-Consolidated
Balan
ce Sheets
Note: All amounts rounded down to full millions of yen.��
March 31, 2006 March 31, 2005 Account March 31, 2006 March 31, 2005
15

Non-Consolidated Statements of Income Appropriation of Retained Earnings(Millions of yen)�
Non-C
onsolidated Statement of Incom
e, Appropriation of R
etained Earnings
(Ordinary income (loss))�
Operating income (loss)�
Operating income�
Sales�
Operating expenses�
Cost of sales�
Selling, general and administrative expenses�
Operating profit�
Non-operating income (loss)�
Non-operating income�
Interest and dividend income�
Miscellaneous income�
Non-operating expenses�
Interest expense�
Miscellaneous expenses�
Ordinary income�
�
(Extraordinary gains (loss))�
Extraordinary income�
Gain on sales of investment securities�
Gain on sales of fixed assets�
Gain on liquidation of subsidiaries�
Gain on reversal of allowance for doubtful accounts�
Other extraordinary income�
Extraordinary losses�
Loss on write-down of shares in subsidiaries�
Loss on sales and disposal of property, plant and equipment�
Loss on write-down of investment securities�
Loss on impairment of fixed assets�
Other extraordinary losses�
Net income before income taxes�
Income taxes�
Income taxes, deferred�
Net income�
Retained earnings brought forward from the previous year�
Interim dividend�
Unappropriated retained earnings for the year
893,819�
866,107�
795,978�
70,129�
27,711�
�
3,435�
2,169�
1,266�
1,120�
278�
842�
30,026�
�
�
362�
321�
25�
12�
3�
―�
9,644�
8,491�
948�
117�
85�
―�
20,743�
8,212�
2,267�
10,263�
5,154�
1,722�
13,694
(yen)�
919,945�
885,007�
806,145�
78,861�
34,938�
�
5,106�
3,003�
2,102�
1,503�
355�
1,148�
38,541�
�
�
709�
440�
268�
―�
―�
0�
6,088�
3,327�
1,620�
910�
36�
194�
33,162�
14,215�
△2,836�
21,783�
5,910�
2,296�
25,396Note: All amounts rounded down to full millions of yen.
13,694,987,735�
128,819,689�
13,823,807,424�
�
�
1,722,642,876�
(¥3.0 per share)�
164,000,000�
27,000,000�
6,000,000,000�
5,910,164,548
25,396,685,604�
117,589,629�
25,514,275,233�
�
�
2,870,778,440�
(¥5.0 per share) �
157,000,000�
21,000,000�
16,000,000,000�
6,465,496,793
Unappropriated retained earnings for the year�
Reversal of reserve for fixed asset reduction entry�
Sub-total�
�
�
Dividend �
�
Directors' bonus�
Auditors' bonus�
General reserve�
Retained earnings carried forward to the next year
Fiscal Year 2004Fiscal Year 2005Account AccountYear ended �March 31, 2006
Year ended �March 31, 2005
To be appropriated�as follows:��
16

Corporate Profile and Stock Information
Corporate P
rofile an
d Stock In
formation
Breakdown of Shareholders by Category (as of March 31, 2006)Corporate Profile
■Number of shareholders and shareholder percentages� (Total shareholders: 14,783)
■Number of shares and shareholder percentages (Total share units: 572,706)
Individuals and �other shareholders: �14,006 (94.8%)
Securities companies: 44 (0.3%) Other domestic corporations: 371 (2.5%)
Notes:�1. The above total number of shares is net of 1,874,850 shares represented by fractional � share units.�2. The category "Individuals and other shareholders" includes 425 share units representing� treasury shares.Furthermore, the 1,874,850 shares represented by fractional share � units referenced in Item 1. above include 162 treasury shares.�3. The category "Other domestic corporations" includes 8 share units held by Japan � Securities Depository Center, Inc.
Banks and other financial institutions:�102,874 units (18.0%) Other domestic corporations: �
338,673 units (59.1%)
Securities companies:� 4,578 units (0.8%)
Individuals and other shareholders: 43,695 units (7.6%)
Foreigners: 82,886 units (14.7%)
Share Price Range on the Tokyo Stock Exchange
0
702
608
644
576
655
583
200
400
600
800
1,000
05�
Apr May June July Aug Sep Oct Nov Dec Jan Feb Mar��
669
635
718
641
763
710
802
713
795
728
763
707
808
698
795
680
768
705
Banks and other �financial institutions: 95 (0.6%) Foreigners: 267 (1.8%)
Hino Motors, Ltd.��Founded : 1910�Established : May 1, 1942�Paid-in capital : 72,717,284,641 yen�Number of employees : 9,507�Products : trucks, buses, specialty vehicles, � small-size commercial vehicles, � passenger vehicles, engines�Offices and Plant: �Head Office and Hino Plant�1-1 Hinodai 3-chome, Hino-shi, Tokyo 191-8660, Japan�Tel. +81-42-586-5111�
Hamura Plant�1-1, Midorigaoka 3-chome, Hamura-shi, Tokyo 205-8660, Japan�Tel. +81-42-579-0411�
Nitta Plant�10-1, Nitta-Hayakawa-cho, Ohta-shi, Gunma Prefecture, 370-0344, Japan�Tel. +81-276-56-5111�
Tamachi Office�11-3, Shiba 4-chome, Minato-ku, Tokyo 108-0014, Japan�Tel +81-3-3456-8811
Stock Information (as of March 31, 2006)
Number of Shares Authorized: 1,400,000,000 shares� Outstanding: 574,580,850 shares�Number of Shareholders: 18,289 (increased by 1,271 from March 31, 2005)�Top Ten Shareholders
Toyota Motor Corporation�
The Master Trust Bank of Japan, Ltd. (Trust Account)�
Japan Trustee Services Bank, Ltd. (Trust Account)�
Japan Trustee Service Bank, Ltd.�(Holder of Retirement Benefit Trust forThe Chuo Mitsui Trust and Banking Company, Limited)�
The Tokio Marine and Fire Insurance Co., Ltd.�
State Street Bank and Trust and Banking Company. Ltd.�
Depositary Nominees Inc.�
Takenaka Corporation�
Nagasaka Industries Co., Ltd.�
Nisshinbo Industries, Inc.�
�
287,897�
24,660�
15,741�
�10,031�
6,104�
5,898�
5,709�
5,562�
4,255�
4,079
50.1�
4.3�
2.7�
�1.7�
1.1�
1.0�
1.0�
1.0�
0.7�
0.7
%
Shareholder name, number of shares held (in units of thousand shares), shareholder percentage(Yen)�
�
06
17

Directors and Auditors (as of June 28, 2006)
Directo
rs and Auditors
Chairman of the Board � Tadaaki Jagawa�
President, Member of the Board � Shoji Kondo�
Executive Vice Presidents, Members of the Board � Shinichiro Sugisaki, Bunji Hagiwara, Takahiko Yamamoto�
Senior Managing Directors, Members of the Board � Masakazu Ichikawa, Toshiki Inoue, Tsunehiko Fujii, Manabu Kasai, Seiei Okazaki, Sinji Fujimoto�
Corporate Auditors � Akira Senuma, Akihiko Ogino, Akio Tsujii, Yoshio Ishizaka, Kosuke Ikebuchi
18
This document was printed using a waterless printing method that does not discharge harmful fluids, using inks that are free of volatile organic compounds (VOCs).
![Bosch ESI[truck] Heavy Duty Truck Software Update – Q3 ...€¦ · Bosch ESI[truck] Heavy Duty Truck Software Update | Ver 2019/3 7 | 34 2. STATISTICS 10 New Makes 391 New Models](https://static.fdocuments.us/doc/165x107/5fdc21500e0e776d1608582f/bosch-esitruck-heavy-duty-truck-software-update-a-q3-bosch-esitruck-heavy.jpg)


![Bosch ESI[truck] Heavy Duty Truck Software Update – Q2 ......Hidromek (new brand covered) Hitachi JCB . Bosch ESI[truck] Heavy Duty Truck Software Update | Ver 2019/2 4 | 33 JLG](https://static.fdocuments.us/doc/165x107/5e508f9e235fab1e94790b97/bosch-esitruck-heavy-duty-truck-software-update-a-q2-hidromek-new-brand.jpg)


![Bosch ESI[truck] Heavy Duty Truck Software Update – Q1 ...€¦ · Bosch ESI[truck] Heavy Duty Truck Software Update | Ver 2019/1 6 | 41 41135 42908 45411 47482 37000 38000 39000](https://static.fdocuments.us/doc/165x107/600ed0e779e62601223e82fb/bosch-esitruck-heavy-duty-truck-software-update-a-q1-bosch-esitruck-heavy.jpg)