Highway Sufficiency Ratings - Transportation Research...
76
HIGHWAY RESEARCH BOARD Bulletin 53 Highway Sufficiency Ratings RESEARCH National Academy of Sciences publication 228
Transcript of Highway Sufficiency Ratings - Transportation Research...
HIGHWAY R E S E A R C H B O A R D
Bulletin 53
Highway Sufficiency Ratings
R E S E A R C H
National Academy of Sciences
publication 228

H I G H W A Y R E S E A R C H B O A R D 1952
R . H . BALDOCK, Chairman W . H . ROOT, Vice Chairman FRED BURGGRAF, Director
Executive Committee
THOMAS H . MACDONALD, Commissioner, Bureau of Public Roads
H A L H . H A L E , Executive Secretary, American Association of State Highway Officials
LOUIS JORDAN, Executive Secretary, Division of Engineering and Industrial Research, National Research Council
R . H . BALDOCK, State Highway Engineer, Oregon State Highway Commission
W . H . ROOT, Maintenance Engineer, Iowa State Highway Commission
H . P . BiGLER, Former Executive Vice President, Connors Steel Company
P Y K E JOHNSON, President, Automotive Safety Foundation
G . DONALD KENNEDY, Consulting Engineer and Assistant to President, Portland Cement Association
BURTON W . MARSH, Director, Safety and Traffic; Engineering Department, American Automobile Association
R . A. MoYER, Research Engineer, Institute of Transportation and Traffic Engineering, University of California
F . V . REAGEL, Engineer of Materials, Missouri State Highway Department
Editorial Staff
FRED BURGGRAF W . N . CAREY, JR. W . J . M I L L E R
2101 Constitution Avenue, Washington 25, D . C. The opinions and conclusions expressed in this publication are those of the authors
and not necessarily those of the Highway Research Board.
HIGHWAY R E S E A R C H BOARD
Bulletin 53
Highway Sufficiency Ratings^
Presented at the THIRTY-FIRST ANNUAL MEETING
January 1952
1952
WASHINGTON, D.C.
DEPARTMENT OF ECONOMICS, FINANCE AND ADMINISTRATION
H. S. Fairbank, Chairman Deputy Commissioner, Research Division
Bureau of Public Roads
COMMITTEE ON HIGHWAY COSTS
Fred B. Farrell, Chairman Chief, Highway Cost Section
Bureau of Public Roads
Tames A. Foster, Highways and Municipal Bureau, Portland Cement Association
Carl E. Fritts, Director, Highways Division, Automotive Safety Foundation Raleigh W. Gamble, Superintendent of Bureau of Street Construction and
Repairs, Milwaukee, Wisconsin O. L. Kipp, Assistant Commissioner and Chief Engineer, Minnesota De
partment of Highways B. H. Lindman, Association of American Railroads H. R. Wilson, Fiscal Manager, Division of Finance and Management, Bu
reau of Public Roads Robley Winfrey, Research Professor of Civil Engineering, Iowa State College
SUBCOMMITTEE ON SUFFICIENCY-RATING FORMULAS
O. L. Kipp, Chairman Assistant Commissioner and Chief Engineer,
Minnesota Department of Highways
P. R. Staffeld, Secretary Acting Manager, Highway Planning Survey,
Minnesota Department of Highways
M. E. Campbell, Engineer of Economics, Finance and Administration, Highway Research Board
J. O. Granum, Highway Engineer, Automotive Safety Foundation C. J. Hooper, Director of Highway Planning, Connecticut State Highway
Department T. F. Morf, Civil Engineer, Illinois Division of Highways J. A. Swanson, Division Planning and Programming Engineer, Bureau of
Public Roads W. E. Willey, Engineer, Division of Economics and Statistics, Arizona
Highway Department
IV
Contents
Sufficiency Ratings as an Administrative Tool O. L. Kipp 1
Arizona's Experience with Sufficiency Ratings William E. Willey 3
General Comments on Sufficiency-Rating Procedures John A. Swanson 7
Possible Areas of Improvement in Rating Procedures P. R. Staff eld 11
Considerations in Rating Urban Streets Curtis J. Hooper 14
Gr^hical Presentation Procedures James O. Granum 17
Elemental versus Composite Ratings M. Earl Campbell 30
Use of Sufficiency Ratings in Long-Range Planning Roy E . Jorgensen 32
Relation of Sufficiency Ratings, Tolerable Standards, and Priorities C. E. Fritts 36
Appendix on Procedures 41
Sufficiency Ratings as an Administrative Tool
O. L. KIPP, Assistant Commissioner and Chief Engineer Minnesota Department of Highways
WITHIN ONE generation, motor-vehicle transportation has grown rapidly into one of our most important industries, having great influence on almost every phase of activity in this country. At the same time this rapid growth has placed a burden on our highway systems not foreseen in the early years of highway development when the principal objective was to provide hard surfaced roads for year-around travel. The ever-increasing ownership of motor vehicles, the operating characteristics and the use of which have been constantly improved and expanded, has resulted in public demand for greatly improved highway facilities. This demand has been heightened of late years because of the accelerated rate at which our highway systems have become both structurally and functionally obsolete. The highway administrator has had to face these demands with less than adequate financial resources, making increasingly impossible the task of satisfying them, at least to standards acceptable to all concerned.
In attempting to meet this problem the administrator has found that the majority of the public has little comprehension of the scope of the problem. In fact, only a small segment of the public has any understanding or appreciation of what it involves. For the majority of citizens the most important road in the state is the one they use every day. Under such conditions the programming of construction .improvements, even though done with the best of engineering judgment, has not always reflected a defensible priority for improvement which could successfully withstand pressure from various local groups. Faced with the ever-mounting pressure for highway improvements to higher standards and, in many instances, with no increased financing, the administrator has been forced to develop some means of forestallmg this pressure from local groups and justifying the selection of construction improvements in his annual programs.
Sufficiency rating procedures, while yet m relatively limited use, have proved to be the most satisfactory, realistic, and factual means of evaluating highway needs and programming improvements. Sufficiency rating procedures have been devised so as to provide a means of evaluating the relative adequacy of each section of a highway according to certain prescribed standards. Smce these standards are prescribed on the basis of traffic volume and the functional characteristics of the system, the resultant ratings give an evaluation of the road section's ability to carry its quota of traffic safely, rapidly and economically. Thus, the ratings have been used to measure, on a comparative basis with other highway sections, the relative importance and need for renewal and replacement.
The formulas have been designed and the rating procedures developed with the intention of eliminating, or at least minimizing, the element of personal judgment in determining the relative sufficiency of highway sections. This has been done chiefly so that the public would accept the method as an impartial, unbiased appraisal, because any method of establishing improvement priorities to be of value must have the full understanding, acceptance, and confidence of all individuals and groups interested in improving the adequacy of the highway network. On the basis of such public acceptance, the ratings have been successfully used to hold to a minimum political and community pressure in highway planning and construction.
Periodically, the problem of highway financing comes before our legislative bodies. At such times legislators are desirous of knowing the status of the highway plant and obtaining a realistic estimate of the funds required to achieve a given standard of improvement on a state-wide basis. In this connection, concern is often evidenced as to whether available funds are being allocated where they are doing the most good. Administrators, faced with
legislative allocation based on political expediency, have used sufficiency ratings to measure at annual intervals the average rating of the highway system, so the status of improvement and the rate of progress of the long range program can be determined. This information can be presented to legislative groups, the rate of progress, whether plus or minus, providing a means of measuring the adequacy of highway revenues.
The general public has but a vague notion as to the extent of its investment in the state highway system. The conscientious administrator is not only acutely aware of this investment but is concerned with protecting it by proper renewal and replacement. Sufficiency ratings can be used to budget available funds for highway improvements in the relative order of need and thus protect the public's investment.
Not the least of the highway administrator's responsibilities is the development of public understanding of the highway problem within his jurisdiction. He and his assistants are frequently called upon to meet with civic groups interested in the improvement of a particular highway. Such situations offer opportunity to e:q)and the public comprehension beyond the limits of the local problem to the overall picture. Sufficiency ratings graphically protrayed on a map should provide a valuable aid in accomplishing this.
The real test of sufficiency ratings as an administrative tool, however, must come through actual use. Arizona, which originally developed the system, has used it successfully since 1946. A dozen other states have also used this rating method, modified to suit their particular conditions. Some of these have applied it on an ejqjeri-mental basis to all or part of their primary systems. Others, after experimentation, have adopted a rating method and are using it for the second and third year on both their primary and secondary systems. Statistical tables of components of ratings, such as Arizona publishes annually, have been published by at least five other states.
In each instance where the ratings have been tried or adopted, certain limitations in their use have been recognized. The task of selecting projects for construction or improvements is fraught with the consideration of many factors in addition
to those \i*ich can be reduced to a formula. At best, the ratings should be used as a guide and an aid in formulating improvement programs and not as a substitute for sound planning.
The location of new routes and the programming of funds for their construction must be done with the aid of special studies involving traffic service and economics. Personal knowledge of particular situations and personal judgment based on this knowledge must function as a necessary adjunct to any sufficiency-rating system.
It is unrealistic not to give some degree of consideration to human and political factors where community economic and cultural welfare are concerned. Certain road sections of relatively low priority may have to be included in a construction program to obtain logically planned route continuity and thus serve the cultural and economic needs of one or more communities. The concentration of construction funds on a small group of routes or in any one locality is impractical and may be highly undesirable from a policy standpoint, even though some low-rating sections may be involved.
It has been noted that some states upon investigating sufficiency-rating procedures have rejected them because it was felt that the ratings did not provide a true measure of relative sufficiency. As an administrative tool, a sufficiency-rating formula is valuable only as it accurately reveals the relative service value, from a motor transport standpoint, of the various highways. Thus,to be acceptable, it must have vaudity.
Finally, any sufficiency-rating system to be acceptable should possess the administrative virtues of simplicity, flexibility, and economy in proper balance. Complicated^,involved calculations and determinations, which make the rating procedure cumbersome, should be avoided. On the other hand, simplicity may have to be sacrificed in order to devise a system that will adequately serve. Flexibility is required to make possible wide application, but loss of reliability and validity may result from too much flexibility. In balance with these two should be economy of operation, but here some sacrifice may be necessary since the best rating procedure may be far from being the most economical.
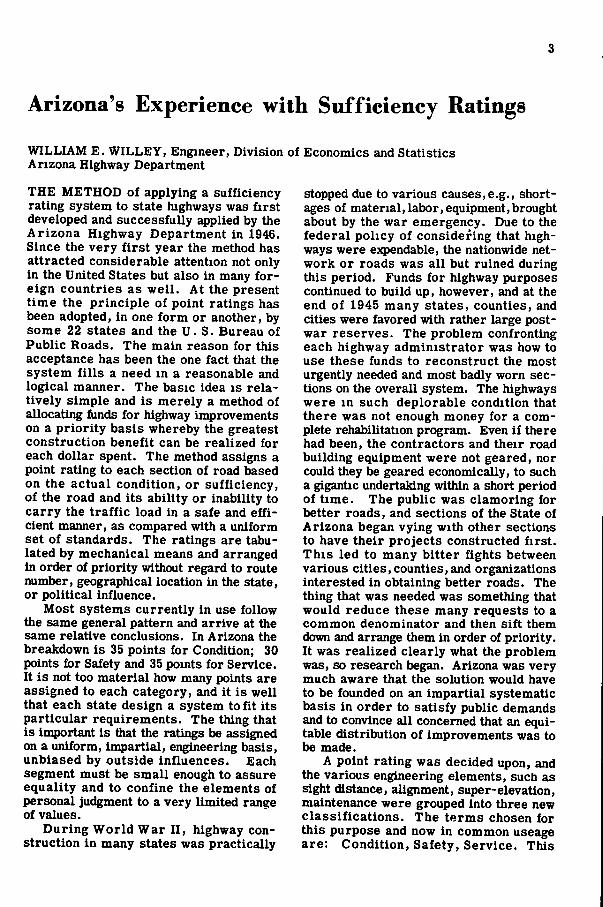
Arizona's Experience with Sufficiency Ratings
WILLIAM E. WILLEY, Engineer, Division of Economics and Statistics Arizona Highway Department
THE METHOD of applying a sufficiency rating system to state highways was first developed and successfully applied by the Arizona Highway Department in 1946. Since the very first year the method has attracted considerable attention not only in the United States but also in many foreign countries as well. At the present time the principle of point ratings has been adopted, in one form or another, by some 22 states and the U. S. Bureau of Public Roads. The main reason for this acceptance has been the one fact that the system fi l ls a need in a reasonable and logical manner. The basic idea is relatively simple and is merely a method of allocating funds for highway improvements on a priority basis whereby the greatest construction benefit can be realized for each dollar spent. The method assigns a point rating to each section of road based on the actual condition, or sufficiency, of the road and its ability or inability to carry the traffic load in a safe and efficient manner, as compared with a uniform set of standards. The ratings are tabulated by mechanical means and arranged in order of priority without regard to route number, geographical location in the state, or political influence.
Most systems currently in use follow the same general pattern and arrive at the same relative conclusions. In Arizona the breakdown is 35 points for Condition; 30 points for Safety and 35 pomts for Service. It is not too material how many points are assigned to each category, and it is well that each state design a system to fit its particular requirements. The thing that is important is that the ratings be assigned on a uniform, impartial, engineering basis, unbiased by outside influences. Each segment must be small enough to assure equality and to confine the elements of personal judgment to a very limited range of values.
During World War I I , highway construction in many states was practically
stopped due to various causes,e.g., shortages of material, labor, equipment,brought about by the war emergency. Due to the federal policy of considering that highways were e^endable, the nationwide network or roads was all but ruined during this period. Funds for highway purposes continued to build up, however, and at the end of 1945 many states, counties, and cities were favored with rather large postwar reserves. The problem confronting each highway administrator was how to use these funds to reconstruct the most urgently needed and most badly worn sections on the overall system. The highways were in such deplorable condition that there was not enough money for a complete rehabilitation program. Even if there had been, the contractors and their road building equipment were not geared, nor could they be geared economically, to such a gigantic undertaking within a short period of time. The public was clamoring for better roads, and sections of the State of Arizona began vying with other sections to have their projects constructed first. This led to many bitter fights between various cities,counties,and organizations interested in obtaining better roads. The thing that was needed was something that would reduce these many requests to a common denominator and then sift them down and arrange them in order of priority. It was realized clearly what the problem was, so research began. Arizona was very much aware that the solution would have to be founded on an impartial systematic basis in order to satisfy public demands and to convince all concerned that an equitable distribution of improvements was to be made.
A point rating was decided upon, and the various engineering elements, such as sight distance, alignment, super-elevation, maintenance were grouped into three new classifications. The terms chosen for this purpose and now in common useage are: Condition, Safety, Service. This
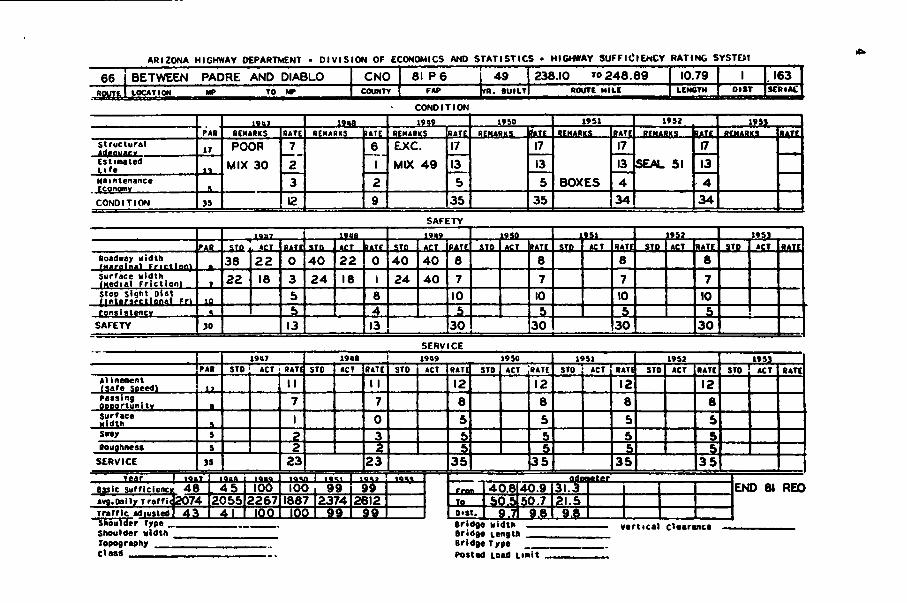
ARIZONA HIGHWAY DEPARTMENT - DIVISION OF ECONOMICS AND STATISTICS « HIGHWAY SUFFICIENCY RATING SYSTE»I
66 j BETWEEN PADRE AND DIABLO CNO 81 P 6 1 • 1
49 238.10 TO 248.89 10.79 1 1.163 j BOUTE 1 LOCATION HP TO n r COUNTY FAP n t . BUILT ROtlTC MILC LENGTH OIST | s C R I « C |
CONDITION
19 as 19«9 19 so 19SI 19S1 1951 PA* RCMARKS RATE RCMARKS IAT{ REMARKS R/^T( REMARKS REMARKS REMARKS REMARKS RATE
S t r u c t u r a l 17 POOR 7 6 EXC. 17 17 17 17
Est imated L i f e 11 MIX 30 2 1 MIX 49 13 13 13 SEAL 51 13 Maintenance 3 2 5 5 BOXES 4 4 C O N D I T I O N 35 12 9 35 35 34 34
SAFETY
10117 1908 I9a9 19 so 951 1952 1953 STO ACT RATE STO ACT lATf STD ACT PATC STO ACT II^T[ STD RATE STp RATS
Roadway w i d t h f i m r f l n a l r r i r t i n n ) t 38 2 2 0 40 22 0 40 40 8 8 8 8 Sur face w i d t h (Media l F r i c t i o n ! T 22 18 3 24 18 1 24 40 7 7 7 7 Stop sight D i s t { ( n t e r s p c t l o n a l f r > 5 8 10 10 10 10 c o n s i s t e n c y a ^ 4 5
SAFETY JO 13 13 30 30 30 30 SERVICE
19t7 19«8 1909 1950 19S1 19 S2 1953 PAR STO ACT RATI STO ACT RATE STO ACT RATE STD ACT RATE STO ACT RATI STO ACT RATE STO ACT RATE
A l I n e n e n t (Sa fe soeedl 12
1 1 1 1 12 12 12 12 Passing ODDor tun i t* a 7 7 8 8 8 8 S u r f a c e w i d t h i 1 0 5 5 5 5 Svay 5 2 3 5 5 5 Roughaes* 5 2 ? 5 5
SERVICE J5 23 23 35 3 5 35 3 5 taw I l o ^ i I l o y • 100 I 99 9 i Basic Suf f i c i enc r . 48
A ^ . Dal l y T r a f f id2074 T r a f f i c Ad.ustedI 43 I 4 Snouioer Type _ _ _ _ _ _ _ Shoulder w i d t h Topography Class
4 5 100 2267
100 [ lOOl 99 I 99 I
40.8 40.9 31.3 TO ? l . 5 DiSt. 9,7 93 9» B r i d g e w i d t h B r i d g e Length B r i d g e Type Pasted l e a d u n i t
END 81 RED
vertical clearance
meant that the condition of the road would be observed and given a point rating. Accident records and physical measurements, when compared with established standard criteria, would provide a safety figure, and whether or not traffic was getting over the road in an efficient and comfortable manner would be a measure of the service provided the motoring public. A field card was designed and the highway log was referred to so as to establish the lengtn of each section to be rated.
By the second year most of the bugs had been eliminated from the system, and by 1948 it was considered nearly foolproof in performing the job i t was designed to do. In the early stages each card contained only the data for one year. But it is now recommended that each card be designed to cover a period of at least three annual ratings, so all background data will be available to the field crew. Notes placed on the card from previous years can serve as a historical guide while the section is being Investigated and a new rating appUed. The present form used in Arizona provides space for ratings over a period of seven years.
In rating a particular route it is well to alternate the direction of travel in order to observe the riding qualities and appearance of the highway in both lanes. In this manner the rating of the previous year can be correlated with the current rating and a true overall result can be obtained. A divided highway should be rated by direction of travel, and a separate tabulation listed for each roadway between the same termini. A compass designation has been adopted to identify each section of a divided highway, e.g., Route 84 east and Route 84 west.
Prior to the start of World War H, and principally during the 1930's, the public hearings on each annual Arizona highway construction budget were rather hectic affairs. The commission room was crowded and overflowed into the halls with people from all over the state. Each group was primarily concerned with the political aspect of the road they were demanding, and their thoughts were generally along the lines of local pressure at the expense of the state as a whole. Many stories were circulated at that time as to how the highway commission decided where to spend
its money. There were five commissioners, so it was said that they divided the money five ways and each spent his share in his respective district. Another version was that since there were 14 counties, the funds were equally divided into 14 parts. Still another related how the projects were drawn from a hat, and if a certain group did not get in line their particular improvement would not even reach the hat.
Since the sufficiency-rating method was established, these same public hearings on the budget have lost all their old fight and glamour, along with the abolition of political bitterness between local sections within the state. The hearings are now very brief and orderly with only a few people in attendance, and these individuals are usually present to express some word of appreciation for the businesslike and equitable manner in which the state highway funds are allocated. This very desirable change in public attitude came about principally because of the intelligent use of the rating system.
In order to definitely determine the extent to which the commission has used the system, a computation was made of the point ratings of the projects budgeted for reconstruction since 1946. The results disclosed that an average of over 80 percent has been achieved in allotting funds to the most critical projects. The remaining 20 percent went for many improvements that were a matter of state policy and only a very small percentage went for so-called purely political expedients. One of the policies worthy of mention is the matter of paving gaps in the state highway system. A gravel surface road for instance may be straight, level and in good condition and have a rating of 75 points. On the other hand it is dusty and expensive to maintain, so the policy is to bring the state system up to a paved standard at the earliest possible date. Money is therefore programmed and the section is improved. The result is only a slight point value gain; however, the project was worthwhile and had to be done at one time or another.
At this point it would be well to mention that, like other mathematical formulas, the sufficiency rating system must not be used blindly. It is a guide, or an engineering tool, to assist the highway administra-
6
tor in doing a better job. For instance it is not practical or desirable to build only the inexpensive sections of a highway system. The costly mountainous sections, or bridge structures, must also be constructed, so an integrated highway network will be the result. It is also impossible from a public relations standpoint to place all funds for improvement on any one route or in any particular portion of the state simply because the roads have a low point rating. The problem being dealt with is a state highway system, badly in need of funds for improvement; In the filial analysis all sections of the state must receive an equitable distribution.
Knowing these limitations, It is still possible to use the system to good advantage by analyzing all sections with a critical rating of 60 points or less. In this manner the responsible executives can be sure that they are not overlooking a single item that needs to be Improved and a priority list for programming can be established. After these facts are pointed out, the results then obtained will depend upon experience and sound administrative judgment.
An important by-product of the sufficiency rating system is its ability to disclose the degree of progress being made in improving the state highway system. It will show whether or not construction expenditures on a particular route are keeping pace with traffic demands, together with wear and tear on the highway. To go further, the average of all the route ratings, taken by highway systems, can inform the state engineer, the highway commission, and other highway administrators how the overall picture changes from year to year. If the rating goes up it shows that progress is being made and everything is well under control. The administration is good. The public is satisfied. Money is being spent where the needs are greatest. Everything is fine.
Now, on the other hand, i f the rating stays the same, you are just barely holding your own, and every available means of further improvement must be sought. The final possibility is to be confronted with the stark realization that the rating is going down in spite of the best that can be done. This has been the experience in Arizona during the past year. In other
words, the highways are wearing out at a rate faster than they are being reconstructed. Without the sufficiency-rating tabulations this statement would be guess work, and the subject of a great difference of opinion. The results are calculated from factual data, however, and the reasons for this downward trend are known. The principal reasons for this decline are twofold: a great increase in traffic and the tremendous rise In construction costs. With this information the highway department is in a good position to give a satisfactory e;q;>lanatlon to the public as to why the highways are not keeping abreast of the demands.
Experience has disclosed that road-system classification must be considered in establishing a sufficiency-rating procedure. There should be a separate rating tabulation for the primary system; the federal-aid secondary system and the urban system. The urban mileage has reached the point in Arizona where a separate tabulation soon will be justified. At present it is combined with the report showing the status of the primary system. In order to assist the 14 Arizona counties in doing a better job of programming and because each county supplies the matching funds on county roads, a field investigation, together with a sufficiency rating report on all county federal-aid secondary routes in the state, has been made.
As a new development just added this year, we believe the continuity of improvement of a highway has a value in a sufficiency-rating tabulation. That is to say, it is better to have a continuous good section of road than to have the same mileage in several intermittent good sections separated by poor segments. For this reason we have arbitrarily applied a two point adjustment to a poor hi^way with a rating of less than 60 points i f it joins a better section with a rating of 80 points or more. If a low-rating section is located between two improved projects, the overall rating is lowered 4 points in the same manner that the traffic volume adjustment is made.
In view of the wide acceptance that this system has received, it is apparent that some method of sufficiency rating is considered absolutely essential for intelligent and successful highway administration.
planning and programming. It is believed that any state that does not have such a system in the years to come will be as out of date as a new automobile without
an automatic transmission. To those states not yet using a rating method, it ir. highly recommended that they adopt one and give 'it a trial.
General Comments on Sufficiency-Rating Procedures
JOHN A. SWANSON, Division Planning and Programming Engineer Bureau of Public Roads, St. Paul
IN DISCUSSING this topic, remarks will be directed toward giving a general summary of the principal characteristics of the procedures in use in various states. Areas of similarity and areas of difference w i l l be noted together with comments on features of particular interest adopted by certain states.
The "Review and Digest of Sufficiency Rating Formula Procedures" published by the Highway Research Board last June makes certain significant comparisons
\ between the various formulas in use. As those comparisons were rather abstract, it was thought of interest to apply the formulas outlined to a few typical road sections. The road sections were rated by all formulas, except those for Kentucky, Nebraska, and Virginia, for which the descriptive data were incomplete in one or more respects. The uniform sufficiency rating plan of the Bureau of Public Roads, currently being applied nation-wide to federal-aid primary, interstate,and forest highway systems, in connection with the regular maintenance inspections, is likewise not included in the following analysis.
Following is a brief description of the four road sections selected, all of which are in Minnesota:
Section A is located on the interstate system on TH152 extending southeasterly from the north Hennepin County line. It is 12.67 ml. in length and was a county road prior to its addition to the state highway system in 1934. The roadway width is 30 ft . with a bituminous surface course 2 in. in depth and 24 f t . in width placed on an unstable subgrade. The sight distance is restricted to less than 1,500 ft . on 76 percent of its length. There are four substandard curves on the section.
The 1950 annual average dally traffic was 947, with a very substantial increase expected when the route and its extensions are improved to adequate standards.
Section B is a federal-aid primary route located on US 12 extending westerly from Long Lake in Hennepin County for 8.79 mi. It was graded in 1928 and a 20-ft. port-land-cement concrete pavement with 8-ft. shoulders was placed in 1930. The sight distance is restricted to less than 1,500 ft . on 55 percent of its length. There is one substandard curve. The average traffic volume is 3,426 vehicles daily, with normal increases e:q>ected.
Section C is an interstate route located on US 65 south of the Minnesota River in Dakota County and is 7.36 mi. in length. It was graded in 1921 and a 6-in. portland cement concrete base and a 2-in. asphalt surface, both 18 f t . in width, were placed in 1922. The current effective shoulder width is about 3 1/2 ft . The sight distance is restricted to less than 1,500 ft . on 59 percent of its length. There are no substandard curves. The average traffic volume is 3,105 vehicles daily, with a greater than normal increase expected when this section is reconstructed.
Section D is a federal-aid primary route extending south-westerly from Stillwater in Washington County for 11.17 mi. It was graded in 1924 and an 18-ft. portland cement concrete surface was placed in the same year. The shoulder width is 7 ft . , 2 1/2 ft . of which is bituminous surfaced. The sight distance is restricted to less than 1,500 ft . on 60 percent of its length. There are seven substandard curves. The average traffic volume is 2,575 vehicles daily, with normal increases expected.
Each of these sections was rated by the
8 formulas used by 16 states!. The rating formulas used by the various states generally fall in one of two broad classifications - sufficiency or deficiency. A sufficiency rating formula is one which compares the section being rated with a given standard, usually in terms of percentages expressed as whole numbers.
The deficiency-rating formula sums the deficiencies of the section being rated and may or may not express the total deficiency rating as 100 minus the sufficiency rating. If the deficiency rating does not represent 100 minus the sufficiency rating, it would represent the sum of a number of heterogeneous items, such as the number of substandard curves, substandard gradients, on the section. Eleven of the states studied use the sufficiency-rating formula providing elemental ratings for condition or structural adequacy, safety, and service. The formulas for three of the states, namely Colorado, Idaho, and Louisiana, are substantially the same. The formula used by the Bureau of Public Roads employs almost identically the same formula as part of its maintenance inspection procedure. Connecticut's formula is very similar to the sufficiency-rating for-
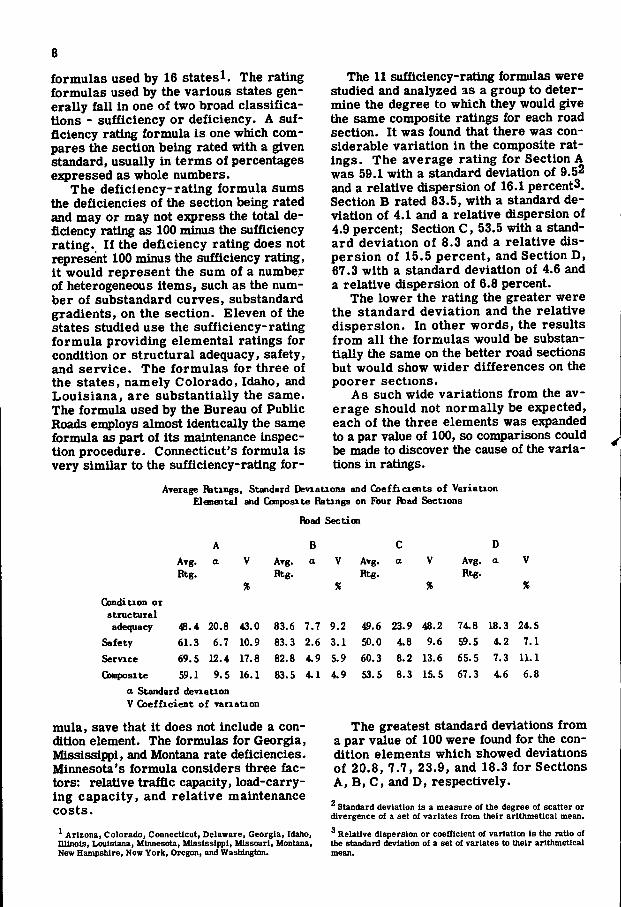
The 11 sufficiency-rating formulas were studied and analyzed as a group to determine the degree to which they would give the same composite ratings for each road section. It was found that there was considerable variation in the composite ratings. The average rating for Section A was 59.1 with a standard deviation of 9.5^ and a relative dispersion of 16.1 percentS. Section B rated 83.5, with a standard deviation of 4.1 and a relative dispersion of 4.9 percent; Section C, 53.5 with a standard deviation of 8.3 and a relative dispersion of 15.5 percent, and Section D, 67.3 with a standard deviation of 4.6 and a relative dispersion of 6.8 percent.
The lower the rating the greater were the standard deviation and the relative dispersion. In other words, the results from all the formulas would be substantially the same on the better road sections but would show wider differences on the poorer sections.
As such wide variations from the average should not normally be expected, each of the three elements was expanded to a par value of 100, so comparisons could be made to discover the cause of the variations in ratings.
Average Ratings, Standaid DeviaUons and Coefficients of VariaUon Elonental and Composite Ratings on Foui Road Sections
Road Section
A B C D
Avg. a V Avg. a V Avg. a V Avg. a v Rtg. Rtg. Rtg. Rtg.
% % % % Condition o i
stiuctutal adequacy 48.4 20.8 43.0 83.6 7.7 9.2 49.6 23.9 48.2 74.8 18.3 24.5
Safety 61.3 6.7 10.9 83.3 2.6 3.1 50.0 4.8 9.6 59.5 4.2 7.1
Service 69.5 12.4 17.8 82.8 4.9 5.9 60.3 8.2 13.6 65.5 7.3 11.1
Composite 59.1 9.5 16.1 83.5 4.1 4.9 53.5 8.3 15.5 67.3 4.6 6.8
a Standard deviation V Coefficient of variation
mula, save that it does not include a condition element. The formulas for Georgia, Mississippi, and Montana rate deficiencies. Minnesota's formula considers three factors: relative traffic capacity, load-carrying capacity, and relative maintenance costs.
^ Arizona, Colorado, Connecticut, Delaware, Georgia, Idaho, minols, Louisiana, Minnesota, Mississippi, Missouri, Montana, New Hampshire, New York, Oregon, and Washington.
The greatest standard deviations from a par value of 100 were found for the condition elements which showed deviations of 20.8, 7.7, 23.9, and 18.3 for Sections A, B, C, and D, respectively. Standard deviation Is a measure of the degree of scatter or
divergence of a set of varlates from their arithmetical mean.
^ Relative dispersion or coefficient of variation is the ratio of the standard deviation of a set of varlates to their arithmetical mean.
9
The Colorado, Idaho, and Louisiana condition ratings were found to be with the highest. The reason for this condition is that their ratings are intended to reflect the structural condition which exists with respect to the standard to which the road surface was originally designed and subsequently improved. The rating is based on the amount or percent of deterioration beyond the scope of maintenance, if any, since construction. Rating on this basis does not give a true warrant of the need for reconstruction of the surface to meet current needs.
The Arizona, Delaware, and Illinois formulas generally gave the lowest ratings for condition or structural adequacy. These states place substantial stress on the remaining life factor on the basis of survivor curves. As most of the road surfaces studied were quite old, the condition rating was materially reduced thereby. If this factor is to be used in the formula, it is believed that it should be estimated in the field as is done by Missouri, rather than on the basis of survivor curves. Functional
1 obsolescence is an important consideration ^ in road life and is recognized by most of
the factors considered under the safety and service elements.
The Arizona, Delaware, Illinois, and Missouri formulas gave the four lowest condition ratings on Section C, due not only to the road life factor but also to the maintenance economy factor. Maintenance economy is a factor that can quite easily be overlooked in rating a section. Because of its importance, its incorporation in the formula appears to be desirable.
The condition as determined by the New Hampshire formula falls in the median position on all four sections. The factors rated by New Hampshire are foundation, pavement, and shoulders.
There was no particularly great variation in the safety element,using the various formulas. The standard deviation ranged from 2.6 on Section B to 6.7 on Section A. The Illinois and New York formulas have a tendency to rate somewhat higher than the others. The Illinois safety rating was higher because it placed greater emphasis on surface width and less on stopping sight distances than did the other states. Of the formulas studied. New York's was the only one which did not consider surface and roadway widths under the safety element.
In lieu thereof*, surface and right-of-way conditions affecting safety are rated, which accounted for the higher rating for the safety element. It should be noted, however, that New York supplements the sufficiency rating in evaluatmg highway needs
-with accident rate data and the road's deficiency in capacity. Surface and shoulder width are considered in that latter item.
The variations in the service ratings were somewhat greater than on the safety element. The standard deviation ranged from 4.9 on Section B to 12.4 on Section A. The New York,New Hampshire,and Arizona formulas tended toward low ratings. All three formulas place greater emphasis on the ndlng qualities than do the other states. In addition, the New York formula does not consider surface width.
Missouri's formula tends to rate the service element higher, as it does not impose as severe a penalty for deficient alinement and surface width.
The sufficiency-rating formulas show such variation by states at the present time that on the basis of this particular study they cannot be used to draw comparisons between states.
Connecticut's formula differs from the usual sufficiency-rating formulas in that it does not consider the condition element. That state has a peculiar condition in that they have very few roads which are structurally inadequate. Weak spots which might develop are corrected under maintenance, and it I S felt that this factor is adequately recognized in the item of this formula which considers maintenance costs. Connecticut's formula places great emphasis on the accident rate by assigning 30 out of a possible 100 points to that item. Passing sight distance, alinement and surface widths with par values of 20, 13, and 25, respectively, also are contributing factors to the accident rate.
The Mississippi, Montana, and Georgia deficiency rating formulas are difficult of comparison with the sufficiency-rating formulas. The ratings as computed from these formulas do not place the road section on the same relative order of adequacy, except that all three rate Section C as the poorest section.
The Mississippi formula sums various types of deficiencies,but has no theoretical maximum deficiency ratings.
The maximum deficiency from the Mon-
10
tana formula would be 100 percent, with a total of 60 percent allotted to surface and base deficiencies. This formula provides a more severe method of evaluating those two items than do the other formulas. As a result, these ratings are generally much lower than the others.
The Georgia formula showed the poorest relationship with the other formulas of all the formulas considered. This was due to the fact that it considers only surface-width and sight-distance deficiencies.
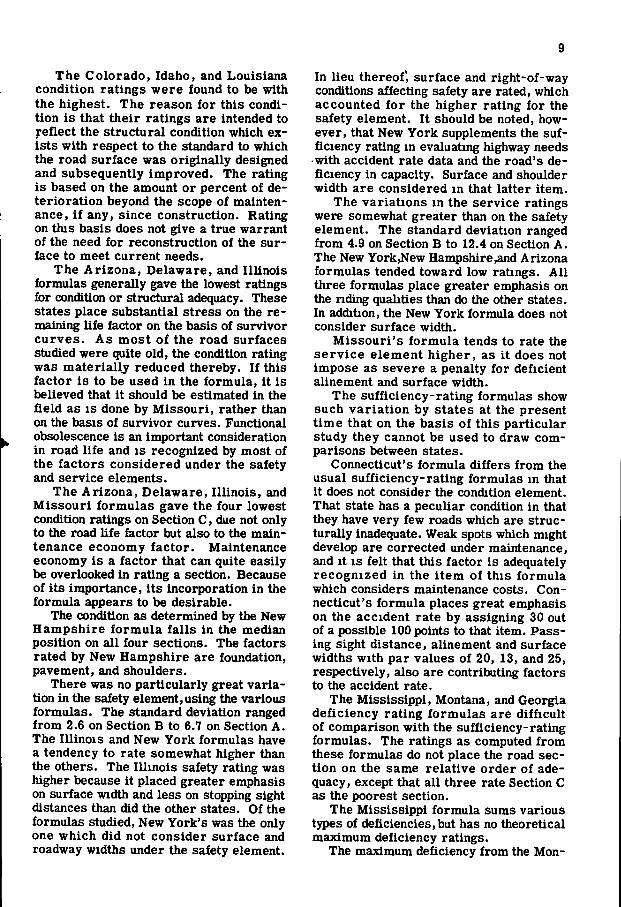
and D were compared with the rating for Section B. Section B was selected as the base for the comparisons as it had the
* highest rating, making it convenient to express the relative sufficiency of Sections A, C, and D in terms of Section B. If those percentage relationships for each formula \frere the same, the formula would rate the sections in the same relative order. It was found that Section A's average rating was 70.7 percent of Section B, but the standard deviation therefrom was 11.4.
GDmposite Batings on Test Sections by Use of A l l Fotinulas Studied
Raung Fonmila
Sufficiency Base 11-State average Connecticut
Deficiency Base Mississippi Montana
Georgia
Other Minnesota E\atio: 30th peak hour to prac-
Par Value Sec. A Sec. B Sec. C Sec. D
100 59.1 83.5 53.5 67.3 100 68 76 49 68
None 43 45 63 55 Manmum de&ciency
= 100 70.7 38.9 71.9 43.5 None 6.08 28.36 29.95 21.89
Over 1.0 t ical hourly capacity intolerable 0.9 1.4 4.4 1.9
Axle loading 9 tons 4 9 9 9 Maintenance cost per ndle None 1090 812 2335 870
The deficiency-rating formulas show far less agreement as a group than do the sufficiency rating formulas.
Minnesota's formula considers three elements: (1) the relationship of the thirtieth-highest annual hourly volume to the practical hourly capacity, (2) the load-carrying capacity, and (3) the relative maintenance cost. Its formula cannot be compared with the others,but does indicate that warrants for construction or improvement exist on all four sections. It is to be noted that Minnesota's formula indicates that Section B is in the need of improvement, which fact is not apparent from the sufficiency-rating formulas.
Having found that the various formulas showed considerable variation in the total rating for the same road section, the sufficiency-rating formulas were studied to determine the degree to which they agreed as to relative ratings between the four road sections.
The total ratings for Sections A, C,
Section C's rating averaged 64.1 of Section B with a deviation of 9.9. Section D's rating averaged 80.6 of Section B with a standard deviation of 3.6.
The Connecticut formula indicated that the sufficiency of Section A, C, and D were 90 percent, 64 percent, and 90 percent, respectively, of Section B. Relationship of Sufficiency Ratings on Sections A, C, &
D to those on Secticn B
Ccndition Safett Service Total [fating AVR. a V Avfr a v AVR. a V AVR. a V
A 57.3 22.7 % 40 73.9 9.1
% 12.3 84.1 14.1
% 16.8 70.7 11.4
% 16
C SB.6 26.8 46 60.1 5.9 9.8 72.9 9.0 12.3 64.1 9.9 15 D89.0 7.7 9 70.6 3.2 4.5 79.4 8.5 10.7 80.6 3.6 4
Converting the Montana deficiency rating to a sufficiency rating showed that Section A, C, and D were 48 percent, 46 percent, and 93 percent of Section B, respectively.
The indications are that when a large number of road sections are considered, the various formulas, with possibly one

11
or two exceptions, wi l l not rate the road sections in the same relative order.
Each of the formulas studied was tailored to f i t the conditions existing in a particular state. As such i t is not surprising that the formulas do not give the same composite ratings or rate sections in the same relative order where applied to conditions in any one state. In addition, the application of the various formulas to but four test sections certainly does not clearly establish the validity of any of the formulas. However, certain tenative
conclusions are indicated: (1) there is a significant difference in the ratings derived by the use of the different formulas which make state comparisons of ratings of doubtful validity, (2) the major difference between the formulas is in the method of computing the condition of structural adequacy rating, (3) the formulas do not place the road sections rated in the same relative position with respect to sufficiency, and (4) there is closer agreement between the sufficiency ratings than there is between the deficiency ratings.
Possible Areas of Improvement in Rating Procedures
p. R. STAFFELD, Manager, Highway Planning Survey Minnesota Department of Highways
THE RATING of highway sections with respect to their sufficiency is not new or unique. For many years states have developed their construction programs on the basis of the personal knowledge of their administrative staff of the need for improvement on the various portions of their state highway system. Such a method of program development, while unscient i f i c , informal, and surely not free from personal bias, has been founded on an appraisal of the relative sufficiency of the many routes that comprise the system. Thus i t must be realized that highway sections can and have been rated in the past for sufficiency whether formally or informally, casually or periodically.
Sufficiency-rating formulas have been devised and procedures developed, however, to provide a method whereby the rating of highway sections could be as unprejudiced, objective, and uniform as possible. To obtain this end, i t is essential that no factor or element be used which cannot be precisely defined and adequately measured.
From one point of view, the act of rating is one of comparing individual highway sections, with respect to certain elements which have been selected as significant, with a hypothetical highway section. This hypothetical section meets certain geometric standards previously selected and
established. These standards are essential, and they should be as objective and consistent as possible. Where they are not, the ratings obtained w i l l be of low re l i ability, since the personal bias of the individuals rating the e lements may produce considerable variation in the final rating values.
It is admittedly difficult, for example, to establish objective standards for the element "consistency"; consequently i t becomes necessary to rate this element on the basis of a subjective evaluation. The personal judgment required to do this reduces the reliability of the rating. This may likewise be true of standards for such other elements as "sway in cross section," "roughness," or "surface driving condit ion." It is noted that some states do not use these elements, and i t is suggested that the procedure might have greater acceptability i f these elements, for which objective standards are not obtainable, be eliminated.
The standards used for the condition or structural adequacy rating appear to vary considerably as to objectivity. Here is a factor that purports to measure the structural adequacy of a roadway and yet in many instances the standard used is the one to which the roadway was originally designed and constructed. Standards for structural adequacy can best be established
12
on the basis of service to present-day traffic with consideration given to climatic conditions. Such standards,based on current design requirements should include those for such items as shoulders, drainage and base in addition to surface standards.
To adequately evaluate maintenance economy, i t would be desirable to use standards established from properly classified maintenance-cost data which have been acquired over a long period of time.
For making the field ratings some states have advocated the use of only one field party to cover an entire system and thus attempt to minimize the personal equation. It is no doubt necessary to adopt such safeguards where personal judgment enters into the rating procedure, but i t should be recognized that the use of a smgle party endeavors to standardize personal bias over the system to be rated rather than to eliminate i t . A more satisfactory approach would be the use of ratmg factors or elements that can be objectively measured and the elimination of elements the measurement of which depends on subjective appraisal. The guiding principle should be that objective measurements are superior in every way to judgments, and therefore, unit measurements should be used wherever possible.
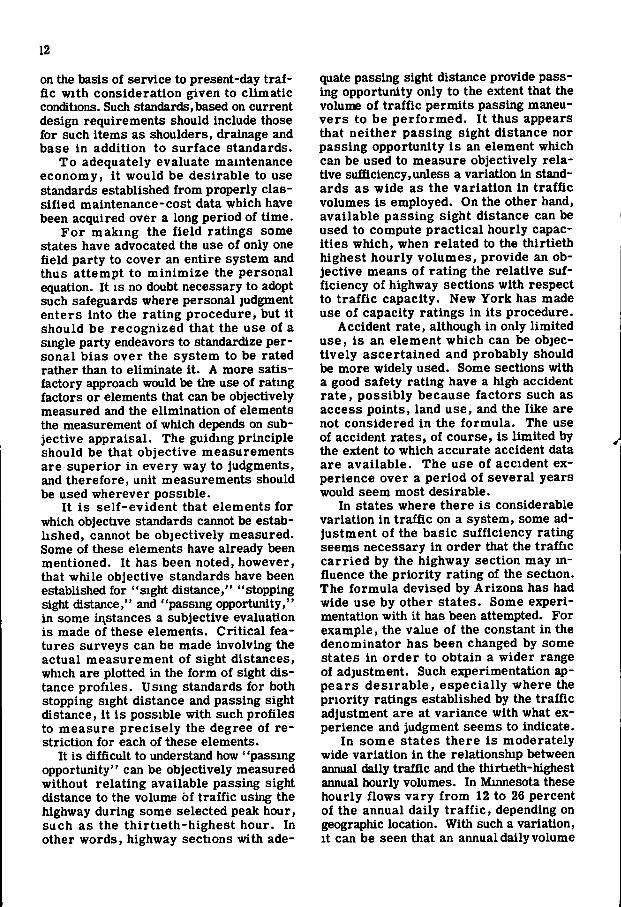
I t is self-evident that elements for which objective standards cannot be established, cannot be objectively measured. Some of these elements have already been mentioned. It has been noted, however, that while objective standards have been established for "sight distance," "stopping sight distance," and "passing opportunity," in some instances a subjective evaluation is made of these elements. Critical features surveys can be made involving the actual measurement of sight distances, which are plotted in the form of sight distance profiles. Using standards for both stopping sight distance and passing sight distance, i t is possible with such profiles to measure precisely the degree of restriction for each of these elements.
It is difficult to understand how ' 'passing opportunity" can be objectively measured without relating available passing sight distance to the volume of traffic using the highway during some selected peak hour, such as the thirtieth-highest hour. In other words, highway sections with ade
quate passing sight distance provide passing opportunity only to the extent that the volume of traffic permits passing maneuvers to be performed. I t thus appears that neither passing sight distance nor passing opportunity is an element which can be used to measure objectively relative sufficiency, unless a variation in standards as wide as the variation in traff ic volumes is employed. On the other hand, available passing sight distance can be used to compute practical hourly capacities which, when related to the thirtieth highest hourly volumes, provide an objective means of rating the relative sufficiency of highway sections with respect to t raff ic capacity. New York has made use of capacity ratings in its procedure.
Accident rate, although in only limited use, is an element which can be objectively ascertained and probably should be more widely used. Some sections with a good safety rating have a high accident rate, possibly because factors such as access points, land use, and the like are not considered in the formula. The use of accident rates, of course, is limited by the extent to which accurate accident data are available. The use of accident experience over a period of several years would seem most desirable.
In states where there is considerable variation in traffic on a system, some adjustment of the basic sufficiency rating seems necessary in order that the traffic carried by the highway section may m-fluence the priority rating of the section. The formula devised by Arizona has had wide use by other states. Some experimentation with i t has been attempted. For example, the value of the constant in the denominator has been changed by some states in order to obtain a wider range of adjustment. Such experimentation appears desirable, especially where the priority ratings established by the traffic adjustment are at variance with what experience and judgment seems to indicate.
In some states there is moderately wide variation in the relationship between annual daily traffic and the thirtieth-highest annual hourly volumes. In Minnesota these hourly flows vary f rom 12 to 26 percent of the annual daily t r a f f i c , depending on geographic location. With such a variation, i t can be seen that an annual daily volume
13
of 2,500 vehicles means a design-hour volume of 300 vehicles at one location and 650 at another. This suggests that design-hour t r a f f i c volumes should be used in setting up the basic standards and in making the traffic adjustment to the basic sufficiency rating.
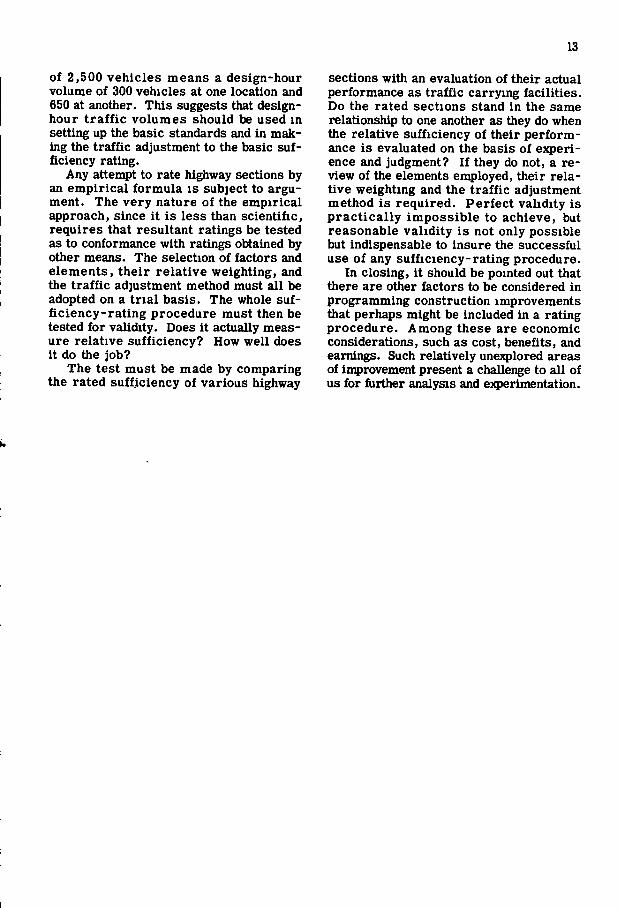
Any attempt to rate highway sections by an empirical formula is subject to argument. The very nature of the empirical approach, since i t is less than scientific, requires that resultant ratings be tested as to conformance with ratings obtained by other means. The selection of factors and elements, their relative weighting, and the traffic adjustment method must all be adopted on a t r i a l basis. The whole sufficiency-rating procedure must then be tested for validity. Does i t actually measure relative sufficiency? How well does it do the job?
The test must be made by comparing the rated sufficiency of various highway
sections with an evaluation of their actual performance as traffic carrying facilities. Do the rated sections stand in the same relationship to one another as they do when the relative sufficiency of their performance is evaluated on the basis of experience and judgment? I f they do not, a review of the elements employed, their relative weighting and the traff ic adjustment method is required. Perfect validity is practical ly impossible to achieve, but reasonable validity is not only possible but indispensable to insure the successful use of any sufficiency-rating procedure.
In closing, i t should be pointed out that there are other factors to be considered in programming construction improvements that perhaps might be included in a rating procedure. Among these are economic considerations, such as cost, benefits, and earnings. Such relatively unexplored areas of improvement present a challenge to all of us for further analysis and experimentation.
14
Considerations in Rating Urban Streets
CURTIS J. HOOPER, Director Bureau of Traffic-Planning-Design Connecticut Highway Department
THE PRESENT method of rating sufficiencies was developed to cover the needs of the state highway departments. Across the nation the state highway departments have always devoted the major part of their effort toward the rural sections of the state. Only in the recent past have their obligations been broadened to include the problems found on arterial streets in the in corporated communities.
The Connecticut experience, despite the fact that the major portion of the population resides in builtup areas, has paralleled that of many other states. The system for which the department is responsible comprises 3,000 mi . of which only 400 mi. are classified as urban. That this urban mileage, which is state-maintained, does not include al l of the roads of state importance can be shown by the fact that in establishing the federal-aid systems, regardless of road ownership, it was necessary to include an additional 160 m i . of locally-maintained traffic routes, 75 percent of which were major city arterials.
With our responsibility to the motorists of the state to provide as suitable a transportation system as their contributions, through road user imposts, wi l l allow we have been obligated to consider the adequacy of the city-maintained arterials which are used by the majori ty of our motorists in reaching their predominantly urban destinations. Having devoted a great number of years to the elimination of rural mud, we are now faced with the obligations to do something about the urban muddle.
As was natural, the sufficiency-rating procedures were pointed to the evaluation of rural routes. The factors rated in Connecticut have included surface and shoulder width, maintenance costs, accident e;q)eri-ence, alignment, and sight distance. The use of these items in rating rural highways has been well established. However, when the roadway is in an urban place with frequent intersecting streets, traffic
control devices of various types, vehicular and pedestrian crossings, and curb parking, one can readily see that some different elements should be evaluated.
Our interest has been in the provision of safe and efficient transportation faci l i ties. In rural places efficiency has been tied up with consistently high operating speeds influenced by consistency of alignment and availability of passing sight distance. In the urban places I think i t has come to be recognized that efficiency obtained through higher speeds should be minimized in order to reduce the l ikel i hood of accident occurrence. Efficiency in urban places must not be acquired at the sacrifice of safety, but rather,by whatever measures wil l provide that consistent modest pace and which w i l l reduce the frictions which are annoying to all users of the street. Those measures most likely to be accepted w i l l result in a regimentation so that vehicle and pedestrian habits may follow predictable patterns without the annoyances of "stop and go." It seems that, in order to attain the objective of safe and efficient transportation through urban areas, we must resort to a l l the ingenuity which the traffic-engineering profession has been able to contribute to the street-and-highway engineering ideas.
The rating of our existing streets must be based on the comparison of the features of the existing faci l i ty with those which would be provided by the facili ty which attains the ideals set forth above. The ideal which many highway departments have adopted for the solution of these a r te r ia l diff icul t ies is the expressway on new location to divert the traffic from the existing arterial. Unfortunately, this type of faci l i ty is so costly that its use must be restricted to those locations where the t raff ic volumes, congestion and hazard have reached such proportions as to support the administrator's decision to provide the expressway facil i ty and to provide him the funds for its construe-
15
tion. For each mile of such location there are probably 5 or 10 mi. slightly less congested where the motoring public must continue for many years to compete with the parkers and the pedestrians for space on the streets.
The design standards of urban express-ways have been well-developed. To a large extent these have been merely compromises of rural standards because of limitations imposed by urban right-of-way and construction costs. Only a few states, to my knowledge, have established standards for arterial street reconstructions. Indeed, the roadside features and the width available or procurable for rights-of-way almost require that each such project be a hand-tailored job. Our skills have not progressed to the point where we may be sure that the design proposed wil l provide the conditions desired. In our own state there are several locations where arterial reconstructions, within the last decade, have proved so deficient in operating characteristics that we already have plans well-advanced for superseding these with expressways on new locations.
The fallacy may have been based on a parallel to the Sherwin-Williams Paint motto: "Save the surface and you save a l l . " The provision of smoother, wider and straighter pavements has not produced the safe efficient travel desired.
If we should go through the list of items presently used for rura l rating, the in-appropriateness of their use in an urban rating might be pointed out in this manner: What good is greater surface width that leads to higher speeds and less frictions with vehicles in the stream i f i t increases the friction with vehicles crossing, turning, parking, and with pedestrians? Of what value is greater shoulder width i f i t is permitted to become parking stalls that create more frict ion by vehicles parking and unparking? Of what value is maintenance cost if that cost, as in Connecticut, is only the cost of keeping the surface, shoulders, and drainage facilities in sound structural condition? The costs omitted, namely, those for removing snow and ice, clearing up roadside l i t ter and mowing grass areas, in Connecticut at least, rise to much greater figures. Of what value is strai^tness of alignment i f that straight-ness is conducive to speeds which are un
safe considering the other roadway and roadside uses? Sight distance has no place in an urban rating because as used in our rural work i t is sight distance along the road in question. In urban work the i m portant sight distance is that around each street corner encountered in one's travel.
The other element used in the Connecticut sufficiency rating, accident experience, appears to be the only one having a direct and iDq)ortant bearing on urban sufficiencies. For urban sufficiency ratings i t is believed that we must weight those elements which reflect or influence the four frictions which McClintock made famous years ago: inter sectional, medial, marginal, and internal stream. The ratings must contain measures of the number of vehicles entering, leaving or crossing the arterial stream either from side roads, driveways or parking spaces. Some measure of pedestrian crossing should be evaluated. The spacing and frequency of intersecting streets, the presence or absence of driveways and curb parking should be considered. The volume and time consumed by crossing t raf f ic at the major intersections is important to the evaluation. The quantitative measure of the elements mentioned above would be influenced by the existing regulations on traffic entering f rom side s t ress whether this is by stop signs or traffic lights. If the major intersections are signalized, what is the percent of time available for travel on the artery? Are there any turn prohibitions? Are tiie successive signals progressive, synchronized, or just uncoordinated? What is ttie effect of bus operation? Should busses be included as just so many more vehicles parking and unparking? Or i f parking is eliminated, do not the busses stopping create a turbulence in the traffic stream which is more undesirable? Actual ly , what we should be seeking is a measure of congestion and al l elements which are envisioned in that term and are appropriate for consideration m an urban-rating system. The objective should be to obtain a congestion index. Unfortunately, the development of such an index is a major undertaking and few authorities have developed data with which they are satisfied.
At last year's Board meeting, we were shown in the paper by Carmichael and Haley that the instrumentation developed
16
by the General Motors proving ground, when driven over a number of Connecticut rural highways, provided a close correlation between the average speeds and the independently developed rural sufficiency ratings. The paper by Alexander J. Bone of the Massachusetts Institute of Technology on "Travel Time and Gasoline Consumption Studies in Boston" is based on the same equipment. The synopsis of his report includes the statement that the average speed obtained on different routes serves as a measure of the relative congestion on these routes. It may be that, because of the complexity of obtaining congestion indices, we may have to rely upon average speed ratings, which may be easier
to obtain. Because the average ^eed provides an index of the ability to move through an artery, i t would be indicative of the efficiency of that artery. However, because most people associate speed with unsafe operation, one hesitates to recommend its use as a major factor in an urban rating system without considering accident experience of equal or greater importance.
The objective of an ideal urban arterial may well be the attainment of the highest uniform speed with the lowest accident e:q)erience. The final urban rating would, of course, have to include traffic volumes or else be developed for each traffic-volume group.
17
Graphical Presentation Procedures
JAMES O. GRANUM, Highway Engineer Automotive Safety Foundation
REDUCING the details of computations and results to simplified charts, graphs and maps should be a part of every sufficiency rating plan. Graphic presentation of data has two main purposes: (1) engineering analysis and (2) interpretation for general use. In engineering work, graphics are essential to get quick understanding of facts, to aid in analysis of various relationships and to observe trends. Refinement and detail beyond that required for general understanding may be necessary.
For the second purpose, good graphics properly interpreting engineering data wi l l provide quick reference material for administrators, reduce the mass of data and text in published reports, and greatly aid in gaining better public appreciation and acceptance of the facts so presented.
For both purposes, but especially the latter, the modern art of fisual aids, already carried to high levels in many fields, certainly needs to be more fully explored, understood, and developed for use of those concerned with highways.
Figures are presented showing some early and current means of depicting sufficiency-rating data. Obviously some are limited to detailed engineering use alone, and others combine that with the broader purposes. In some cases, i t is practically impossible to combine the two.
If i t is desired to obtain maximum ut i l ity not only for engineering analysis but also for administrators, legislators, user groups, and the public at large, then the samples shown s t i l l leave room for improvement. More imagination, ei^erience, and study of techniques wi l l find that need.
However, the examples shown have meri t in one way or another. No doubt there are some excellent ideas on the boards now or already published but not located for this brief review. In viewing slides and in planning graphic presentations, these points should be borne in mind: (1) Data should be attractively and interestingly presented, especially i f for the
general public fo r whose eye and mind there is great competition, but the general style should f i t the "tone" or character of the report as a whole. (2) Production cost should be a minimum consistent with achieving the objectives. (3) Abilities of draftsmen, supervisors and printers may affect the type of presentation. (4) Use of two or more colors often provides greater clarity and interest than black and white but, of course, increases cost. On the other hand, color variation (instead of scale) to show degree sharply limits detail, and poor choice of colors or bad registration may hamper the viewer. (5) Scale should be chosen carefully to avoid distortion or crowding. (6) Charts and maps should be simplified, omitting extraneous detail and depicting only one thing or at most the minimum number of necessary relationships unless accomplished wiUi progressive overlays; legends should be carefully chosen and adequate identification provided without over-doing i t . (7) However, consideration should be given to various devices to attract interest, emphasize the point and improve understanding without misinterpretation. Depending on the purpose, then, there is choice of straight-forward graphics or a range of "dressed-up" style. (8) Finally there are the questions of how much language should be used within the chart, what kind of outside caption or head is needed and whether explanatory legends describing the chart or what i t means are required. The graphics should be able to tell the story standing alone, but language in the chart may be required to show how to read i t , to provide basic information not shown in the scale or legend, or to draw attention to a salient point. Dead or live captions may be used, the former being simply a t i t le and the latter giving a message.
These factors, and others, in graphic presentation are well understood by specialists in that f ie ld . The highway engi-
INNCUS S T O N
ruuTOM
L A W A V I
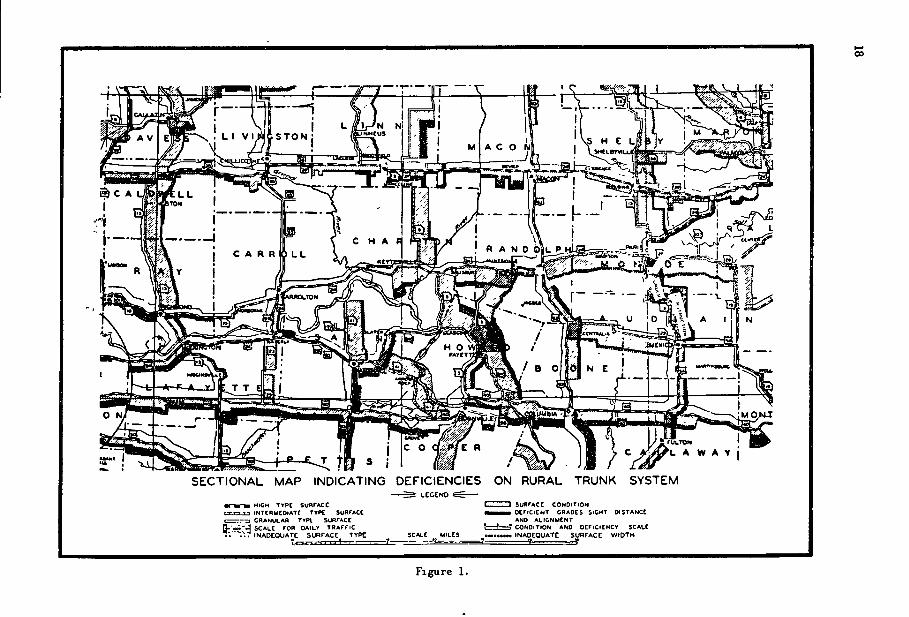
S E C T I O N A L MAP INDICATING D E F I C I E N C I E S ON R U R A L TRUNK S Y S T E M
mr-m-m H I G H T Y P E sunrACC • -r-r^ tNTCRMCDiATr T T P E S U R F A C C . = 7 . - 3 1 C B A N U L A B TYPl S U R M C E R. — - J SCALt rCK O A I L Y T R A F F I C ' J W . ; ^ I N A D E Q U A T E S U R F A C E T Y P E S C A L E M I L E S
I S U R F A C E CONDIT ION I D E F I C I E N T G R A D E S SiGHT D I S T A N C E
AND A L I G N M E N T r CONDIT ION AND D E F I C I E N C Y S C A L E . I N A D E Q U A T E S U R F A C E W I D T H
Figure 1.
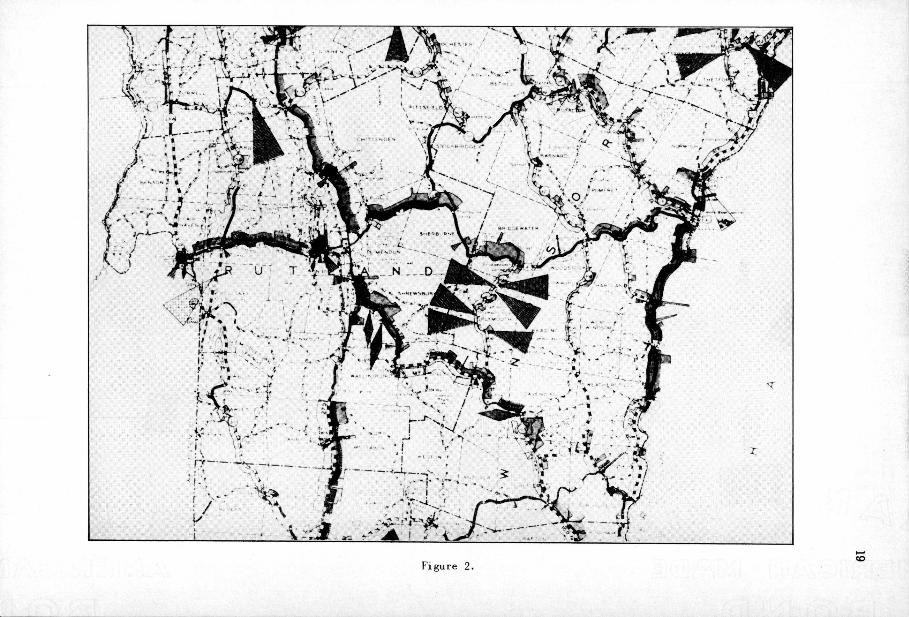
Figure 2.

20
neer understands the engineering factors that need to be portrayed. Good graphics in highway work need both types of thinking and, to use a recently coined word, good "imagineering."
The graphic procedures for sufficiency ratings should be organized to: (1) record field data in permanent visual form; (2) permit easy revision at regular intervals; (3) permit easy comparison with other charted or mapped data; (4) give a "bird's-eye" view of the magnitude of each major element as well as the over-all rating on statewide systems, routes or sections; (5) provide for charted summaries.
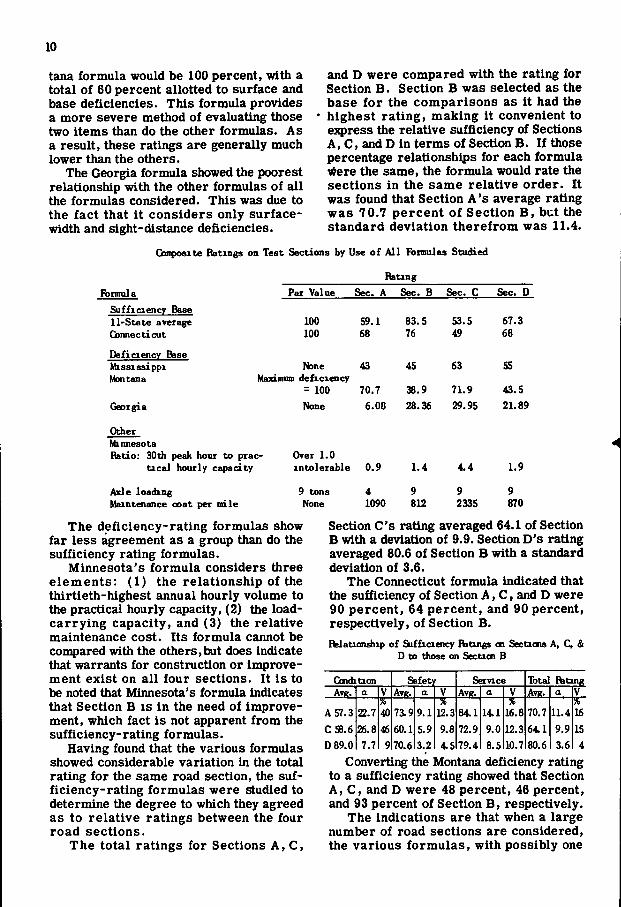
Each of the following figures shows various elements of this five part program. Figure 1: 1939 Missouri M ^ . This section of a Missouri rating map, shown in a 1939 report, is a pioneering example of graphic presentation of study results. The map meets many engineering needs. It condenses findings into understandable and useable form showing degree of deficiency, rather than sufficiency, by specific location. Note that the scale is plotted on one side of the road line used as a base, with a t raff ic volume scale on the other side. This technique magnifies the var i ations, making comparisons somewhat easier.
Two major elements of the rating plan, surface condition and combined geometries, are shown separately by scale with the object of indicating higher pr ior i ty by wider total bands. Inadequate surface width is shown by legend only.
However, for more general purposes, it is observed that the scale is small for the printed report, there is some nonessential material on the map and it lacks general attractiveness. Careful attempt to follow minor variations in road alignment is perhaps unnecessary.
In the Missouri report, this section is shown only as an example of a product. The statewide map was apparently made for office use only. No charted summaries of results were shown, although many tabular data were provided in the report which would appeal primarily to students of the subject. Figure 2: 1939 Vermont Map. This is a par t ia l section of another type of deficiency rating map included in a Vermont report, also made in 1939.- In that report.
which apparently was intended to have wider public appeal than the Missouri' product, there is folded in a complete state map twice the report page size.
Use of color gives eye appeal and clarity which is partly defeated by the variety of material shown. The base map is apparently a general map (one not prepared especially for the purpose) and includes material not essential to display of ratings.
Each color is used to depict a single element of the rating plan, with a road-based scale to define degree of variation f rom standard. No combined rating was computed or shown on the map, but this manner of presentation does give some impression of combined sufficiency or deficiency, although overlapping colors obscure each other in some cases.
The scale and manner of showing bridges may be considered out of proportion to roadway elements, but the importance of structures may justify such treatment.
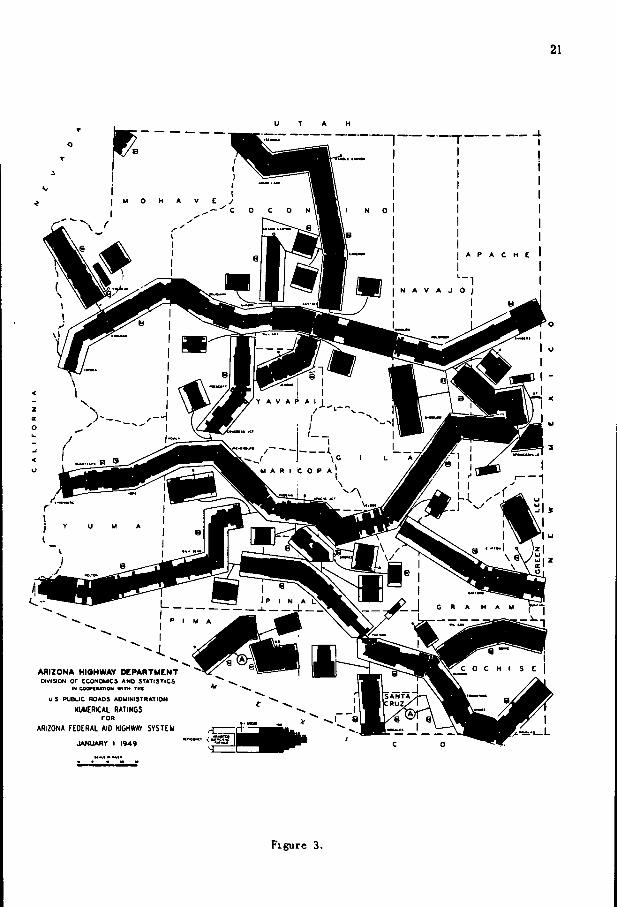
With this type of map, preparation time and production costs are relatively high and revision is more difficult. Nevertheless, i t appears as an early and significant contribution to techniques. Figure 3: 1949 Arizona Map. This statewide map is included in the 1949 report of "Numer ica l Ratings for Arizona Fede ra l -Aid Highway System." It clearly portrays the combined sufficiency ratings alone, with nearly a miniTnnin of extraneous detaU.
Road location is shown diagrammat-Ically, causing mileage scale adjustment to match actual mileage and possibly resulting in slight distortions In the length of ratings on curved sections compared to those on tangents. The rating scale is large enough to show variations at a glance but causes some difficulties at road junctions. To overcome this, offsets are used, and these may appear confusing. The rating is shown like a traffic-flow band, with the maximum rating of 100 indicated by uniform width of a line 50 points wide on each side of the road center line. Thus numerical values below 100 are somewhat difficult to determine.
The elements making up the combined rating are now shown, and the route numbers and place names are rather small in the scale of the printed map.
Over al l , however, this method Is eco-
21
U T A H
ARIZONA HIOHWAV DEPARTMENT DIVISION OF ECONOMICS AND S T A T I S T I C S
IN COa*U*TlOH WITH TMC
U S P U B U C ROADS ADMINISTRATION
NUMERICAL RATINGS F O R
ARIZONA FEDERAL AID HIOHWAV SYSTEM
JAhAiARY I 1949
Figure 3.
22
S U F F I C I E N C Y STATUS " I N S E T A R E A F E D E R A L AID PRIMARY S Y S T E M
STATE OF OREGON 1 9 5 0
L E G E N D
^ OREGON Ff t PftlMARY SYSTEH SmC PRIMARY HIGHWAY NUMBER
' 1 * 1 ^ 1 4-^4-SUBSECTION Nuweciis
J - -ftr"' r ~ C O N T I » O L S E C T I O N N U I
TRAFFIC ADJUSTED RATING I T s - i 4 0 0 v P D ) I I 80 to lOOX
TO 10 79X mm 60 to 69%
ft9XM>nui CONTROL SECTION NUKBtRS \ ^ NW ROI««
v% A ''T -I % 0 T C
SAL£W
C O R V A U . I S
Figure 4.
2)eficiencie S on ^ l a l e J4i ^liwaif S a i l
WAYNE
DmCHNCT U « N D
On o n J a a a o. Figure 5. CO
24
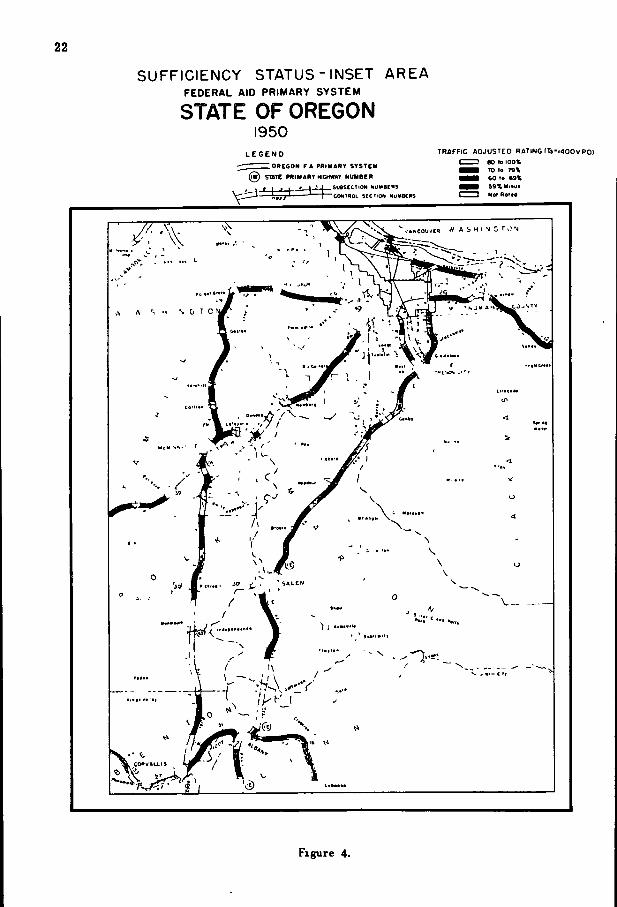
nomical , easy to duplicate, relatively simple to grasp, and can be readily revised. Its value is indicated in its adoption, with some modifications, by several states. Figure 4: Oregon Map. Another technique in portraying sufficiency ratings is shown in this section of a large state map of the Oregon highway system. The map was printed separately, folded and inserted in an envelope in the detailed rating report of 1950.
Various colors identify road sections according to a small number of rating ranges, with all miles having a combined rating below 60 shown in red. The obvious advantage of this method Is quick identification and simplicity, although one must correctly remember the legend while viewing i t .
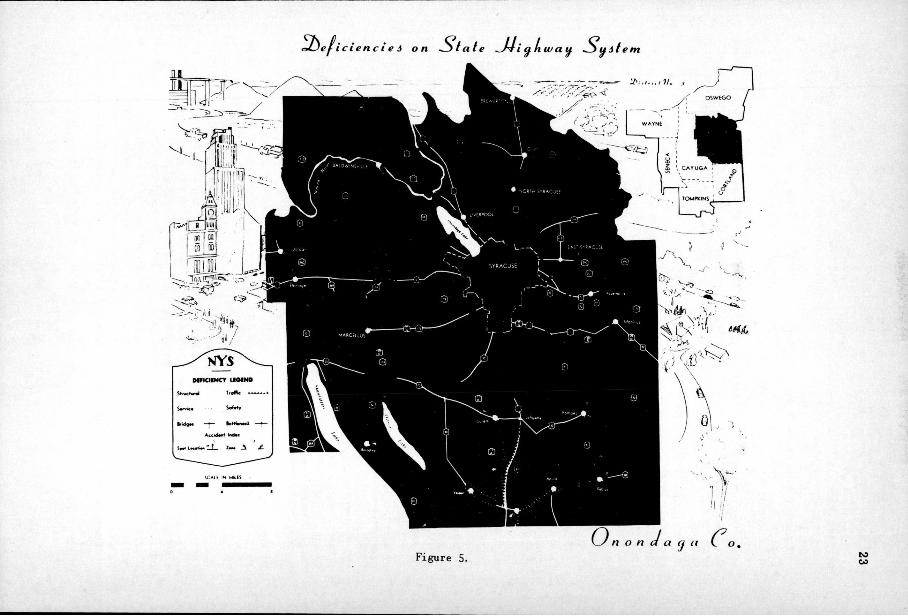
Detail of magnitude is limited, and again the rating of elements comprising the combined rating is not shown. In this scale, however, i t would be easy to match other mapped data, such as proposed improvement programs, to the rating results. Figure 5: Connecticut Diagram. Curtis Hooper reported, in the Highway Research Board Proceedings of 1948, an excellent graphical procedure used in Connecticut. Although it is not a graphic picture of sufficiency ratings as the term is now being used, i t is included here to show a diagrammatic picture of many of the elements composing such ratings.
Hooper states: " I t is recognized that the straight line diagrams (previously discussed) were primarily designed for use in engineering offices. Only infrequently was the device used to portray details in a report which might reach the public. . ." In (planning reports) i t was...our attempt to present data in a form understandable to interested laymen.... In pursuit of this goal many changes were made (in previous engineering diagrams).... I t is believed that this...graphical means...did much to crystallize the modernization problem...."
Hooper also points out the need for portraying the many interrelationships which exist and concludes that the straight line diagram, modified as shown here, coupled wi th a recognizable map, serves that purpose.
This amount of graphical detail is super io r for engineering analysis, but i t is obvious that there are s t i l l obstacles to
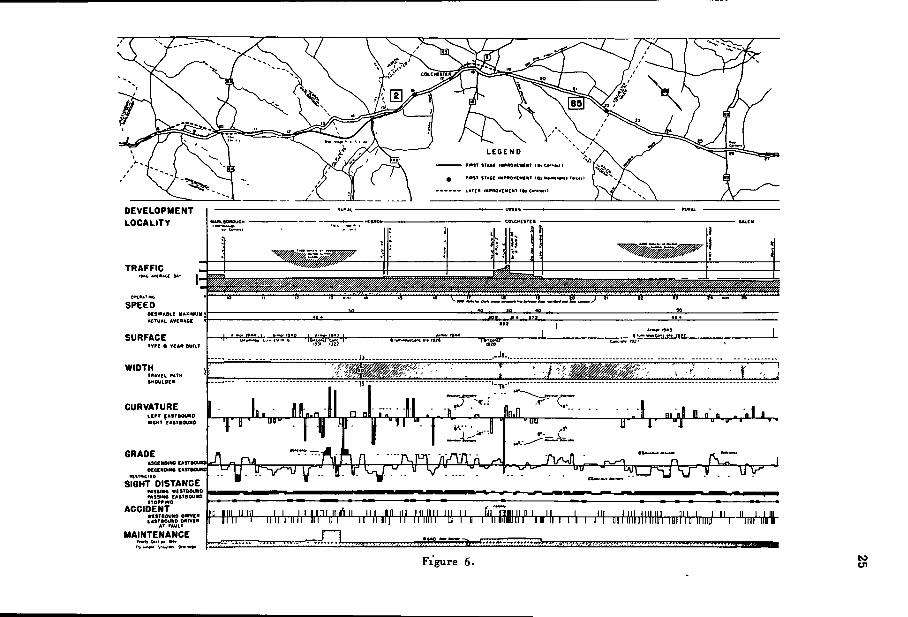
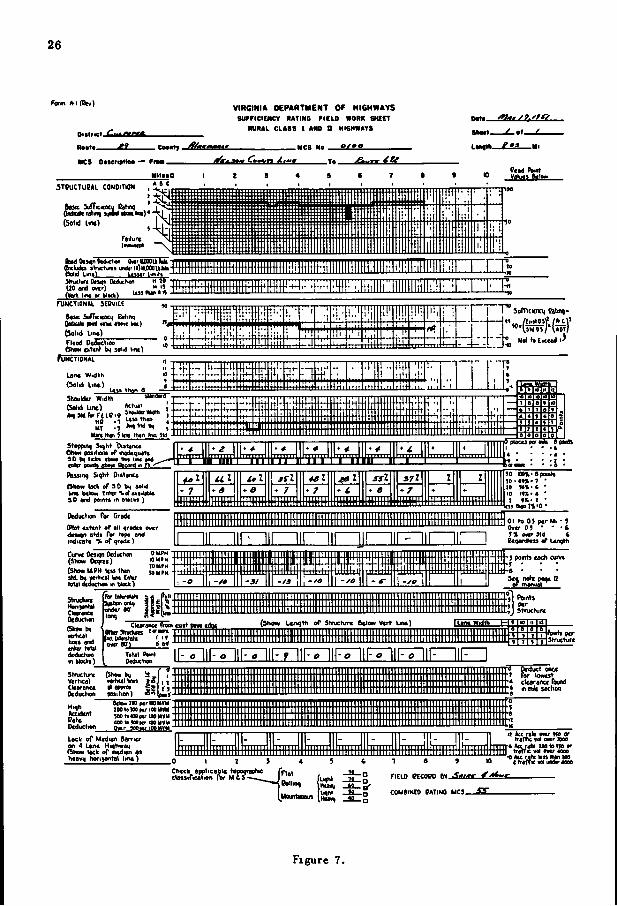
publication and to lay understanding which can be partially overcome in portraying results of analysis through sufficiency rating procedures. Figure 6: Virginia Field Work Sheet. This sufficiency rating field work sheet, used by the Virginia State Department of Highways in a 1951 study, is designed tu show graphically as many of the factors considered in the ru r a l sufficiency rating study as possible. I t is used exclusively for rating analysis and is the f i r s t step in the graphic presentation.
The sheet is another form of straight-l ine diagram which direct ly converts physical data to the point values of the rating plan. Thus i t differs from the usual diagram which records existing dimensions, etc., whose point values may be determined and recorded separately.
The Virginia work sheet is used mainly in engineering analysis but does provide a relatively simple visual picture of variations in the several features contributing to the final rating. It is therefore useful in general study of particular road sections. Some revision of data can be done on the original sheet, but i t does not fully meet this need, nor does it permit easy comparison with existing diagrammatic data. Figure 7: Virginia Mileage Rating Chart. A technique which combines detailed engineering and more general uses is shown in this chart of a section of US 29 in V i r ginia. The magnitude of the sufficiency ratings for each of the three major elements and their weighted combination is shown on a mile-by-mile basis in a straight-line diagram.
The profiles are easily interrelated and comparisons with tolerable standards and proposed programs are quickly noted. This chart is relatively easy to prepare, once data are available and the base is reproduced in quantity. Note the " l i v e " caption which makes a statement. Explanatory text and legend are shown in the printed report.
The method is perhaps too cumbersome for display of an entire system in a printed report. It fails to identify quickly the commonly recognized map location or to give quick relationships of routes on a statewide basis. Figure 8: Virginia Rating Map. To over-
L E G E N D
DEVELOPMENT
L O C A L I T Y
T R A F F I C
S P E E D
SURFACE TYPE S VCA. euiLT
WIDTH T R A V E L * A T H SMOULDER
CURVATURE
GRADE
« A * L M « O U C H •
SiJI
n B - T = — B -
. ,WI, I »l« I > ' ! , ,
L L _ J L
OCASTI OECCRWttO EASTDOUN^
•tSTO ItD
SIGHT DISTANCE MSSIMC WtSTBOURO MSSINO CASTGOUMO STOMINO
ACCIDENT VE9TB0UM0 DRIVER EASTSOUMO DRIVER
AT FAULT
MAINTENANCE
" I j . n i j j l B f i „ n „ „ . . , " n t D , ,
iili i nil 111 H I II n II
„ J ]
,11 ,I.IUI1I.I III II, i"iii'mii:ii" ' s i ' l i I I ^ I I i n iDii rii II. II m i r i i m Nil
Figure 6. b 9 CJI
26
Diwrict Cutftn* i t o . t t £i C M M , _diaseaais. a C S O t M n t t t o a — f m
VIRGINIA DEPARTMENT OF HIGHWAYS s u r r i e t C M C v ut ing r i C L D « O R i i sheet
m j u L C L A S S I A l i o n H i sMvm
3T8UCTue*l CONDITION
^olKl l in t )
bieluiks sIrvcKns iada> IO)lUIQOUU>-t
ftgt l « > M - t ) l«Mll>l»««-
MCS He
V.lu.1 » . l »
•IWHIIIiMtflillllllllMIlia u n a rUNCTIONtl 3CDMICE
t u i c 5off««nC4 BrtiiKi ( M u k ft* Nha l U n kot) (Solid flood Ocduclioo Choa o l<M solid Imt^
';i j t
4—1 • 1 -10
• Trtr —i^lu iiU
ttH iiil -rrrr i' . ti •«
5urricicnci| Qatinq>
Not lotuttd 1-
(Solid l i n t ) i n f t I I . 11 I Jhouldir Widlb
Csdd u«) ;5isL^„
m w l t i ^ l n i nun ««i <M
Sloninq Jiqht 0i3tinc< e i i M positions rf inodti)iMt< S O ON tckt atMt Hm liM md color por t !J tsa .aS2:4lLr>^
u a c 3 [ i i i [ i
a a a c i a • • [ ] • • u a n a n
plocASPcraik Opomh
hssi09 Sii)M OistooM
exm lack oT SO bs s<'id k m below Cntir %<lA«ail«bk S D and points in olocu )
ssl 37t I z nil pO WX-Sponls ho-<o».7 •
• 7 - a *s ' 7 • 7 " i * a • 7 * to • 110 lOX. 4 • lltr J I » » • J •
Dldiiction ror Grade
(Plot u t t n t of alt grades over dowon olds Par tepo and mdicato % oT roda )
Cirvc Design Deduction (Stiai. Oeipia) (S tm MPH less t t i n sM. f a r t u l hoe Ciikr total deduction in block)
I I I i i i i i i i i i i i i i i i i i i i i i i i i i i i i i i i i in i i i i i i i i i i i i i i i i in i i i i i i i i i i i i i i iHi iui i i i i i i i i i i i i i i i i i i i i i i i i i i i i i i i i i i i i i i i i i i i i i i i i i i i i i i i i i i i i i i i i i i i i i i i i i i i i i i i i i i i i i i i i i i i i i i i i i i i i i imi i i i i i i i i i t i i i i i i 01 toOJ perM, - >
Over 01 • • - i ) % ovar»d t Beqardkss <t UnfHi
points cacti o w e
Seji n ^ SoHO
Strudura Honionlal
DcdKS!l!i (Shoabu •ntical Inet and enter total deduchoo nbkcta)
ions Ckarance frooi gis t
JIftBSlKtalS BuWnta le r <«
» [ ) Oo*
I I I I I I U I I I I I I I I I I I I I H I I I I I I I I I I I I H I I I i l N I I I I I I I I U I I i l l l l l l l l l l l l U I I I I I I I I I I I I I I I I I I I I I I I I I I I I I I I I I I • I I I i i i i i i i i i i i i i i i i i i i i i i i i i i i H u i i i i i m i i i i i i i i i i i i i i i i i u i i i i i i i i i i i i i i i i i i i i t i i i i i i i i i i i n i i i i i i i i i i i i i i i i i i i i i i i i i i i i i i i i i i i i i i n i i i i i i i i i i i i i i i i i i f i i i i i i i i i i i i i i i i i i i i i i i i i i i i i i i i i i i i i i i i i i i i i i i i !5|p».ts
•t per .JJ Structu (SHOW Lcrvith o f Structuf« »clo». Vert Lint) I lane Width
I M S per JtructuK
T.tal OanI Oeduchan E - o \-o
i f " • structure ^lio> bi| Virticd) x r t iu l knn Clearance * mm Deduction oos i to ) „ . geio.no per n u n i
lOOtoWptrlOOIiW • f " " " * MOI.«IOnrlOO||«H' i^dte aao t . looiv aouvn Deduction ih .r seo«, l o o w •
l l l l l l l l l l l l l l l l l l l l l l i l l l l l l l l l l l l l l l l l l l l l l l l l l l l l l l l l l l l l l l l l l l l l l l l l l l l l l l l l l l l l l l l l l l l l l l l l l l l l l l l l l l l l l l l l l l l l l l l l l l l l l l l l l l i l l l l l l l l l i l l i l l l i l l l l l l l l l l l l l l l l l l i l l l l l l l l l i l l l l l l l l l l l l l l l l l lHl l l l l l i l l l l l l Mil I •I l l l l l l l l l l l IIIIIIIIIIIIIIIIIIIII I Ill I Il l l l l l l l l l l l l l l l l l l l l i I l l l l l l l l l l l l l l i I l l l l l l l l l l l l l i l l l i I l l l l l l l l l 11 l i l l l l l l i i l l l i l l l l i l l l l • I l l l l l l I l l i l l l l l l l l l l l l l l l l l l l l l l l l l l l l l l l l l l l l l l l l i l l l l l l l l l l l l l l l l l l l l l l l i l l i l l l l l l l l l l l l l l l l lMll l l l l l l l l l l l l l l l l l l l l l l l l l l l l l l l l l l l l l l l l l l l l l l l l l l l l l l i l i l l l l l l l l l l l l l l l l l l l l l l l l l i l l l l l i l l in IIMIIIIIIIII i l i l l l l l l l l l l l i l l l l l l l l l i i l l l l i l i l l l Hll l l l l l i l l l l l l l l l l l l l l l l l l l l l l l l l l l l l l l l l l l l l l l l l l l l l l l l l l l l l l l l l l l l l l l l l l l i i l l l l l l l l l l IIIIIIIIIIIIIIIIHIIIll l l l l
d Deduct once > For loMst '« cledraoce rouid '< >i nW seclioo
i K k oT Median Darner on d Lane Hiqmaii ( how lack eC median as heewi hornontal lioa)
U Act r*W o w no or trafftc tat omr noo
Check applicabia topearapisc classiriulam Par M C ? — _ iFlat
LiqUI ,"ea<i| Uqht
1 S 9 10
FICLD KCOro « 1 XtwMT ^ AC*^r
COMeiNCD MTINO MC] £ E
Figure 7.
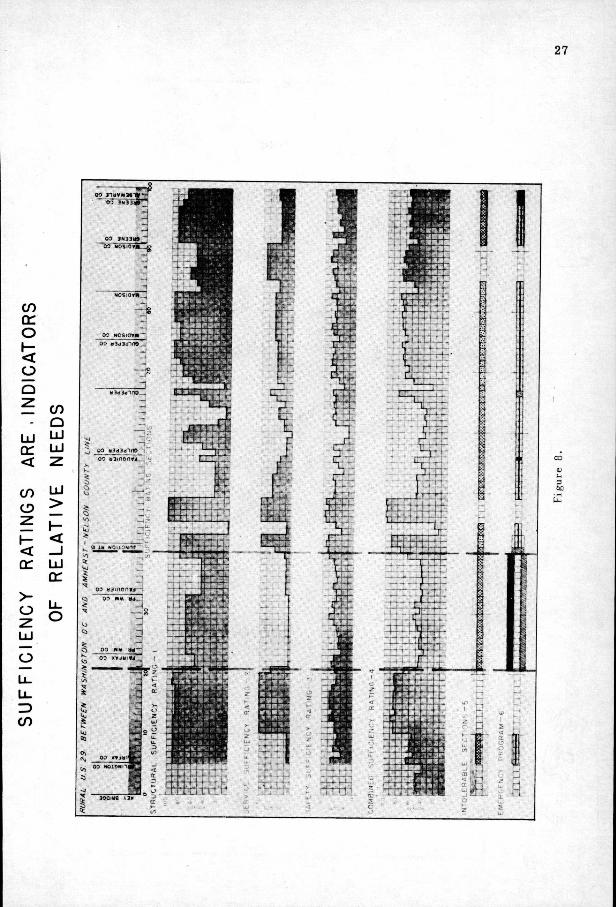
27
cn a: o
O Q
UJ q : <
tn o
< cr
>-o
ZD
cn Q UJ UJ
UJ > < _ l UJ or
00 3N33l» 00 «OSiOflllL,„E
00 Kos.avM
30 a 3 d 3 d l f l 3 02 « 3 i n o n «
00 KSiDwn
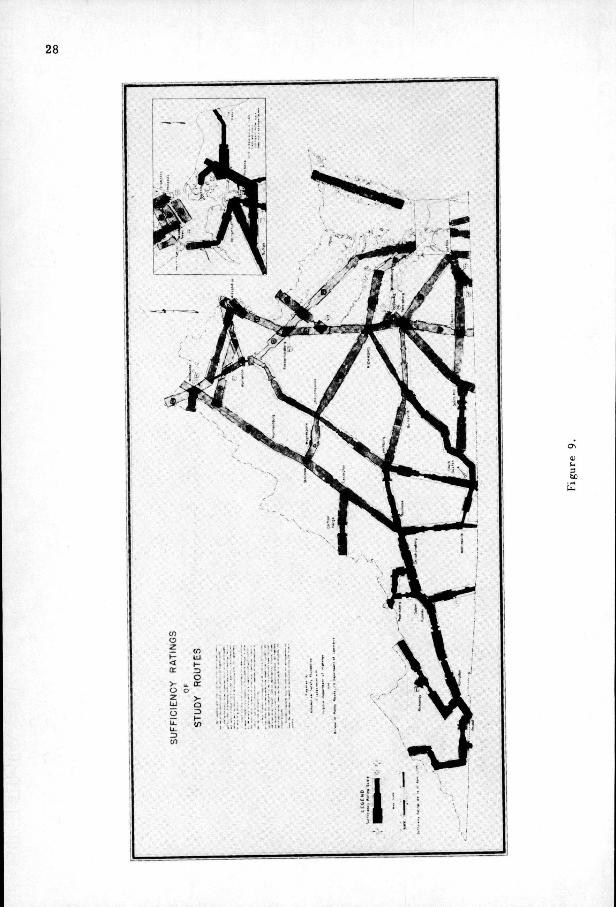
28
1
u
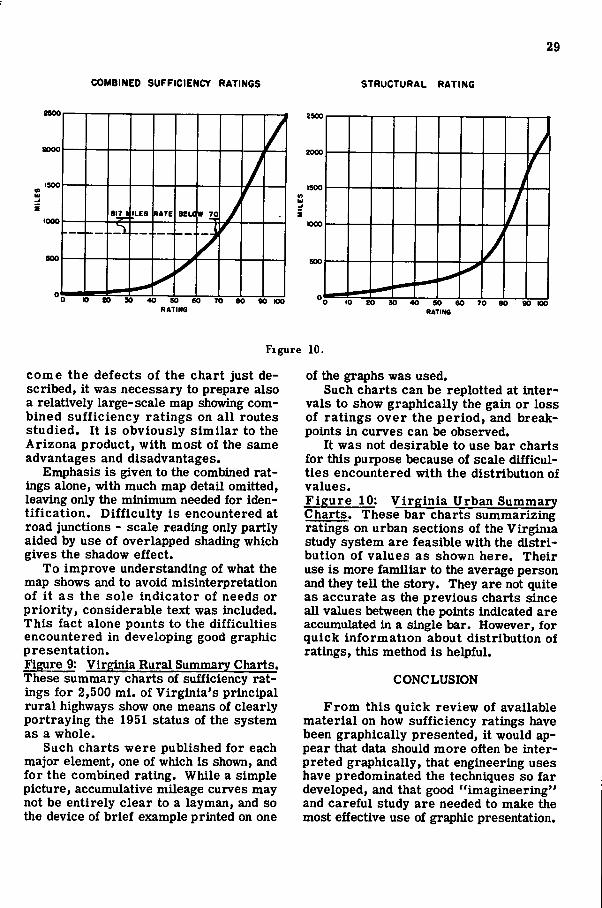
29
COMBINED SUFFICIENCY RATINGS STRUCTURAL RATING
2900
sooo
817 1 I LE9 RATE ecu • TO
600
2S00
SOCIO
0
Figure 10.
come the defects of the chart just described, it was necessary to prepare also a relatively large-scale map showing combined sufficiency ratings on all routes studied. It is obviously similar to the Arizona product, with most of the same advantages and disadvantages.
Emphasis is given to the combined ratings alone, with much map detail omitted, leaving only the minimum needed for identification. Difficulty is encountered at road junctions - scale reading only partly aided by use of overlapped shading which gives the shadow effect.
To improve understanding of what the map shows and to avoid misinterpretation of it as the sole indicator of needs or priority, considerable text was included. This fact alone points to the difficulties encountered in developing good graphic presentation. Figure 9: Virginia Rural Summary Charts. These summary charts of sufficiency ratings for 2,500 mi. of Virginia's principal rural highways show one means of clearly portraying the 1951 status of the system as a whole.
Such charts were published for each major element, one of which is shown, and for the combined rating. While a simple picture, accumulative mileage curves may not be entirely clear to a layman, and so the device of brief example printed on one
of the graphs was used. Such charts can be replotted at inter
vals to show graphically the gain or loss of ratings over the period, and breakpoints in curves can be observed.
It was not desirable to use bar charts for this purpose because of scale difficulties encountered with the distribution of values. Figure 10; Virginia Urban Summary Charts. These bar charts summarizing ratings on urban sections of the Virginia study system are feasible with the distribution of values as shown here. Their use is more familiar to the average person and they tell the story. They are not quite as accurate as the previous charts since all values between the points indicated are accumulated in a single bar. However, for quick information about distribution of ratings, this method is helpful.
CONCLUSION
From this quick review of available material on how sufficiency ratings have been graphically presented, it would appear that data should more often be interpreted graphically, that engineering uses have predominated the techniques so far developed, and that good "imagineering" and careful study are needed to make the most effective use of graphic presentation.
30
Elemental versus Composite Ratings
M. EARL CAMPBELL, Staff Engineer Highway Research Board
IN THE MATTER of determining a final percentage rating for an appraisal section, a very real difficulty is involved in deriving a figure that portrays the true index of character of the combined varied elements. It is equally difficult to derive a figure that portrays the true index of character of each element (which contains variable components) before combination into a composite index.
To illustrate by analogy, consider the problem of deriving a weather-index figure to portray the degree of temperature of a locality. For example, the average annual temperature may be 55 F. but this one index figure gives no indication that the average monthly temperatures may vary from 35 F. in winter to 75 F. in summer, nor do the monthly average figures reveal that the maximum and minimum daily temperatures may range respectively from 10 F. in the winter to 95 F. in the summer.
A textbook on statistics makes this statement: " I t is not the average that is significant, it is the differences." This premise leads to two conclusions:
First, each appraisal section should be so chosen that each of structural geometric, and traffic characteristics remain nearly constant throughout the length of the project. Second, some means should be devised for showing the deviation from the mean,or composite rating.
The so-called control sections will provide a valuable device for selection of appraisal sections. An examination of each control section should be made to see that it meets the basic requirement of homogeneity.
An instantaneous appraisal point by point is obviously impracticable. At the other extreme, it is of questionable merit to set up for rating, sections, whose length exceeds the normal length of a normal construction project. In a recent application of the sufficiency rating procedures the highway routes were generally divided into mile-long sections. Some compromise
is necessary in the selection of appraisal sections, but the basic requirement of homogeneity should not be departed from to the extreme. A unit for appraisal might well be limited to a length that would be covered by one design standard.
Admittedly, then, a most difficult problem is that of combining the ratings of the several elements into a composite percentage rating. The ratings for the elements of structure, service and safety have no common denominator, and the relative weight of each of these elements is a matter of judgment and not subject to rational analysis at this date.
In order to obviate this difficulty there may be prepared a four-column listing to summarize the ratings determined for the appraisal sections. Under this procedure the rating may be shown for each of the three elements of each section as well as the composite rating.
Whereas a composite rating of 70 percent (60 percent in some states) is commonly accepted as the minimum passing rating for a sectioir, it is regarded good practice to consider each element for a construction warrant, for it is possible to obtain a warrant for construction in the individual element because of its low rating, yet find that the composite rating is higher than 70 percent. Therefore, the analysis for warrant may be determined from the rating of the individual elements, and the priority for programming is determined both on basis of composite rating and number of construction warrants for each section determined on basis of element warrants.
A possible solution to the problem of retaining the index of each element in the composite rating is suggested as follows:
An index would be designed which would show each component element as an Identity. For example, a three-digit index could be devised which would enable the retention of identity of each of the three elements with their sufficiency rating to
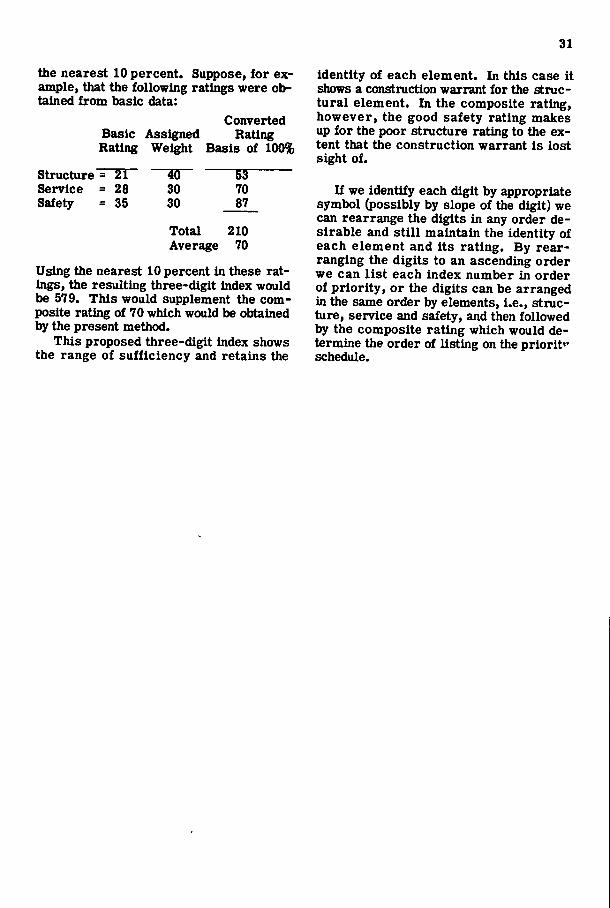
31
the nearest 10 percent. Suppose, for example, that the following ratings were obtained from basic data:
Converted Basic Assigned Rating Rating Weight Basis of 100%
Structure = 2 1 Service =28 Safety = 35
30 30
"53" 70 87
Total 210 Average 70
Using the nearest 10 percent in these ratings, the resulting three-digit index would be 579. This would supplement the composite rating of 70 which would be obtained by the present method.
This proposed three-digit index shows the range of sufficiency and retains the
identity of each element. In this case it shows a construction warrant for the structural element. In the composite rating, however, the good safety rating makes up for the poor structure rating to the extent that the construction warrant is lost sight of.
If we identify each digit by appropriate symbol (possibly by slope of the digit) we can rearrange the digits in any order desirable and still maintain the identity of each element and its rating. By rearranging the digits to an ascending order we can list each index number in order of priority, or the digits can be arranged in the same order by elements, i.e., structure, service and safety, and then followed by the composite rating which would determine the order of listing on the priority* schedule.
32
Use of Sufficiency Ratings in Long-Range Planning
ROY E. JORGENSEN, Engineermg Counsel National Highway Users Conference
THE DEVELOPMENT of a long-range program using sufficiency ratings is a relatively simple process, assuming that cost estimates for construction projects are available as they must be for any long range programming.
The first step is the establishment of a sufficiency rating cut-off point, the point below which road sections are inadequate for proper service to motor transportation. For example, if for a particular road system it is determined that ratings of 65 on the sufficiency rating scale represent the dividing point between satisfactory and unsatisfactory road sections, this is the cut-off point, 65. It represents the minimum acceptable level for any part of the road system. On completion of the program, the entire road system will have ratings higher than the cut-off point. Establishing the cut-off point is similar in the sufficiency rating approach to the establishment of tolerable standards in the long range planning that has been done in a good many states.
With the cut-off point established, all road sections having sufficiency ratings below it are placed in the category of urgent needs. Estimates of cost for projects to provide the necessary improvements are accumulated and represent the total urgent needs. This is the basic part of the long range program - the present deficiency m the road system.
If the deficiencies were to be taken care of on the instant, the urgent needs total would represent all of the program. However, in scheduling the correction of deficiencies over a period of ten years, as is now generally recommended, it must be recognized that additional deficiencies on other parts of the system will develop during the program period. Further, there will be structural deteriorations and other requirements for construction work presently not foreseeable. Based on past ex
perience and anticipated additional traffic volumes, it is possible to estimate what allowance must be made for these items and to add it to the present urgent needs and come up with a total cost estimate.
This represents the construction part of the long range program. To it must be added requirements for maintenance and administration to obtain the total cost for preserving and developing the highway system.
ALTERNATIVE PROGRAMS
With the sufficiency-rating procedure it is possible, very simply, to set up alternate programs based on more than one level of tolerability. And the results can be readily visualized both as they affect specific road sections as well as the total highway system. This is illustrated in Figures 1 and 2.
Figure 1 is a chart which shows the sufficiency ratings mile by mile along a 23-mi. section of US 29 in Virginia^. Two cut-off points have been superimposed on this chart to indicate the results of alternative levels of tolerability. Additional levels could, of course, be similarly reflected. In each case the effect could be readily visualized in relation to specific sections of the highway. In this case, for example. Alternate 2 would place the section beginning at MUe 6 in the category of urgent needs whereas Alternate 1 would not. And that would be the only difference between the two alternates as applied to this section of highway.
Figure 2 is a chart showing an entire road system 2 arrayed according to sufficiency rating of individual road sections. The result of applying two cut-off points
* From Automotive Safety Foundation's Interim Engineering Report, "Highway Needs In tlie Emergency."
^ Based on Louisiana Sufficiency Rating Report for Federal-Aid Primary System - 1950.
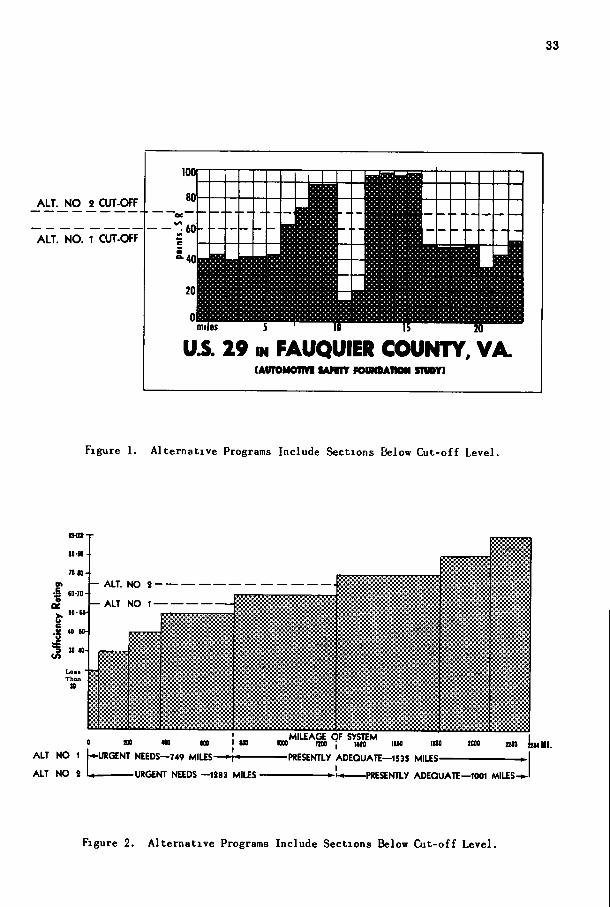
33
ALT. N O S CUT-OFF
ALT. NO. 1 CUT-OFF
U5. 29 m FAUQUIER COUNTY, VA. (AUrOMOIIVI lARir FOUNBAIMN SniDY)
Figure 1. Alternative Programs Include Sections Below Cut-off Level.
1WI»T 80-n-
n a - t M-70-
.«! 40 9H
4 M«.
Lass ' Than
n
ALT. NO
ALT NO
2
1 H I
i'l'i'""'"'"'^"'**''"
^ ^ ^ ^ ^ ^ ^ ^
ALT NO 1
ALT NO I
no 400 000 I soo
i-URGENT NEEDS—749 MILES • !«
^ M I L E A G E QF SYSTEM 1000 im I MOO ino
m
BOO ia*m -PRESENTLY ADEQUATE—1535 MILES-
- URGENT NEEDS —1S83 MILES- -PRESENUY ADEQUATE—1001 MILES-^I
Figure 2. Alternative Programs Include Sections Below Cut-off Level.

34
to obtain alternative programs is indicated, using for illustrative purposes, the same two levels shown on Figure 1. Under Al ternate 1, 749 mi . of the system, or 33 percent, are classified as urgent needs. Under Alternate 2, there are 1,283 miles, or 56 percent.
The magnitude of the urgent needs mileage and the cost to meet these needs are not directly proportional to the magnitude of the alternative long range programs because of the other elements that go into the program. They do indicate the current deficiencies on alternative levels and provide the basis from which the alternate long range programs can be developed.
CONTINUING REVIEW OF PROGRAM
Use of sufficiency ratings by state highway engineers carries with it the maintaining of the ratings on a current basis. There is thus provided the means for continuing review of the long range program when it is formulated on the sufficiency ratings.
The trend in the composite sufficiency rating for the entire system will indicate the degree to which the adequacy of the system is bemg raised. The mileage of the system each year below critical sufficiency-rating values will serve to check the effectiveness of the long range program. This is illustrated by the data presented in the annual reports of the Arizona Highway Department. In the 1951 report for the state's federal-aid primary system it showed:
As of Mileage at or below Jan. 1 50 points 60 points 1947 282 650 1948 264 564 1949 195 601 1950 161 538 1951 211 479
Illustrative of the use of such information it will be assumed that on January 1, 1947 a 10-year program was established based on a cut-off point of 60 points^, in 10 years, existing urgent needs below 60 (650 mi.)would be taken care of and addi-
^ This is used for Illustrative purposes only. Review of road secUons at various sufficiency levels in relation to proper service of motor transportation should be basis of deciding appropriate cut-off point on any system.
tional miles falling below 60, because of structural and traffic changes during the program period, would likewise be improved as a part of the program. The net mileage in service below 60 points as of January 1 each year, after taking account of new construction, increased traffic, etc., should be reduced at a fairly regular rate to 0 as of January 1, 1957. This is illustrated in Figure 3, which is self-e:q)lana-tory.
53 I M I
Figure 3. Measuring Program Progress. The annual review associated with the
sufficiency rating procedure not only provides a review of progress but encourages reevaluation of the program as required to reflect changes in the price level. The adequacy of existing financing is-thereby subject to continuous review, also.
PUBLIC UNDERSTANDING
A long range program established on the basis of the sufficiency ratings and kept up to date from year to year will encourage public understanding of and confidence in the programming process. In many parts of the country today highway requirements are not being properly met because the programming procedures are not clearly defmed and readily understood.
Highway engineers are quite aware of the urgency of the needs on the main highways. So, also, are those highway users who are well informed and conscious of the effect of highway deficiencies on motor transportation. But all too frequently legislative provisions for highway finance do not give sufficient emphasis to the main highways. Obviously there is a need for a programming process applied impartially
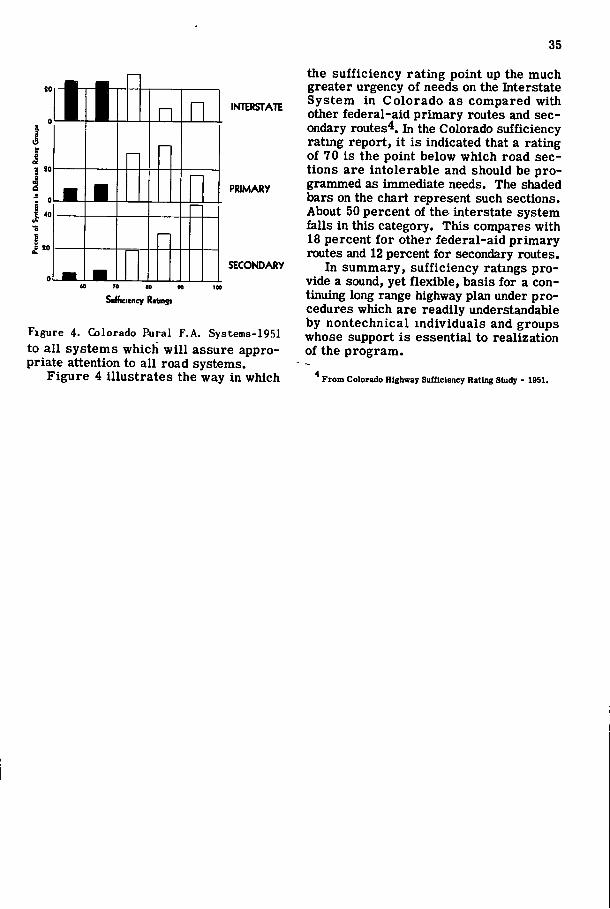
35
1
1 J n n 1 r—1
INTERSTATE
PRIMARY
SECONDARY
Sufficiency Rabnst
Figure 4. Colorado Pural F.A. Systems-1951 to all systems which will assure appropriate attention to all road systems.
Figure 4 illustrates the way in which
the sufficiency rating point up the much greater urgency of needs on the Interstate System in Colorado as compared with other federal-aid primary routes and secondary routes^. In the Colorado sufficiency rating report, it is indicated that a rating of 70 is the point below which road sections are intolerable and should be programmed as immediate needs. The shaded bars on the chart represent such sections. About 50 percent of the interstate system falls in this category. This compares with 18 percent for other federal-aid primary routes and 12 percent for secondary routes.
In summary, sufficiency ratmgs provide a sound, yet flexible, basis for a continuing long range highway plan under procedures which are readily understandable by nontechnical individuals and groups whose support is essential to realization of the program.
* From Colorado Highway Sufficiency Rating Study - 1951,
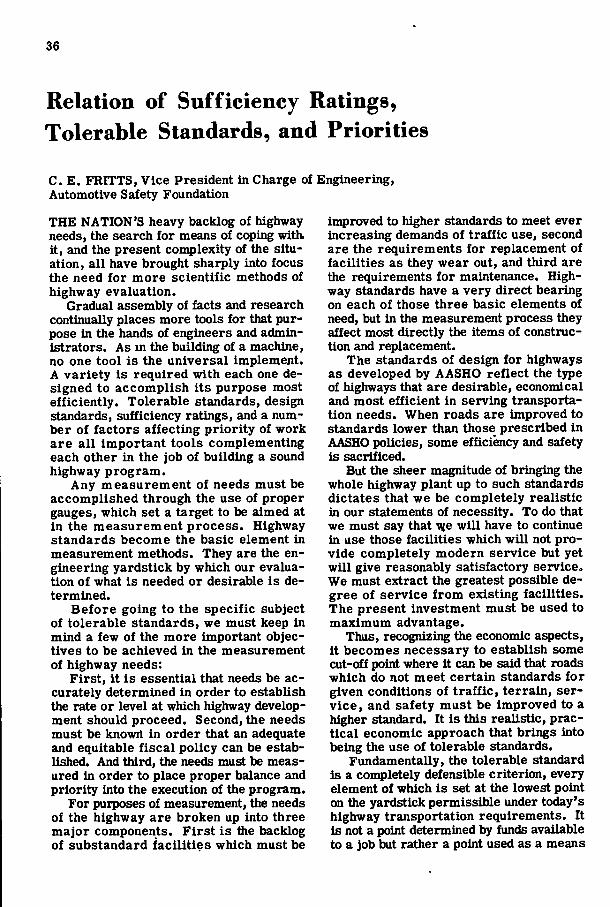
36
Relation of Sufficiency Ratings, Tolerable Standards, and Priorities
C. E. FRITTS, Vice President in Charge of Engineering, Automotive Saiety Foundation
THE NATION'S heavy backlog of highway needs, the search for means of coping with, it, and the present complexity of the situation, all have brought sharply into focus the need for more scientific methods of highway evaluation.
Gradual assembly of facts and research continually places more tools for that purpose in the hands of engineers and administrators. As m the building of a machine, no one tool is the universal implement. A variety is required with each one designed to accomplish its purpose most efficiently. Tolerable standards, design standards, sufficiency ratings, and a number of factors affecting priority of work are all Important tools complementing each other in the job of building a sound highway program.
Any measurement of needs must be accomplished through the use of proper gauges, which set a target to be aimed at in the measurement process. Highway standards become the basic element in measurement methods. They are the engineering yardstick by which our evaluation of what is needed or desirable is determined.
Before going to the specific subject of tolerable standards, we must keep in mind a few of the more important objectives to be achieved in the measurement of highway needs:
First, it is essential that needs be accurately determined in order to establish the rate or level at which highway development should proceed. Second, the needs must be knowil in order that an adequate and equitable fiscal policy can be established. And third, the needs must be measured In order to place proper balance and priority into the execution of the program.
For purposes of measurement, the needs of the highway are broken up into three major components. First is ttie backlog of substandard facilities which must be
improved to higher standards to meet ever increasing demands of traffic use, second are the requirements for replacement of facilities as they wear out, and third are the requirements for maintenance. Highway standards have a very direct bearing on each of those three basic elements of need, but in the measurement process they affect most directly the items of construction and replacement.
The standards of design for highways as developed by AASHO reflect the type of highways that are desirable, economical and most efficient in serving transportation needs. When roads are improved to standards lower than those prescribed in AASHO policies, some efficiency and safety is sacrificed.
But the sheer magnitude of bringing the whole highway plant up to such standards dictates that we be completely realistic in our statements of necessity. To do that we must say that \((e will have to continue in use those facilities which will not provide completely modern service but yet will give reasonably satisfactory service. We must extract the greatest possible degree of service from existing facilities. The present investment must be used to maximum advantage.
Thus, recognizing the economic aspects, it becomes necessary to establish some cut-off point where it can be said that roads which do not meet certain standards for given conditions of traffic, terrain, service, and safety must be improved to a higher standard. It is this realistic, practical economic approach that brings into being the use of tolerable standards.
Fundamentally, the tolerable standard is a completely defensible criterion, every element of which is set at the lowest point on the yardstick permissible under today's highway transportation requirements. It is not a point determined by funds available to a job but rather a point used as a means
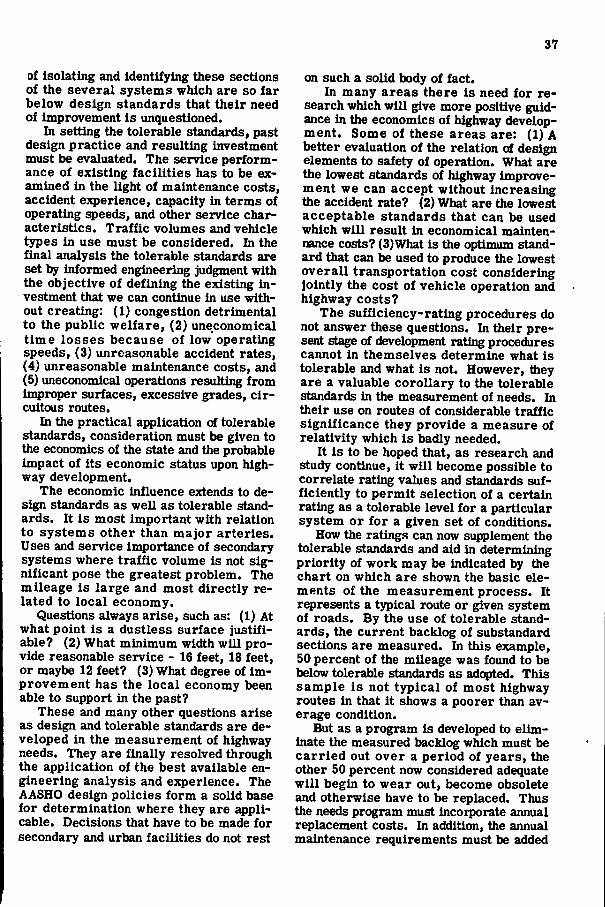
37
of isolating and identifying these sections of the several systems which are so far below design standards that their need of improvement is unquestioned.
In setting the tolerable standards, past design practice and resulting investment must be evaluated. The service performance of existing facilities has to be examined in the light of maintenance costs, accident experience, capacity in terms of operating ^eeds, and other service characteristics. Traffic volumes and vehicle types in use must be considered. In the final analysis the tolerable standards are set by informed engineering judgment with the objective of defining the existing investment that we can continue in use without creating: (1) congestion detrimental to the public welfare, (2) uneconomical time losses because of low operating speeds, (3) unreasonable accident rates, (4) unreasonable maintenance costs, and (5) uneconomical operations resulting from improper surfaces, excessive grades, circuitous routes.
In the practical application of tolerable standards, consideration must be given to the economics of the state and the probable impact of its economic status upon highway development.
The economic influence extends to design standards as well as tolerable standards. It is most important with relation to systems other than major arteries. Uses and service importance of secondary systems where traffic volume is not significant pose the greatest problem. The mileage is large and most directly related to local economy.
Questions always arise, such as: (1) At what point is a dustless surface justifiable? (2) What minimum width will provide reasonable service - 16 feet, 18 feet, or maybe 12 feet? (3) What degree of improvement has the local economy been able to support in the past?
These and many other questions arise as design and tolerable standards are developed in the measurement of highway needs. They are finally resolved through the application of the best available engineering analysis and experience. The AASHO design policies form a solid base for determination where they are applicable. Decisions that have to be made for secondary and urban facilities do not rest
on such a soUd body of fact. In many areas there is need for re
search which will give more positive guidance in the economics of highway development. Some of these areas are: (1) A better evaluation of the relation of design elements to safety of operation. What are the lowest standards of highway improvement we can accept without increasing the accident rate? (2) What are the lowest acceptable standards that can be used which will result in economical mainten-nance costs? (3)What is the optimum standard that can be used to produce the lowest overall transportation cost considering jointly the cost of vehicle operation and highway costs?
The sufficiency-rating procedures do not answer these questions. In their present stage of development rating procedures cannot in themselves determine what is tolerable and what is not. However, they are a valuable corollary to the tolerable standards in the measurement of needs. In their use on routes of considerable traffic significance they provide a measure of relativity which is badly needed.
It is to be hoped that, as research and study continue, it will become possible to correlate rating values and standards sufficiently to permit selection of a certain rating as a tolerable level for a particular system or for a given set of conditions.
How the ratings can now supplement the tolerable standards and aid in determining priority of work may be indicated by the chart on which are shown the basic elements of the measurement process. It represents a typical route or ^ven system of roads. By the use of tolerable standards, the current backlog of substandard sections are measured. In this example, 50 percent of the mileage was found to be below tolerable standards as adopted. This sample is not typical of most highway routes in that it shows a poorer than average condition.
But as a program is developed to eliminate the measured backlog which must be carried out over a period of years, the other 50 percent now considered adequate wil l begin to wear out, become obsolete and otherwise have to be replaced. Thus the needs program must incorporate annual replacement costs. In addition, the annual maintenance requirements must be added
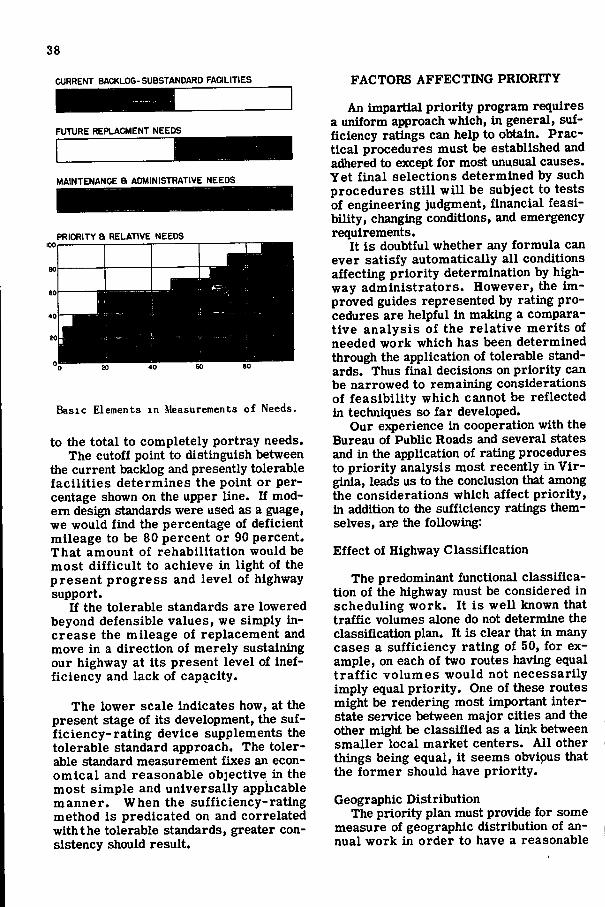
38
CURRENT BACKLOG-SUBSTANDARD FAQLITIES
FUTURE REPLACMENT NEEDS
MAINTENANCE & ADMINISTRATIVE NEEDS
PRIORITY a RELATIVE NEEDS
Basic Elements in Measurements of Needs.
to the total to completely portray needs. The cutoff point to distinguish between
the current backlog and presently tolerable facilities determines the point or percentage shown on the upper line. If modem design standards were used as a guage, we would find the percentage of deficient mileage to be 80 percent or 90 percent. That amount of rehabilitation would be most difficult to achieve in light of the present progress and level of highway support.
If the tolerable standards are lowered beyond defensible values, we simply increase the mileage of replacement and move in a direction of merely sustaining our highway at its present level of inefficiency and lack of capacity.
The lower scale indicates how, at the present stage of its development, the sufficiency-rating device supplements the tolerable standard approach. The tolerable standard measurement fixes an economical and reasonable objective in the most simple and universally applicable manner. When the sufficiency-rating method is predicated on and correlated with the tolerable standards, greater consistency should result.
FACTORS AFFECTING PRIORITY
An impartial priority program requires a uniform approach which, in general, sufficiency ratings can help to obtain. Practical procedures must be established and adhered to except for most unusual causes. Yet final selections determined by such procedures still wil l be subject to tests of engineering judgment, financial feasibility, changing conditions, and emergency requirements.
It is doubtful whether any formula can ever satisfy automatically all conditions affecting priority determination by highway administrators. However, the improved guides represented by rating procedures are helpful in making a comparative analysis of the relative merits of needed work which has been determined through the application of tolerable standards. Thus final decisions on priority can be narrowed to remaining considerations of feasibility which cannot be reflected in techniques so far developed.
Our e^qierience in cooperation with the Bureau of Public Roads and several states and in the application of rating procedures to priority analysis most recently in Virginia, leads us to the conclusion that among the considerations which affect priority, in addition to the sufficiency ratings themselves, are the following:
Effect of Highway Classification
The predominant functional classification of the highway must be considered in scheduling work. It is well known that traffic volumes alone do not determine the classification plan. It is clear that in many cases a sufficiency rating of 50, for example, on each of two routes having equal traffic volumes would not necessarily imply equal priority. One of these routes might be rendering most important interstate service between major cities and the other might be classified as a link between smaller local market centers. All other things being equal, it seems obvipus that the former should have priority.
Geographic Distribution The priority plan must provide for some
measure of geographic distribution of annual work in order to have a reasonable
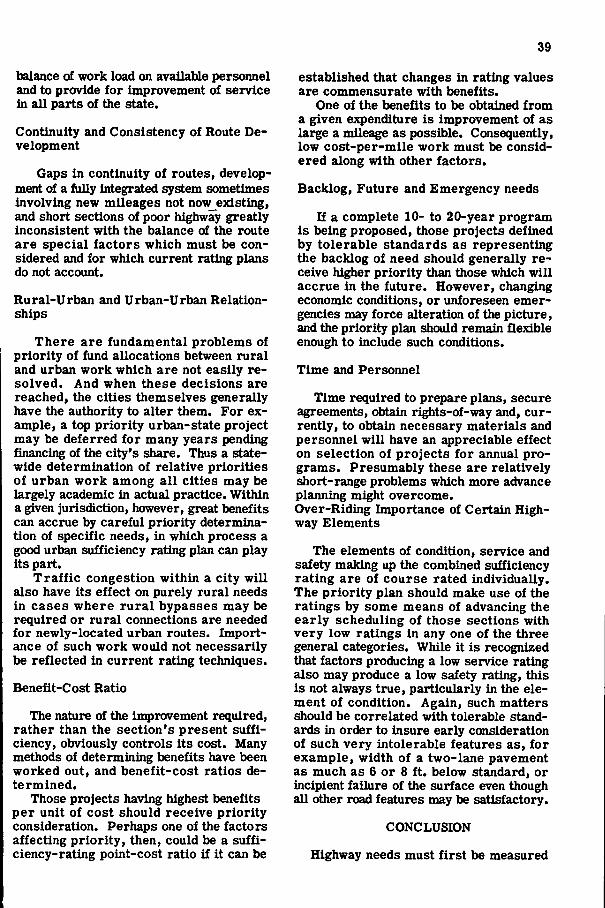
39
balance of work load on available personnel and to provide for improvement of service in all parts of the state.
Continuity and Consistency of Route Development
Gaps in continuity of routes, development of a ftdly integrated system sometimes involving new mileages not nowjexisting, and short sections of poor highway greatly inconsistent with the balance of the route are special factors which must be considered and for which current rating plans do not account.
Rural-Urban and Urban-Urban Relationships
There are fundamental problems of priority of fund allocations between rural and urban work which are not easily resolved. And when these decisions are reached, the cities themselves generally have the authority to alter them. For example, a top priority urban-state project may be deferred for many years pending financing of the city's share. Thus a statewide determination of relative priorities of urban work among all cities may be largely academic in actual practice. Within a given jurisdiction, however, great benefits can accrue by careful priority determination of specific needs, in which process a good urban sufficiency rating plan can play its part.
Traffic congestion within a city will also have its effect on purely rural needs in cases where rural bypasses may be required or rural connections are needed for newly-located urban routes. Importance of such work would not necessarily be reflected in current rating techniques.
Benefit-Cost Ratio
The nature of the inq>rovement required, rather than the section's present sufficiency, obviously controls its cost. Many methods of determining benefits have been worked out, and benefit-cost ratios determined.
Those projects having highest benefits per unit of cost should receive priority consideration. Perhaps one of the factors affecting priority, then, could be a sufficiency-rating point-cost ratio if it can be
established that changes in rating values are commensurate with benefits.
One of the benefits to be obtained from a given expenditure is improvement of as large a mileage as possible. Consequently, low cost-per-mile work must be considered along with other factors.
Backlog, Future and Emergency needs
If a complete 10- to 20-year program is being proposed, those projects defined by tolerable standards as representing the backlog of need should generally receive higher priority than those which will accrue in the future. However, changing economic conditions, or unforeseen emergencies may force alteration of the picture, and the priority plan should remain flexible enough to include such conditions.
Time and Personnel
Time required to prepare plans, secure agreements, obtain rights-of-way and, currently, to obtain necessary materials and personnel will have an appreciable effect on selection of projects for annual programs. Presumably these are relatively short-range problems which more advance planning might overcome. Over-Riding Importance of Certain Highway Elements
The elements of condition, service and safety making up the combined sufficiency rating are of course rated individually. The priority plan should make use of the ratings by some means of advancing the early scheduling of those sections with very low ratings in any one of the three general categories. While it is recognized that factors producing a low service rating also may produce a low safety rating, this is not always true, particularly in the element of condition. Again, such matters should be correlated with tolerable standards in order to insure early consideration of such very intolerable features as, for example, width of a two-lane pavement as much as 6 or 8 f t . below standard, or incipient failure of the surface even though all other road features may be satisfactory.
CONCLUSION
Highway needs must first be measured
40
by reference to sound design standards and tolerable standards which seek to define the limits of elements below which highway service is intolerable. Sufficiency ratings greatly aid in this process, especially in borderline cases where combinations of conditions are difficult to define more precisely and individual judg-ment needs more scientific guidance.
But in a long-range program, the borderline case may soon move to the unquestioned backlog of need. The ratings are found, then, to be primarily a major tool in analyzing priority and developing schedules of work.
There are, however, a number of other factors which also affect the priority rating. They should have equal consideration
with the sufficiency rating before annual priorities are set.
There is little to gain from making fine distinctions between the priorities of different highway projects, no matter how the relative merits may be derived. A complete 10- to 20-year program needs only to divide the work into perhaps three to 10 manageable groups. Within reasonable priority groupings, there is often small choice of one project over another.
With continuing research in economic evaluation and measurement of needs and in the job of putting first things first, the highway engineer is being given improved tools to do his job, and he will continually strive to use them properly.
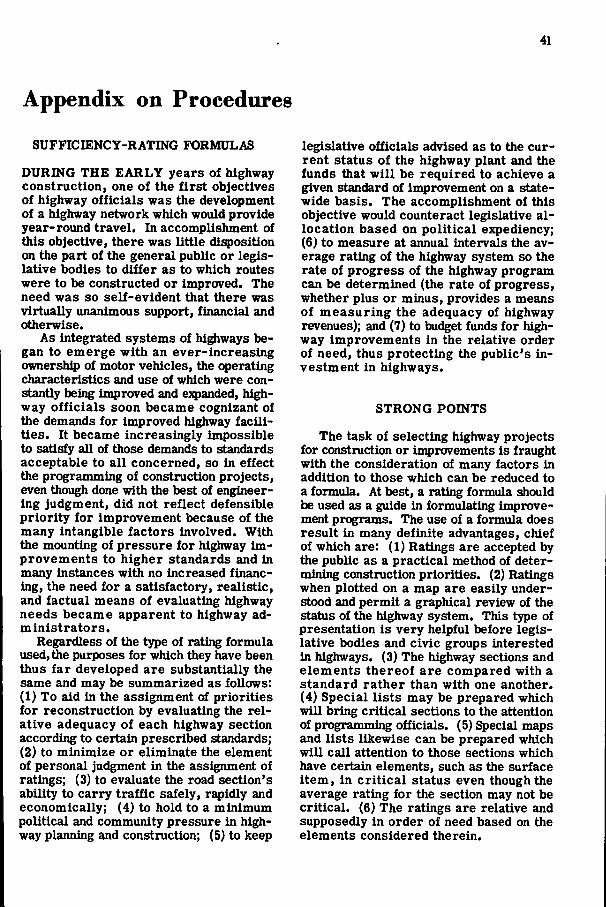
41
Appendix on Procedures
SUFFICIENCY-RATING FORMULAS
DURING THE EARLY years of highway construction, one of the first objectives of highway officials was the development of a highway network which would provide year-round travel. In accomplishment of this objective, there was little dig)osition on the part of the general public or legislative bodies to differ as to which routes were to be constructed or improved. The need was so self-evident that there was virtually unanimous support, financial and otherwise.
As integrated systems of hi^ways began to emerge with an ever-increasing ownership of motor vehicles, the operating characteristics and use of which were constantly being improved and e:q)anded, highway officials soon became cognizant of the demands for improved highway facilities. It became increasingly impossible to satisfy all of those demands to standards acceptable to all concerned, so in effect the programming of construction projects, even though done with the best of engineering judgment, did not reflect defensible priority for improvement because of the many intangible factors involved. With the mounting of pressure for highway improvements to higher standards and in many instances with no increased financing, the need for a satisfactory, realistic, and factual means of evaluating highway needs became apparent to highway administrators.
Regardless of the type of rating formula used,tiie purposes for which they have been thus far developed are substantially the same and may be summarized as follows: (1) To aid in the assignment of priorities for reconstruction by evaluating the relative adequacy of each highway section according to certain prescribed standards; (2) to minimize or eliminate the element of personal judgment in the assignment of ratings; (3) to evaluate the road section's ability to carry traffic safely, rapidly and economically; (4) to hold to a minimum political and community pressure in highway planning and construction; (5) to keep
legislative officials advised as to the current status of the highway plant and the funds that wil l be required to achieve a given standard of improvement on a statewide basis. The accomplishment of this objective would counteract legislative allocation based on political expediency; (6) to measure at annual intervals the average rating of the highway system so the rate of progress of the highway program can be determined (the rate of progress, whether plus or minus, provides a means of measuring the adequacy of highway revenues); and (7) to budget funds for highway improvements in the relative order of need, thus protecting the public's investment in highways.
STRONG POINTS
The task of selecting highway projects for construction or improvements is fraught with the consideration of many factors in addition to those which can be reduced to a formula. At best, a rating formula should be used as a guide in formulating improvement programs. The use of a formula does result in many definite advantages, chief of which are: (1) Ratings are accepted by the public as a practical method of determining construction priorities. (2) Ratings when plotted on a map are easily understood and permit a graphical review of the status of the highway system. This type of presentation is very helpful before legislative bodies and civic groups interested in highways. (3) The highway sections and elements thereof are compared with a standard rather than with one another. (4) Special lists may be prepared which will bring critical sections to the attention of programming officials. (5) Special maps and lists likewise can be prepared which will call attention to those sections which have certain elements, such as the surface item, in critical status even though the average rating for the section may not be critical. (6) The ratings are relative and supposedly in order of need based on the elements considered therein.
42
WEAK POINTS
Any attempt to rate a road section by an empirical formula is subject to argument. The fact remains, however, that the States which have used formulas of this type have found them satisfactory. It is noted that the formulas in use show considerable variation in elements evaluated and the weights given to them. A tentative conclusion may be drawn to the effect that no one formula has been developed which has been found satisfactory to all states.
The formulas in use, regardless of the elements considered or their par values share a number of weaknesses which may be summarized as follows: (1) It is practically impossible to subdivide the roads into units which are homogeneous in all respects. (2) Unless small sections are rated individually, the seriousness of a particular deficiency may not be apparent. (3) The average weighting given to a rating element may not indicate the seriousness of the components of the average. (4) Average daily rather than design-hour traffic volumes have been used in setting up the basic standards. (5) Except as to variation in standards, the cost of the improvement is ignored. This is an important consideration where the cost is disproportionately effected by an e:q)ensive bridge, costly right of way acquisition, or the surmounting of some physical barrier. (6) It is virtually impossible to obtain accurate maintenance costs on short sections. (7) Short though critical deficiencies such as narrow or structurally weak bridges are not rated. (8) It is difficult to rate conditions at locations involving intersections, interchanges, urban boundaries, etc. (9) The need for new routes is not considered. (10) Reasonably reliable accident data are not ordinarily available and, when used, certain precautions must be exercised. Some sections with a very good safety rating have a high accident frequency, possible because factors such as access points, land use and the like are not considered in the formula. (11) Unless a separate adjustment is made traffic sections with extremely low traffic volumes will appear near the top of the list even though they have low basic sufficiency ratings. This would indicate that either the elements are weighted in favor of the high traffic volume roads or that the basic standards are not in correct
relationship by traffic volume groups.
SUCCESSFUL USE
The Arizona Highway Department developed and has used the sufficiency rating system since 1946. With necessary modifications it has been applied to both rural and urban roads and to the state primary system (F.A.), state secondary system (F.A.S.), and county primary system (F.A.S.). The use of the sufficiency rating system has been widely accepted by the public as an impartial, unbiased method of allocating funds against the most urgent road construction needs. During the years it has been employed, more than 80 percent of the items appearing in the construction budget were included in the critical rating list. The political aspect of the annual public budget hearings with pressure groups vying for special consideration has disappeared. These hearings are now very orderly and brief with only a few people in attendance which attests to the public acceptance of the system.
Nationwide and even international attention has been received by Arizona and its rating system. At least nine states have used this rating method, modified to suit their particular conditions. Some have applied it on an experimental basis to all or part of their primary systems. In some cases this experimentation has led to modifications and changes that depart quite radically from the original procedure.
A few states have adopted a rating method and are using it for the second or third year on both their primary and secondary systems. Statistical tables of components of ratings such as Arizona publishes annually have been published by Connecticut, Washington, Louisiana, Colorado, and Oregon.
Connecticut has used its sufficiency rating system to substantiate the long range construction needs program which had been previously chosen on the basis of engineering judgment and miscellaneous facts. Their district engineers have been supplied with priority lists of ratings of various components and maintenance programs and requests for work authorizations are checked against these ratings. State police officials have also been supplied priority lists for the safety compon-
43
ent of the rating as a guide to the assignment of patrol effort.
Several states by a comparison of final factors of each year, have been able to indicate the gain or loss in providing adequate highways for the traveling public.
USE OF VARIOUS ROAD SYSTEMS
Only a few states have used the sufficiency rating procedure on any roads other than their state primary system. In the limited number of states where i t has been used on the secondary system, no modification of the formula has been deemed necessary. It is felt that the type of terrain and the traffic volume are the controlling elements and, therefore, rating standards should be established on the basis of these two factors. In some cases, separate rating standards have been set op for each system such as the interstate, primary, and secondary and with the standards further classified by traffic volume and terrain type. It should be ejnphasized, however, that no change was made in such cases in the rating formula or its application.
One state suggests that if the interstate or primary system warrants priority for military or other strategic purposes, this can be considered separately or an adjustment to the rating may be made. It warns that systems and adjustments so made should be thoroughly explained so they don't f ly under false colors and w'ill not be given preferential treatment without f u l l knowledge of the reason.
Arizona uses the same sufficiency rating formula for urban areas as i t does f o r r u r a l areas. The terms marginal f r i c t i on , medial f r i c t ion , intersectional f r i c t i on , and safe speed have been substituted for roadway and surface width, stopping sight distance, and alignment, although point values for these characterist ics remain the same.
Connecticut recognizes that certain elements rated for a ru ra l system are inapplicable in an urban area. Such an element would be sight distance available for passing. Lower speeds and higher practical capacities in urban areas provide for less freedom of flow than do i i i ra l standards.
In villages, New Hampshire substitutes the number of street intersections, service
stations, and other types of driveways for the number of stopping sight distance restrictions used in rural areas.
It is quite apparent that the field is wide open for further development of sufficiency rating procedures to be used in urban areas. The thoroughfare and intersectional congestion so prevalent in such areas would seem to place great importance on the sufficiency of the practical capacity based on a desirable average operating speed. Structural adequacy or condition and traffic capacity that provides a desirable freedom of flow with reasonable safety are undoubtedly the two most important factors to be considered in determining the sufficiency of urban routes.
BPR MAINTENANCE INSPECTION RATINGS
It is a function of the Maintenance Branch of the Bureau of Public Roads to administer that part of the Federal Aid Highway Act which requires the states to perform the maintenance on roads following construction under the provisions of the act. In carrying out this responsibility on the extensive mileage of the federal-aid systems, the need for a uniform and practical method of making maintenance inspection reports is paramount.
Maintenance reports since 1933 have described condition, safety, and service factors on federal-aid projects in various stages of deterioration and obsolescence to the extent where they have become a burden on maintenance forces and require reconstruction. In recent years the Maintenance Branch conducted a study in 16 states of the advantages to be gained through adoption of the sufficiency rating plan whereby numerical ratings are assigned to various items comprising the elements of condition, safety, and service, and weighting these factors to obtain a composite rating.
It was concluded f rom this study that the sufficiency rating plan had many advantages including greater uniformity of procedure and precision of reporting. The ratings of projects consolidated into route sections furnish a means of ranking the sufficiency of each segment of the highway and gives those responsible for maintenance an opportunity to be heard at the program stage regarding projects requiring excessive maintenance. It also fur-
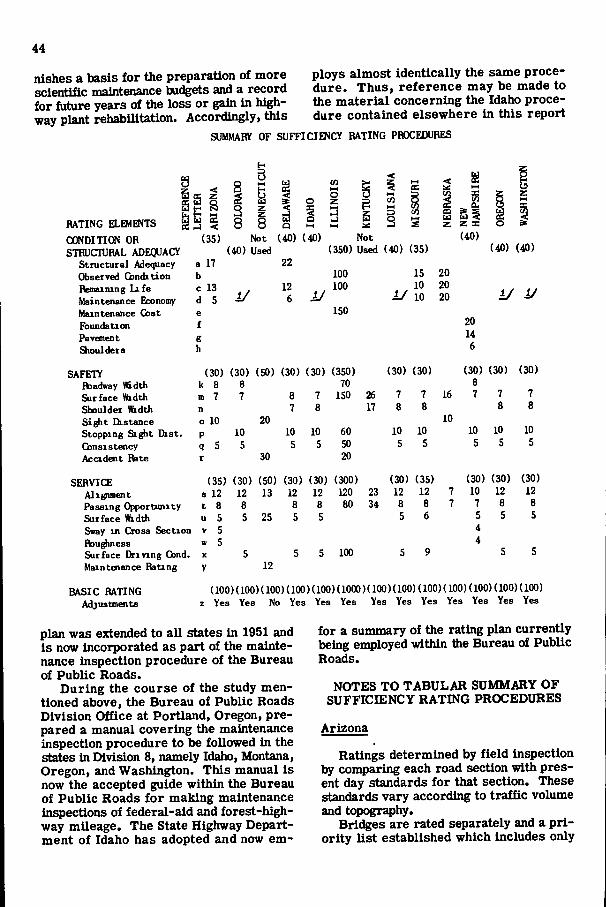
44
nishes a basis for the preparation of more scientific maintenance budgets and a record for future years of the loss or gain in highway plant rehabilitation. Accordingly, this
SUMMAtff OF SUFFICIENCT RATING PROCEDURES
ploys almost identically the same procedure. Thus, reference may be made to the material concerning the Idaho procedure contained elsewhere in this report
s
RATING ELEMENTS REFE
REN
LETT
ER
ARIZ
ONA
OOTIDITION OR (35) STRUCTURAL ADEQUACy
Stiuctuial Adequacy a 17 Obseived Condition b Remaining Life c 13 Maintenance Economy d 5 Maintenance Q>st e Foundation f Pavement g Shoulders h
g
Not (40) Used
8
u B
a o
(40) (40)
22
12 6
CO »
S 6
i i Not
(350) Used (40)
100 100
<
(35)
15 10 10
S S i Z Z X
(40) (40)
z
(40)
20 20 20
150 20 14 6
SAFETY Ifaadway Width Surface Width Shoulder Width S i ^ t Distance Stopping Sight Dist. Consistency Accident Rate
SERVICE Ali^unent Passing Opportunity Surface Width S»ay in Cross Section ffeughness Surface Driving Cond. Maintenance EUiUng
BASIC RAHNG Adjustments
(30) (30) (50) (30) (30) (350) (30) (30) (30) (30) (30) k 8 8 70 8 m 7 7 8 7 150 26 7 7 16 7 7 7 n 7 8 17 8 8 8 8 o 10 20 10 p 10 10 10 60 10 10 10 10 10 q 5 5 5 5 50 5 5 5 5 5 r 30 20
(35) (30) (50) (30) (30) (300) (30) (35) (30) (30) (30) s 12 12 13 12 12 120 23 12 12 7 10 12 12 t 8 8 8 8 80 34 8 8 7 7 8 8 u 5 5 25 5 5 5 6 5 5 5 V 5 4 w 5 4 X 5 5 5 100 5 9 5 5 y 12
(100)(100)(100)(100)(100)(1000)(100)(100)(100)(100)(100)(100)(100) z Yes Yes No Yes Yes Yes Yes Yes Yes Yes Yes Yes Yes
plan was extended to all states in 1951 and is now incorporated as part of the maintenance inspection procedure of the Bureau of Public Roads.
During the course of the study mentioned above, the Bureau of Public Roads Division Office at Portland, Oregon, prepared a manual covering the maintenance inspection procedure to be followed in the states in Division 8, namely Idaho, Montana, Oregon, and Washington. This manual is now the accepted guide within the Bureau of Public Roads for making maintenance inspections of federal-aid and forest-highway mileage. The State Highway Department of Idaho has adopted and now em-
for a summary of the rating plan currently being en^loyed within the Bureau of PubUc Roads.
NOTES TO TABULAR SUMMARY OF SUFFICIENCY RATING PROCEDURES
Arizona
Ratings determined by field inspection by comparing each road section with present day standards for that section. These standards vary according to traffic volume and topogr^hy.
Bridges are rated separately and a p r i ority list established which includes only
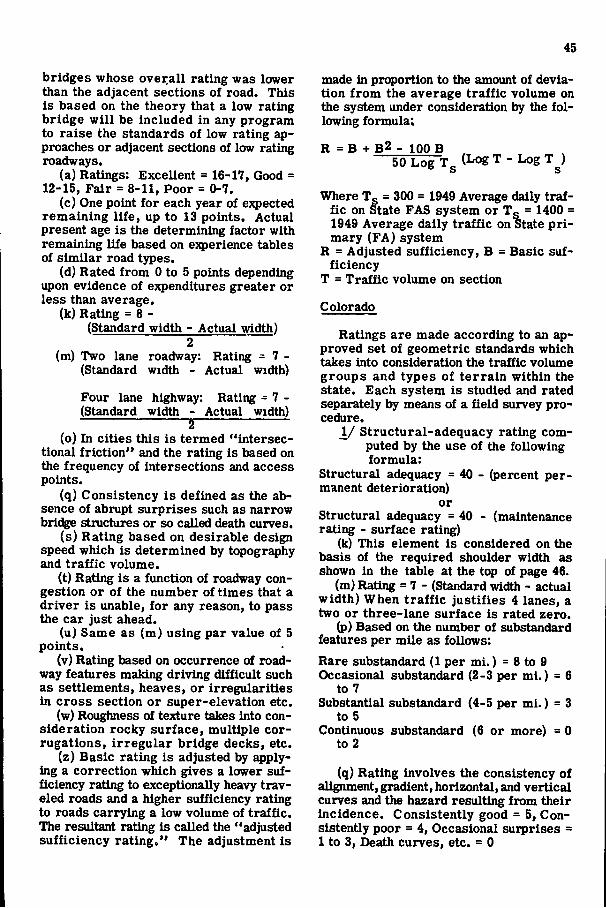
45
bridges whose overall rating was lower than the adjacent sections of road. This is based on the theory that a low rating bridge w i l l be included in any program to raise the standards of low rating approaches or adjacent sections of low rating roadways.
(a) Ratings: Excellent = 16-17, Good = 12-15, Fair = 8-11, Poor = 0-7.
(c) One point for each year of e:qpected remaining l i f e , up to 13 points. Actual present age is the determining factor with remaining life based on experience tables of similar road types.
(d) Rated from 0 to 5 points depending upon evidence of expenditures greater or less than average.
(k) Rating = 8 -(Standard width - Actual width)
2 (m) Two lane roadway: Rating = 7 -
(Standard width - Actual width)
Four lane highway: Rating - 7 -(Standard width - Actual width)
2 (o) In cities this is termed "intersec-
tional f r ic t ion" and the rating is based on the frequency of intersections and access points.
(q) Consistency is defined as the absence of abrupt surprises such as narrow bridge structures or so called death curves.
(s) Rating based on desirable design speed which is determined by topography and traffic volume.
(t) Rating is a function of roadway congestion or of the number of times that a driver is unable, for any reason, to pass the car just ahead.
(u) Same as (m) using par value of 5 points.
(v) Rating based on occurrence of roadway features making driving difficult such as settlements, heaves, or irregularities in cross section or super-elevation etc.
(w) Roughness of texture takes into consideration rocky surface, multiple corrugations, irregular bridge decks, etc.
(z) Basic rating is adjusted by applying a correction which gives a lower sufficiency rating to exceptionally heavy traveled roads and a higher sufficiency rating to roads carrying a low volume of t raff ic . The resultant rating is called the "adjusted sufficiency ra t ing ." The adjustment is
made in proportion to the amount of deviation f rom the average traff ic volume on the system under consideration by the fo l lowing formula;
R = B + b2 - 100 B . ^ ^ ^ ^ 50 Log Tg (Log T - Log T^)
Where Tg = 300 = 1949 Average daily traffic on State FAS system or Tg = 1400 = 1949 Average daily traffic on State p r i mary (FA) system
R = Adjusted sufficiency, B = Basic sufficiency
T = Traffic volume on section
Colorado
Ratings are made according to an approved set of geometric standards which takes into consideration the traffic volume groups and types of terrain within the state. Each system is studied and rated separately by means of a field survey procedure.
1/ Structural-adequacy rating computed by the use of the following formula:
Structural adequacy = 40 - (percent permanent deterioration)
or Structural adequacy = 40 - (maintenance rating - surface rating)
(k) This element is considered on the basis of the required shoulder width as shown in the table at the top of page 46.
(m) Rating = 7 - (Standard width - actual width) When t ra f f ic justifies 4 lanes, a two or three-lane surface is rated zero.
(p) Based on the number of substandard features per mile as follows: Rare substandard (1 per mi.) = 8 to 9 Occasional substandard (2-3 per ml.) = 6
to 7 Substantial substandard (4-5 per mi.) =3
to 5 Continuous substandard (6 or more) = 0
to 2
(q) Ratihg involves the consistency of allotment, gradient, horizontal, and vertical curves and the hazard resulting from their incidence. Consistently good = 5, Consistently poor = 4, Occasional surprises = 1 to 3, Death curves, etc. = 0
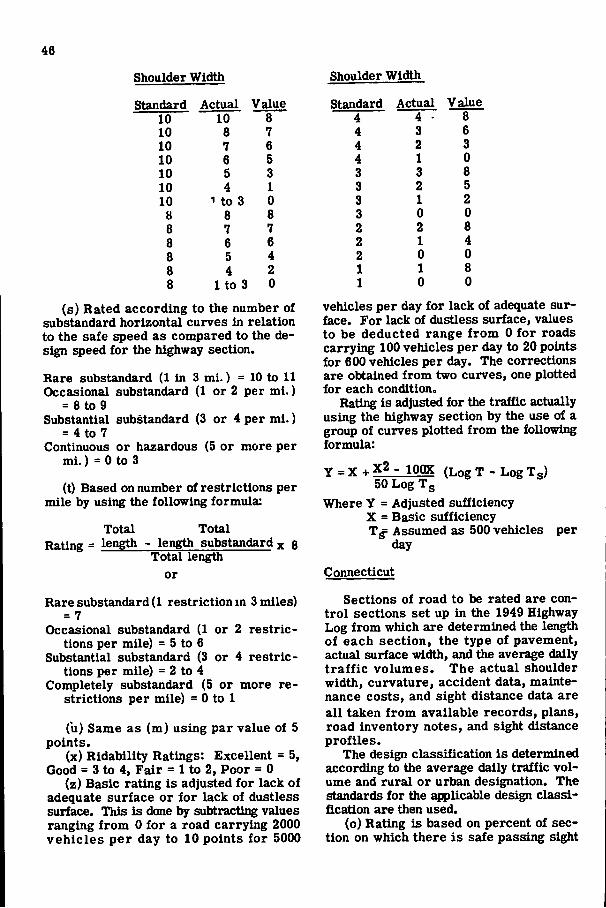
46
Shoulder Width Shoulder Width
Standard Actual Value Standard Actual Value 10 10 8 4 4 • 8 10 8 7 4 3 6 10 7 6 4 2 3 10 6 5 4 1 0 10 5 3 3 3 8 10 4 1 3 2 5 10 1 to 3 0 3 1 2 8 8 8 3 0 0 8 7 7 2 2 8 8 6 6 2 1 4 8 5 4 2 0 0 8 4 2 1 1 8 8 1 to 3 0 1 0 0
(s) Rated according to the number of substandard horizontal curves in relation to the safe speed as compared to the design speed for the highway section.
Rare substandard (1 In 3 mi. ) = 10 to 11 Occasional substandard (1 or 2 per mi.)
= 8 to 9 Substantial
= 4to 7 Continuous
substandard (3 or 4 per mi.)
or hazardous (5 or more per mi. ) = 0 to 3
(t) Based on number of restrictions per mile by using the following formula:
Total Rating = length
Totol • length substandard x 8 Total length
or
Rare substandard (1 restriction in 3 miles) = 7
Occasional substandard (1 or 2 restrictions per mile) = 5 to 6
Substantial substandard (3 or 4 restrictions per mile) = 2 to 4
Completely substandard (5 or more restrictions per mile) = 0 to 1
(u) Same as (m) using par value of 5 points.
(x) Ridability Ratings: Excellent = 5, Good = 3 to 4, Fair = 1 to 2, Poor = 0
(z) Basic rating is adjusted for lack of adequate surface or for lack of dustless surface. This is done by subtracting values ranging from 0 for a road carrying 2000 vehicles per day to 10 points for 5000
vehicles per day for lack of adequate surface. For lack of dustless surface, values to be deducted range f rom 0 for roads carrying 100 vehicles per day to 20 points for 600 vehicles per day. The corrections are obtained from two curves, one plotted for each condition.
Rating is adjusted for the traffic actually using the highway section by the use of a group of curves plotted from the following formula:
Y =X + X2 - lOQX (Log T - Log Tg) 50 Log Tg
Where Y = Adjusted sufficiency X = Basic sufficiency Tg= Assumed as 500 vehicles per
day
Connecticut
Sections of road to be rated are cont ro l sections set up in the 1949 Highway Log from which are determined the length of each section, the type of pavement, actual surface width, and the average daily t r a f f i c volumes. The actual shoulder width, curvature, accident data, maintenance costs, and sight distance data are al l taken f rom available records, plans, road inventory notes, and sight distance profiles.
The design classification is determined according to the average daily traffic volume and rural or urban designation. The standards for the applicable design classification are then used.
(o) Rating is based on percent of section on which there is safe passing sight
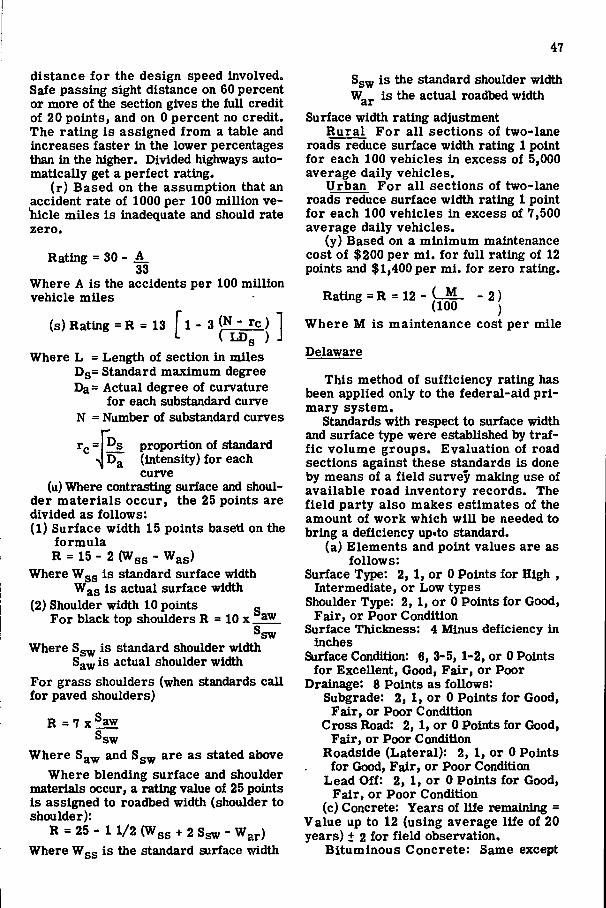
47
distance for the design speed involved. Safe passing sight distance on 60 percent or more of the section gives the ful l credit of 20 points, and on 0 percent no credit. The rating is assigned from a table and increases faster in the lower percentages than in the higher. Divided h^iways automatically get a perfect rating.
(r) Based on the assumption that an accident rate of 1000 per 100 million ve-'hicle miles is inadequate and should rate zero.
Rating = 30 - A_ 33
Where A is the accidents per 100 million vehicle miles
(s) Rating = R = 13 1-3 - rc ) L J
Where L = Length of section in miles Ds= Standard maximum degree Da= Actual degree of curvature
for each substandard curve N = Number of substandard curves
r c = f e proportion of standard (intensity) for each curve
(u) Where contrasting surface and shoulder materials occur, the 25 points are divided as follows: (1) Surface width 15 points baseti on the
formula R = 15 - 2 (Wss - Was)
Where Wgg is standard surface width Wgg is actual surface width
(2) Shoulder width 10 points o For black top shoulders R = 10 x . aw
sw S Where Sg^ is standard shoulder width
S^^ is actual shoulder width For grass shoulders (when standards call for paved shoulders)
R =7x?aw Ssw
Where S^^ and Sg^ are as stated above Where blending surface and shoulder
materials occur, a rating value of 25 points is assigned to roadbed width (shoulder to shoulder):
ss + 2 Sgw - War) is the standard surface width
R = 25 - 1 1/2 (W Where W 'ss
Sg^ is the standard shoulder width W^^ is the actual roadbed width
Surface width rating adjustment Rura l For a l l sections of two-lane
roads reduce surface width rating 1 point for each 100 vehicles in excess of 5,000 average daily vehicles.
Urban For a l l sections of two-lane roads reduce surface width rating 1 point for each 100 vehicles in excess of 7,500 average daily vehicles.
(y) Based on a minimum maintenance cost of $200 per m i . for fu l l rating of 12 points and $1,400 per mi . for zero rating.
Rating = R = 12 - (-21- - 2) (100 )
Where M is maintenance cost per mile
Delaware
This method of sufficiency rating has been applied only to the federal-aid p r i mary system.
Standards with respect to surface width and surface type were established by traff ic volume groups. Evaluation of road sections against these standards is done by means of a field survey making use of available road inventory records. The f ie ld party also makes estimates of the amount of work which w i l l be needed to bring a deficiency up>to standard.
(a) Elements and point values are as follows:
Surface Type: 2, 1, or 0 Points for High , Intermediate, or Low types
Shoulder Type: 2, 1, or 0 Points for Good, Fair, or Poor Condition
Surface Thickness: 4 Minus deficiency in inches
Surface Condition: 6, 3-5, 1-2, or 0 Points for Excellent, Good, Fair, or Poor
Drainage: 8 Points as follows: Subgrade: 2, 1, or 0 Points for Good,
Fair, or Poor Condition Cross Road: 2, 1, or 0 Points for Good,
Fair, or Poor Condition Roadside (Lateral): 2, 1, or 0 Points
for Good, Fair, or Poor Condition Lead Off: 2, 1, or 0 Points for Good,
Fair, or Poor Condition (c) Concrete: Years of Ufe remaining =
Value up to 12 (using average life of 20 years) + 2 for field observation.
Bituminous Concrete: Same except
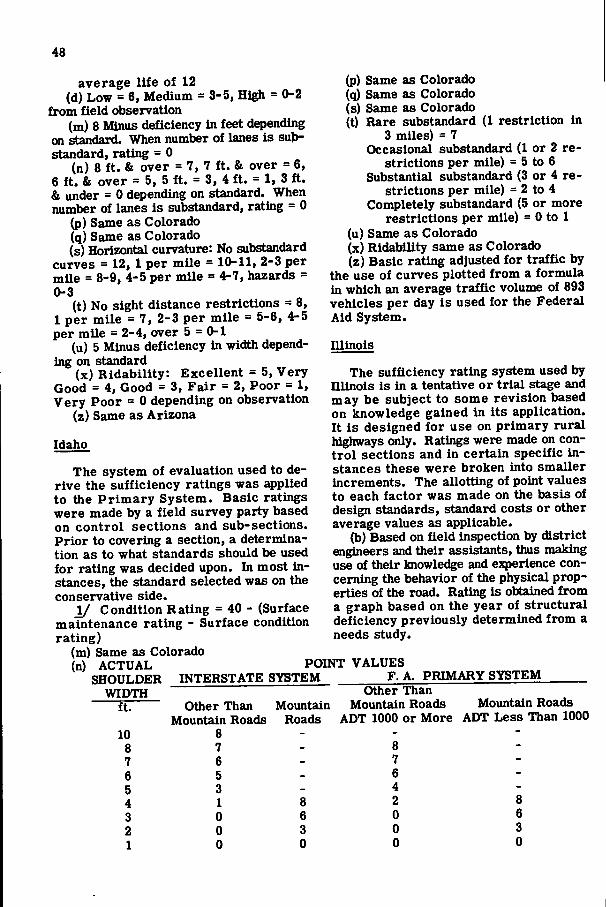
48
average l i f e of 12 (d) Low = 6, Medium = 3-5, High = 0-2
from field observation (m) 8 Minus deficiency in feet depending
on standard. When number of lanes is substandard, rating = 0
(n) 8 f t . & over = 7, 7 f t . & over = 6, 6 f t . & over = 5, 5 f t . = 3 ,4 f t . = 1, 3 f t . & under = 0 depending on standard. When number of lanes is substandard, rating = 0
(p) Same as Colorado (q) Same as Colorado (s) Horizontal curvature: No substandard
curves = 12, 1 per mile = 10-11, 2-3 per mile = 8-9, 4-5 per mile = 4-7, hazards = 0-3
(t) No sight distance restrictions = 8, 1 per mile = 7, 2-3 per mile = 5-6, 4-5 per mile = 2-4, over 5 = 0-1
(u) 5 Minus deficiency in width depending on standard
(x) Ridabil i ty: Excellent = 5, Very Good = 4, Good = 3, Fair = 2, Poor = 1, Very Poor = 0 depending on observation
(z) Same as Arizona
Idaho
The system of evaluation used to derive the sufficiency ratings was applied to the Pr imary System. Basic ratings were made by a field survey party based on control sections and sub-sections. Prior to covering a section, a determination as to what standards should be used for rating was decided upon. In most i n stances, the standard selected was on the conservative side.
1/ Condition Rating = 40 - (Surface maintenance rating - Surface condition rating)
(m) Same as Colorado (n) ACTUAL POINT
SHOULDER INTERSTATE SYSTEM _ WIDTH
(p) Same as Colorado (q) Same as Colorado (s) Same as Colorado (t) Rare substandard (1 restriction in
3 miles) = 7 Occasional substandard (1 or 2 re
strictions per mile) = 5 to 6 Substantial substandard (3 or 4 re
strictions per mile) = 2 to 4 Completely substandard (5 or more
restrictions per mile) = 0 to 1 (u) Same as Colorado (x) Ridability same as Colorado (z) Basic rating adjusted for traffic by
the use of curves plotted from a formula in which an average traffic volume of 893 vehicles per day is used for the Federal Aid System.
Illinois
The sufficiency rating system used by nilnois is in a tentative or t r ia l stage and may be subject to some revision based on knowledge gained in its application. I t is designed for use on primary rural highways only. Ratings were made on cont r o l sections and in certain specific instances these were broken into smaller increments. The allotting of point values to each factor was made on the basis of design standards, standard costs or other average values as applicable.
(b) Based on field inspection by district engineers and their assistants, thus making use of their knowledge and experience concerning the behavior of the physical properties of the road. Rating is obtained from a graph based on the year of structural deficiency previously determined from a needs study.
VALUES F. A. PRIMARY SYSTEM
ft 10 8 7 6 5 4 3 2 1
Other Than Mountain Roads
8 7 6
Mountain Roads
Other Than Mountain Roads
ADT 1000 or More
8 7 6 4 2 0 0 0
Mountain Roads ADT Less Than 1000
8 6 3 0
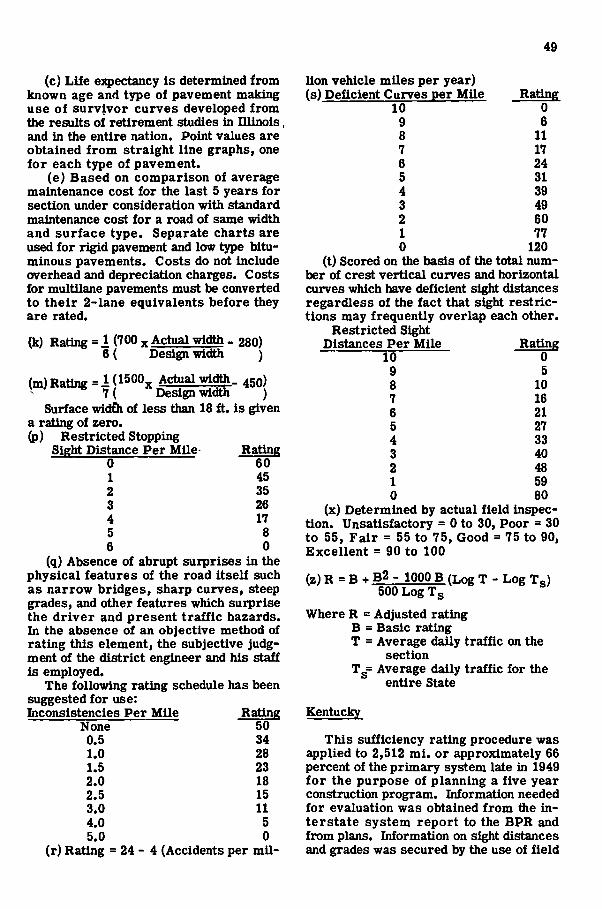
49
(c) Life expectancy is determined from known age and type of pavement making use of survivor curves developed from the results of retirement studies in Illinois, and in the entire nation. Point values are obtained f rom straight line graphs, one for each type of pavement.
(e) Based on comparison of average maintenance cost for the last 5 years for section under consideration with standard maintenance cost for a road of same width and surface type. Separate charts are used for rigid pavement and low type bituminous pavements. Costs do not include overhead and depreciation charges. Costs for multUane pavements must be converted to their 2-lane equivalents before they are rated.
(k) Rating = 1 (700 Actual width - 280) 6 ( Design width )
(m) Rating =M^^^°x Actual width, 450) 7 ( Design width )
Surface widfh of less than 18 f t . is given a rating of zero. (p) Restricted Stopping
Sight Distance Per Mile Rating 0 60 1 45 2 35 3 26 4 17 5 8 6 0
(q) Absence of abrupt surprises in the physical features of the road itself such as narrow bridges, sharp curves, steep grades, and other features which surprise the driver and present t raff ic hazards. In the absence of an objective method of rating this element, the subjective judgment of the district engineer and his staff is employed.
The following rating schedule has been suggested for use: Inconsistencies Per Mile Rating
None 50 0.5 34 1.0 28 1.5 23 2.0 18 2.5 15 3.0 11 4.0 5 5.0 0
(r) Rating = 2 4 - 4 (Accidents per mi l
lion vehicle miles per year) (s) Deficient Curves per Mile
10 9 8 7 6 5 4 3 2 1 0
Rating 0 6
11 17 24 31 39 49 60 77
120 (t) Scored on the basis of the total num
ber of crest vertical curves and horizontal curves which have deficient sight distances regardless of the fact that sight restrictions may frequently overlap each other.
Restricted Sight Distances Per Mile Rating
10 0 9 5 8 10 7 16 6 21 5 27 4 33 3 40 2 48 1 59 0 80
(x) Determined by actual field inspection. Unsatisfactory = 0 to 30, Poor = 30 to 55, Fair = 55 to 75, Good = 75 to 90, Excellent = 90 to 100
(z)R = B + B2j-iOO0B (LogT - Log Tg) 500 Log Tg
Where R = Adjusted rating B = Basic rating T = Average daily traffic on the
section Tg= Average dally traffic for the
entire State
Kentucky
This sufficiency rating procedure was applied to 2,512 m i . or approximately 66 percent of the primary system late in 1949 fo r the purpose of planning a five year construction program. Information needed for evaluation was obtained from the interstate system report to the BPR and from plans. Information on sight distances and grades was secured by the use of field
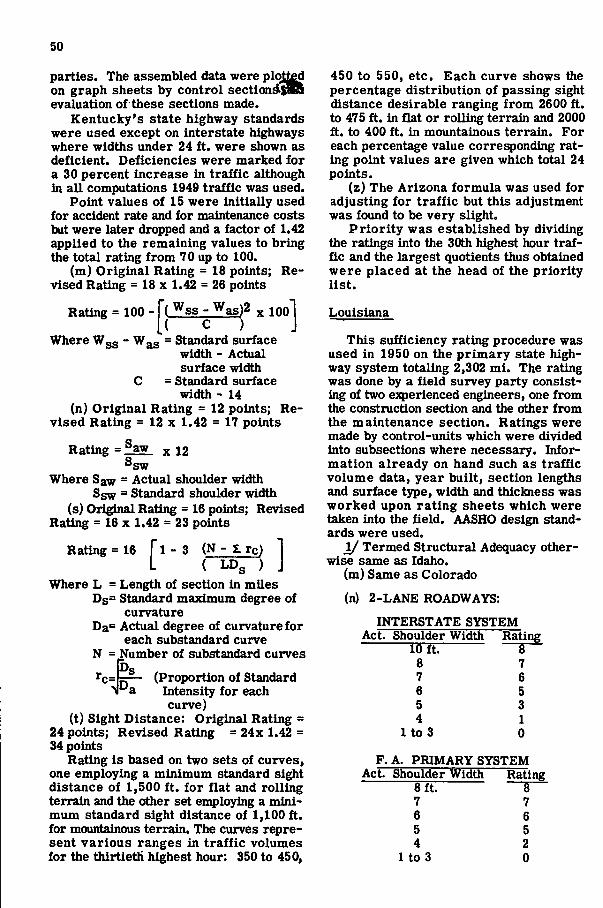
50
parties. The assembled data were plotted on graph sheets by control section 'SBl evaluation of these sections made.
Kentucky's state highway standards were used except on interstate highways where widths under 24 f t . were shown as deficient. Deficiencies were marked for a 30 percent increase in traffic although in all computations 1949 traffic was used.
Point values of 15 were initially used for accident rate and for maintenance costs but were later dropped and a factor of 1.42 applied to the remaining values to bring the total rating from 70 up to 100.
(m) Original Rating = 18 points; Revised Rating = 18 x 1.42 = 26 points
Rating = 100
Where Wgg - W^g ( C ) = Standard surface
width - Actual surface width
C = Standard surface width - 14
(n) Original Rating = 12 points; Revised Rating = 12 x 1.42 = 17 points
Rating =^aw_ x 12 ^sw
Where Saw = Actual shoulder width Ssw = Standard shoulder width
(s) Original Rating = 16 points; Revised Rating = 16 x 1.42 = 23 points
Rating = 16 [ 1 - 3 (N - 2. rc)
L ( LD3 ) J Where L = Length of section in miles
Ds= Standard maximum degree of curvature
Da= Actual degree of curvature for each substandard curve
N = Number of substandard curves rc= I g — (Proportion of Standard
'"a Intensity for each curve)
(t) Sight Distance: Original Rating = 24 points; Revised Rating = 24x 1.42 = 34 points
Rating is based on two sets of curves, one employing a minimum standard sight distance of 1,500 f t . for flat and rolling terrain and the other set employing a minimum standard sight distance of 1,100 f t . for mountainous terrain. The curves represent various ranges in t ra f f ic volumes for tiie thirtieth highest hour: 350 to 450,
450 to 550, etc. Each curve shows the percentage distribution of passing sight distance desirable ranging from 2600 f t . to 475 f t . in flat or rolling terrain and 2000 f t . to 400 f t . in mountainous terrain. For each percentage value corresponding rating point values are given which total 24 points.
(z) The Arizona formula was used for adjusting for t ra f f ic but this adjustment was found to be very slight.
Pr io r i ty was established by dividing the ratings into the 30th highest hour traffic and the largest quotients thus obtained were placed at the head of the priori ty Ust.
( Wgs - Was)2 lool Louisiana
This sufficiency rating procedure was used in 1950 on the primary state highway system totaling 2,302 mi . The rating was done by a field survey party consisting of two experienced engineers, one from the construction section and the other from the maintenance section. Ratings were made by control-units which were divided into subsections where necessary. Information already on hand such as traffic volume data, year built, section lengths and surface type, width and thickness was worked upon rating sheets which were taken into the tield. AASHO design standards were used.
1/ Termed Structural Adequacy otherwise same as Idaho.
(m) Same as Colorado
(n) 2-LANE ROADWAYS:
INTERSTATE SYSTEM Act. Shoulder Width Rating
—nnt ~ 8 — 8 7 7 6 6 5 5 3 4 1
1 to 3 0 F.A. PRIMARY SYSTEM
Act. Shoulder Width Rating 8 f t . S 7 7 6 6 5 5 4 2
1 to 3 0
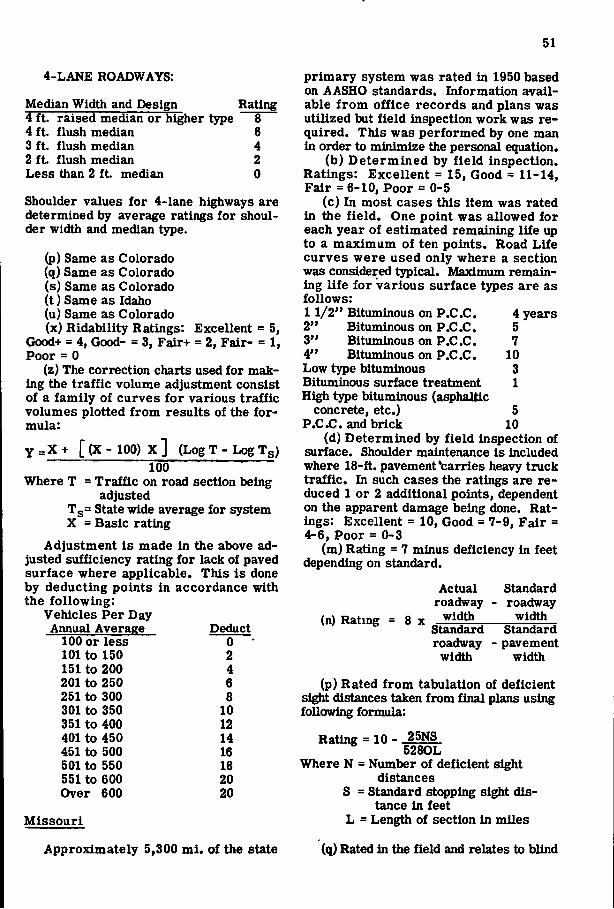
51
4-LANE ROADWAYS:
Median Width and Design Rating 4 f t . raised median or higher type 8 4 f t . flush median 6 3 f t . flush median 4 2 f t . flush median 2 Less than 2 f t . median 0
Shoulder values for 4-lane highways are determined by average ratings for shoulder width and median type.
(p) Same as Colorado (q) Same as Colorado (s) Same as Colorado (t) Same as Idaho (u) Same as Colorado (x) Ridability Ratings: Excellent = 5,
Good+ = 4, Good- = 3, Fair+ = 2, Fair- = 1, Poor = 0
(z) The correction charts used for making the traffic volume adjustment consist of a family of curves for various traffic volumes plotted f rom results of the formula:
Y =X + [ (X - 100) X ] (Log T - Log T s) 100
Where T = Traffic on road section being adjusted
Tg= State wide average for system X = Basic rating
Adjustment is made in the above adjusted sufficiency rating for lack of paved surface where applicable. This is done by deducting points in accordance with the following:
Vehicles Per Day Annual Average Deduct
100 or less 0 101 to 150 2 151 to 200 4 201 to 250 6 251 to 300 8 301 to 350 10 351 to 400 12 401 to 450 14 451 to 500 16 501 to 550 18 551 to 600 20 Over 600 20
primary system was rated in 1950 based on AASHO standards. Information available f r o m office records and plans was utilized but field inspection work was required. This was performed by one man in order to minimize the personal equation.
(b) Determined by f ie ld inspection. Ratings: Excellent = 15, Good = 11-14, Fair = 6-10, Poor = 0-5
(c) In most cases this item was rated in the f i e ld . One point was allowed for each year of estimated remaining life up to a maximum of ten points. Road Life curves were used only where a section was considered typical. Maximum remaining l ife for various surface types are as follows: 1 1/2" Bituminous on P.C.C. 4 years 2" Bituminous on P.C.C. 5 3" Bituminous on P.C.C. 7 4" Bituminous on P.C.C. 10 Low type bituminous 3 Bituminous surface treatment 1 High type bituminous (asphaUlc
concrete, etc.) 5 P.C.C. and brick 10
(d) Determined by field inspection of surface. Shoulder maintenance is included where 18-ft. pavement'carries heavy truck traffic. In such cases the ratings are reduced 1 or 2 additional points, dependent on the apparent damage being done. Ratings: Excellent = 10, Good = 7-9, Fair = 4-6, Poor = 0-3
(m) Rating = 7 minus deficiency in feet depending on standard.
(n) Ratmg = 8 x
Actual roadway
width
Standard roadway
width Standard roadway
width
Standard pavement
width
Missouri
(p) Rated f rom tabulation of deficient sight distances taken from fiTi?! plans using following formula:
Rating = 10 - 25NS 5280L
Where N = Number of deficient sight distances
S = Standard stopping sight distance in feet
L = Length of section in miles
Approximately 5,300 m i . of the state (q) Rated in the field and relates to blind
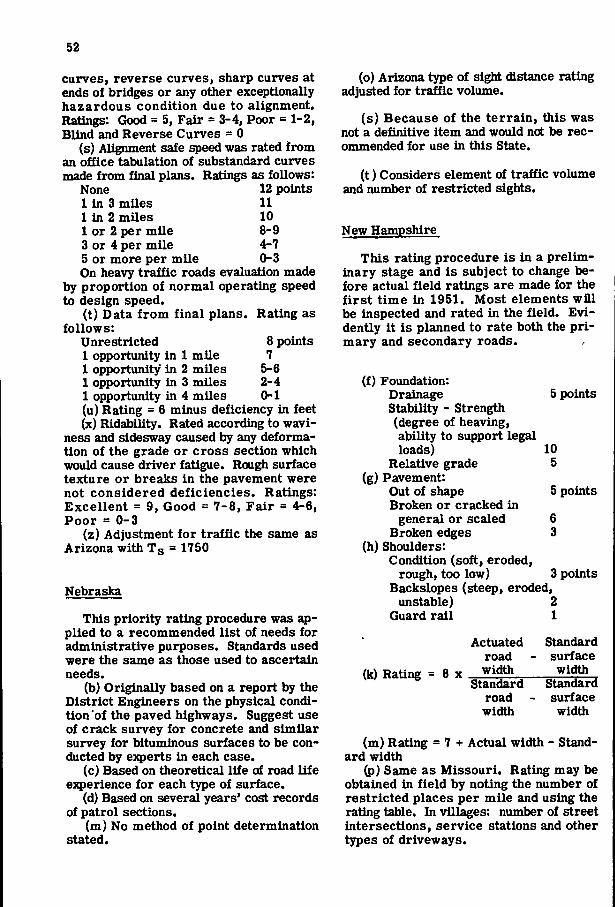
52
curves, reverse curves, sharp curves at ends of bridges or any other exceptionally hazardous condition due to alignment. Ratings: Good = 5, Fair = 3-4, Poor = 1-2, Blind and Reverse Curves = 0
(s) Alignment safe speed was rated from an office tabulation of substandard curves made from final plans. Ratings as follows:
None 12 points 1 in 3 miles 11 1 in 2 miles 10 1 or 2 per mile 8-9 3 or 4 per mile 4-7 5 or more per mile 0-3 On heavy traffic roads evaluation made
by proportion of normal operating speed to design speed.
(t) Data f rom f inal plans. Rating as follows:
Unrestricted 8 points 1 opportunity in 1 mile 7 1 opportunity" in 2 miles 5-6 1 opportunity in 3 miles 2-4 1 opportunity in 4 miles 0-1 (u) Rating = 6 minus deficiency in feet (x) Ridability. Rated according to wavi-
ness and sidesway caused by any deformation of the grade or cross section which would cause driver fatigue. Rough surface texture or breaks in the pavement were not considered deficiencies. Ratings: Excellent = 9, Good = 7-8, Fair = 4-6, Poor = 0-3
(z) Adjustment for traffic the same as Arizona with Tg = 1750
Nebraska
This priority rating procedure was applied to a recommended list of needs for administrative purposes. Standards used were the same as those used to ascertain needs.
(b) Originally based on a report by the District Engineers on the physical condition'of the paved highways. Suggest use of crack survey for concrete and similar survey for bituminous surfaces to be conducted by experts in each case.
(c) Based on theoretical life of road life e}q>erience for each type of surface.
(d) Based on several years' cost records of patrol sections.
(m) No method of point determination stated.
(o) Arizona type of sight distance rating adjusted for traffic volume.
(s) Because of the terrain, this was not a definitive item and would not be recommended for use in this State.
( t ) Considers element of traffic volume and number of restricted sights.
New Hampshire
This rating procedure is in a preliminary stage and is subject to change before actual field ratings are made for the f i r s t time in 1951. Most elements wi l l be inspected and rated in the field. Evidently i t is planned to rate both the p r i mary and secondary roads.
(f) Foundation: Drainage 5 points StabUity - Strength (degree of heaving, ability to support legal loads) 10
Relative grade 5 (g) Pavement:
Out of shape 5 points Broken or cracked in
general or scaled 6 Broken edges 3
(h) Shoulders: Condition (soft, eroded,
rough, too low) 3 points Backslopes (steep, eroded,
unstable) 2 Guard ra i l 1
(k) Rating = 8 x
Actuated road
width Standard
road width
Standard surface width
Standard surface width
(m) Rating = 7 + Actual width - Standard width
(p) Same as Missouri. Rating may be obtained in field by noting the number of restricted places per mile and using the rating table. In villages: number of street intersections, service stations and other types of driveways.
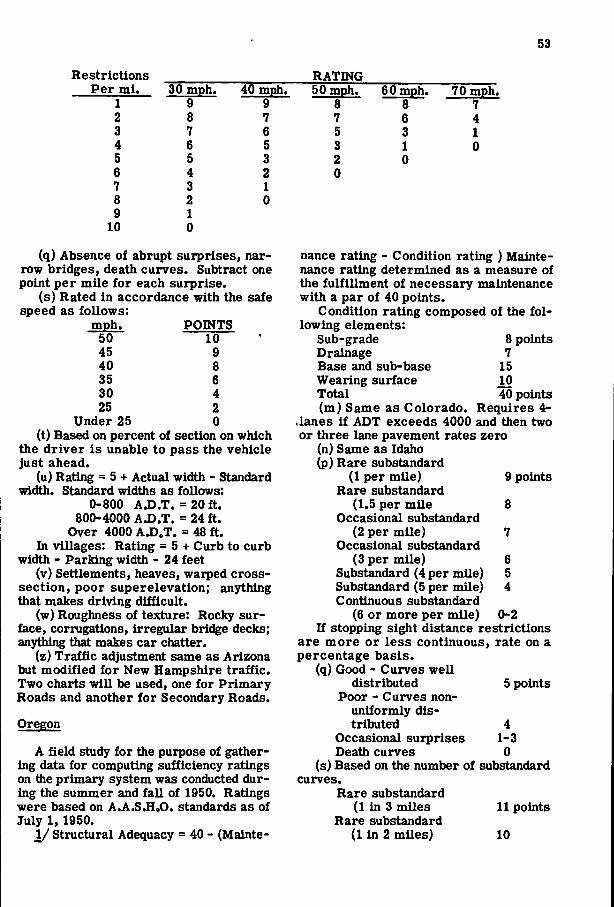
53
Restrictions RATING Per mi . 30 mph. 40 mph. 50 mph. 60 mph. 70 mph.
1 9 9 8 8 7 2 8 7 7 6 4 3 7 6 5 3 1 4 6 5 3 1 0 5 5 3 2 0 6 4 2 0 7 3 1 8 2 0 9 1
10 0
(q) Absence of abrupt surprises, narrow bridges, death curves. Subtract one point per mile for each surprise.
(s) Rated in accordance with the safe speed as follows:
mph. 50 45 40 35 30 25
Under 25
POINTS 10 9 8 6 4 2 0
(t) Based on percent of section on which the driver is unable to pass the vehicle just ahead.
(u) Rating = 5 + Actual width - Standard width. Standard widths as follows:
0-800 AJ).T. = 20 f t . 800-4000 A J).T. = 24 f t .
Over 4000 A J).T. = 48 f t . In villages: Rating = 5 + Curb to curb
width - Parking width - 24 feet (v) Settlements, heaves, warped cross-
section, poor superelevation; anything that makes driving difficult.
(w) Roughness of texture: Rocky surface, corrugations, irregular bridge decks; anything that makes car chatter.
(z) Traffic adjustment same as Arizona but modified for New Hampshire traff ic . Two charts wi l l be used, one for Primary Roads and another for Secondary Roads.
Oregon
A field study for the purpose of gathering data for computing sufficiency ratings on the primary system was conducted during the summer and fal l of 1950. Ratings were based on A.A.S.H0O. standards as of July 1, 1950.
_!/ Structural Adequacy = 40 - (Mainte
nance rating - Condition rating ) Maintenance rating determined as a measure of the fulfillment of necessary maintenance with a par of 40 points.
Condition rating composed of the fo l lowing elements:
Sub-grade 8 points Drainage 7 Base and sub-base 15 Wearing surface 10 Total 40 points (m) Same as Colorado. Requires 4-
.lanes i f ADT exceeds 4000 and then two or three lane pavement rates zero
(n) Same as Idaho (p) Rare substandard
(1 per mile) Rare substandard
(1.5 per mile Occasional substandard
(2 per mile) Occasional substandard
(3 per mile) Substandard (4 per mile) Substandard (5 per mile) Continuous substandard
(6 or more per mile) If stopping sight distance restrictions
are more or less continuous, rate on a percentage basis.
(q) Good - Curves well distributed
Poor - Curves non-uniformly distributed
Occasional surprises Death curves
(s) Based on the number of substandard curves.
Rare substandard (1 in 3 miles 11 points
Rare substandard (1 in 2 miles) 10
9 points
8
6 5 4
0-2
5 points
4 1-3 0
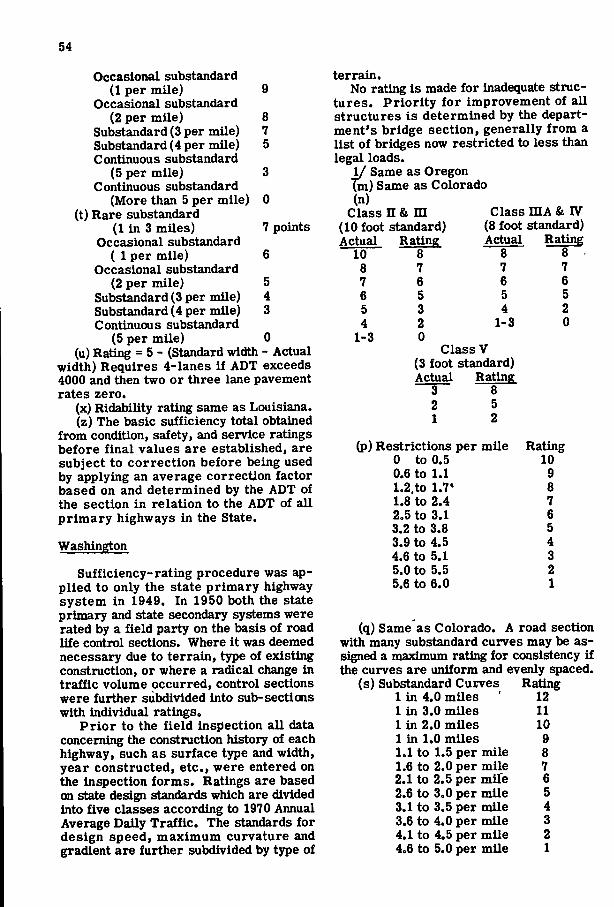
54
Occasional substandard (1 per mile) 9
Occasional substandard (2 per mile) 8
Substandard (3 per mile) 7 Substandard (4 per mile) 5 Continuous substandard
(5 per mile) 3 Continuous substandard
(More than 5 per mile) 0 (t) Rare substandard
(1 in 3 miles) 7 points Occasional substandard
( 1 per mile) 6 Occasional substandard
(2 per mile) 5 Substandard (3 per mile) 4 Substandard (4 per mile) 3 Continuous substandard
(5 per mile) 0 (u) Rating = 5 - (Standard width - Actual
width) Requires 4-lanes i f ADT exceeds 4000 and then two or three lane pavement rates zero.
(x) Ridability rating same as Louisiana, (z) The basic sufficiency total obtained
from condition, safety, and service ratings before f inal values are established, are subject to correction before being used by applying an average correction factor based on and determined by the ADT of the section in relation to the ADT of all primary highways in the State.
Washington
Sufficiency-rating procedure was applied to only the state primary highway system in 1949. In 1950 both the state primary and state secondary systems were rated by a field party on the basis of road life control sections. Where i t was deemed necessary due to terrain, type of existing construction, or where a radical change in traffic volume occurred, control sections were further subdivided into sub-sections with individual ratings.
Pr ior to the f ield inspection all data concerning the construction history of each highway, such as surface type and width, year constructed, etc., were entered on the inspection forms. Ratings are based on state design standards which are divided into tive classes according to 1970 Annual Average Daily Traffic. The standards for design speed, maximum curvature and gradient are further subdivided by type of
terrain. No rating is made for inadequate stzuc-
tures. Pr ior i ty for improvement of all structures is determined by the department's bridge section, generally from a list of bridges now restricted to less than legal loads.
1/ Same as Oregon un) Same as Colorado (n)
Class n & m Class niA & IV (10 foot standard) (8 foot standard) Actual Rating Actual Rating
10 8 8 8 8 7 7 7 7 6 6 6 6 5 5 5 5 3 4 2 4 2 1-3 0
1-3 0 Class V
(3 foot standard) Actual Rating
3 8 2 5 1 2
(p) Restrictions per mile Rating 0 to 0.5 10 0.6 to 1.1 9 1.2,to 1.7* 8 1.8 to 2.4 7 2.5 to 3.1 6 3.2 to 3.8 5 3.9 to 4.5 4 4.6 to 5.1 3 5.0 to 5.5 2 5.6 to 6.0 1
(q) Same as Colorado. A road section with many substandard curves may be assigned a maximum rating for consistency if the curves are uniform and evenly spaced,
(s) Substandard Curves Rating 1 in 4.0 miles 12 1 in 3.0 miles I I 1 in 2.0 miles 10 1 in 1.0 mUes 9 1.1 to 1.5 per mile 8 1.6 to 2.0 per mile 7 2.1 to 2.5 per mile 6 2.6 to 3.0 per mile 5 3.1 to 3.5 per mile 4 3.6 to 4.0 per mile 3 4.1 to 4.5 per mile 2 4.6 to 5.0 per mile 1
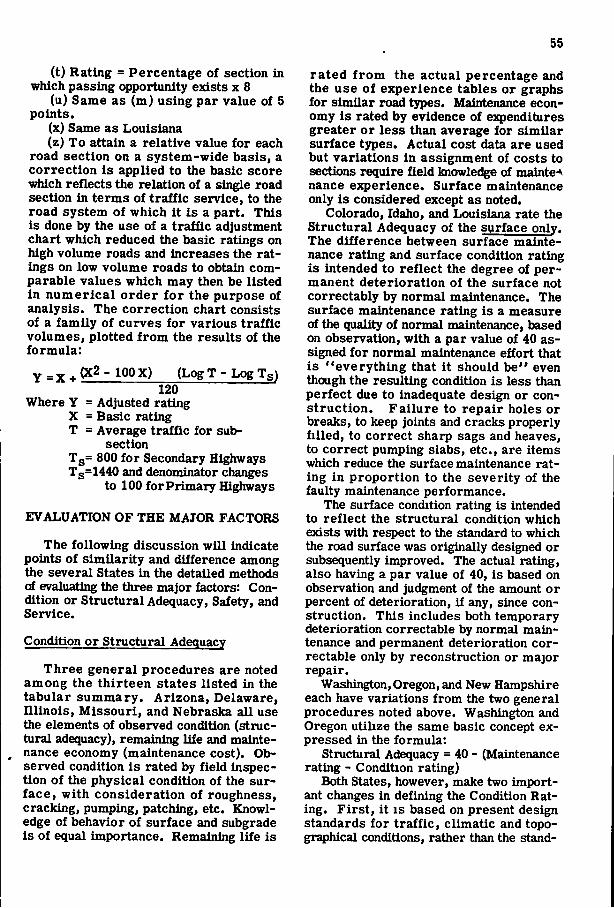
55
(t) Rating = Percentage of section in which passing opportunity exists x 8
(u) Same as (m) using par value of 5 points.
(x) Same as Louisiana (z) To attain a relative value for each
road section on a system-wide basis, a correction is applied to the basic score which reflects the relation of a single road section in terms of t raff ic service, to the road system of which i t is a part. This is done by the use of a traffic adjustment chart which reduced the basic ratings on high volume roads and increases the ratings on low volume roads to obtain comparable values which may then be listed in numerical order f o r the purpose of analysis. The correction chart consists of a family of curves for various traffic volumes, plotted f rom the results of the formula:
V = Y . . . ( X 2 - l O O X ) (LogT-LogTs) 120
Where Y = Adjusted rating X = Basic rating T = Average traffic for sub
section Ts= 800 for Secondary Highways Ts=1440 and denominator changes
to 100 for Primary Highways
EVALUATION OF THE MAJOR FACTORS
The following discussion wi l l indicate points of similarity and difference among the several States in the detailed methods of evaluating the three major factors: Condition or Structural Adequacy, Safety, and Service.
Condition or Structural Adequacy
Three general procedures are noted among the thirteen states listed in the tabular summary. Arizona, Delaware, I l l inois , Missouri, and Nebraska all use the elements of observed condition (structural adequacy), remaining life and maintenance economy (maintenance cost). Observed condition i s rated by field inspection of the physical condition of the surface, with consideration of roughness, cracking, pumping, patching, etc. Knowledge of behavior of surface and subgrade is of equal importance. Remaining life is
rated f r o m the actual percentage and the use of experience tables or graphs for similar road types. Maintenance economy is rated by evidence of e^enditures greater or less than average for similar surface types. Actual cost data are used but variations in assignment of costs to sections require field knowledge of mainte-^ nance experience. Surface maintenance only is considered except as noted.
Colorado, Idaho, and Louisiana rate the Structural Adequacy of the surface only. The difference between surface maintenance rating and surface condition rating is intended to reflect the degree of permanent deterioration of the surface not correctably by normal maintenance. The surface maintenance rating is a measure of the quality of normal maintenance, based on observation, with a par value of 40 assigned for normal maintenance effort that is "everything that i t should be" even though the resulting condition is less than perfect due to inadequate design or construct ion. Failure to repair holes or breaks, to keep joints and cracks properly f i l led, to correct sharp sags and heaves, to correct pumping slabs, etc., are items which reduce the surface maintenance rating in proportion to the severity of the faulty maintenance performance.
The surface condition rating is intended to reflect the structural condition which exists with respect to the standard to which the road surface was originally designed or subsequently improved. The actual rating, also having a par value of 40, is based on observation and judgment of the amount or percent of deterioration, if any, since construction. This includes both temporary deterioration correctable by normal maintenance and permanent deterioration correctable only by reconstruction or major repair.
Washington, Oregon, and New Hampshire each have variations from the two general procedures noted above. Washington and Oregon utilize the same basic concept expressed in the formula:
Structural Adequacy = 40 - (Maintenance rating - Condition rating)
Both States, however, make two important changes in defining the Condition Rating. Firs t , i t IS based on present design standards for t ra f f ic , climatic and topographical conditions, rather than the stand-
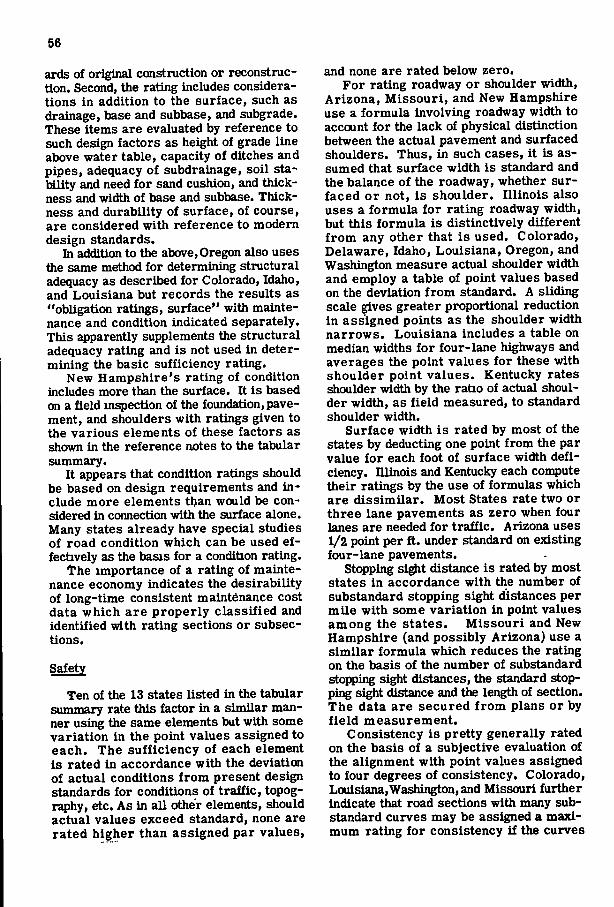
56
ards of original construction or reconstruction. Second, the rating includes considerations in addition to the surface, such as drainage, base and subbase, and subgrade. These items are evaluated by reference to such design factors as height of grade line above water table, capacity of ditches and pipes, adequacy of subdrainage, soil stability and need for sand cushion, and thickness and width of base and subbase. Thickness and durability of surface, of course, are considered with reference to modern design standards.
In addition to the above, Oregon also uses the same method for determining structural adequacy as described for Colorado, Idaho, and Louisiana but records the results as "obligation ratings, surface" with maintenance and condition Indicated separately. This apparently supplements the structural adequacy rating and is not used in determining the basic sufficiency rating.
New Hampshire's rating of condition includes more than the surface. It is based on a field mspection of the foundation, pavement, and shoulders with ratings given to the various elements of these factors as shown in the reference notes to the tabular summary.
It appears that condition ratings should be based on design requirements and i n clude more elements than would be considered in connection with the surface alone. Many states already have special studies of road condition which can be used effectively as the basis for a condition rating.
The importance of a rating of maintenance economy indicates the desirability of long-time consistent maintenance cost data which are properly classified and identified with rating sections or subsections.
Safety
Ten of the 13 states listed in the tabular summary rate this factor in a similar manner using the same elements but with some variation in the point values assigned to each. The sufficiency of each element is rated in accordance with the deviation of actual conditions f rom present design standards for conditions of traffic, topography, etc. As in all other elements, should actual values exceed standard, none are rated higher than assigned par values.
and none are rated below zero. For rating roadway or shoulder width,
Arizona, Missouri, and New Hampshire use a formula involving roadway width to account for the lack of physical distinction between the actual pavement and surfaced shoulders. Thus, in such cases, i t is assumed that surface width is standard and the balance of the roadway, whether surfaced or not, is shoulder. Illinois also uses a formula for rating roadway width, but this formula is distinctively different f rom any other that is used. Colorado, Delaware, Idaho, Louisiana, Oregon, and Washington measure actual shoulder width and employ a table of point values based on the deviation from standard. A sliding scale gives greater proportional reduction in assigned points as the shoulder width narrows. Louisiana includes a table on median widths for four-lane highways and averages the point values for these with shoulder point values. Kentucky rates shoulder width by the ratio of actual shoulder width, as field measured, to standard shoulder width.
Surface width is rated by most of the states by deducting one point from the par value for each foot of surface width deficiency. Illinois and Kentucky each compute their ratings by the use of formulas which are dissimilar. Most States rate two or three lane pavements as zero when four lanes are needed for traffic. Arizona uses 1/2 point per f t . under standard on existing four-lane pavements.
Stopping sight distance is rated by most states in accordance with the number of substandard stopping sight distances per mile with some variation in point values among the states. Missouri and New Hampshire (and possibly Arizona) use a similar formula which reduces the rating on the basis of the number of substandard stopping sight distances, the standard stopping sight distance and the length of section. The data are secured f rom plans or by f ie ld measurement.
Consistency is pretty generally rated on the basis of a subjective evaluation of the alignment with point values assigned to four degrees of consistency. Colorado, Louisiana,Washington, and Missouri further Indicate that road sections with many substandard curves may be assigned a maximum rating for consistency i f the curves
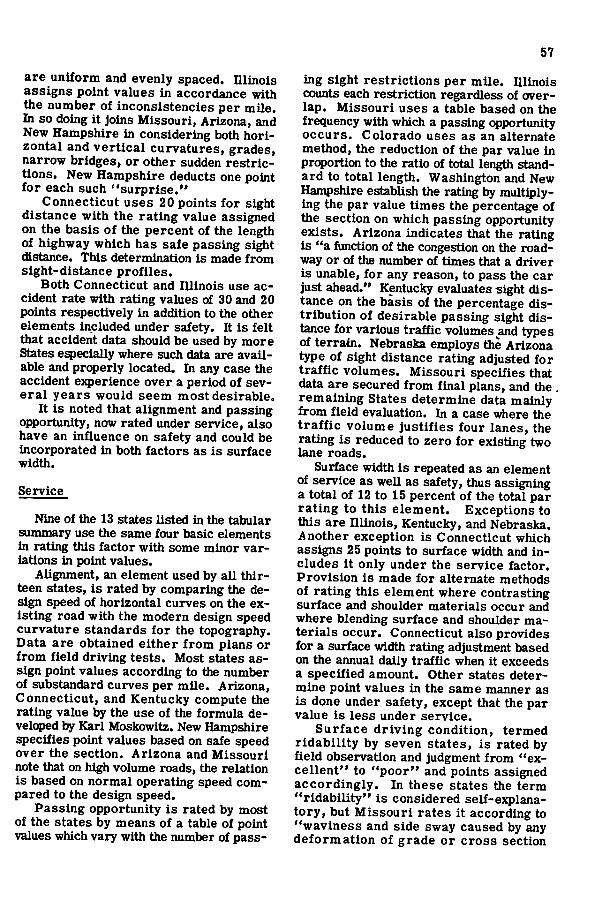
57
are uniform and evenly spaced. Illinois assigns point values in accordance with the number of inconsistencies per mile. In so doing i t joins Missouri, Arizona, and New Hampshire in considering both horizontal and vert ical curvatures, grades, narrow bridges, or other sudden restrictions. New Hampshire deducts one point for each such "surprise."
Connecticut uses 20 points for sight distance with the rating value assigned on the basis of the percent of the length of highway which has safe passing sight distance. This determination is made from sight-distance profiles.
Both Connecticut and Illinois use accident rate with rating values of 30 and 20 points respectively in addition to the other elements included under safety. It is felt that accident data should be used by more States especially where such data are available and properly located. In any case the accident experience over a period of several years would seem most desirable.
It is noted that alignment and passing opportunity, now rated under service, also have an influence on safety and could be incorporated in both factors as is surface width.
Service
Nine of the 13 states Usted in the tabular summary use the same four basic elements in rating this factor with some minor variations in point values.
Alignment, an element used by all thirteen states, is rated by comparing the design speed of horizontal curves on the existing road with the modern design speed curvature standards for the topography. Data are obtained either f rom plans or from field driving tests. Most states assign point values according to the number of substandard curves per mile. Arizona, Connecticut, and Kentucky compute the rating value by the use of the formula developed by Karl Moskowitz. New Hampshire specifies point values based on safe speed over the section. Arizona and Missouri note that on high volume roads, the relation is based on normal operating speed compared to the design speed.
Passing opportunity is rated by most of the states by means of a table of point values which vary with the number of pass
ing sight restrictions per mile. Illinois counts each restriction regardless of overlap. Missouri uses a table based on the frequency with which a passing opportunity occurs. Colorado uses as an alternate method, the reduction of the par value in proportion to the ratio of total length standard to total length. Washington and New Hampshire establish the rating by multq>ly-ing the par value times the percentage of the section on which passing opportunity exists. Arizona indicates that the rating is "a function of the congestion on the roadway or of the number of times that a driver is unable, for any reason, to pass the car just ahead." Kentucky evaluates sight distance on the basis of the percentage distribution of desirable passing sight distance for various traffic volumes and types of terrain. Nebraska employs the Arizona type of sight distance rating adjusted for traff ic volumes. Missouri specifies that data are secured from final plans, and the . remaining States determine data mainly from field evaluation. In a case where the t r a f f i c volume justifies four lanes, the rating is reduced to zero for existing two lane roads.
Surface width is repeated as an element of service as well as safety, thus assigning a total of 12 to 15 percent of the total par rating to this element. Exceptions to this are Illinois, Kentucky, and Nebraska. Another exception is Connecticut which assigns 25 points to surface width and in cludes i t only under the service factor. Provision is made for alternate methods of rating this element where contrasting surface and shoulder materials occur and where blending surface and shoulder materials occur. Connecticut also provides for a surface width rating adjustment based on the annual daily traffic when it exceeds a specified amount. Other states determine point values in the same manner as is done under safety, except that the par value is less under service.
Surface dr iv ing condition, termed r idabi l i ty by seven states, is rated by field observation and judgment from "excellent" to "poor" and points assigned accordingly. In these states the term "r idabi l i ty" is considered self-explanatory, but Missouri rates i t according to "waviness and side sway caused by any deformation of grade or cross section
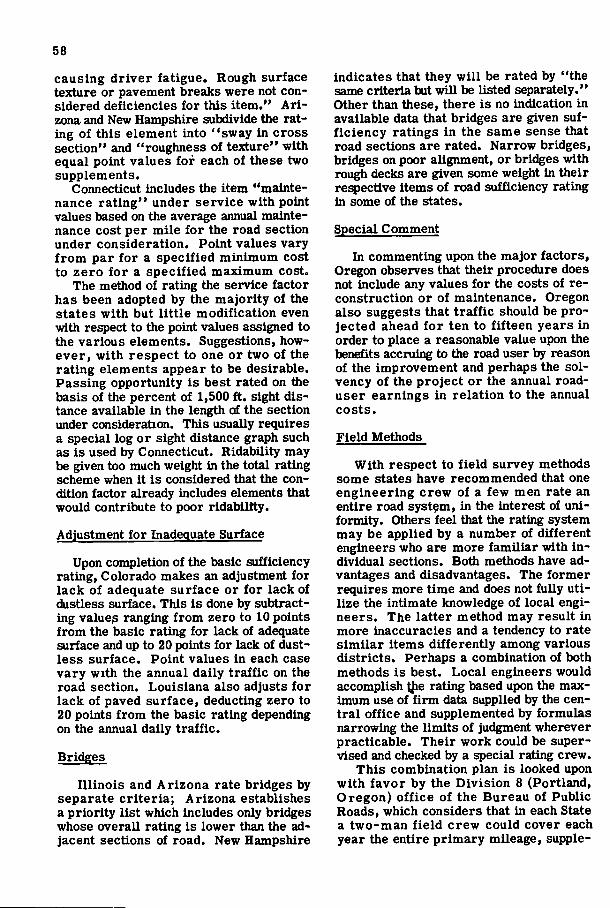
58
causing driver fatigue. Rough surface texture or pavement breaks were not considered deficiencies for this i tem." A r i zona and New Hampshire subdivide the rating of this element into "sway in cross section" and "roughness of texture" with equal point values for each of these two supplements.
Connecticut includes the item "maintenance ra t ing" under service with point values based on the average annual maintenance cost per mile for the road section under consideration. Point values vary f r o m par for a specified minimum cost to zero fo r a specified maximum cost.
The method of rating the service factor has been adopted by the majority of the states with but l i t t le modification even with respect to the point values assigned to the various elements. Suggestions, however, with respect to one or two of the rating elements appear to be desirable. Passing opportunity is best rated on the basis of the percent of 1,500 f t . sight distance available in the length of the section under consideration. This usuaUy requires a special log or sight distance graph such as is used by Connecticut. Ridability may be given too much weight in the total rating scheme when it is considered that the condition factor already includes elements that would contribute to poor ridability.
Adjustment for Inadequate Surface
Upon completion of the basic sufficiency rating, Colorado makes an adjustment for lack of adequate surface or for lack of dustless surface. This is done by subtracting value;5 ranging from zero to 10 points from the basic rating for lack of adequate surface and up to 20 points for lack of dust-less surface. Point values in each case vary with the annual daily traffic on the road section. Louisiana also adjusts fo r lack of paved surface, deducting zero to 20 points from the basic rating depending on the annual dally t raff ic .
Bridges
I l l inois and Arizona rate bridges by separate cri teria; Arizona establishes a priority list which includes only bridges whose overall rating is lower than the adjacent sections of road. New Hampshire
indicates that they w i l l be rated by "the same criteria but wil l be listed separately." Other than these, there is no indication in available data that bridges are given sufficiency ratings in the same sense that road sections are rated. Narrow bridges, bridges on poor alignment, or bridges with rough decks are given some weight in their respective items of road sufficiency rating in some of the states.
Special Comment
In commenting upon the major factors, Oregon observes that their procedure does not include any values for the costs of reconstruction or of maintenance. Oregon also suggests that t raff ic should be projected ahead f o r ten to fifteen years in order to place a reasonable value upon the benefits accruing to the road user by reason of the improvement and perhaps the solvency of the project or the annual road-user earnings in relation to the annual costs.
Field Methods^
With respect to f ield survey methods some states have recommended that one engineering crew of a few men rate an entire road system, in the interest of uniformity. Others feel that the rating system may be applied by a number of different engineers who are more familiar with in dividual sections. Both methods have advantages and disadvantages. The former requires more time and does not fully u t i lize the Intimate knowledge of local engineers. The latter method may result in more inaccuracies and a tendency to rate similar items differently among various districts. Perhaps a combination of both methods is best. Local engineers would accomplish t}ie rating based upon the maximum use of f i rm data supplied by the centra l office and supplemented by formulas narrowing the limits of judgment wherever practicable. Their work could be supervised and checked by a special rating crew.
This combination plan is looked upon with favor by the Division 8 (Portland, Oregon) office of the Bureau of Public Roads, which considers that In each State a two-man f ie ld crew could cover each year the entire primary mileage, supple-
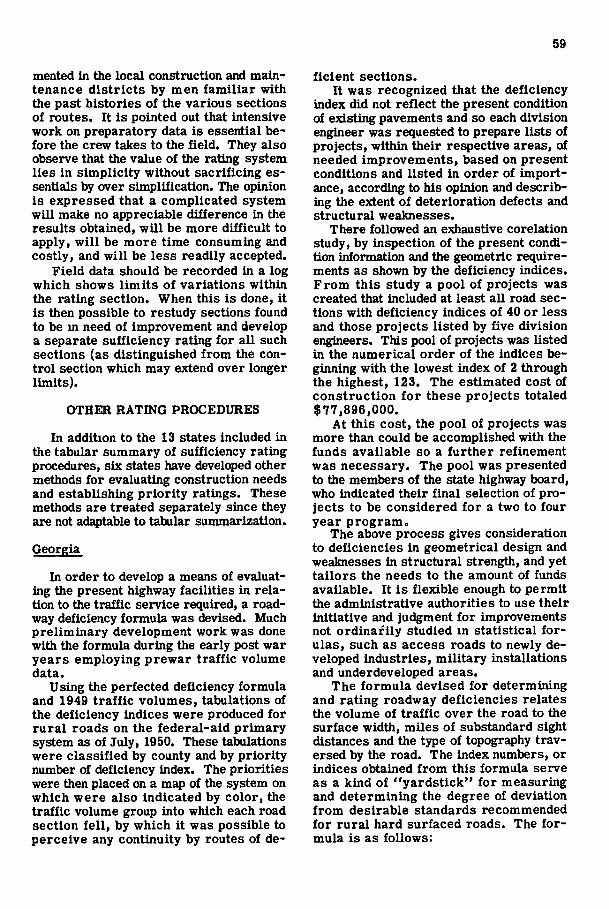
59
mented in the local construction and maintenance districts by men familiar with the past histories of the various sections of routes. It is pointed out that intensive work on preparatory data is essential before the crew takes to the field. They also observe that the value of the rating system lies in simplicity without sacrificing essentials by over simplification. The opinion is expressed that a complicated system wil l make no appreciable difference in the results obtained, w i l l be more difficult to apply, w i l l be more time consuming and costly, and w i l l be less readily accepted.
Field data should be recorded in a log which shows l imi ts of variations within the rating section. When this is done, i t is then possible to restudy sections found to be m need of improvement and develop a separate sufficiency rating for all such sections (as distinguished from the control section which may extend over longer limits).
OTHER RATING PROCEDURES
In addition to the 13 states included in the tabular summary of sufficiency rating procedures, six states have developed other methods for evaluating construction needs and establishing priority ratings. These methods are treated separately since they are not adaptable to tabular summarization.
Georgia
In order to develop a means of evaluating the present highway facilities in relation to the traffic service required, a roadway deficiency formula was devised. Much preliminary development work was done with the formula during the early post war years employing prewar traffic volume data.
Using the perfected deficiency formula and 1949 t raff ic volumes, tabulations of the deficiency indices were produced for rura l roads on the federal-aid primary system as of July, 1950. These tabulations were classified by county and by priority number of deficiency index. The priorities were then placed on a map of the system on which were also indicated by color, the traffic volume group into which each road section f e l l , by which i t was possible to perceive any continuity by routes of de
ficient sections. It was recognized that the deficiency
index did not reflect the present condition of existing pavements and so each division engineer was requested to prepare lists of projects, within their respective areas, of needed improvements, based on present conditions and listed in order of importance, according to his opinion and describing the extent of deterioration defects and structural weaknesses.
There followed an exhaustive corelation study, by inspection of the present condition information and the geometric requirements as shown by the deficiency indices. From this study a pool of projects was created that included at least all road sections with deficiency indices of 40 or less and those projects listed by five division engineers. This pool of projects was listed in the numerical order of the indices beginning with the lowest index of 2 through the highest, 123. The estimated cost of construction fo r these projects totaled $77,896,000.
At this cost, the pool of projects was more than could be accomplished with the funds available so a further refinement was necessary. The pool was presented to the members of the state highway board, who indicated their final selection of projects to be considered for a two to four year program.
The above process gives consideration to deficiencies in geometrical design and weaknesses in structural strength, and yet tailors the needs to the amount of funds available. It is flexible enough to permit the administrative authorities to use their initiative and judgment for improvements not ordinarily studied m statistical for-ulas, such as access roads to newly developed industries, military installations and underdeveloped areas.
The formula devised for determining and rating roadway deficiencies relates the volume of traffic over the road to the surface width, miles of substandard sight distances and the type of topography traversed by the road. The index numbers, or indices obtained from this formula serve as a kind of "yardst ick" for measuring and determining the degree of deviation f rom desirable standards recommended for rural hard surfaced roads. The formula is as follows:
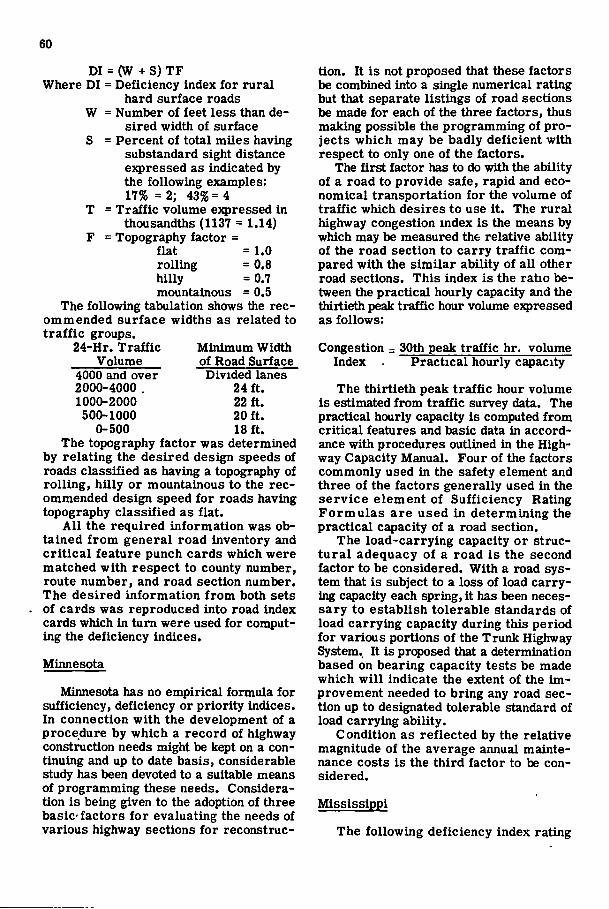
60
DI = (W + S) TF Where DI = Deficiency index for rural
hard surface roads W = Number of feet less than de
sired width of surface S = Percent of total mUes having
substandard sight distance e:5)ressed as indicated by the following examples: 17% =2; 43%= 4
T = Traffic volume expressed in thousandths (1137 = 1.14)
F = Topography factor = flat = 1.0 rolling = 0.8 hilly = 0.7 mountainous =0.5
The following tabulation shows the recommended surface widths as related to t ra f f ic groups.
24-Hr. Traffic Minimum Width Volume of Road Surface
4000 and over 2000-4000 . 1000-2000 500-1000
0-500
Divided lanes 24 f t . 22 f t . 20 f t . 18 f t .
The topography factor was determined by relating the desired design speeds of roads classified as having a topography of rolling, hilly or mountainous to the recommended design speed for roads having topography classified as flat.
A l l the required information was obtained f rom general road inventory and cr i t ical feature punch cards which were matched with respect to county number, route number, and road section number. The desired information f rom both sets of cards was reproduced into road index cards which in turn were used for computing the deficiency indices.
Minnesota
Minnesota has no empirical formula for sufficiency, deficiency or priority indices. In connection with the development of a procedure by which a record of highway construction needs might be kept on a continuing and up to date basis, considerable study has been devoted to a suitable means of programming these needs. Consideration is being given to the adoption of three basic- factors for evaluating the needs of various highway sections for reconstruc
tion. It is not proposed that these factors be combined into a single numerical rating but that separate listings of road sections be made for each of the three factors, thus making possible the programming of projects which may be badly deficient with respect to only one of the factors.
The first factor has to do with the ability of a road to provide safe, rapid and economical transportation for the volume of traffic which desires to use i t . The rural highway congestion mdex is the means by which may be measured the relative ability of the road section to carry traffic compared with the similar ability of all other road sections. This index is the ratio between the practical hourly capacity and the thirtieth peak traffic hour volume expressed as follows:
Congestion = 30th peak traffic hr. volume Index Practical hourly capacity
The thirtieth peak traffic hour volume is estimated from traffic survey data. The practical hourly capacity is computed from critical features and basic data in accordance with procedures outlined in the Highway Capacity Manual. Four of the factors commonly used in the safety element and three of the factors generally used in the service element of Sufficiency Rating Formulas are used in determining the practical capacity of a road section.
The load-carrying capacity or structu ra l adequacy of a road is the second factor to be considered. With a road system that is subject to a loss of load carrying capacity each spring, i t has been necessary to establish tolerable standards of load carrying capacity during this period for various portions of the Trunk Highway System. It is proposed that a determination based on bearing capacity tests be made which w i l l indicate the extent of the improvement needed to bring any road section up to designated tolerable standard of load carrying ability.
Condition as reflected by the relative magnitude of the average annual maintenance costs is the third factor to be considered.
Mississippi
The following deficiency index rating
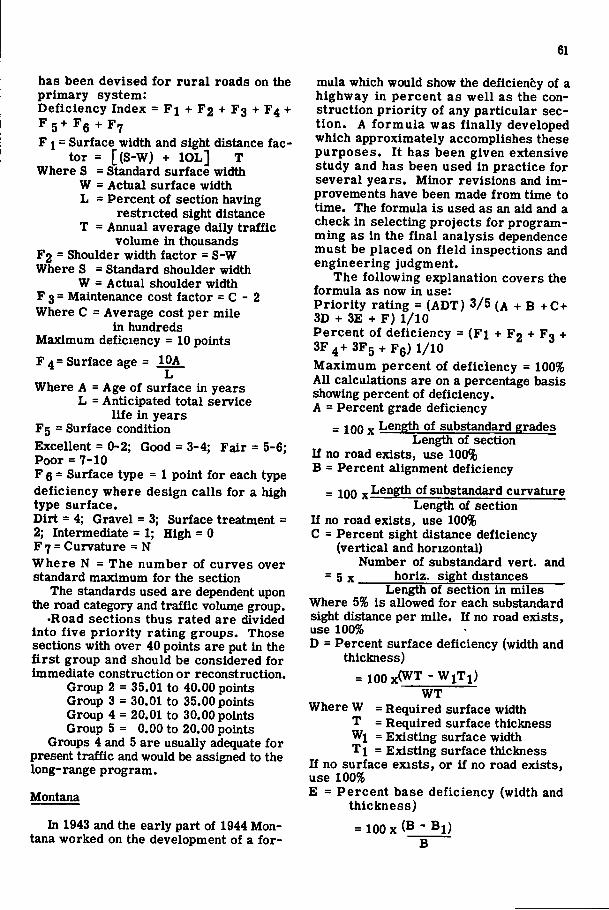
61
has been devised for rural roads on the primary system: Deficiency Index = F i + F2 + F3 + F4 +
F 1 = Surface width and sight distance factor = [(S-W) + l O L ] T
Where S = Standard surface width W = Actual surface width L = Percent of section having
restricted sight distance T = Annual average daily traffic
volume in thousands F2 = Shoulder width factor = S-W Where S = Standard shoulder width
W = Actual shoulder width F 3 = Maintenance cost factor = C - 2 Where C = Average cost per mile
in hundreds Maximum deficiency = 10 points F 4 = Surface age = lOA
L Where A = Age of surface in years
L = Anticipated total service l ife in years
F5 = Surface condition Excellent = 0-2; Good = 3-4; Fair = 5-6; Poor = 7-10 F 6 = Surface type = 1 point for each type deficiency where design calls for a high type surface. Dirt = 4; Gravel = 3; Surface treatment = 2; Intermediate = 1; High = 0 F7 = Curvature = N Where N = The number of curves over standard maximum for the section
The standards used are dependent upon the road category and traffic volume group.
•Road sections thus rated are divided into five pr ior i ty rating groups. Those sections with over 40 points are put in the f i r s t group and should be considered for immediate construction or reconstruction.
Group 2 = 35.01 to 40.00 points Group 3 = 30.01 to 35.00 points Group 4 = 20.01 to 30.00 points Group 5 = 0.00 to 20.00 points
Groups 4 and 5 are usually adequate for present traffic and would be assigned to the long-range program.
Montana
In 1943 and the early part of 1944 Montana worked on the development of a for
mula which would show the deficienfcy of a highway in percent as well as the construction priori ty of any particular sect ion . A formula was finally developed which approximately accomplishes these purposes. I t has been given extensive study and has been used in practice for several years. Minor revisions and improvements have been made from time to time. The formula is used as an aid and a check in selecting projects for programming as in the final analysis dependence must be placed on f ie ld inspections and engineering judgment.
The following explanation covers the formula as now in use: Priori ty rating = (ADT) 3/5 (A + B + C+ 3D + 3E + F) 1/10 Percent of deficiency = ( F i + F2 + F3 + 3F4+3F5 + F6) 1/10 Maximum percent of deficiency = 100% All calculations are on a percentage basis showing percent of deficiency. A = Percent grade deficiency
- ^ Length of substandard grades Length of section
If no road exists, use 100% B = Percent alignment deficiency
_ ^ Length of substandard curvature Length of section
If no road exists, use 100% C = Percent sight distance deficiency
(vertical and horizontal) Number of substandard vert, and
= 5 X horiz. sight distances Length of section in miles
Where 5% is allowed for each substandard sight distance per mile. If no road exists, use 100% D = Percent surface deficiency (width and
thickness) = 1 0 0 x ( W T - W i T i )
WT Where W = Required surface width
T = Required surface thickness Wj = Existing surface width T i = Existing surface thickness
If no surface exists, or if no road exists, use 100% E = Percent base deficiency (width and
thickness)
= 1 0 0 x ( B - B l ) B
62
Where B = Required base thickness Bi= Existing base thickness
li no base exists, or if no road exists, use 100% F = Percent roadbed width deficiency
= ioox<R - R i ) R
Where R = Required roadbed width R j = Existing roadbed width
If no road exists, use 100% The traffic factor (ADT) used is based
upon 1947 traffic multiplied by 125 percent to represent estimated traffic for 1965 and the volume that should be used for design purposes.
Before any computations are made, each piece of road is rated "good", " f a i r " , "poor", or "worn out", according to the present condition of the surfacing and base. This rating is based on the latest Public Roads' maintenance inspection. Where a road is classified as "good", fu l l value is given to the present surfacing and base thickness. Where the road is classified as " fa i r " ' , two thirds value is given and where classified as "poor" , one third value is given. Roads classified as "worn out" receive no value for surfacing and base thickness.
The standards adopted for comparing each section of road were those approved by the American Association of State Highway Officials, or better. Only the 40 and 60 mph. design speeds as applied to mixed traffic were used. The sections employing 40 mph. design standards were all in the mountains where cost would be prohibitive to design for a 60-mph. speed.
New York
The necessity for some means of determining the actual needs of the highway system led to the development of the fo l lowing method of measuring deficiencies and rating highway sections with respect to their relative deficiencies.
The data were gathered from existing records and plans supplemented by field observations by experienced engineers. Appraisal of each road section was made by use of a scoring system with ratings for structural adequacy, safety, and service which were based on the existing physical conditions. Structural Adequacy = 35 points
R.O.W. = 5 points Ditches and Drainage = 2.5 Shoulders =2.0 Backslopes =0.5
Subgrade = 10 points Stability - Strength = 8.0 Relative Grade = 2.0
Pavement = 10 points Surface = 4.0 Heaved - Separated = 2.0 Broken - Cracked = 4.0
Life as is = 10 points Safety = 33 points
Pavement = 10 points Joints, Edges, Bumps, Warps = 6.0 Drainage To = 2.0 Texture = 2.0
R.O.W. = 8 points Shoulders =4.0 Guide Rail = 1.6 Marginal Friction = 1.6 Hazard at Structure = 0.8
Sight Distance = 15 points Curve, Grade, Trees-Planting, Structures
Service = 32 points Alignment (Speed) = 12 points
Curves, Grades, Bottlenecks Passing Opportunity = 10 points
Curves, Grades, Marginal Friction Ridability = 10 points
Warped uneven surface =7.0 Roughness - Surface = 3.0
Each sequence section was rated for traffic capacity using the factors of pavement width and weighted score for right of way conditions, sight distance and percentage of trucks in relation to the type of terrain traversed by the highway. The product of these three factors and the one way peak hour capacity for uninterrupted flow gave the adjusted or practical oneway peak-hour capacity. The difference between the average rated capacity and the average peak hour volume was used to determine the present deficiency or excess capacity. Anticipated deficiency was determined by using anticipated one-way peak-hour volumes for 1955, 1960, and 1965.
An accident index was computed for each capacity-rated section of road. The number of accidents of each type occurring in the section was multiplied by the appropriate frequency factor and the resulting numbers summed. The factors used were based on the frequency of occurrence
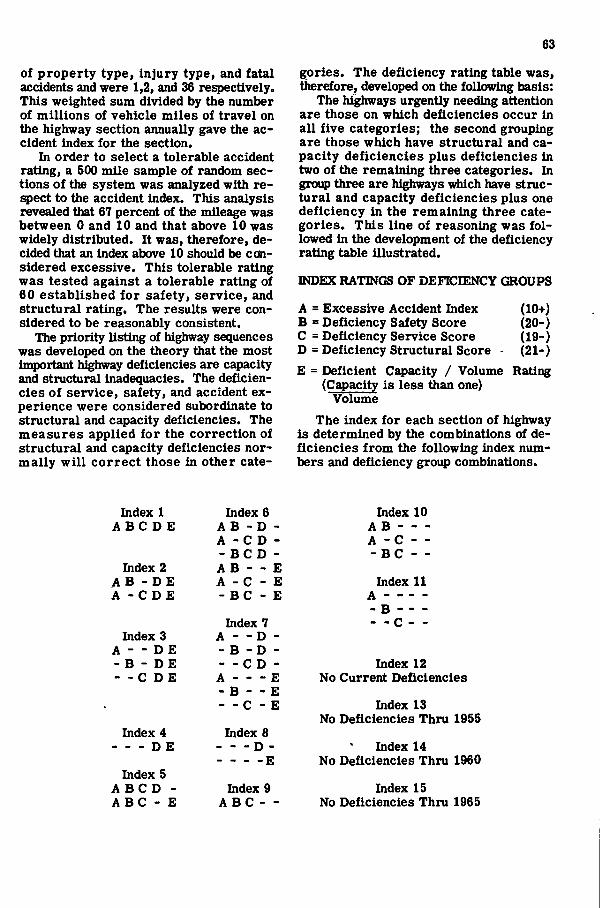
63
of property type, injury type, and fatal accidents and were 1,2, and 36 respectively. This weighted sum divided by the number of millions of vehicle miles of travel on the highway section annually gave the accident index for the section.
In order to select a tolerable accident rating, a 500 mile sample of random sections of the system was analyzed with rej e c t to the accident index. This analysis revealed that 67 percent of the mileage was between 0 and 10 and that above 10 was widely distributed. It was, therefore, decided that an index above 10 should be considered excessive. This tolerable rating was tested against a tolerable rating of 60 established for safety, service, and structural rating. The results were considered to be reasonably consistent.
The priority listing of highway sequences was developed on the theory that the most important highway deficiencies are capacity and structural inadequacies. The deficiencies of service, safety, and accident experience were considered subordinate to structural and capacity deficiencies. The measures applied for the correction of structural and capacity deficiencies normally w i l l correct those in other cate
gories. The deficiency rating table was, therefore, developed on the following basis:
The highways urgently needing attention are those on which deficiencies occur in all five categories; the second grouping are those which have structural and capacity deficiencies plus deficiencies in two of the remaining three categories. In group three are highways which have structural and capacity deficiencies plus one deficiency in the remaining three categories. This line of reasoning was fo l lowed in the development of the deficiency rating table illustrated.
INDEX RATINGS OF DEFICIENCY GROUPS
A = Excessive Accident Index (10+) B = Deficiency Safety Score (20-) C = Deficiency Service Score (19-) D = Deficiency Structural Score - (21-) E = Deficient Capacity / Volume Rating
(Capacity is less than one) Volume
The index for each section of highway is determined by the combinations of deficiencies from the following index numbers and deficiency group combinations.
Index 1 Index 6 Index 10 A BC D E A B - D - A B
A - C D - A - C - -- BC D - - BC - -
Index 2 A B - - E A B - D E A - C - E Index 11 A - C D E - B C - E A
- B Index 7 - - c - -Index 3 A - - D -
A - - D E - B - D -- B - D E - - C D - Index 12 - - C D E A E
- B - - E No Current Deficiencies
- - C - E Index 13 No Deficiencies Thru 1955
Index 4 Index 8 D E D - Index 14
E No Deficiencies Thru 1960 Index 5
A B C D - Index 9 Index 15 A B C - E A BC - - No Deficiencies Thru 1965
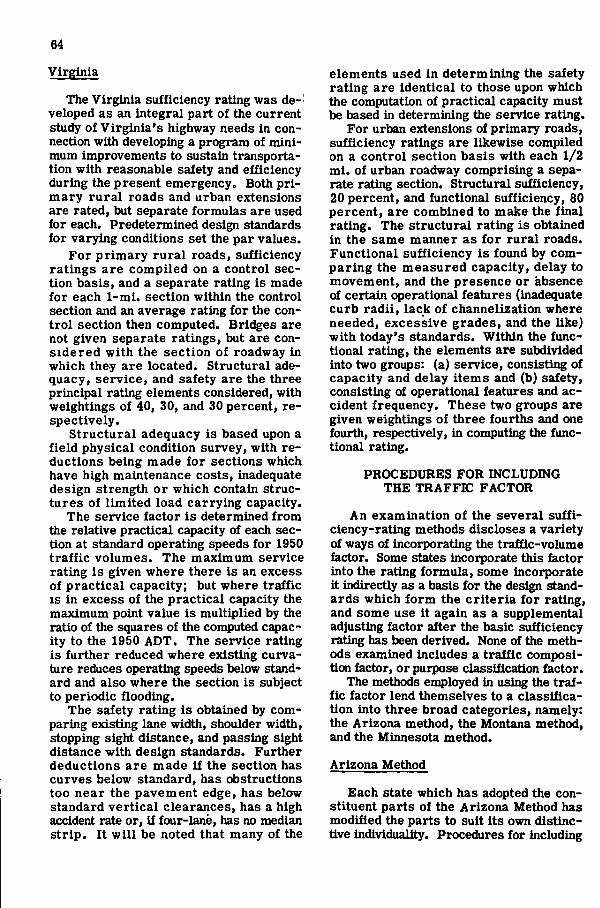
64
Virginia
The Virginia sufficiency rating was de- veloped as an integral part of the current study of Virginia's highway needs in connection with developing a program of minimum improvements to sustain transportation with reasonable safety and efficiency during the present emergency. Both p r i mary rura l roads and urban extensions are rated, but separate formulas are used for each. Predetermined design standards for varying conditions set the par values.
For primary rural roads, sufficiency ratings are compiled on a control section basis, and a separate rating is made for each 1-mi. section within the control section and an average rating for the cont ro l section then computed. Bridges are not given separate ratings, but are considered with the section of roadway in which they are located. Structural adequacy, service, and safety are the three principal rating elements considered, with weightings of 40, 30, and 30 percent, respectively.
Structural adequacy is based upon a field physical condition survey, with reductions being made for sections which have high maintenance costs, inadequate design strength or which contain structures of limited load carrying capacity.
The service factor is determined from the relative practical capacity of each section at standard operating speeds for 1950 traff ic volumes. The maximum service rating is given where there is an excess of practical capacity; but where traffic I S in excess of the practical capacity the maximum point value is multiplied by the ratio of the squares of the computed edacity to the 1950 ADT. The service rating is further reduced where existing curvature reduces operating speeds below standard and also where the section is subject to periodic flooding.
The safety rating is obtained by comparing existing lane width, shoulder width, stopping sight distance, and passing sight distance with design standards. Further deductions are made if the section has curves below standard, has obstructions too near the pavement edge, has below standard vertical clearances, has a high accident rate or, if four-lane, has no median str ip. I t w i l l be noted that many of the
elements used in determining the safety rating are identical to those upon which the computation of practical capacity must be based in determining the service rating.
For urban extensions of primary roads, sufficiency ratings are likewise compiled on a control section basis with each 1/2 mi . of urban roadway comprising a separate rating section. Structural sufficiency, 20 percent, and functional sufficiency, 80 percent, are combined to make the final rating. The structural rating is obtained in the same manner as for rural roads. Functional sufficiency is found by comparing the measured capacity, delay to movement, and the presence or absence of certain operational features (inadequate curb radi i , lack of channelization where needed, excessive grades, and the like) with today's standards. Within the functional rating, the elements are subdivided into two groups: (a) service, consisting of capacity and delay items and (b) safety, consisting of operational features and accident frequency. These two groups are given weightings of three fourths and one fourth, respectively, in computing the functional rating.
PROCEDURES FOR INCLUDING THE TRAFFIC FACTOR
An examination of the several sufficiency-rating methods discloses a variety of ways of incorporating the traffic-volume factor. Some states incorporate this factor into the rating formula, some incorporate it indirectly as a basis for the design standards which form the cri teria for rating, and some use i t again as a supplemental adjusting factor after the basic sufficiency rating has been derived. None of the methods examined includes a traffic composition factor, or purpose classification factor.
The methods employed in using the traffic factor lend themselves to a classification into three broad categories, namely: the Arizona method, the Montana method, and the Minnesota method.
Arizona Method
Each state which has adopted the constituent parts of the Arizona Method has modified the parts to suit its own distinctive individuality. Procedures for including
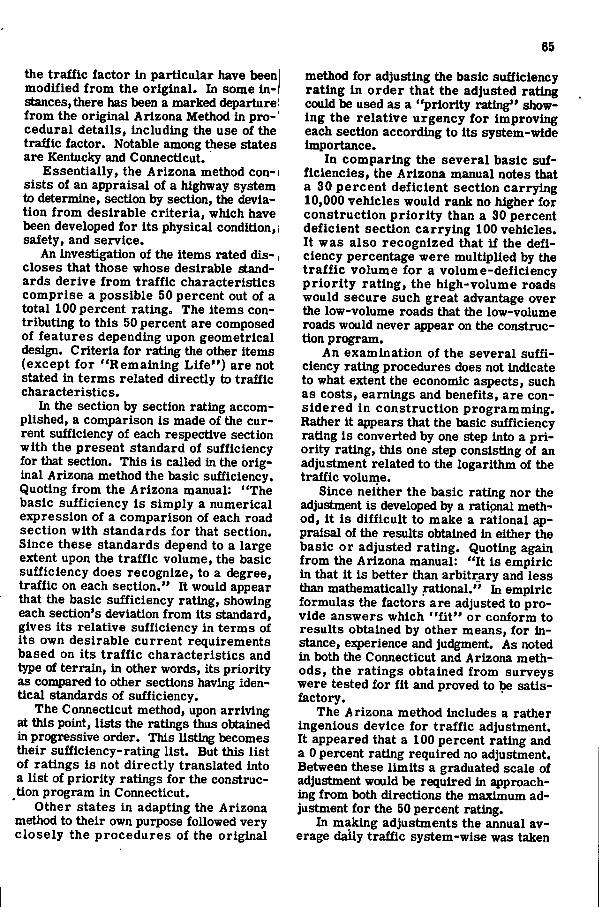
65
the traff ic factor in particular have been modified from the original. In some Instances, there has been a marked departure > from the original Arizona Method in pro-' cedural details, including the use of the traffic factor. Notable among these states are Kentucky and Connecticut.
Essentially, the Arizona method con-i sists of an appraisal of a highway system to determine, section by section, the deviation f rom desirable criteria, which have been developed for its physical condition,! safety, and service.
An investigation of the items rated dis- , closes that those whose desirable standards derive from traffic characteristics comprise a possible 50 percent out of a total 100 percent rating. The items contributing to this 50 percent are composed of features depending upon geometrical design. Criteria for rating the other items (except for "Remaining L i f e " ) are not stated in terms related directly to traffic characteristics.
In the section by section rating accomplished, a comparison is made of the current sufficiency of each respective section with the present standard of sufficiency for that section. This is called in the original Arizona method the basic sufficiency. Quoting from the Arizona manual: "The basic sufficiency is simply a numerical expression of a comparison of each road section with standards for that section. Since these standards depend to a large extent upon the traffic volume, the basic sufficiency does recognize, to a degree, traffic on each section." It would appear that the basic sufficiency rating, showing each section's deviation from its standard, gives its relative sufficiency in terms of its own desirable current requirements based on its t ra f f ic characteristics and type of terrain, in other words, its priority as compared to other sections having identical standards of sufficiency.
The Connecticut method, upon arriving at this point, lists the ratings thus obtained in progressive order. This listing becomes their sufficiency-rating list. But this list of ratings is not directly translated into a list of priority ratings for the construction program in Connecticut.
Other states in adapting the Arizona method to their own purpose followed very closely the procedures of the original
method for adjusting the basic sufficiency rating in order that the adjusted rating could be used as a "priority rating" showing the relative urgency for improving each section according to its system-wide importance.
In comparing the several basic sufficiencies, the Arizona manual notes that a 30 percent deficient section carrying 10,000 vehicles would rank no higher for construction pr ior i ty than a 30 percent deficient section carrying 100 vehicles. I t was also recognized that i f the deficiency percentage were multiplied by the t r a f f i c volume for a volume-deficiency p r io r i t y rating, the high-volume roads would secure such great advantage over the low-volume roads that the low-volume roads would never appear on the construction program.
An examination of the several sufficiency rating procedures does not indicate to what extent the economic aspects, such as costs, earnings and benefits, are considered in construction programming. Rather it appears that the basic sufficiency rating is converted by one step into a p r i ority rating, this one step consisting of an adjustment related to the logarithm of the traffic volume.
Since neither the basic rating nor the adjustment is developed by a rational method, i t is diff icult to make a rational appraisal of the results obtained in either the basic or adjusted rating. Quoting again f rom the Arizona manual: " I t is empiric in that i t is better than arbitrary and less than mathematically rational." In empiric formulas the factors are adjusted to provide answers which " f i t " or conform to results obtained by other means, for instance, ejqjerience and judgment. As noted in both the Connecticut and Arizona methods, the ratings obtained from surveys were tested for f i t and proved to be satisfactory.
The Arizona method includes a rather ingenious device for t raff ic adjustment. It appeared that a 100 percent rating and a 0 percent rating required no adjustment. Between these limits a graduated scale of adjustment would be required in approaching from both directions the maximum adjustment for the 50 percent rating.
In making adjustments the annual average daily traffic system-wise was taken
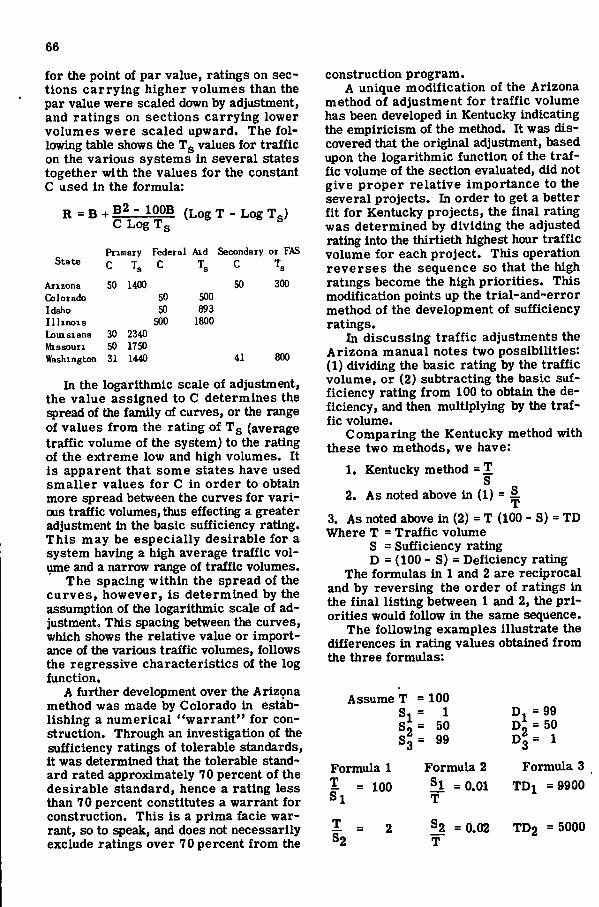
66
for the point of par value, ratings on sections carrying higher volumes than the par value were scaled down by adjustment, and ratings on sections carrying lower volumes were scaled upward. The fo l lowing table shows the Tg values for traffic on the various systems in several states together with the values for the constant C used in the formula:
R = B + 1 L L I ^ (Log T - Log Tg)
State
Arizona Colorado Idaho Illinois Louisiana Missouri
Primary Federal Aid Secondary or FAS
50 1400 50 50
500
500 893
1800 30 2340 50 1750
Washington 31 1440
50
41
300
800
In the logarithmic scale of adjustment, the value assigned to C determines the spread of the family of curves, or the range of values from the rating of Tg (average traffic volume of the system) to the rating of the extreme low and high volumes. It is apparent that some states have used smaller values for C in order to obtain more spread between the curves for various traffic volumes, thus effecting a greater adjustment in the basic sufficiency rating. This may be especially desirable for a system having a high average traffic volume and a narrow range of traffic volumes.
The spacing within the spread of the curves, however, is determined by the assumption of the logarithmic scale of adjustment. This spacing between the curves, which shows the relative value or importance of the various traffic volumes, follows the regressive characteristics of the log function.
A further development over the Arizona method was made by Colorado in establishing a numerical "warrant" for construction. Through an investigation of the sufficiency ratings of tolerable standards, it was determined that the tolerable standard rated approximately 70 percent of the desirable standard, hence a rating less than 70 percent constitutes a warrant for construction. This is a prima facie warrant, so to speak, and does not necessarily exclude ratings over 70 percent from the
construction program. A unique modification of the Arizona
method of adjustment for traffic volume has been developed in Kentucky indicating the empiricism of the method. It was discovered that the original adjustment, based upon the logarithmic function of the traffic volume of the section evaluated, did not give proper relative importance to the several projects. In order to get a better f i t for Kentucky projects, the final rating was determined by dividing the adjusted rating into the thirtieth highest hour traffic volume for each project. This operation reverses the sequence so that the high ratings become the high priorities. This modification points up the trial-and-error method of the development of sufficiency ratings.
In discussing t raff ic adjustments the Arizona manual notes two possibilities: (1) dividing the basic rating by the traffic volume, or (2) subtracting the basic sufficiency rating from 100 to obtain the deficiency, and then multiplying by the traffic volume.
Comparing the Kentucky method with these two methods, we have:
1. Kentucky method =T S
2. As noted above in (1) = £. T
3. As noted above in (2) = T (100 - S) = TD Where T = Traffic volume
S = Sufficiency rating D = (100 - S) = Deficiency rating
The formulas in 1 and 2 are reciprocal and by reversing the order of ratings in the final listing between 1 and 2, the p r i orities would follow in the same sequence.
The following examples illustrate the differences in rating values obtained from the three formulas:
Assume T = 100 S i = 1 S i = 50 S, = 99
Formula 1 I = 100 S i
S2
Formula 2 £ l =0.01 T
^ =0.02 T
D. = 99 D , = 50
Formula 3 TDi =9900
TD2 = 5000
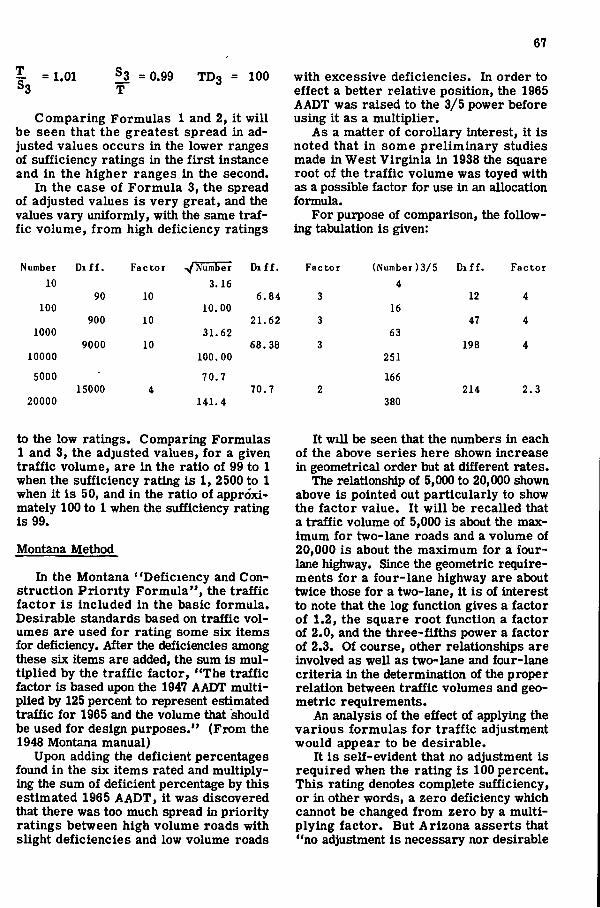
67
I S3 i - = 1.01 £3 =0.99
T TD3 100
Comparing Formulas 1 and 2, i t wi l l be seen that the greatest spread in adjusted values occurs in the lower ranges of sufficiency ratings in the f i rs t instance and in the higher ranges in the second.
In the case of Formula 3, the spread of adjusted values is very great, and the values vary uniformly, with the same traffic volume, f rom high deficiency ratings
with excessive deficiencies. In order to effect a better relative position, the 1965 AADT was raised to the 3/5 power before using it as a multiplier.
As a matter of corollary interest, it is noted that in some preliminary studies made in West Virginia in 1938 the square root of the traffic volume was toyed with as a possible factor for use in an allocation formula.
For purpose of comparison, the following tabulation is given:
Number D i f f . Fa c to r Number Di f f . Factor (Number)3/5 Dif f . Factor 10 3.16 4
90 10 6.84 3 12 4 100 10.00 16
900 10 21.62 3 47 4 1000 31.62 63
9000 10 68.38 3 198 4 10000 100.00 251
5000 70.7 166 15000 4 70.7 2 214 2.3
20000 141.4 380
to the low ratings. Comparing Formulas 1 and 3, the adjusted values, for a given traffic volume, are in the ratio of 99 to 1 when the sufficiency rating is 1, 2500 to 1 when it is 50, and in the ratio of approxi' mately 100 to 1 when the sufficiency rating is 99.
Montana Method
In the Montana "Deficiency and Construction Priori ty Formula", the traffic factor is included in the basic formula. Desirable standards based on traffic volumes are used for rating some six items for deficiency. After the deficiencies among these six items are added, the sum is multiplied by the traffic factor, "The traffic factor is based upon the 1947 AADT multiplied by 125 percent to represent estimated traffic for 1965 and the volume that should be used for design purposes." (From the 1948 Montana manual)
Upon adding the deficient percentages found in the six items rated and multiplying the sum of deficient percentage by this estimated 1965 AADT, i t was discovered that there was too much spread in priority ratings between high volume roads with slight deficiencies and low volume roads
It wil l be seen that the numbers in each of the above series here shown increase in geometrical order but at different rates.
The relationship of 5,000 to 20,000 shown above is pointed out particularly to show the factor value. It w i l l be recalled that a traffic volume of 5,000 is about the maximum for two-lane roads and a volume of 20,000 is about the maximum for a four-lane highway. Since the geometric requirements for a four-lane highway are about twice those for a two-lane, i t is of interest to note that the log function gives a factor of 1.2, the square root function a factor of 2.0, and the three-fifths power a factor of 2.3. Of course, other relationships are involved as well as two-lane and four-lane criteria in the determination of the proper relation between traffic volumes and geometric requirements.
An analysis of the effect of applying the various formulas for t raff ic adjustment would appear to be desirable.
It is self-evident that no adjustment is required when the rating is 100 percent. This rating denotes complete sufficiency, or in other words, a zero deficiency which cannot be changed from zero by a multiplying factor. But Arizona asserts that "no adjustment is necessary nor desirable
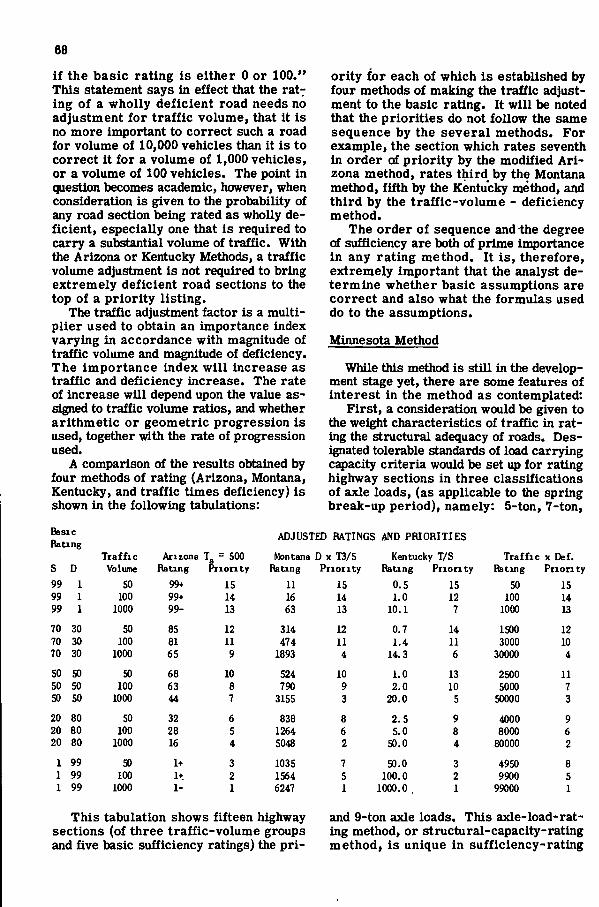
68
i f the basic rating is either 0 or 100." This statement says in effect that the rat^ ing of a wholly deficient road needs no adjustment for t raff ic volume, that i t is no more important to correct such a road for volume of 10,000 vehicles than it is to correct i t for a volume of 1,000 vehicles, or a volume of 100 vehicles. The point in question becomes academic, however, when consideration is given to the probability of any road section being rated as wholly deficient, especially one that is required to carry a substantial volume of traffic. With the Arizona or Kentucky Methods, a traffic volume adjustment is not required to bring extremely deficient road sections to the top of a priori ty l ist ing.
The traffic adjustment factor is a multiplier used to obtain an importance index varying in accordance with magnitude of traffic volume and magnitude of deficiency. The importance index w i l l increase as traffic and deficiency increase. The rate of increase wil l depend upon the value assigned to traffic volume ratios, and whether arithmetic or geometric progression is used, together with the rate of progression used.
A comparison of the results obtained by four methods of rating (Arizona, Montana, Kentucky, and traffic times deficiency) is shown in the following tabulations:
ority for each of which is established by four methods of making the traffic adjustment to the basic rating. It wi l l be noted that the priorities do not follow the same sequence by the several methods. For example, the section which rates seventh in order of priority by the modified A r i zona method, rates third_ by the Montana method, f i f th by the Kentucky method, and third by the traffic-volume - deficiency method.
The order of sequence and the degree of sufficiency are both of prime importance in any rating method. I t i s , therefore, extremely Important that the analyst determine whether basic assumptions are correct and also what the formulas used do to the assumptions.
Minnesota Method
WhUe this method is still in the development stage yet, there are some features of interest in the method as contemplated:
First, a consideration would be given to the weight characteristics of traffic in rating the structural adequacy of roads. Designated tolerable standards of load carrying capacity criteria would be set up for rating highway sections in three classifications of axle loads, (as applicable to the spring break-up period), namely: 5-ton, 7-ton,
Basic Rating
ADJUSTED RATINGS AND PRIORITIES
Traffic Arizona T. = 500 Montana D x T3/5 Kentucky T/S Traffic X Def. s D Volume Rating Priority Rating Priority Rating Priority Rating Priority 99 1 50 99+ 15 11 15 0.5 15 50 15 99 1 100 99+ 14 16 14 1.0 12 100 14 99 1 1000 99- 13 63 13 10.1 7 1000 13
70 30 50 85 12 314 12 0.7 14 ISOO 12 70 30 100 81 11 474 11 1.4 11 3000 10 70 30 1000 65 9 1893 4 14.3 6 30000 4
50 50 SO 68 10 524 10 1.0 13 2500 11 50 50 100 63 8 790 9 2.0 10 5000 7 50 50 1000 44 7 3155 3 20.0 5 50000 3
20 80 50 32 6 838 8 2.5 9 4000 9 20 80 100 28 5 1264 6 5.0 8 8000 6 20 80 1000 16 4 5048 2 50.0 4 80000 2
1 99 50 1+ 3 1035 7 50.0 3 4950 8 1 99 100 1+ 2 1564 5 100.0 2 9900 5 1 99 1000 1- 1 6247 1 1000.0 1 99000 1
This tabulation shows fifteen highway sections (of three traffic-volume groups and five basic sufficiency ratings) the p r i -
and 9-ton axle loads. This axle-load-rating method, or structural-capacity-rating method, is unique in sufficiency-rating
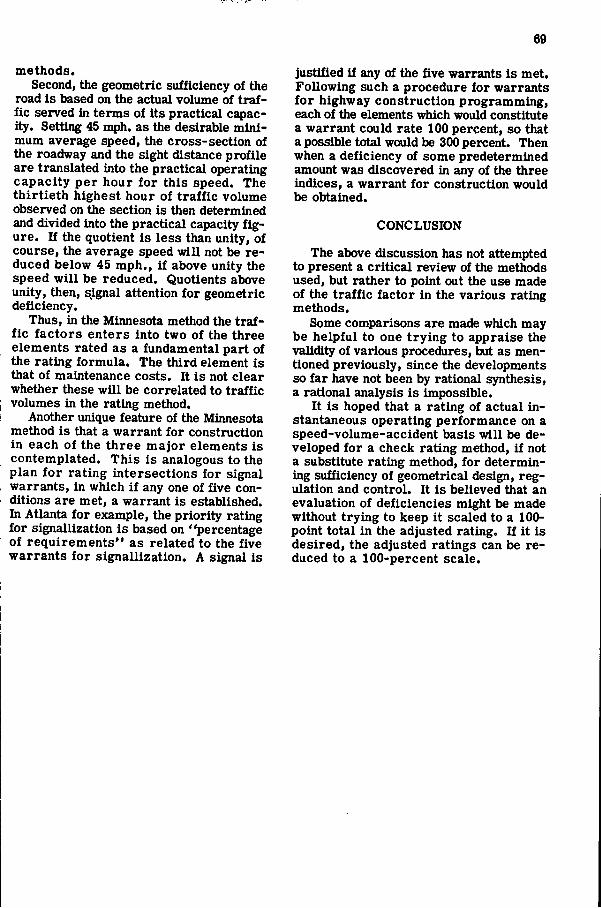
69
methods. Second, the geometric sufficiency of the
road is based on the actual volume of traffic served in terms of its practical capacity. Setting 45 mph. as the desirable minimum average speed, the cross-section of the roadway and the sight distance profile are translated into the practical operating capacity per hour for this speed. The th i r t ie th highest hour of t raff ic volume observed on the section is then determined and divided into the practical capacity f ig ure. If the quotient is less than unity, of course, the average speed wi l l not be reduced below 45 mph., i f above unity the speed w i l l be reduced. Quotients above unity, then, signal attention for geometric deficiency.
Thus, in the Minnesota method the traff ic factors enters into two of the three elements rated as a fundamental part of the rating formula. The third element is that of maintenance costs. It is not clear whether these wi l l be correlated to traffic volumes in the rating method.
Another unique feature of the Minnesota method is that a warrant for construction in each of the three major elements is contemplated. This is analogous to the plan fo r rating intersections for signal warrants, in which i f any one of five conditions are met, a warrant is established. In Atlanta for example, the priority rating for signallization is based on "percentage of requirements" as related to the five warrants for signallization. A signal is
justified if any of the five warrants is met. Following such a procedure for warrants for highway construction programming, each of the elements which would constitute a warrant could rate 100 percent, so that a possible total would be 300 percent. Then when a deficiency of some predetermined amount was discovered in any of the three indices, a warrant for construction would be obtained.
CONCLUSION
The above discussion has not attempted to present a critical review of the methods used, but rather to point out the use made of the traffic factor in the various rating methods.
Some comparisons are made which may be helpful to one trying to appraise the validity of various procedures, but as mentioned previously, since the developments so far have not been by rational synthesis, a rational analysis is impossible.
It is hoped that a rating of actual instantaneous operating performance on a speed-volume-accident basis wi l l be developed for a check rating method, if not a substitute rating method, for determining sufficiency of geometrical design, regulation and control. It is believed that an evaluation of deficiencies might be made without trying to keep it scaled to a 100-point total in the adjusted rating. If i t is desired, the adjusted ratings can be reduced to a 100-percent scale.
H R B Bulletins
DEPARTMENT OF ECONOM(CS, nNANCE AND ADMINISTRATION
No. 3 Report of Committee on Highway Organization and Administration (1947) 23 pp.. 30
No. 4 Report of Committee on Land Acquisition and Control of Highway Access and Adjacent Areas (1947) 42 pp. . 45
No. 7 An Analysis of State Enabling Legislation of Special and Local Character
Dealing with Automobile Parking Facilities (1947) 30 pp. . 30
No. 9 Salary and Wage Practices of State Highway Departments (1951) 51 pp. . 60
No. 10 Report of Committee on Land Acquisition and Control of Highway Access and
Adjacent Areas (1948) 46 pp. • 60
No. 11 The Polarized Headlight System (1948) 40 pp. . 60
No. 12 Highway Finance (1948) 69 pp. . 75
No. 18 Land Acquisition and Control of Highway Access and Adjacent Areas, Report
of Committee and Four Papers (1949) 44 pp. . 60
No. 24 Zoning for Parking Facilities (1950) 161 pp. 3. 00
No. 26 The Truck Weight Problem in Highway Transportation (1950) 130 pp. 1. 20
No. 30 Progress in Roadside Protection (1951) 54 pp. . 75
No. 38 Land Acquisition and Control of Adjacent Areas (1951) 82 pp. 1. 20 j
No. 53 Highway Sufficiency Ratings (1952) 76 pp. . 90
The Highway Research Board is organized under the auspices of the Division of Engineering and Industrial Research of the National Research Council to provide a clearinghouse for highway research activities and information. The National Research Council is the operating agency of the National Academy of Sciences, a private organization of eminent American scientists chartered in 1863 (under a special act of Congress) to "investigate, examine, experiment, and report on any subject of science
or art."