HIGHLIGHTS REPORT July 2012 - National...
12
Greendex 2012: Consumer Choice and the Environment – A Worldwide Tracking Survey HIGHLIGHTS REPORT July 2012
Transcript of HIGHLIGHTS REPORT July 2012 - National...

Greendex 2012: Consumer Choice and the
Environment – A Worldwide Tracking Survey
HIGHLIGHTS REPORT
July 2012

2
INTRODUCTION
National Geographic conducted its inaugural
Greendex survey in January 2008. That first
Greendex survey of 14 countries around the world
ranked average consumers in those countries
according to the environmental sustainability of
their behavior. National Geographic replicated
these studies in 2009, 2010 and now again in 2012
to track progress or the lack thereof. Consistently,
consumers in the large developing economies of
Brazil, India and China have scored highest, while
Canadians and Americans, with their relatively
massive environmental footprints as individuals,
have scored lowest.
Despite five years of rapid global transformation
and economic turmoil, it is clear that sustainable
consumption remains a global challenge and that
progress has been insufficient. The Greendex
studies have added to our collective understanding
of the barriers and opportunities that people face
in becoming more sustainable as consumers.
The 2008 findings raised concerns about what
economic development and the material
aspirations that come with it would mean for the
impact that the average consumer in rapidly
growing economies has on the environment. At the
same time, the results reminded us that
consumers in wealthy countries have a
proportionately greater impact on the
environment than others—and that they can and
should make more sustainable choices. In 2010,
we revealed that a lack of trust in companies’
environmental claims, combined with the absence
of demonstrated leadership from both companies
and governments were major barriers that needed
addressing.
In 2012, we have learned more about how
perceptions and behavioral realities are often out
of synch with each other when it comes to
sustainable consumption, making the transition to
sustainability all the more complicated. Greendex
2012 aims to help bridge these gaps. Indeed,
Greendex 2012 is intended to further our global
understanding of the issues, obstacles and
opportunities related to sustainable consumer
behavior in a manner that enables behavior
change and empowers individuals along with
major societal actors like companies and
governments.
The following is a summary of the results of
Greendex 2012: Consumer Choice and the
Environment—A Worldwide Tracking Survey.

3
The Greendex is a comprehensive measure of
consumer behavior in 65 areas relating to
housing, transportation, food and consumer
goods. Greendex 2012 ranks average consumers
in 17 countries—up from 14 in 2008 for which
changes are tracked—according to the
environmental impact of their discretionary and
nondiscretionary consumption patterns within
these four major categories.
Each respondent earned a score reflecting the
environmental impact of his or her consumption
patterns within each, and four corresponding
“sub-indices” were created. Consumers were
then assigned an overall Greendex score (a
measure of the relative environmental
sustainability of their consumption patterns) out
of 100, based on their performance within the
four sub-indices.
GREENDEX 2012: OVERALL RESULTS
In their fourth survey that measures and
monitors consumer behaviors that have an
impact on the environment, the National
Geographic Society and the research consultancy
GlobeScan have found that environmentally
friendly behavior among consumers has
increased from 2010 in only five of 17 countries
surveyed. Sustainable consumer behavior has
decreased in nine. In only one country surveyed
has environmentally friendly consumer behavior
slipped below our 2008 baseline levels. So, while
progress remains positive overall, some
momentum has been shed in the past two years.
By environmentally friendly consumer behavior,
we mean people’s transportation patterns,
household energy and resource use, consumption
of food and everyday consumer goods, and what
consumers are doing to minimize the impact
these activities have on the environment.
“Greendex 2012: Consumer Choice and the
Environment — A Worldwide Tracking Survey”
measures consumer behavior in areas relating to
housing, transportation, food and consumer
goods. Greendex 2012 ranks average consumers
in 17 countries according to the environmental
impact of their consumption patterns and is the
only survey of its kind.
First conducted in 2008, the Greendex survey
was expanded in 2009, with the addition of
Argentina, South Korea and Sweden to Australia,
Brazil, Canada, China, France, Germany, Great
Britain, Hungary, India, Japan, Mexico, Russia,
Spain and the United States. Seventeen-thousand
consumers were polled online (1,000 in each
country). The same 17 countries were included
in the 2012 survey.
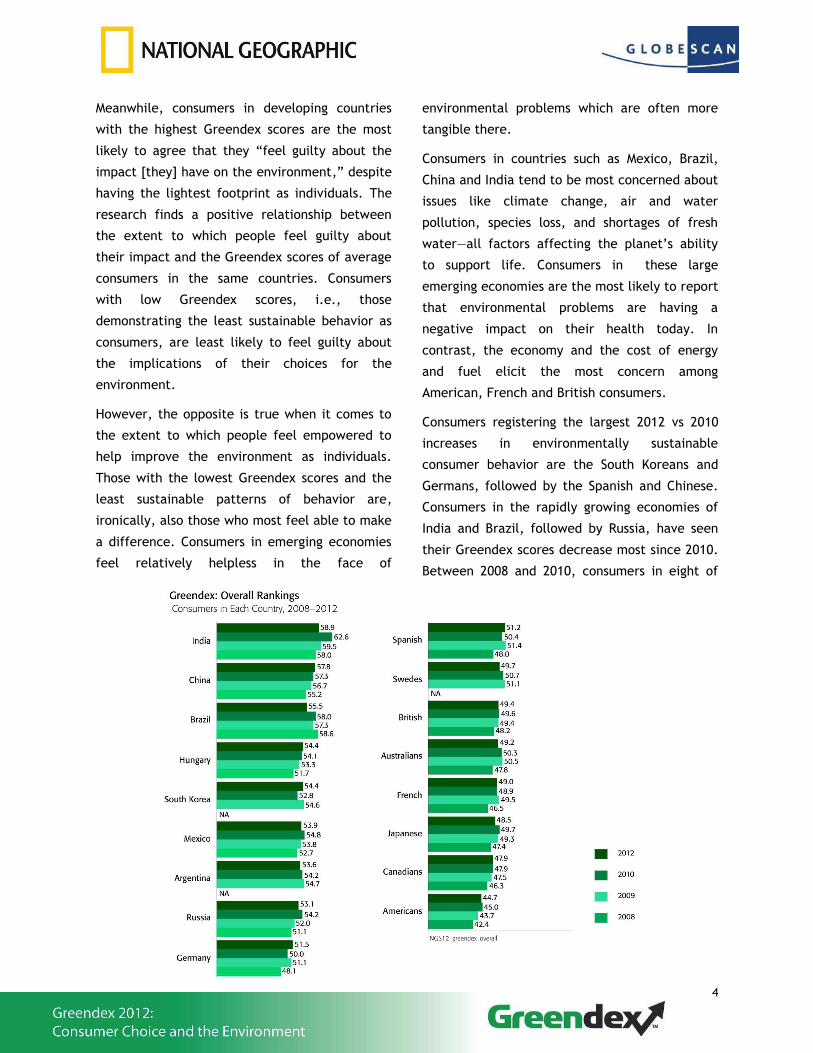
The top-scoring consumers of 2012 are in the
developing economies of India, China and Brazil,
in descending order. Those in emerging
economies continue to round out the top tier of
the Greendex ranking, while the lowest scores
are all earned by consumers in industrialized
countries. American consumers’ behavior still
ranks as the least sustainable of all countries
surveyed since the inception of the study,
followed by Canadian, Japanese and French
consumers.
4
Meanwhile, consumers in developing countries
with the highest Greendex scores are the most
likely to agree that they “feel guilty about the
impact [they] have on the environment,” despite
having the lightest footprint as individuals. The
research finds a positive relationship between
the extent to which people feel guilty about
their impact and the Greendex scores of average
consumers in the same countries. Consumers
with low Greendex scores, i.e., those
demonstrating the least sustainable behavior as
consumers, are least likely to feel guilty about
the implications of their choices for the
environment.
However, the opposite is true when it comes to
the extent to which people feel empowered to
help improve the environment as individuals.
Those with the lowest Greendex scores and the
least sustainable patterns of behavior are,
ironically, also those who most feel able to make
a difference. Consumers in emerging economies
feel relatively helpless in the face of
environmental problems which are often more
tangible there.
Consumers in countries such as Mexico, Brazil,
China and India tend to be most concerned about
issues like climate change, air and water
pollution, species loss, and shortages of fresh
water—all factors affecting the planet’s ability
to support life. Consumers in these large
emerging economies are the most likely to report
that environmental problems are having a
negative impact on their health today. In
contrast, the economy and the cost of energy
and fuel elicit the most concern among
American, French and British consumers.
Consumers registering the largest 2012 vs 2010
increases in environmentally sustainable
consumer behavior are the South Koreans and
Germans, followed by the Spanish and Chinese.
Consumers in the rapidly growing economies of
India and Brazil, followed by Russia, have seen
their Greendex scores decrease most since 2010.
Between 2008 and 2010, consumers in eight of

5
the 14 countries surveyed in all three years
demonstrated year over year improvements. Of
those, only Chinese and Hungarian consumers
have extended the trend in 2012.
Much of the increase in the overall Greendex
scores between 2008 and 2010 was due to
increased sustainable behavior in the housing
category in both 2009 and 2010. Here, the
Greendex measures the energy and resources
consumed by people’s homes. In 2012, housing
Greendex scores have fallen in 13 of the 17
countries surveyed. Indians, South Koreans,
Germans and Japanese are the only consumers to
have improved their housing scores or to have
stabilized them.
Changes in personal behavior from 2010 within
the categories of personal transportation, food
and consumer goods tend to be more often
positive than negative, especially for food and
consumer goods. We explore each of these
categories of consumption in more detail below.

6
HOUSING
Indians, Brazilians, Chinese and Mexicans
continue to top the housing sub-index, while
Swedish, Australian, French, British, Japanese,
Canadians and especially American consumers
make up the bottom seven. While housing scores
generally increased between in 2009 and 2010,
in 2012 they are down in more than two-thirds of
the countries surveyed.
Energy consumed in home heating is an
important component of the Greendex, and
heating systems are commonplace in Europe and
North America. By contrast, a little over half of
consumers in Brazil and Mexico report having
residential heating systems.
Oil is a significant energy source for consumers
in both Japan and Germany, and nearly four in
ten consumers who have home heating in China
report using coal. Globally, natural gas and
electricity are the most common sources of
energy for residential heating.
Air conditioning remains a common feature of
Japanese, American, Chinese, South Korean and
Australian households. Air conditioners are
relatively uncommon in European households,
with the exception of Spanish homes.
Brazilian consumers remain by far the most likely
to report that they purchase electricity sold as
“green” or generated from renewable resources,
and Brazil continues to produce large amounts of
biofuel. Green electricity consumption is
becoming more common in Germany and South
Korea, resulting in higher Greendex scores there.
However, percentages reporting that their
household purchases green electricity have
declined since 2010 in seven countries surveyed,
including four Western European countries,
perhaps due to cost premiums.
Still, consumers continue to make an effort to
moderate energy consumption in their homes by
adjusting heating and cooling settings. More than
half of consumers in 15 of the 17 countries
7
surveyed report that they frequently do so, and
percentages are up among Argentineans,
Brazilians, French, Germans and Mexicans.
Globally, more than one-third of consumers
surveyed say that their household contains an
energy-saving television, with those in North
America as well as in Australia and Brazil being
the most likely to. Since 2008, ownership of
these types of televisions has increased broadly,
particularly among Australians, Germans and
Indians, pushing Greendex scores higher. This
likely reflects the widespread adoption LCD
technology in televisions.
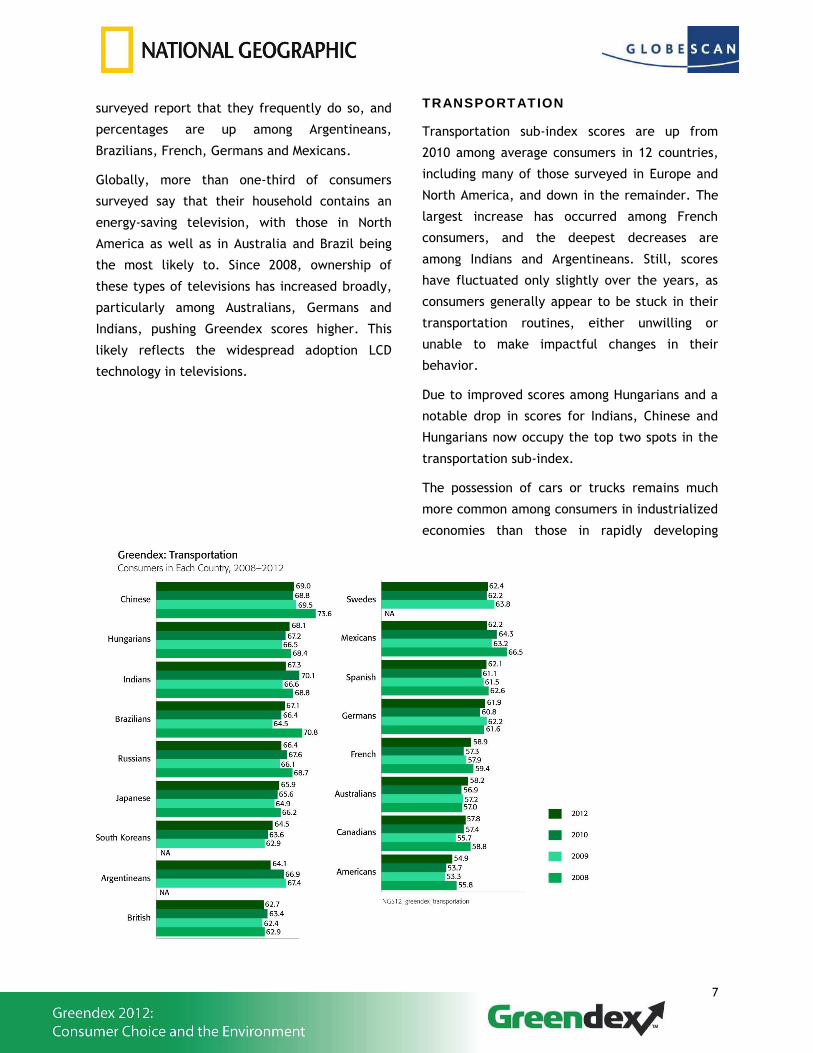
TRANSPORTATION
Transportation sub-index scores are up from
2010 among average consumers in 12 countries,
including many of those surveyed in Europe and
North America, and down in the remainder. The
largest increase has occurred among French
consumers, and the deepest decreases are
among Indians and Argentineans. Still, scores
have fluctuated only slightly over the years, as
consumers generally appear to be stuck in their
transportation routines, either unwilling or
unable to make impactful changes in their
behavior.
Due to improved scores among Hungarians and a
notable drop in scores for Indians, Chinese and
Hungarians now occupy the top two spots in the
transportation sub-index.
The possession of cars or trucks remains much
more common among consumers in industrialized
economies than those in rapidly developing

8
countries. Consumers in China, India, and
Argentina are the least likely to own at least
one, but the use of cars appears to be on the rise
in developing economies, and 2012 data show
marked increases in the number of consumers
who say they drive alone regularly in Argentina
and Mexico. In contrast, Australians, French,
Germans and Spanish are now less likely than
they were in 2010 to report that they regularly
drive with no passengers (joining improvements
registered by British and Canadian consumers in
2010).
Despite the increasing use of personal
automobiles, Chinese, Mexican and Indian
consumers are the most likely to say that they
choose to live close to their usual destinations to
minimize the impact of their personal
transportation on the environment. Percentages
agreeing have increased from 2010 in Argentina,
Germany and Mexico, but have decreased in
China and India.
The frequency of use of public transportation, a
key indicator of sustainable transportation, is
low in most countries. In descending order,
however, Russians, Chinese, South Koreans,
Brazilians and Mexicans are the most common
users. Australian, French, Canadian and
American consumers are the least likely to take
public transportation. Consumers in the four
Anglophone countries surveyed are also the least
likely to walk or ride a bike to their usual
destinations, pushing their scores lower. Chinese
consumers remain the most likely to walk or ride
a bicycle to their usual destinations.
Encouragingly, percentages of consumers who
report frequently walking or cycling to their
destinations are up from 2010 in ten countries
and down in only two—India and Japan. It will be
important to monitor trends in sustainable
mobility going forward as populous and rapidly
growing economies continue on sharp
development trajectories.
FOOD
Food sub-index scores have improved in nine
countries and have decreased in eight. Food
scores among Indian consumers, which have
fluctuated over the years, have decreased
notably since 2010 but remain much higher than
the scores for average consumers in other
countries due in part to infrequent beef
consumption in India. Japanese and Mexican
consumers score lowest in 2012.
More than half of consumers in almost all
countries surveyed report that they consume
beef once or more per week. Germans, South
Koreans, Hungarians and especially Indians are
the exceptions. Argentinean and Brazilian
consumers, followed by Mexicans, are the most
likely to consume beef and, with half or more
indicating that they consume it daily or several
times a week, they have lower food sub-index
scores as a result. Indians, in contrast, eat the
least beef.
Russians, Chinese, Australians and Germans are
the most likely to consume locally grown food
frequently, while only about one-third or less of
Swedes, Japanese and Americans report that
they consume locally grown food at least several
times a week.

9
Spanish consumers have become the most
frequent eaters of fish and seafood, surpassing
Japanese consumption relative to reported
behavior in 2010, where the frequency of
seafood consumption is down following the
effects of the 2011 tsunami disaster. Still, at
least half of average consumers in all countries
surveyed except Germany, Argentina, India and
Hungary consume fish and seafood at least once
per week. Seafood consumption has, however,
become less frequent among Chinese and
Russians, in addition to Japanese.
Drinking bottled water is very common among
German consumers, with two-thirds reporting
that they do so daily. Germans continue to
consume more bottled water than those in all
other countries surveyed (followed closely by
Mexicans where consumption is up since 2009).
This adversely affects their Greendex score.
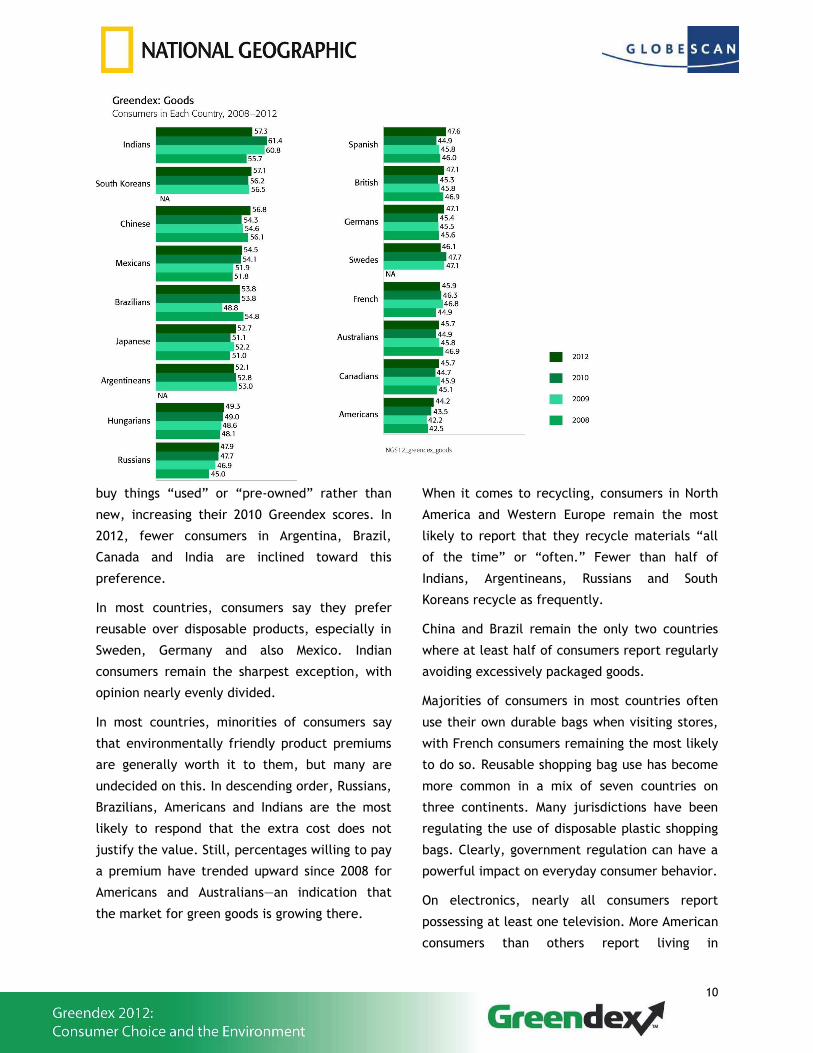
GOODS
Greendex goods scores for average consumers
have increased in 12 countries, notably in Spain
and China. Average scores have decreased in
four countries, but especially in India.
Majorities of consumers in 16 of the 17 countries
surveyed indicate that they prefer to repair
something when it is broken rather than to
replace it, which has a positive impact on
Greendex scores. Japanese consumers are the
only ones among whom less than a majority
agree. Argentineans, Brazilians, Hungarians and
Mexicans are now more likely than they were in
2010 to prefer to repair rather than to replace,
but downward tendencies are occurring among
Americans, Australians, British, Indians, Russians
and Japanese.
Between 2008 and 2010, there were significant
increases in the number of Americans, Chinese,
and Indians reporting that they generally try to
10
buy things “used” or “pre-owned” rather than
new, increasing their 2010 Greendex scores. In
2012, fewer consumers in Argentina, Brazil,
Canada and India are inclined toward this
preference.
In most countries, consumers say they prefer
reusable over disposable products, especially in
Sweden, Germany and also Mexico. Indian
consumers remain the sharpest exception, with
opinion nearly evenly divided.
In most countries, minorities of consumers say
that environmentally friendly product premiums
are generally worth it to them, but many are
undecided on this. In descending order, Russians,
Brazilians, Americans and Indians are the most
likely to respond that the extra cost does not
justify the value. Still, percentages willing to pay
a premium have trended upward since 2008 for
Americans and Australians—an indication that
the market for green goods is growing there.
When it comes to recycling, consumers in North
America and Western Europe remain the most
likely to report that they recycle materials “all
of the time” or “often.” Fewer than half of
Indians, Argentineans, Russians and South
Koreans recycle as frequently.
China and Brazil remain the only two countries
where at least half of consumers report regularly
avoiding excessively packaged goods.
Majorities of consumers in most countries often
use their own durable bags when visiting stores,
with French consumers remaining the most likely
to do so. Reusable shopping bag use has become
more common in a mix of seven countries on
three continents. Many jurisdictions have been
regulating the use of disposable plastic shopping
bags. Clearly, government regulation can have a
powerful impact on everyday consumer behavior.
On electronics, nearly all consumers report
possessing at least one television. More American
consumers than others report living in
11
households that contain four or more televisions,
and this drives their score downward. The list of
most frequent recyclers of electronic items
consists entirely of Europeans, along with
Canadians. Globally, the trend appears to be
upward, with increased frequency of recycling
electronics observed among consumers in eight
diverse countries. This is likely the outcome of
the establishment of the programs,
infrastructure and regulations required to enable
this behavior, combined with effective
communications.
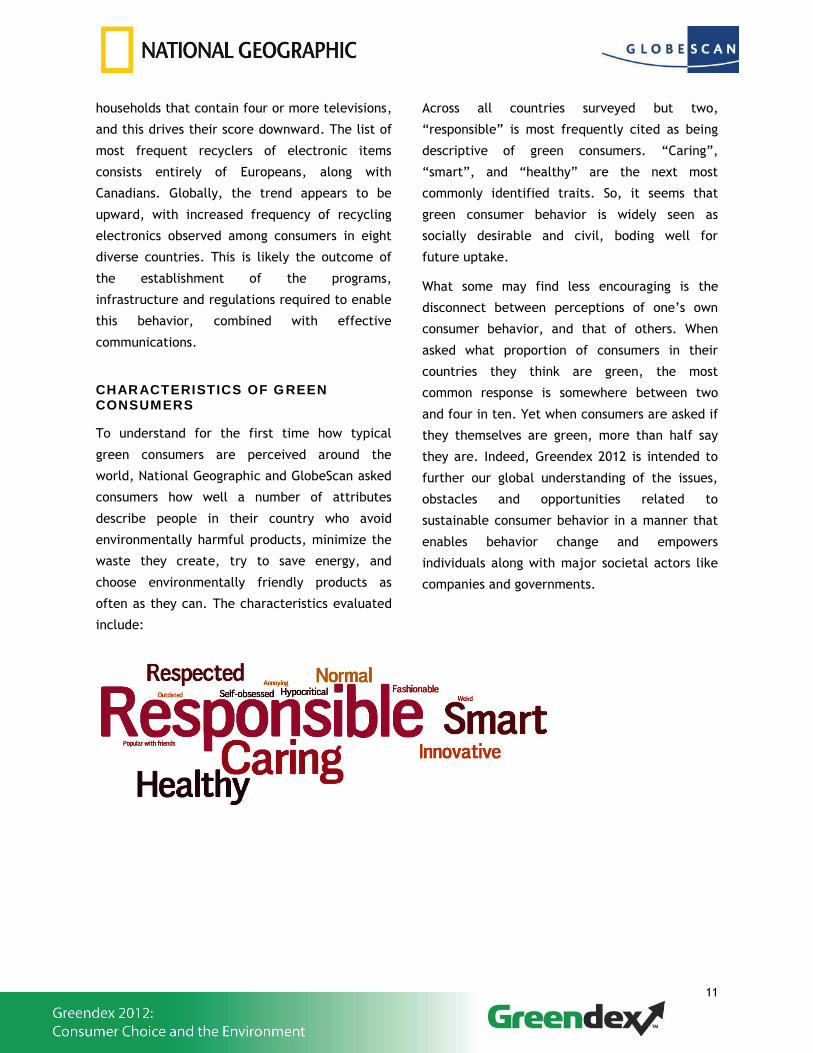
CHARACTERISTICS OF GREEN CONSUMERS
To understand for the first time how typical
green consumers are perceived around the
world, National Geographic and GlobeScan asked
consumers how well a number of attributes
describe people in their country who avoid
environmentally harmful products, minimize the
waste they create, try to save energy, and
choose environmentally friendly products as
often as they can. The characteristics evaluated
include:
Across all countries surveyed but two,
“responsible” is most frequently cited as being
descriptive of green consumers. “Caring”,
“smart”, and “healthy” are the next most
commonly identified traits. So, it seems that
green consumer behavior is widely seen as
socially desirable and civil, boding well for
future uptake.
What some may find less encouraging is the
disconnect between perceptions of one’s own
consumer behavior, and that of others. When
asked what proportion of consumers in their
countries they think are green, the most
common response is somewhere between two
and four in ten. Yet when consumers are asked if
they themselves are green, more than half say
they are. Indeed, Greendex 2012 is intended to
further our global understanding of the issues,
obstacles and opportunities related to
sustainable consumer behavior in a manner that
enables behavior change and empowers
individuals along with major societal actors like
companies and governments.

12
ABOUT THE GREENDEX
This quantitative consumer study of 17,000
consumers in a total of 17 countries (14 in 2008)
asked about such behavior as energy use and
conservation, transportation choices, food
sources, the relative use of green products
versus conventional products, attitudes towards
the environment and sustainability, and
knowledge of environmental issues. A complex
algorithm is applied to results to generate an
index score, i.e., a Greendex score, for each
individual respondent that reflects the relative
environmental impact of his or her consumption
patterns in the areas of housing, transportation
and the consumption of food and consumer
goods. Individual scores are averaged to create a
mean score for each country. The Greendex
measures the impact of the average consumer in
each country surveyed; it does not measure the
environmental impact of a total country.
DISCOVER YOUR GREENDEX SCORE
Individuals around the world can find out where
they rank on the Greendex scale by visiting
nationalgeographic.com/greendex and taking an
abbreviated survey. They can also examine the
Greendex survey results by country, measure
their knowledge of some basic green issues
against what others around the world know and
get tips on living a more environmentally friendly
lifestyle.
A18. Approximately what percentage of people in your country do you think avoid environmentally harmful products,
minimize the waste they create, try to save energy, and choose environmentally friendly products as often as they can?
A19. Would you describe yourself as someone who avoids environmentally harmful products, minimizes the waste one
creates, tries to save energy, and chooses environmentally friendly products as often as one can?