Highlights - MZ Group
47
Quality Indicators DECi FECi 9.32 4.63 Investor Relations [email protected] http://ri.cemig.com.br RELEASE - 3Q 2020 Debt Profile – Consolidated R$10.6 bn Minus Hedge R$7.3 bn Highlights Ebitda Consolidated IFRS: R$1.4 bn Ajusted: R$1.3 bn Ebitda Cemig D IFRS: R$803 mn Ajusted: R$572 mn Ebitda Cemig GT IFRS: R$539 mn NOSSA ENERGIA, SUA FORÇA
Transcript of Highlights - MZ Group

Quality Indicators DECi FECi
9.32 4.63
Investor Relations [email protected]
http://ri.cemig.com.br
RELEASE - 3Q 2020
Debt Profile – Consolidated R$10.6 bn
Minus Hedge R$7.3 bn
Highlights
Ebitda Consolidated IFRS: R$1.4 bn Ajusted: R$1.3 bn
Ebitda Cemig D IFRS: R$803 mn Ajusted: R$572 mn
Ebitda Cemig GT IFRS: R$539 mn
NOSSA ENERGIA, SUA FORÇA

1 Cem
PUBLICATION OF 3Q20 RESULTS
CEMIG REPORTS EBITDA OF R$ 1.42 BILLION
ADJUSTED EBITDA R$ 1.33 BILLION (+24.3% x 3Q19)
Highlights of 3Q20:
Signs of recovery in the economy are reflected in adjusted Ebitda 41% higher than in 2Q20
Cemig D distributed 1.4% more energy in 3Q20 than in 3Q19 o Captive market: 3.6% lower o Transport for clients: 7.8% higher
Reversal of R$ 231 million in allowance for doubtful receivables from Minas Gerais State
PMSO: 4.7% lower than in 3Q19 (excludes profit shares)
Cemig D: Opex lower than the regulatory limit for the first time (R$ 127 million below)
Bonds: Negative item of R$ 244 million in Net financial revenue (expenses)
Restatement of asset held for sale (Light): o Negative effect of R$ 136 million = R$ 90 million net of tax effects
DEC outage indicator: Below 10; 9.32 in last 12 months
Fitch and Moody’s increase Cemig’s ratings; S&P upgrades outlook to Positive
Solid cash position: R$ 5.5 billion
Indicators (GWh) 3Q20 3Q19 Change, %
Electricity sold (excluding CCEE) 12,994 13,856 -6.2%
Total energy carried 5,278 4,896 7.8%
Indicators – R$ million 3Q20 3Q19 Change, %
Sales on CCEE 59.1 9.8 503.1%
Net revenue 6,369.4 6,070.8 4.9%
Ebitda (IFRS) 1,423.5 195.4 628.5%
Adjusted Ebitda* 1,328.5 1,068.7 24.3%
Net profit 545.4 -281.8 -
Adjusted Ebitda margin 20.86% 17.60% 3,26% p.p.
Ebitda of companies (R$ mn) 3Q20 3Q19 Change, %
Ebitda Cemig D 802.8 -145.3 -
Adjusted Ebitda D 571.9 618.4 -7.5%
Ebitda Cemig GT 538.7 75.6 612.6%
Adjusted Ebitda GT 538.7 334.2 61.2%
Debt (R$ mn) 3Q20 2019 Change, %
Net debt 10,587.4 13,486.6 -21.5%
Net debt (excluding hedge) 7,303.2 11,795.6 -38.1%
* Cemig adjusts the Ebitda calculated in accordance with CVM Instruction 527/2012 to exclude items which by their nature do not
contribute to information on the potential for gross cash flow generation, since they are extraordinary items.

2 Cem
Conference call
Publication of 3Q20 results
Webcast and Conference call
November 16 (Monday), at 2:30 PM a.m. (Brasília time)
The transmission will have simultaneous translation in English and can be seen by Webcast, at http://ri.cemig.com.br, or through the links: https://vcasting.voitel.com.br/?transmissionId=8731 (Portuguese)
https://vcasting.voitel.com.br/?transmissionId=8735 (English)
or by voice conference call on:
+ (55) 11 3127 4971
+ (1) 516 3001066
Cemig Investor Relations http://ri.cemig.com.br/ [email protected] Tel.: +55 (31) 3506 5024 Fax: +55 (31) 3506 5025
Cemig’s Executive Investor Relations Team
Chief Finance and Investor Relations Officer Leonardo George de Magalhães
General Manager, Investor Relations Antônio Carlos Vélez Braga
Playback of Video Webcast: http://ri.cemig.com.br
Click on the banner and download.
Available for 90 days.
Playback of Conference call: Tel: (55-11) 3127-4999
(Available from
November 16 to November 22, 2020)

3 Cem
Contents
CONFERENCE CALL ................................................................................................................. 2
CEMIG INVESTOR RELATIONS ............................................................................................ 2
CEMIG’S EXECUTIVE INVESTOR RELATIONS TEAM .................................................... 2
CONTENTS ................................................................................................................................. 3
DISCLAIMER .............................................................................................................................. 4
INCOME STATEMENT ............................................................................................................ 5
RESULTS SEPARATED BY BUSINESS SEGMENT – 3Q20 ............................................. 6
3Q20 RESULTS ......................................................................................................................... 7
TAXES AND CHARGES ON REVENUE .............................................................................. 12
OPERATIONAL COSTS AND EXPENSES ......................................................................... 14
DEFAULT – CEMIG D ............................................................................................................ 17
SHARE OF PROFIT (LOSS) IN ASSOCIATES AND JOINT VENTURES ..................... 19
EBITDA .................................................................................................................................... 20
EBITDA CEMIG GT ................................................................................................................ 21
EBITDA CEMIG D .................................................................................................................. 21
FINANCIAL REVENUE AND EXPENSES ........................................................................... 21
THE ELECTRICITY MARKET OF CEMIG D ..................................................................... 23
PHYSICAL TOTALS OF TRANSPORT AND DISTRIBUTION – MWH....................... 25
THE ELECTRICITY MARKET OF CEMIG GT .................................................................. 26
SUPPLY QUALITY INDICATORS – DECI AND FECI ..................................................... 26
INVESTMENTS ....................................................................................................................... 27
DEBT......................................................................................................................................... 27
COVENANTS – EUROBONDS .............................................................................................. 29
CEMIG’S LONG TERM RATINGS........................................................................................ 29
OUR SHARES .......................................................................................................................... 30
APPENDICES .......................................................................................................................... 33
SOURCES AND USES OF POWER – BILLED MARKET ................................................. 33
LOSSES ..................................................................................................................................... 34
PLANTS .................................................................................................................................... 35
RAP – 2020-2021 CYCLE .................................................................................................... 36
PROFIT (LOSS) WITH CEMIG’S MONITORING ADJUSTMENTS .............................. 37
CEMIG D – TABLES (R$ MILLION) ................................................................................... 38
CEMIG GT – TABLES (R$ MILLION) ................................................................................ 40
CEMIG CONSOLIDATED – TABLES (R$ MILLION) ...................................................... 41

4 Cem
Disclaimer
Certain statements and estimates in this material may represent expectations about future events or results which are subject to risks and uncertainties that may be known or unknown. There is no guarantee that the events or results will take place as referred to in these expectations. These expectations are based on the present assumptions and analyses from the point of view of our management, in accordance with their experience and other factors such as the macroeconomic environment, market conditions in the electricity sector, and expected future results, many of which are not under Cemig’s control. Important factors that could lead to significant differences between actual results and the projections about future events or results include Cemig’s business strategy, Brazilian and international economic conditions, technology, Cemig’s financial strategy, changes in the electricity sector, hydrological conditions, conditions in the financial and energy markets, uncertainty on our results from future operations, plans and objectives, and other factors. Due to these and other factors, Cemig’s results may differ significantly from those indicated in or implied by such statements. The information and opinions herein should not be understood as a recommendation to potential investors, and no investment decision should be based on the veracity, currentness or completeness of this information or these opinions. The information and opinions herein should not be understood as a recommendation to potential investors, and no investment decision should be based on the veracity, currentness or completeness of this information or these opinions. To evaluate the risks and uncertainties as they relate to Cemig, and to obtain additional information about factors that could give rise to different results from those estimated by Cemig, please consult the section on Risk Factors included in the Reference Form filed with the Brazilian Securities Commission (CVM) – and in the 20-F Form filed with the U.S. Securities and Exchange Commission (SEC).

5 Cem
Adoption of IFRS
The results presented below are prepared in accordance with Brazilian accounting rules,
which now embody harmonization to IFRS (International Financial Reporting Standards).
(In thousands of Reais)
INCOME STATEMENT
3T20 2T20 Change
NET REVENUE 6,369 6,071 4.9%
OPERATIONAL COSTS AND EXPENSES 0 0 0.0%
Personnel 290 339 -14.5%
Employees’ and managers’ profit sharing 76 7 985.7%
Forluz – Post-Retirement Employee Benefits 111 118 -5.9%
Materials 23 16 43.8%
Outsourced services 303 303 0.0%
Energy purchased for resale 2,959 2,755 7.4%
Depreciation and Amortization 245 246 -0.4%
Operating Provisions -102 198 -151.5%
Charges for use of the national grid 535 257 108.2%
Gas bought for resale 207 232 -10.8%
Construction costs 439 373 17.7%
Other Expenses 68 84 -19.0%
5,154 4,928 4.6%
Impairment of assets held for sale -136 0 -
Share of profit (loss) in non-consolidated investees 98 58 69.3%
Finance income 165 619 -73.3%
Finance expenses -662 -853 -22.4%
PRE-TAX PROFIT 680 967 -29.6%
Income tax and Social Contribution tax: -136 86 -259.2%
Lucro líquido do período proveniente de operações descontinuadas - 224 -
Net profit (loss) for the period 545 -282 -293.5%
Income Statement(R$ million)

6 Cem
Results separated by business segment – 3Q20
Genertation Transmission Distribution
NET REVENUE 1,723 190 4,167 352 26 (89) 6,369
COST OF ELECTRICITY AND GAS - - - - - - -
Electricity purchased for resale (1,068) - (1,909) - - 19 (2,959)
Charges for use of the national grid (50) (0) (553) - - 69 (535)
Gas bought for resale - - - (207) - - (207)
Total (1,118) (0) (2,463) (207) - 87 (3,701)
- - - - - - -
OPERATIONAL COSTS AND EXPENSES - - - - - - -
Personnel (44) (27) (200) (14) (6) - (290)
Employees’ and managers’ profit shares (13) (6) (50) - (7) - (76)
Post-retirement obligations (14) (10) (75) - (12) - (111)
Materials (5) (1) (16) (0) (0) 0 (23)
Outsourced services (30) (11) (249) (6) (8) 1 (303)
Depreciation and amortization (50) (1) (167) (27) (1) - (245)
Operating provisions (reversals) and adjustments for
operational losses (10) (1) 117 1 (5) - 102
Infrastructure construction costs - (42) (387) (11) - - (439)
Other operating expenses (revenues), net (19) (3) (43) (2) (0) - (68)
Total cost of operation (185) (100) (1,069) (59) (39) 1 (1,452)
- - - - - - -
OPERATIONAL COSTS AND EXPENSES (1,304) (100) (3,532) (267) (39) 89 (5,153)
- - - - - - -
Fair value of business combinations - - - - - - -
Impairment of assets held for sale - - (136) - - - (136)
Share of profit (loss) in non-consolidated investees (33) 136 - - (5) - 98
- - - - - - -
OPER. PROFIT BEFORE FIN. REV. (EXP.) AND TAXES 386 225 499 85 (18) - 1,178
Finance income 30 1 128 7 (1) - 165
Finance expenses (474) (53) (125) (10) 0 - (662)
PRE-TAX PROFIT 8 5 (272) (13) 136 - (136)
Income tax and Social Contribution tax: 8 5 (272) (13) 136 - (136)
NET PROFIT (LOSS) FOR THE PERIOD (51) 179 230 69 118 - 545
DescriptionElectricity
Gas Others TOTALEliminations
INFORMATION BY SEGMENT ON 3Q20(R$ million)
7 Cem
3Q20 Results In thousands of Reais, unless otherwise stated.
For the third quarter of 2020 (3Q20) Cemig reports net profit of R$ 545,376, which
compares to a net loss of R$ 281,834 in 3Q19.
Leading factors in the 3Q20 result:
Cemig GT's EBITDA of 538,702 in 3Q20, still influenced by the pandemic, shows
strong growth in relation to the adjusted EBITDA in 2Q20, but with indications
that the most critical moment has passed.
Cemig GT posted an expense of R$ 244,399 in Net financial revenues (expenses),
related to the debt in Eurobonds and the related hedge instrument. In 3Q19 the
combined effect of the debt and the hedge on Net financial revenue (expenses)
was R$ 12,464 negative.
Reversal in 3Q20 of R$ 230,935 in the provision for amounts owed by the
Direct and Indirect Administration of Minas Gerais State for power consumption
and services, due to the State tax authority’s acceptance of Cemig’s proposal to
offset the amount against ICMS tax balances due to the State.
The investment in Light was recognized at market value on September 30, 2020.
This restatement had a negative effect of R$ 136,244 in 3Q20, corresponding to
a net amount after tax effects of R$ 89,921.
Lower PMSO costs: down 4.7% year-on-year (YoY) excluding profit shares –which
were higher, reflecting the profit in 3Q20, compared to a reversal in profit shares
in 3Q19, due to the loss in that quarter.
Gain in 3Q19 of R$ 309,144 – R$ 204,067 net of tax effects – from disposal of
shares in Light, and re-measurement of the remaining holding.
Recognition in 3Q19 of a tax contingency in a total amount of R$ 862.313, for
legal actions arguing the applicability of Social Security contributions to
payments of profit shares.

8 Cem
Consolidated operational revenue
Revenue from supply of electricity:
Total revenue from supply of electricity was R$ 6,692,911 in 3Q20, 2.65% less than in
3Q19 (R$ 6,875,079).
3Q 2020 3Q 2019 Change, %
MWh (2)
R$
Average price
billed – R$/MWh
(1)
MWh (2)
R$
Average price billed – R$/MWh
(1)
MWh
R$
Residential 2,652,121 2,408,833 908.27 2,557,935 2,458,671 961.19 3,68 (2.03) Industrial 3,282,736 1,062,910 323.79 3,972,454 1,239,412 312.00 (17,36) (14.24) Commercial, Services, Others
1,938,028 1,125,855 580.93
2,290,720 1,336,909 583.62 (15,40) (15.79)
Rural 1,139,551 632,227 554.80 1,054,770 593,821 562.99 8,04 6.47 Public authorities 149,154 112,958 757.32 205,123 158,343 771.94 (27,29) (28.66) Public lighting 327,039 145,863 446.01 348,476 167,642 481.07 (6,15) (12.99)
Public services 347,469 186,818 537.65 315,588 195,474 619.40 10,10 (4.43)
Subtotal 9,836,098 5,675,464 577.00 10,745,066 6,150,272 572.38 (8,46) (7.72) Own consumption 7,559 - - 11,012 - - (31,36) - Retail supply not yet
invoiced, net - 109,738 - - (2,403) - -
(4.666.71)
9,843,657 5,785,202 587.71 10,756,078 6,147,869 571.57 (8,48) (5.90) Wholesale supply to
other concession holders (3)
3,150,749 818,168 259.67 3,099,633 755,593 243.77 1,65 8.28
Wholesale supply not yet invoiced, net
- 89,541 - - (28,383) - - (415.47)
Total 12,994,406 6,692,911 499.73 13,855,711 6,875,079 498.41 (6,22) (2.65)
(1) The calculation of the average price does not include revenue from supply not yet billed. (2) Information in MWh has not been reviewed by external auditors. (3) Includes Regulated Market Electricity Sale Contracts (CCEARs) and ‘bilateral contracts’ with other agents.
Final consumers
Revenue from energy sold to final consumers in 3Q20 was R$ 5,785,202, compared to
R$ 6,147,869 in 3Q19: 5.90% lower YoY.
This was due in particular to consumption by industrial clients 17.36% lower, and by
commercial clients 15.40% lower, due to the Covid pandemic – partly offset by
residential consumption 3.68% higher, and rural consumption 8.04% higher.
Revenue from Use of the Distribution System (the TUSD charge)
This is revenue from charging Free Consumers the Tariff for Use of the Distribution
System (TUSD) on the volume of energy distributed. In 3Q20 this revenue was R$
793,698, or 11.6% more than in 3Q19 (R$ 711,185). The higher revenue mainly reflects
the Company’s annual tariff adjustment in effect from June 1, 2019, which for Free
Clients resulted in an increase of approximately 10.16% (effect up to August 18, 2020).
After the tariff adjustment was recalculated to include the return of R$ 714,339 to

9 Cem
consumers, this impact was an increase of 5.71% for Free Clients as from August 19,
2020. Also, the volume of energy transported in 3Q20 was 7.80% higher than in 3Q19.
CVA and Other financial components in tariff adjustments
In its financial statements Cemig recognizes the difference between actual non-
controllable costs (in which the CDE, and electricity bought for resale, are significant
components) and the costs that were used as the basis for decision on the rates charged
to consumers. In 3Q20 this item comprised a gain of R$ 17,192, compared with an
negative item of R$ 35,122 in 3Q19. This difference mainly reflects higher additions to
CVA revenue in 3Q20, due mainly to: (i) higher costs of supply from Itaipu, due to the
higher dollar exchange rate than in 3Q19; and (ii) expenses on the National Grid
approximately 40.5% higher than in 3Q19 after the revision in July 2020. These effects
were partially offset by lower CDE charges, due to finalization of the ACR (Regulated
Market) account in August 2019, and the result of the 2019 tariff adjustment, which was
approved at a significantly higher level than in the previous year. The Company’s CVA
result for the quarter was R$ 331,376 negative, after receipt of part of the funds from
the Covid account in 3Q20.
Changes in balances of financial assets and liabilities:
R$ ’000 Balance at June 30, 2019 1,130,865 Net constitution of financial assets 201,653 Realized -236,775
Payments from the Flag Tariff Centralizing Account -27,594
Updating – Selic rate 31,825
Balance at September 30, 2019 1,099,974 Balance at June 30, 2020 926,183 Net constitution of financial assets -86,013 Realized 103,205
Payments from the Flag Tariff Centralizing Account 0
Receipt of funds from the Covid Account -1,280,344 Updating – Selic rate 5,593
Balance at September 30, 2020 -331,376

10 Cem
Transmission concession revenue Cemig GT’s revenue from transmission comprises the sum of the revenues from all the
transmission assets. The concession contracts establish the Permitted Annual Revenue
(Receita Anual Permitida, or RAP) for the assets of the existing system, updated annually,
based mainly on the variation in the IPCA index (the IPCA index is applied to the
contracts of Cemig GT, and the IGP–M index is applied to the contract of Cemig Itajubá).
Whenever there is strengthening, improvement or adaptation of an existing asset made
under a specific authorization from Aneel, an addition is made to the RAP.
This revenue was R$ 134,328 in 3Q20, compared to R$ 132,134 in 3Q19, 1.66% higher
YoY, mainly as a result of the adjustment to annual RAP made in July 2020, of 3.69%,
which includes the effects of inflation and also new revenues related to investments that
have been authorized. It also includes an adjustment to expectation of cash flow from
financial assets, due to the change in the fair value of the Regulatory Remuneration Base
of Assets (BRR).
Transmission reimbursement revenue
The Company records the updating of the balance receivable for the indemnity
(reimbursement of asset value) based on the IPCA inflation index, and the average
Regulatory cost of capital, as specified in the regulation for the sector. The transmission
indemnity revenue in 3Q20 was 21.99% higher than in 3Q19 – at R$ 41,035, compared
to R$ 33,637 in 3Q19.
These revenues were mainly affected by the increase of remuneration at average cost
of capital, which, as well as increasing from 6.64% in 3Q19 to 7.71% in 3Q20, as from
June 30, 2020 began to be calculated on the re-measured Regulatory Remuneration
Base (BRR), as a result of the periodic review of RAP.
At the beginning of the tariff cycle, which takes place in July of each year, the amounts
received for the adjustment set for the cycle, corresponding to the amortization of the
debtor balance up to the end of the period, are excluded from the remuneration base
for updating, reducing the remuneration. The indemnity (reimbursement) is being
received through the RAP (Permitted Annual Revenue) since 2017, over a period of 8
years, for the financial portion, and for the remaining period of the useful life of the
assets, for the economic portion.
11 Cem
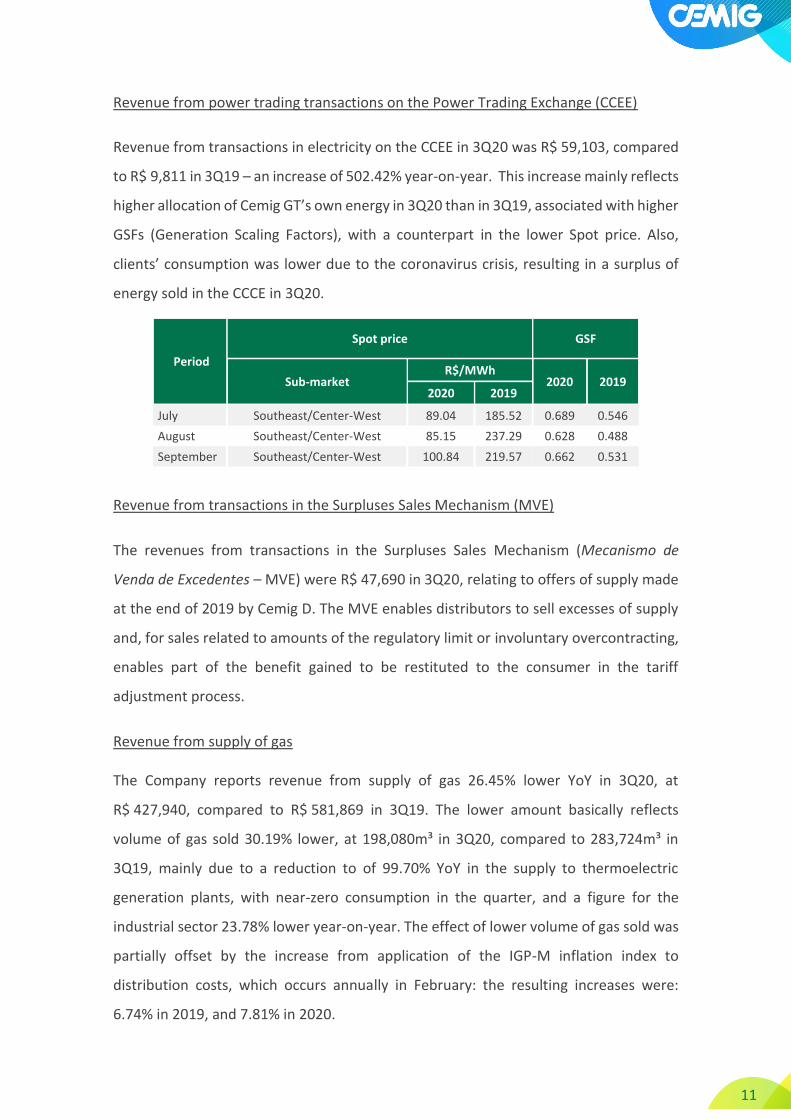
Revenue from power trading transactions on the Power Trading Exchange (CCEE)
Revenue from transactions in electricity on the CCEE in 3Q20 was R$ 59,103, compared
to R$ 9,811 in 3Q19 – an increase of 502.42% year-on-year. This increase mainly reflects
higher allocation of Cemig GT’s own energy in 3Q20 than in 3Q19, associated with higher
GSFs (Generation Scaling Factors), with a counterpart in the lower Spot price. Also,
clients’ consumption was lower due to the coronavirus crisis, resulting in a surplus of
energy sold in the CCCE in 3Q20.
Period
Spot price GSF
Sub-market R$/MWh
2020 2019 2020 2019
July Southeast/Center-West 89.04 185.52 0.689 0.546
August Southeast/Center-West 85.15 237.29 0.628 0.488
September Southeast/Center-West 100.84 219.57 0.662 0.531
Revenue from transactions in the Surpluses Sales Mechanism (MVE)
The revenues from transactions in the Surpluses Sales Mechanism (Mecanismo de
Venda de Excedentes – MVE) were R$ 47,690 in 3Q20, relating to offers of supply made
at the end of 2019 by Cemig D. The MVE enables distributors to sell excesses of supply
and, for sales related to amounts of the regulatory limit or involuntary overcontracting,
enables part of the benefit gained to be restituted to the consumer in the tariff
adjustment process.
Revenue from supply of gas The Company reports revenue from supply of gas 26.45% lower YoY in 3Q20, at
R$ 427,940, compared to R$ 581,869 in 3Q19. The lower amount basically reflects
volume of gas sold 30.19% lower, at 198,080m³ in 3Q20, compared to 283,724m³ in
3Q19, mainly due to a reduction to of 99.70% YoY in the supply to thermoelectric
generation plants, with near-zero consumption in the quarter, and a figure for the
industrial sector 23.78% lower year-on-year. The effect of lower volume of gas sold was
partially offset by the increase from application of the IGP-M inflation index to
distribution costs, which occurs annually in February: the resulting increases were:
6.74% in 2019, and 7.81% in 2020.

12 Cem
Market (thousand m³/day) 2015 2016 2017 2018 2019 9M20 9M19
Residential 1.04 3.38 11.44 17.73 21.28 25.45 21.01
Commercial 22.42 24.68 32.67 39.37 47.7 46.95 44.22
Industrial 2,422.78 2,173.76 2,453.22 2,400.41 2,085.32 1,922.70 2,142.86
Other 119.87 120.19 126.15 155.14 148.44 114.18 150.24
Total, excluding thermoelectric generation
2,566.11 2,322.01 2,623.47 2,612.65 2,302.74 2,109.28 2,358.33
Thermoelectric generation 1,309.13 591.52 990.89 414.04 793.94 194.92 649.25
Total 3,875.24 2,913.53 3,614.36 3,026.69 3,096.69 2,304.20 3,007.58
Supply of gas to the residential market began in 2013. In September 2020, a total of
55,693 households were supplied and billed. The number of clients in the commercial
sector of the market continues to expand.
Number of clients 2015 2016 2017 2018 2019 3Q 2020
Residential 3,820 14,935 30,605 41,377 50,813 55,693
Commercial 218 394 591 756 981 1003
Industrial 113 112 107 109 109 99
Other 62 49 50 57 61 64
Thermoelectric generation 2 2 2 2 2 2
Total 4,215 15,492 31,355 42,301 51,966 56,861
Taxes and charges on revenue
The total of these taxes and charges reported as deductions from revenue in 3Q20 was
R$ 2,858,090, or 8.07% less than in 3Q19 (R$ 3,109,043).
The Energy Development Account – CDE
The amounts of payments to the Energy Development Account (CDE) are decided by an
Aneel Resolution. The purpose of the CDE is to cover costs of concession indemnities
(reimbursements of costs of assets), tariff subsidies, the subsidy for balanced tariff
reduction, the low-income-consumer subsidy, the coal consumption subsidy, and the
Fuels Consumption Account (CCC). The charges for contribution to the CDE in 3Q20 were
R$ 608,848 in 3Q20, compared to R$ 638,919 in 3Q19, or 4.71% lower, mainly due to
the termination of the Regulated Market Account (‘the ACR Account’), in August 2019.

13 Cem
This is a non-manageable cost: the difference between the amounts used as a reference
for setting of tariffs and the costs actually incurred is compensated for in the subsequent
tariff adjustment.
Consumer charges – the ’Flag’ Tariff system
The ‘Flag’ Tariff bands are activated as a result of low levels of water in the system’s
reservoirs – tariffs are temporarily increased due to scarcity of rain. The ‘Red’ band has
two levels – Level 1 and Level 2. Level 2 comes into effect when scarcity is more intense.
Activation of the flag tariffs generates an impact on billing in the subsequent month.
Charges to the consumer arising from the ‘Flag Tariff’ system in 3Q20 were 99.98% lower
year-on-year – at R$ 16 in 3Q20, vs. R$ 73,474 in 3Q19. The lower figure reflects non-
application of the ‘flag’ system in July through September 2020, due to the exceptional
temporary suspension of its systematic application, with the ‘flag’ set at ‘green’ up to
December, 31, 2020, by Aneel dispatch 1511 of May 26, 2020.
The ‘Flag’ Tariff – history June 2020 Green Jun. 2019 Green
July 2020 Green July 2019 Yellow
Aug. 2020 Green Aug. 2019 Red 1
Sep. 2020 Green Sep. 2019 Red 1

14 Cem
Operational costs and expenses
Operational costs and expenses in 3Q20 totaled R$ 5,152,565, or 20.56% less than in
3Q19 (R$ 6,486,375).
The following paragraphs comment on the main variations in expenses:
People The expense on personnel in 3Q20 was R$ 290,095, or 4.68% lower than in 3Q19
(R$ 304,350). The lower figure reflects the number of employees being 6.90% lower, at
5,363 in 3Q20, compared to 5,733 in 3Q19, and the salary increase of 2.55% from
November 2019, under the Collective Work Agreement.
Number of employees – by company
Outsourced services
Personnel
Infrastructure construction costs
Provisions
Other operational expenses
Depreciation
Gas purchased for resale
Electricity bought for resale
Post-employment expenses
Charges for transmission
4Q18 1Q19 2Q19 3Q19 4Q19 1Q20 2Q20 3Q20
15 Cem
Employees’ and managers’ profit shares
The expense on employees’ and managers’ profit shares in 3Q20 was R$ 75,602,
compared to a reversal of R$ 14,572 in 3Q19.
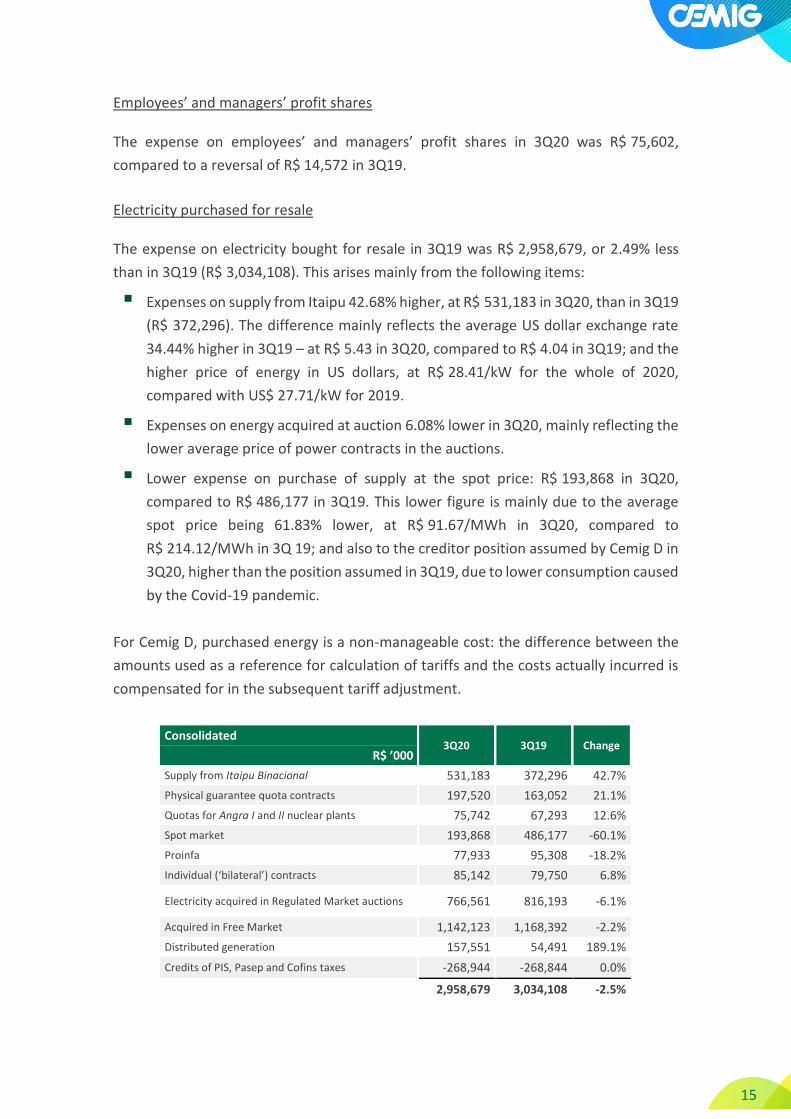
Electricity purchased for resale
The expense on electricity bought for resale in 3Q19 was R$ 2,958,679, or 2.49% less
than in 3Q19 (R$ 3,034,108). This arises mainly from the following items:
Expenses on supply from Itaipu 42.68% higher, at R$ 531,183 in 3Q20, than in 3Q19
(R$ 372,296). The difference mainly reflects the average US dollar exchange rate
34.44% higher in 3Q19 – at R$ 5.43 in 3Q20, compared to R$ 4.04 in 3Q19; and the
higher price of energy in US dollars, at R$ 28.41/kW for the whole of 2020,
compared with US$ 27.71/kW for 2019.
Expenses on energy acquired at auction 6.08% lower in 3Q20, mainly reflecting the
lower average price of power contracts in the auctions.
Lower expense on purchase of supply at the spot price: R$ 193,868 in 3Q20,
compared to R$ 486,177 in 3Q19. This lower figure is mainly due to the average
spot price being 61.83% lower, at R$ 91.67/MWh in 3Q20, compared to
R$ 214.12/MWh in 3Q 19; and also to the creditor position assumed by Cemig D in
3Q20, higher than the position assumed in 3Q19, due to lower consumption caused
by the Covid-19 pandemic.
For Cemig D, purchased energy is a non-manageable cost: the difference between the
amounts used as a reference for calculation of tariffs and the costs actually incurred is
compensated for in the subsequent tariff adjustment.
Consolidated 3Q20 3Q19 Change
R$ ’000
Supply from Itaipu Binacional 531,183 372,296 42.7%
Physical guarantee quota contracts 197,520 163,052 21.1%
Quotas for Angra I and II nuclear plants 75,742 67,293 12.6%
Spot market 193,868 486,177 -60.1%
Proinfa 77,933 95,308 -18.2%
Individual (‘bilateral’) contracts 85,142 79,750 6.8%
Electricity acquired in Regulated Market auctions 766,561 816,193 -6.1%
Acquired in Free Market 1,142,123 1,168,392 -2.2%
Distributed generation 157,551 54,491 189.1%
Credits of PIS, Pasep and Cofins taxes -268,944 -268,844 0.0%
2,958,679 3,034,108 -2.5%

16 Cem
Cemig D 3Q20 3Q19 Change
R$ ’000
Supply from Itaipu Binacional 531,183 372,296 42.7%
Physical guarantee quota contracts 207,776 192,498 7.9%
Quotas for Angra I and II nuclear plants 75,742 67,294 12.6%
Spot market – CCEE 163,903 420,843 -61.1%
Individual (‘bilateral’) contracts 85,142 79,750 6.8%
Acquired in Regulated Market auctions 775,023 805,067 -3.7%
Proinfa 77,933 95,308 -18.2%
Distributed generation 157,551 54,491 189.1%
Credits of PIS, Pasep and Cofins taxes -164,901 -161,575 2.1%
1,909,352 1,925,972 -0.9%
Charges for use of the transmission network
Charges for use of the national grid in 3Q20 were R$ 534,788, or 42.15% higher than in
3Q19 (R$ 376,216). This expense is payable by electricity distribution and generation
agents for use of the facilities that are components of the national grid. The amounts to
be paid are set by an Aneel Resolution.
The higher figure reflects the annual adjustment in charges for the National Grid,
normally applied in July, which had an effect of approximately 41% in 3Q20.
This is a non-manageable cost in the distribution activity: the difference between the
amounts used as a reference for calculation of tariffs and the costs actually incurred is
compensated for in the subsequent tariff adjustment.
Gas bought for resale
In 3Q20 the Company’s expense on acquisition of gas was R$ 207,361, 44.72% less than
its comparable expense of R$ 375,140 in 3Q19. This basically reflects volume of gas
purchased 30.93% lower, at 197,315m³ in 3Q20, compared to 285,686m³ in 3Q19.
Post-retirement obligations
The impact on operational profit of the Company’s post-retirement obligation was an
expense of R$ 110,512 in 3Q20, compared to an expense of R$ 105,397 in 3Q19. This is
mainly the result of reduction in the discount rate used in the actuarial calculation –
which increased the amount of the actuarial liabilities, and consequently the scale of the
expense reported.

17 Cem
Operational provisions
The Company posted a reversal of R$ 101,606 in operational provisions in 3Q20,
compared to inclusion of new provisions totaling R$ 1,297,003 in 3Q19. This arises
mainly from the following items:
In 3Q19 the Company posted net contingency provisions for tax legal actions of
R$ 1,175,896 – while in 3Q20 it posted provisions of only R$ 17,747 in the same
category: the major item in 3Q19 was a provision of R$ 1,182,613, based on the
opinion of the Company’s legal advisers, for probability of loss in legal actions
arguing for application of Social Security contributions to payment of profit
shares without prior agreement on productivity indicator targets.
Reversal, totaling R$ 156,829, of losses expected from doubtful receivables, in
3Q20, compared to posting of new provisions of R$ 101,383 in 3Q19. This
comprises mainly a reversal of a provision of R$ 231 million for debt owed to the
Company by the State of Minas Gerais; non-realization of the loss expected in
the second quarter from effects of the Covid-19 pandemic; and good acceptance
by clients of the rules for negotiation approved by the Company, which reduced
default in 3Q20.
Default – Cemig D
The start of 2020 was marked by a high degree of uncertainty in the social and economic
spheres both in Brazil and worldwide, with the proliferation of the public health crisis
caused by the Covid-19 coronavirus, and its arrival in Brazil.
To try to mitigate the impacts of the pandemic and help sustain its clients’ payment
capacity, Cemig is launched special payment conditions to help, principally, low-income
clients, hospitals and micro-companies. New channels of payment, such as new debit
and credit cards, were put in place, to expand consumers’ payment options.
New channels of communication, such as WhatsApp, have been put in place, as well as
campaigns to enrich the client registry information. These were adopted in April. These
measures aim to expand the scope and efficiency of the tools for approaching
consumers, including approach for negotiations.
18 Cem
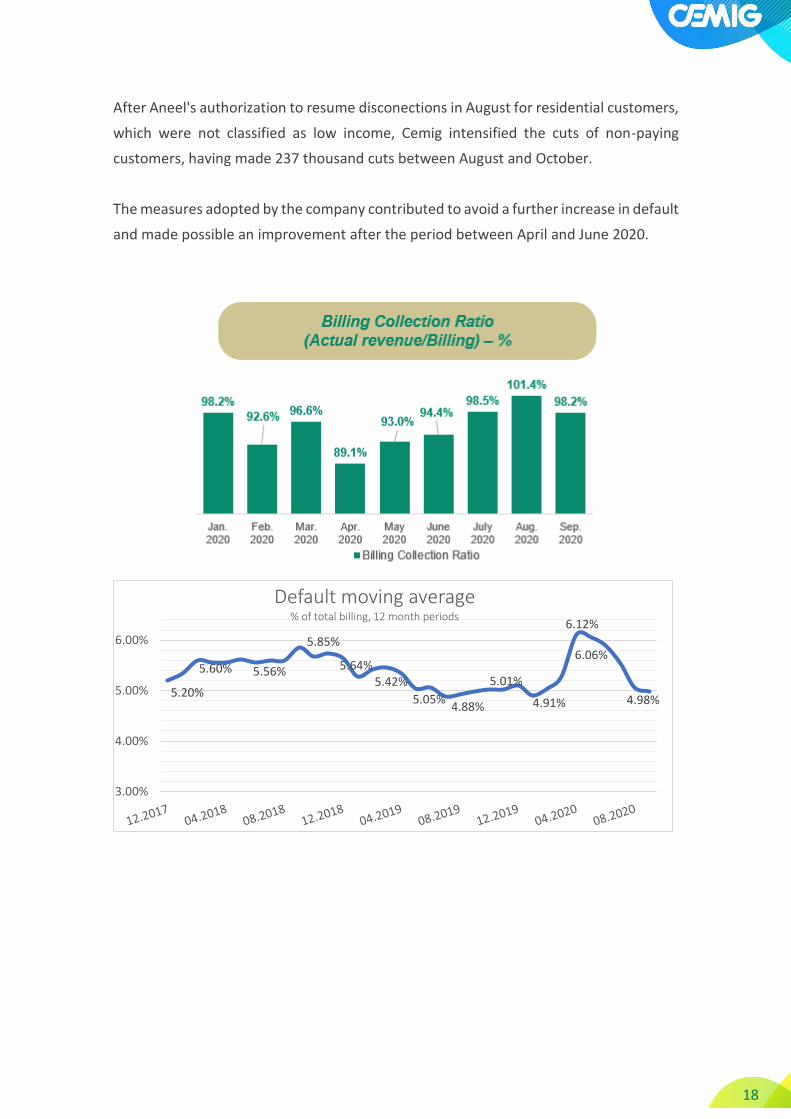
After Aneel's authorization to resume disconections in August for residential customers,
which were not classified as low income, Cemig intensified the cuts of non-paying
customers, having made 237 thousand cuts between August and October.
The measures adopted by the company contributed to avoid a further increase in default
and made possible an improvement after the period between April and June 2020.
5.20%
5.60% 5.56%
5.85%
5.64%5.42%
5.05%4.88%
5.01%
4.91%
6.12%
6.06%
4.98%
3.00%
4.00%
5.00%
6.00%
Default moving average% of total billing, 12 month periods
19 Cem
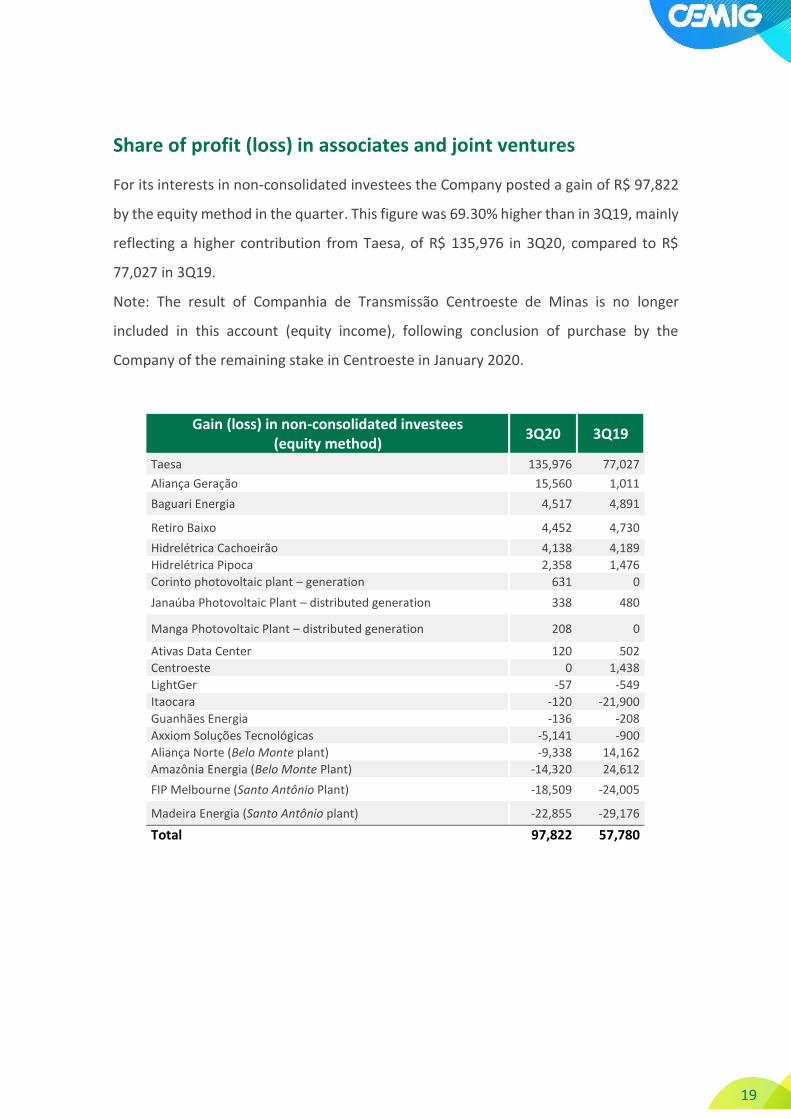
Share of profit (loss) in associates and joint ventures
For its interests in non-consolidated investees the Company posted a gain of R$ 97,822
by the equity method in the quarter. This figure was 69.30% higher than in 3Q19, mainly
reflecting a higher contribution from Taesa, of R$ 135,976 in 3Q20, compared to R$
77,027 in 3Q19.
Note: The result of Companhia de Transmissão Centroeste de Minas is no longer
included in this account (equity income), following conclusion of purchase by the
Company of the remaining stake in Centroeste in January 2020.
Gain (loss) in non-consolidated investees (equity method)
3Q20 3Q19
Taesa 135,976 77,027
Aliança Geração 15,560 1,011
Baguari Energia 4,517 4,891
Retiro Baixo 4,452 4,730
Hidrelétrica Cachoeirão 4,138 4,189
Hidrelétrica Pipoca 2,358 1,476
Corinto photovoltaic plant – generation 631 0
Janaúba Photovoltaic Plant – distributed generation 338 480
Manga Photovoltaic Plant – distributed generation 208 0
Ativas Data Center 120 502
Centroeste 0 1,438
LightGer -57 -549
Itaocara -120 -21,900
Guanhães Energia -136 -208
Axxiom Soluções Tecnológicas -5,141 -900
Aliança Norte (Belo Monte plant) -9,338 14,162
Amazônia Energia (Belo Monte Plant) -14,320 24,612
FIP Melbourne (Santo Antônio Plant) -18,509 -24,005
Madeira Energia (Santo Antônio plant) -22,855 -29,176
Total 97,822 57,780
20 Cem
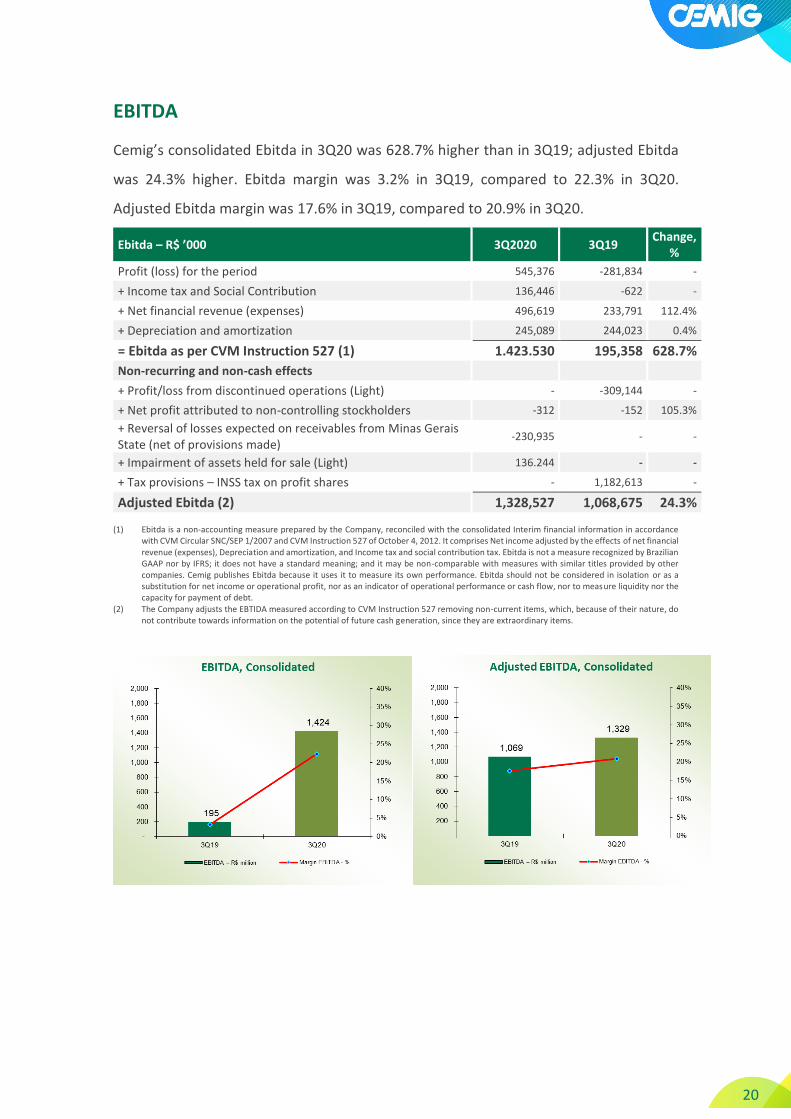
EBITDA
Cemig’s consolidated Ebitda in 3Q20 was 628.7% higher than in 3Q19; adjusted Ebitda
was 24.3% higher. Ebitda margin was 3.2% in 3Q19, compared to 22.3% in 3Q20.
Adjusted Ebitda margin was 17.6% in 3Q19, compared to 20.9% in 3Q20.
Ebitda – R$ ’000 3Q2020 3Q19 Change,
%
Profit (loss) for the period 545,376 -281,834 -
+ Income tax and Social Contribution 136,446 -622 -
+ Net financial revenue (expenses) 496,619 233,791 112.4%
+ Depreciation and amortization 245,089 244,023 0.4%
= Ebitda as per CVM Instruction 527 (1) 1.423.530 195,358 628.7%
Non-recurring and non-cash effects
+ Profit/loss from discontinued operations (Light) - -309,144 -
+ Net profit attributed to non-controlling stockholders -312 -152 105.3%
+ Reversal of losses expected on receivables from Minas Gerais State (net of provisions made)
-230,935 - -
+ Impairment of assets held for sale (Light) 136.244 - -
+ Tax provisions – INSS tax on profit shares - 1,182,613 -
Adjusted Ebitda (2) 1,328,527 1,068,675 24.3%
(1) Ebitda is a non-accounting measure prepared by the Company, reconciled with the consolidated Interim financial information in accordance with CVM Circular SNC/SEP 1/2007 and CVM Instruction 527 of October 4, 2012. It comprises Net income adjusted by the effects of net financial revenue (expenses), Depreciation and amortization, and Income tax and social contribution tax. Ebitda is not a measure recognized by Brazilian GAAP nor by IFRS; it does not have a standard meaning; and it may be non-comparable with measures with similar titles provided by other companies. Cemig publishes Ebitda because it uses it to measure its own performance. Ebitda should not be considered in isolation or as a substitution for net income or operational profit, nor as an indicator of operational performance or cash flow, nor to measure liquidity nor the capacity for payment of debt.
(2) The Company adjusts the EBTIDA measured according to CVM Instruction 527 removing non-current items, which, because of their nature, do not contribute towards information on the potential of future cash generation, since they are extraordinary items.

21 Cem
EBITDA Cemig GT
Ebitda – R$ ’000 3Q2020 3Q19 Change, %
Profit (loss) for the period 3,005 -133,952 -
+ Income tax and Social Contribution -10,665 -60,481 -82,4%
+ Net financial revenue (expenses) 495,479 212,713 132,9%
+ Depreciation and amortization 50,883 57,296 -11,2%
= Ebitda as per CVM Instruction 527 (1) 538.702 75,576 612,8%
Non-recurring and non-cash effects
+ Tax provisions – INSS tax on profit shares - 258,625 -
Adjusted Ebitda (2) 538.702 334,201 61,2%
EBITDA Cemig D
Ebitda – R$ ’000 3Q2020 3Q19 Change,
%
Profit (loss) for the period 458,373 -315,548 -
+ Income tax and Social Contribution 180,554 -19,033 -
+ Net financial revenue (expenses) -3,348 25,331 -
+ Depreciation and amortization 167,217 163,993 2.00%
= Ebitda as per CVM Instruction 527 (1) 802.796 -145,257 -
+ Reversal of losses expected on receivables from Minas Gerais State (net of provisions made)
-230,935 - -
+ Tax provisions – INSS tax on profit shares - 763,728 -
Adjusted Ebitda (2) 571.861 618,471 -7.50%
Financial revenue and expenses
The Company reports Net financial expenses in 3Q20 of R$ 496,619, which compares
with R$ 233,791 in 3Q19. This reflects two main factors:
Lower variation in the fair value of the hedge instrument in 3Q20, totaling
R$ 2,651, compared to a negative FX effect on the principal of the debt in foreign
currency (Eurobonds), of R$ 247,050 – generating a net negative variation of
R$ 244,399.

22 Cem
In 3Q19, there was (a) a positive YoY increase in the fair value of the hedge
instrument, of R$ 485,836, and (b) an expense from FX variation of the debt in
foreign currency, of R$ 498,300, generating a net negative variation of R$ 12,464.
R$ ’000 3Q20 3Q19
Gain on hedge 2,651 485,836
Effect on the principal of the Eurobond debt 247,050 498,300
Total effect on Financial revenue (expenses) -244,399 -12,464
Cemig’s consolidated electricity market
The Cemig Group makes its sales of electricity through its distribution company, Cemig
Distribuição (‘Cemig D’), its generation and transmission company Cemig Geração e
Transmissão (‘Cemig GT’), and other wholly-owned subsidiaries: Horizontes Energia, Sá
Carvalho, Cemig PCH, Rosal Energia, the Praias de Parajuru and Volta do Rio wind farms,
Cemig Geração Camargos, Cemig Geração Itutinga, Cemig Geração Salto Grande, Cemig
Geração Três Marias, Cemig Geração Leste, Cemig Geração Oeste, and Cemig Geração
Sul.
This market comprises sales of electricity to:
(I) captive consumers in Cemig’s concession area in the State of Minas Gerais;
(II) Free Consumers in both the State of Minas Gerais and other States of Brazil, in the
Free Market (Ambiente de Contratação Livre, or ACL);
(III) other agents of the electricity sector – traders, generators and independent power
producers, also in the ACL; and
(IV) Distributors, in the Regulated Market (Ambiente de Contratação Regulada – ACR).
The Cemig group traded a total of 12,994,406 MWh on the CCEE in 3Q20, 6.2% less than
in 3Q19. Sales of electricity to final consumers, plus Cemig’s own consumption, totaled
9,843,657 MWh, or 8.5% less than in 3Q19. Sales to distributors, traders, other
generating companies and independent power producers in 3Q20 were 3,150,749 MWh
– or 1.6% more than in 3Q19.
In September 2020 the Cemig Group invoiced 8,669,868 clients – a growth of 1.9% in
the consumer base since September 2019. Of these, 8,669,487 were in the group
comprising final consumers and Cemig’s own consumption; and 381 were other agents
in the Brazilian power industry.

23 Cem
This chart shows the percentages of the Cemig Group’s sales to final consumers:
Total consumption of electricity (GWh): down 6.2% YoY in 3Q
The electricity market of Cemig D
Electricity billed to captive clients and electricity transported for Free Clients and
distributors with access to Cemig D’s networks in 3Q20 totaled 11,319,188 MWh, or 1.4%
more than in 3Q19. This increase has two components: consumption of the captive
market 3.6% lower YoY, and use of the network by Free Clients 7.8% higher YoY.
Residential
Industrial
Commercial & Services
Rural
Other
3Q20 3Q19
3Q19 Residential Industrial Commercial Rural Otherclasses
Wholesale 3Q20

24 Cem
Captive clients + Transmission service (MWh)
Captive clients + Transmission service (MWh) 3Q20 3Q19 Change,
%
Residential 2,652,121 2,557,935 3.7%
Industrial 5,341,739 5,060,476 5.6%
Commercial, Services and Others 1,259,852 1,513,968 -16.8%
Rural 1,142,610 1,058,560 7.9%
Public authorities 149,154 205,123 -27.3%
Public lighting 327,039 348,477 -6.2%
Public services 347,469 315,588 10.1%
Concession holder (Distribution company) 91,645 91,201 0.5%
Own consumption 7,559 11,012 -31.4%
Total 11,319,188 11,162,340 1.4%
Residential
Residential consumption, comprising 23.4% of the energy distributed by Cemig D in
3Q20, was 3.7% higher than in 3Q19. This increase is related to the addition of 168,914
new consumer units since September 2019; and also to an increase in average monthly
consumption per consumer of approximately 1.2%.
Industrial
Consumption by the industrial consumer category was 47.2% of the total volume of
electricity distributed by Cemig D, and totaled 5,341,739 MWh in 3Q20, or 5.6% more
than in 3Q19. Energy consumed by captive clients totaled 462,136 MWh in 3Q20, 19.4%
less than in 3Q19. The volume of energy transported for industrial Free Clients was
43.1% of the total of energy distributed, and was 4,879,603 MWh in 3Q20, 8.7% more
than in 3Q19.
Commercial and Services
Energy distributed to the commercial category of clients was strongly impacted by the
pandemic and the resulting restriction on functioning of companies, and did not recover
to the same degree as other client categories in 3Q20, but was 16.8% lower than in
3Q19.

25 Cem
Volume was down 20.0% YoY in the captive market, and down 4.40% YoY in the Free
Market. The total energy used by captive clients plus energy transported for Free Clients
in the category totaled 11.1% of the energy distributed by Cemig D in 3Q20.
Rural Consumption by the rural category increased 7.9% compared to 3Q19, as the sector
remains in full activity even in the face of the pandemic and due to less rainfall.
Number of clients A total of 8,669,160 consumers were billed in September 2020, or 163,299 more than in
September 2019. Of this total, 1,683 were Free Clients using the distribution network of
Cemig D.
Cemig D Number of clients Change,
% 3Q20 3Q19 Residential 7,086,929 6,918,015 2.4% Industrial 29,711 29,797 -0.3% Commercial, Services and Others 772,864 768,469 0.6% Rural 690,837 701,915 -1.6% Public authorities 65,958 65,421 0.8% Public lighting 6,867 6,542 5.0% Public services 13,604 13,604 0.0% Own consumption 707 726 -2.6%
8,667,477 8,504,489 1.92% Total energy carried Industrial 813 680 19.6% Commercial 851 682 24.8% Rural 16 7 128.6% Concession holders 3 3 0.0%
1,683 1,372 22.7% Total 8,669,160 8,505,861 1.9%
Physical totals of transport and distribution – MWh
Metered market MWh Change
3Q2020 3Q19 %
Volume carried
Transported for distributors (metered) 93,632 91,229 2.63%
Transported for Free Clients (metered) 5,118,928 4,778,136 7.13%
Own load + Distributed generation (1)(2) 8,278,134 8,141,957 1.67%
Consumption by captive market – Billed supply 6,041,148 6,266,263 -3.59%
Losses in distribution network 2,236,986 1,875,694 19.26%
Total volume carried 13,490,694 13,011,322 3.68%
(1) Includes Distributed Microgeneration. (2) Includes own consumption.

26 Cem
The electricity market of Cemig GT
Cemig GT billed a total of 6,985,906 MWh in 3Q20 – 8.3% less than in 3Q19.
Energy billed to industrial clients was 17.0% lower than in 3Q19, and energy delivered
to commercial clients was 10.3% lower.
Cemig GT (MWh) Change,
% 3Q20 3Q19
Free Clients
Industrial 2,820,599 3,399,353 -17.0%
Commercial 977,301 1,089,600 -10.3%
Rural 4,608 862 434.5%
Free Market – Free contracts 2,657,656 2,609,505 1.8%
Regulated Market 493,093 490,128 0.6%
Regulated Market – Cemig D 32,648 32,538 0.3%
Total 6,985,906 7,621,986 -8.3%
SUPPLY QUALITY INDICATORS – DECi and FECi Cemig is continuously taking action to improve operational management, organization
of the logistics of its emergency services, and has a permanent routine of preventive
inspection and maintenance of substations and distribution lines and networks. It also
invests in training of its staff for improved qualifications, state-of-the-art technologies,
and standardization of work processes, aiming to maintain the quality of electricity
supply, and as a result maintain satisfaction of clients and consumers.
The charts below show Cemig’s indicators for duration and frequency of outages – DECi
(Average Outage Duration per Consumer, in hours), and FECi (Average Outage
Frequency per Consumer, in number of outages), since January 2016.
Quality indicators are linked to the new concession contract of Cemig D (distribution),
signed in 2015.
Note: Figures for 2016 and 2017 are according to recalculation presented by the Company to Aneel.
27 Cem
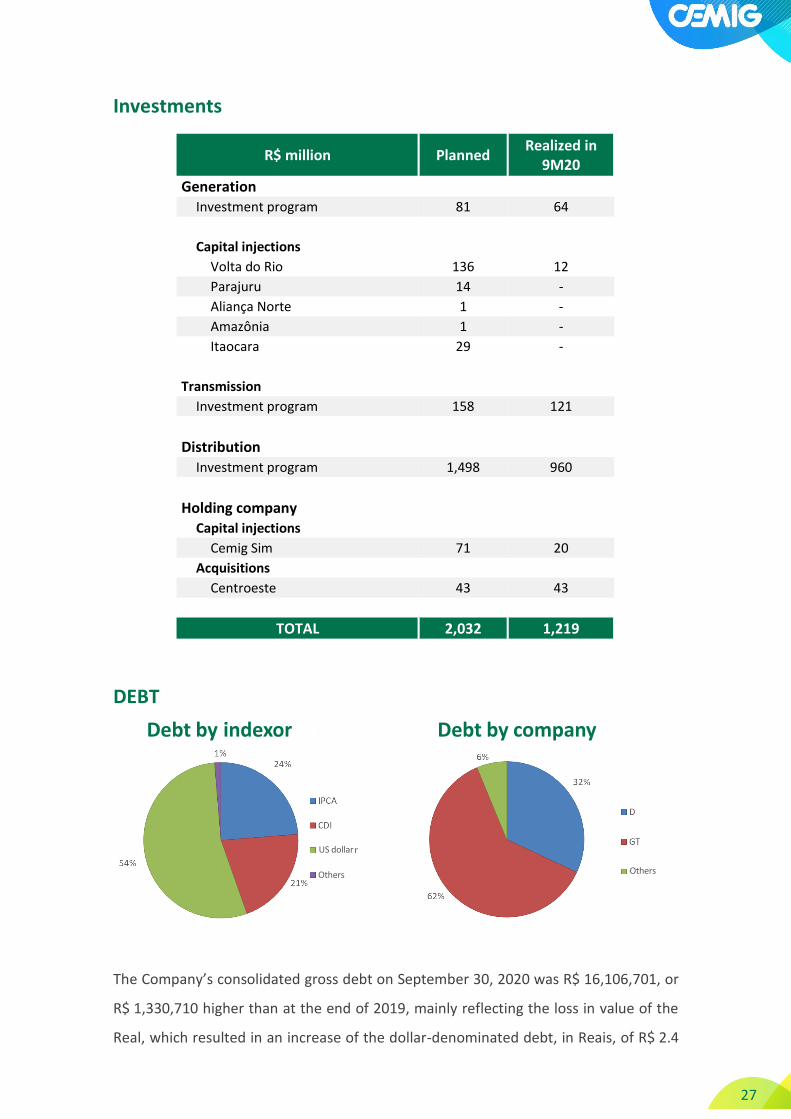
Investments
R$ million Planned Realized in
9M20
Generation Investment program 81 64
Capital injections
Volta do Rio 136 12
Parajuru 14 -
Aliança Norte 1 -
Amazônia 1 -
Itaocara 29 -
Transmission
Investment program 158 121
Distribution Investment program 1,498 960
Holding company Capital injections
Cemig Sim 71 20
Acquisitions Centroeste 43 43
TOTAL 2,032 1,219
DEBT
The Company’s consolidated gross debt on September 30, 2020 was R$ 16,106,701, or
R$ 1,330,710 higher than at the end of 2019, mainly reflecting the loss in value of the
Real, which resulted in an increase of the dollar-denominated debt, in Reais, of R$ 2.4
Debt by indexor Debt by company
US dollar
Others Others

28 Cem
billion in the period. It is important to note that the Company also records a net positive
balance on hedge transactions for the Eurobond issue, in the total amount of
R$ 3,284,142: R$ 1,606,656 for the principal of the debt, and R$ 1,677,486 for the
interest. The total net asset value of the hedge is R$ 1,593,198 greater than at the end
of 2019.
In the first nine months of 2020 a total of R$ 2,187,264 in debt was amortized. During
the period new funds of R$ 850,000 were raised, by Cemig, through its 8th debenture
issue, in September 2020.
Cemig H R$ ’000
September 30, 2020
2019 Change, %
Gross debt 16,106,741 14,776,031 9.01%
Cash and equivalents + Securities 5,519,388 1,289,438 328.05%
Net debt 10,587,353 13,486,593 -21.50%
Debt in foreign currency 8,728,333 6,061,097 44.01%
Cemig GT R$ ’000
Sep. 30, 2020 2019 Change, %
Gross debt 9,948,859 7,886,783 26.15%
Cash and equivalents + Securities 1,763,598 585,203 201.37%
Net debt 8,185,261 7,301,580 12.10%
Debt in foreign currency 8,712,222 6,043,046 44.17%
Cemig D R$ ’000
Sep. 30, 2020 2019 Change, %
Gross debt 5,148,058 5,794,922 -11.16%
Cash and equivalents + Securities 3,271,606 344,611 849.36%
Net debt 1,876,452 5,450,311 -65.57%
Debt in foreign currency 16,112 18,051 -10.74%
Debt amortization timetable (R$ mn)

29 Cem
Covenants – Eurobonds
Cemig’s long term ratings
Cemig’s ratings were upgraded by Moody’s in September, and by Fitch in October.
In its review in July, 2020 S&P upgraded its Outlook to Positive.
This table shows long-term credit risk ratings and outlook for the Company as provided
by the principal rating agencies:
Last 12 months
R$ mn GT H GT H
net income (loss); plus 411 2,030 274 1,202
financial results net; plus 1,431 1,472 1,148 1,209
income tax and social contribution; plus 60 479 10 257
depreciation and amortization; minus 199 968 206 967
minority interest result; minus 107 -226 94 -186
provisions for the variation in value of put option obligations; minus 64 64 65 65
non-operating result (which includes any gains on asset sales and any asset write-off or
impairments); plus 87 91 69 92
any non-cash expenses and non-cash charges, to the extent that they are nonrecurring,
minus 147 373 406 1,487
any non-cash credits and gains increasing net income, to the extent that they are non-
recurring; minus -188 -250 -188 -240
non-cash revenues related to transmission and generation indemnification; plus -388 -388 -381 -381
cash dividends received from minority investments (as measured in the statement of cash
flows); minus 155 343 142 325
monetary updating of concession grant fees; plus -302 -791 -289 -289
cash inflows related to concession grant fees; plus 265 265 263 263
cash inflows related to transmission revenue for cost of capital coverage; plus 398 398 185 185
Covenant EBITDA 2,446 4,828 2,004 4,956
Last 12 months
R$ mn GT H GT H
consolidated Indebtedness; plus 9,948 16,107 9,564 15,862
Derivative financial instruments -3,284 -3,284 -3,281 -3,281
debt contracts with Forluz; plus 232 1,026 246 1,089
(a) the carrying liability of any put option obligation, less 556 556 553 553
consolidated cash and cash equivalents and consolidated marketable securities recorded
as current assets. -1,764 -5,519 -1,361 -3,705
Covenant Net Debt 5,688 8,886 5,721 10,518
Covenant Net Debt to Covenant EBITDA Ratio 2.33 1.84 2.85 2.12
Limit Covenant Net Debt to Covenant EBITDA Ratio 3.00 3.00 4.50 3.50
Total Secured Debt - 651 - 758
Total Secured Debt to Covenant EBITDA Ratio - 0.16 - 0.32
Limit Covenant Net Debt to Covenant EBITDA Ratio - 1.75 - 1.75
Jun/20
Set/20 jun/20
Sep/20
Covenants

30 Cem
Our shares
Security Ticker Currency Sep 30,
2020 Close of
2019 Change,
%
Cemig PN CMIG4 R$ 10.10 12.87 -21.52%
Cemig ON CMIG3 R$ 10.70 14.56 -26.51%
ADR PN CIG US$ 1.83 3.11 -41.16%
ADR ON CIG.C US$ 1.91 3.78 -49.47%
Ibovespa IBOV – 94,603 115,645 -18.20%
Power industry index
IEEX – 68,569 76,627 -10.52%
Source: Economática – Adjusted for corporate action, including dividends.
Trading volume in Cemig’s preferred shares (CMIG4) in 9M20 was R$ 24.7 billion, of
which R$ 7.5 billion was traded in the third quarter, corresponding to a daily average of
R$ 115.28 million – 14.66% lower than in 3Q19. Trading volume in Cemig common
shares in 9M19 was R$ 4.4 billion, with daily trading volume of R$ 22.86 million in the
third quarter.
By volume (aggregate of common (ON) and preferred (PN) shares), Cemig’s shares were
the third most liquid in Brazil’s electricity sector in the period, and among the most
traded in the whole Brazilian equity market. On the New York Stock Exchange the
volume traded in ADRs for Cemig’s preferred shares (CIG) in 9M20 was US$1.81 billion.
We see this as reflecting recognition by the investor market of Cemig as a global
investment option.

31 Cem
The Ibovespa index of the São Paulo Stock Exchange (B3) was down 18.20% in the first
nine months of 2020, still under the influence of the Covid-19 epidemic, closing
September at 94,603 points. Cemig’s shares accompanied the index: the common (ON)
shares were down 26.51% in 9M19, and the preferred (PN) shares down 21.52%. In New
York the ADRs for Cemig’s common shares were down 49.47% in the period, and the
ADRs for the preferred shares were down 41.16%.
Dec. 19 Jan. 20 Feb. 20 Mar. 20 Apr. 20 May 20 Jun. 20 Jul 20 Aug. 20 Sep. 20
–10.52–18.20%–21.52%–26.51%

32 Cem
The ‘Covid Account’
On May 18, 2020, in response to the state of public calamity caused by the Covid-19
pandemic, Decree 10350/2020 authorized creation of the ‘Covid Account’, the purpose
of which was to cover deficits, or anticipate revenue, of holders of concessions or
permissions to distribute electricity – the basis of the financial flows of the electricity
sector, especially related to: (i) overcontracting of supply; (ii) the CVA (‘Portion A’
Variation Compensation Account); (iii) neutrality of sector charges; (iv) postponement
until June 30, 2020 of the results of tariff review processes for distributors ratified up to
that date; and (v) bringing forward of the regulatory asset relating to Portion B, as per
an Aneel regulation and timetable decided by the distributor.
On June 23, 2020 Aneel issued Normative Resolution 885/2020, setting the criteria and
procedures for management of the Covid Account, and also regulating use of the CDE
tariff charge. Under this Resolution, the amounts transferred to each distributor are
reverted as negative financial components in tariff adjustment processes of 2021 and
2022, duly updated by the Selic rate, with neutrality assured.
Cemig D accepted the financial offsetting mechanism of the Covid Account, with a view
to strengthening its cash position, enabling compliance with its financial obligations
even during the reduction of revenue caused by the severe economic downturn.
On July 9, 2020, Aneel announced the total of funds in the ‘Covid Account’ to be
allocated to Cemig D: R$ 1,404,175. This is being paid in stages.
In the third quarter of 2020 Cemig D received R$ 1,280,345 – comprising R$ 1,186,390
on July 31, R$ 50,945 on August 12, and R$ 43,010 on September 14, 2020.
Of the rest, R$ 33,549 was received on October 13, 2020, and the remaining total of
R$ 90,281 will be paid in three tranches in November 2020 through January 2021.

33 Cem
Appendices
Sources and uses of power – billed market
34 Cem
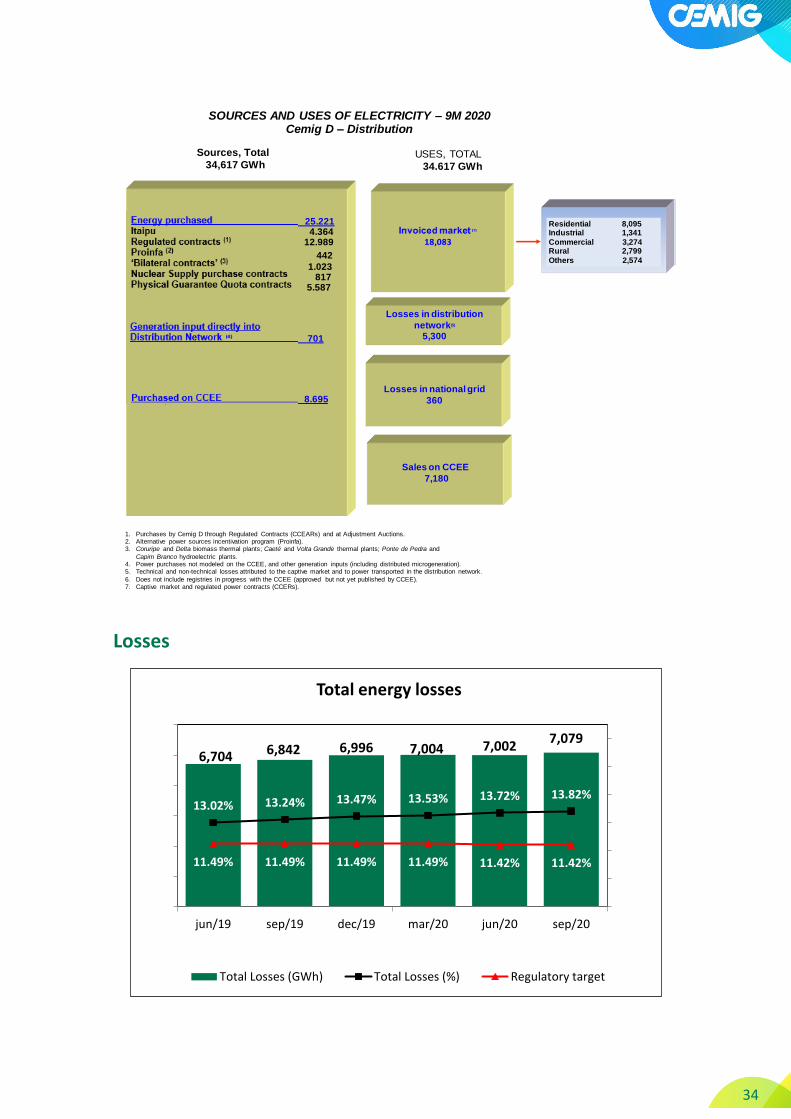
Losses
Sources, Total
34,617 GWhUSES, TOTAL
34.617 GWh
Geração Injetada Diretamente na Rede de Distribuição (4) 701
Energia Comprada 25.221 Itaipu 4.364 Contratos Regulados (1) 12.989
PROINFA (2) 442
Contratos Bilaterais (3) 1.023 Contrato Compra Energia Nuclear 817 Contrato Cota Garantia Fisica 5.587
Residential 8,095 Industrial 1,341
Commercial 3,274Rural 2,799
Others 2,574
Losses in distribution
network(5)
5,300
Losses in national grid
360
Sales on CCEE
7,180
Compra na CCEE 8.695
SOURCES AND USES OF ELECTRICITY – 9M 2020 Cemig D – Distribution
1. Purchases by Cemig D through Regulated Contracts (CCEARs) and at Adjustment Auctions. 2. Alternative power sources incentivation program (Proinfa).3. Coruripe and Delta biomass thermal plants; Caeté and Volta Grande thermal plants; Ponte de Pedra and
Capim Branco hydroelectric plants.4. Power purchases not modeled on the CCEE, and other generation inputs (including distributed microgeneration).5. Technical and non-technical losses attributed to the captive market and to power transported in the distribution network.
6. Does not include registries in progress with the CCEE (approved but not yet published by CCEE). 7. Captive market and regulated power contracts (CCERs).
6,704 6,842 6,996 7,004 7,0027,079
13.02% 13.24% 13.47% 13.53% 13.72% 13.82%
11.49% 11.49% 11.49% 11.49% 11.42% 11.42%
7.00%
9.00%
11.00%
13.00%
15.00%
17.00%
19.00%
2000
3000
4000
5000
6000
7000
8000
jun/19 sep/19 dec/19 mar/20 jun/20 sep/20
Total energy losses
Total Losses (GWh) Total Losses (%) Regulatory target

35 Cem
Plants
Power Plant Cemig's
Stake
Installed Capacity
Cemig H
Assured Energy
Cemig H
Expiration of
Concession Type
Belo Monte 12.3% 1,376 560 August-45 UHE
Emborcação 100.0% 1,192 500 July-25 UHE
Santo Antônio 15.5% 553 376 June-46 UHE
Nova Ponte 100.0% 510 270 July-25 UHE
Irapé 100.0% 399 208 February-35 UHE
Três Marias 100.0% 396 239 January-46 UHE
Aimorés 45.0% 149 82 December-35 UHE
Salto Grande 100.0% 102 75 January-46 UHE
Amador Aguiar I (Capim Branco I) 39.3% 94 61 August-36 UHE
Queimado 82.5% 87 56 January-33 UHE
Nilo Peçanha 22.6% 86 75 June-26 UHE
Amador Aguiar II (Capim Branco II) 39.3% 83 52 August-36 UHE
Funil 45.0% 81 38 December-35 UHE
Sá Carvalho 100.0% 78 56 December-24 UHE
Rosal 100.0% 55 29 May-32 UHE
Itutinga 100.0% 52 28 January-46 UHE
Igarapava 23.7% 50 32 December-28 UHE
Baguari 34.0% 48 29 August-41 UHE
Camargos 100.0% 46 21 January-46 UHE
Ilha dos Pombos 22.6% 42 25 June-26 UHE
Volta do Rio 100.0% 42 18 December-31 EOL
Retiro Baixo 49.9% 42 18 August-41 UHE
Porto Estrela 30.0% 34 19 July-32 UHE
Fontes Nova 22.6% 30 22 June-26 UHE
Praias de Parajuru 100.0% 29 8 September-32 EOL
Pai Joaquim 100.0% 23 14 April-32 PCH
Pereira Passos 22.6% 23 11 June-26 UHE
Piau 100.0% 18 14 January-46 UHE
Paracambi 60.5% 15 12 February-31 PCH
Gafanhoto 100.0% 14 7 January-46 UHE
Cachoeirão 49.0% 13 8 July-30 PCH
Santo Inácio III 45.0% 13 - June-46 EOL
Santa Branca 22.6% 13 7 June-26 UHE
Garrote 45.0% 10 - June-46 EOL
Santo Inácio IV 45.0% 10 - June-46 EOL
São Raimundo 45.0% 10 - June-46 EOL
Othes 201 109
Total 6,018 3,078
Plants(MWh)

36 Cem
RAP – 2020-2021 cycle
RAP (Permitted Annual Revenue - Transmission ) - 2020/2021 cycle RAP % Cemig Cemig
Cemig 866,707,276 100.00% 866,707,276
Cemig GT 820,095,957 100.00% 820,095,957
Cemig Itajuba 26,784,170 100.00% 26,784,170
Centroeste 19,827,149 100.00% 19,827,149
Taesa 2,662,757,000 21.68% 577,285,718
Novatrans 2 413,509,000 89,648,751
TSN 279,621,000 60,621,833
Munirah 38,039,000 8,246,855
GTESA 5,822,000 1,262,210
PATESA 26,074,000 5,652,843
ETAU 25,249,000 5,473,983
ETEO 91,909,000 19,925,871
NTE 125,210,000 27,145,528
STE 85,256,000 18,483,501
ATE I 155,389,000 33,688,335
ATE II 240,250,000 52,086,200
EATE 113,603,000 24,629,130
ETEP 25,614,000 5,553,115
ENTE 117,370,000 25,445,816
ECTE 9,417,000 2,041,606
ERTE 26,343,000 5,711,162
Lumitrans 11,115,000 2,409,732
Transleste 12,763,000 2,767,018
Transirapé 10,188,000 2,208,758
Transudeste 7,647,000 1,657,870
ATE III 119,808,000 25,974,374
São Gotardo 5,175,000 1,121,940
Mariana 14,678,000 3,182,190
Miracema 62,138,000 13,471,518
Janaúba 185,422,000 40,199,490
Aimorés 37,920,000 8,221,056
Paraguaçu 56,603,000 12,271,530
Brasnorte 10,223,000 2,216,346
STC 18,095,000 3,922,996
EBTE 35,751,000 7,750,817
ESDE 6,735,000 1,460,148
ETSE 3,829,000 830,127
ESTE 53,611,000 11,622,865
Ivaí 140,457,000 30,451,078
EDTE 32,968,000 7,147,462
Sant'Ana 58,956,000 12,781,661
Light 10,181,318 22.58% 2,298,942
TOTAL RAP CEMIG 1,446,291,936
* Valores (em R$) consolidados das parcelas das receitas anuais permitidas das concessionárias de transmissão
RAP 2020 - 2021

37 Cem
Profit (loss) with Cemig’s monitoring adjustments
9M20 9M19 9M20 9M19
IFRS 4,041 3,468 1,533 2,630
Gain from the disposal of Light shares - -309 - -224
PIS / Cofins judgment - -1,438 - -1,984
FX exposure – Eurobond - - 403 -438
Provision – receivable from Renova 37 688 37 688
Remeasurement – Light 270 - 178 -
Centroeste: Re-valuation at fair value -52 - -34 -
Periodic Review of Transmission Revenue -430 - -283 -
Reversal in allowance for doubtful receivables from Minas
Gerais State -178 - -117 -
Recognition of tax contingency - Social Secutity contributions - 1,183 - 862
Adjusted 3,688 3,592 1,717 1,534
3Q20 3Q19 3Q20 3Q19
IFRS 1,424 195 545 -282
Gain from the disposal of Light shares - -309 - -224
FX exposure – Eurobond - - 161 8
Remeasurement – Light 136 - 90 -
Reversal in allowance for doubtful receivables from Minas
Gerais State -231 - -152 -
Recognition of tax contingency - Social Secutity contributions - 1,183 - 862
Adjusted 1,329 1,069 644 364
Ebitda Net profit
Ebitda Net profit
Cemig Consolidated
3Q20 3Q19 3Q20 3Q19
IFRS 539 76 3 -134
Recognition of tax contingency - Social Secutity contributions - 259 - 179
FX exposure – Eurobond - - 161 8
Adjusted 539 335 164 53
3Q20 3Q19 3Q20 3Q19
IFRS 803 -145 458 -316
Reversal in allowance for doubtful receivables from Minas
Gerais State -231 - -152 -
Recognition of tax contingency - Social Secutity contributions - 764 - 566
Adjusted 572 619 306 250
Ebitda Net profit
AjustesEbitda Net profit
Cemig GT
Cemig D

38 Cem
Cemig D – Tables (R$ million)
QuarterCaptive
Consumers TUSD ENERGY1 T.E.D2 TUSD PICK3
3Q18 6,309 4,870 11,179 30
4Q18 6,406 4,906 11,313 31
1Q19 6,529 4,760 11,289 33
2Q19 6,288 4,910 11,198 33
3Q19 6,266 4,898 11,164 34
4Q19 6,516 4,783 11,299 33
1Q20 6,254 4,809 11,063 33
2Q20 5,788 4,739 10,526 32
3Q20 6,041 5,069 11,110 33
1. Refers to the quantity of electricity for calculation of the regulatory charges charged to free consumer clients ("Portion A")
2. Total electricity distributed
3. Sum of the demand on which the TUSD is invoiced, according to demand contracted ("Portion B").
CEMIG D Market
CEMIG D Market(GWh)
Operating Revenues (R$ million) 3Q20 2Q20 3Q19 3Q/2Q 3Q/3Q
Sales to end consumers 4,785 4,451 5,070 7.5% -5.6%
Revenue from Use of Distribution Systems (the TUSD charge) 83 - - 0.0% 0.0%
TUSD 800 681 718 17.5% 11.4%
CVA and Other financial components in tariff adjustment 98 136 45 -27.9% 117.8%
Construction revenue 387 333 263 16.2% 47.1%
Others 333 404 335 -17.6% -0.6%
Subtotal 6,486 6,005 6,431 8.0% 0.9%
Deductions 2,319 2,227 2,522 4.1% -8.0%
Net Revenues 4,167 3,778 3,909 10.3% 6.6%
Operating Revenues(R$ million)

39 Cem
Operating Expenses (R$ million) 3Q20 2Q20 3Q19 3Q/2Q 3Q/3Q
Personnel 200 236 210 -15.3% -4.8%
Employees' and managers' profit sharing 50 3 -11 1566.7% -554.5%
Forluz – Post-retirement obligations 75 81 72 -7.4% 4.2%
Materials 16 13 15 23.1% 6.7%
Outsourced services 249 254 247 -2.0% 0.8%
Amortization 169 166 163 1.8% 3.7%
Operating provisions -118 125 854 -194.4% -113.8%
Charges for Use of Basic Transmission Network 553 265 385 108.7% 43.6%
Energy purchased for resale 1,909 1,903 1,926 0.3% -0.9%
Construction Cost 387 333 263 16.2% 47.1%
Other Expenses 42 35 94 20.0% -55.3%
Total 3,532 3,414 4,218 3.5% -16.3%
PMSO 3T20 2T20 3T19 3T/2T 3T/3T
Personnel 325 320 271 1.6% 19.9%
Materials 16 13 15 23.1% 6.7%
Outsourced services 249 254 247 -2.0% 0.8%
Other Expenses 42 35 94 20.0% -55.3%
632 622 627 1.6% 0.8%
Operating Expenses(R$ million)
3Q20 2Q20 3Q19 3Q/2Q 3Q/3Q
Net Revenue 4,167 3,778 3,909 10.3% 6.6%
Operating Expenses 3,532 3,414 4,218 3.5% -16.3%
EBIT 635 364 -309 74.5% -305.5%
EBITDA 802 530 -145 51.3% -653.1%
Financial Result 3 59 -25 -94.9% -112.0%
Provision for Income Taxes, Social Cont & Deferred Income Tax-180 -141 19 27.7% -1047.4%
Net Income 458 282 -315 62.4% -245.4%
Statement of Results (R$ million)
40 Cem
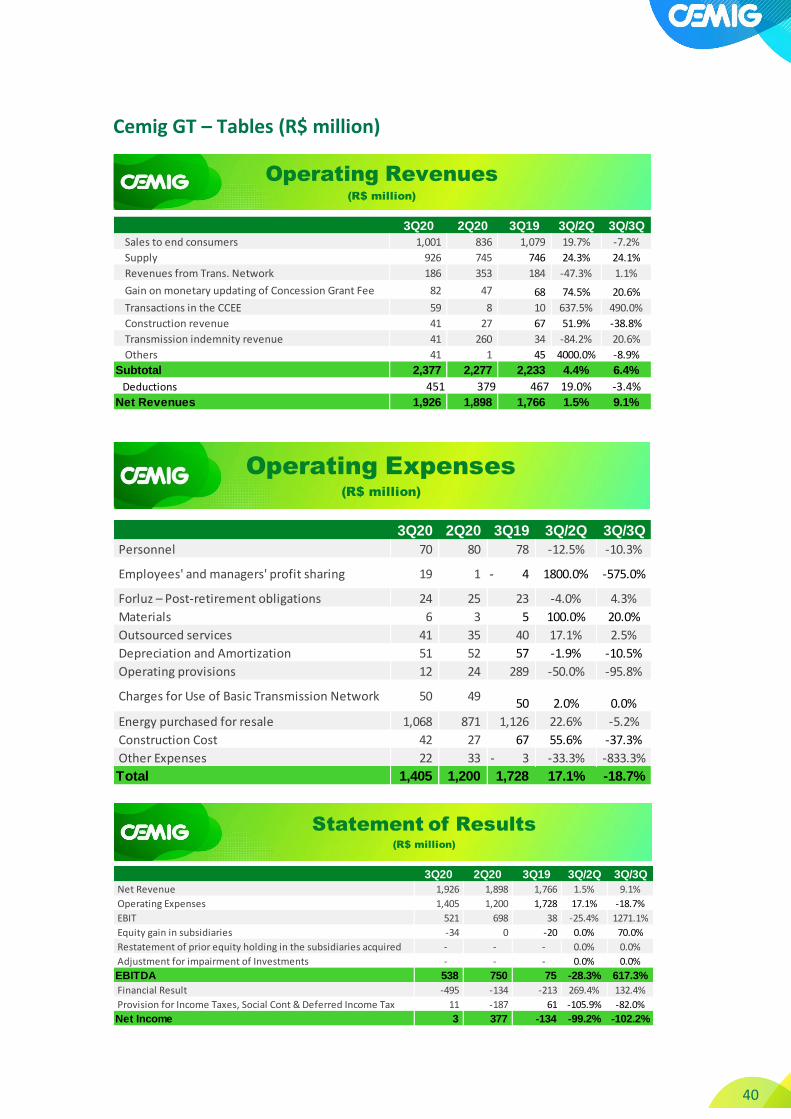
Cemig GT – Tables (R$ million)
3Q20 2Q20 3Q19 3Q/2Q 3Q/3Q
Sales to end consumers 1,001 836 1,079 19.7% -7.2%
Supply 926 745 746 24.3% 24.1%
Revenues from Trans. Network 186 353 184 -47.3% 1.1%
Gain on monetary updating of Concession Grant Fee 82 47 68 74.5% 20.6%
Transactions in the CCEE 59 8 10 637.5% 490.0%
Construction revenue 41 27 67 51.9% -38.8%
Transmission indemnity revenue 41 260 34 -84.2% 20.6%
Others 41 1 45 4000.0% -8.9%
Subtotal 2,377 2,277 2,233 4.4% 6.4%
Deductions 451 379 467 19.0% -3.4%
Net Revenues 1,926 1,898 1,766 1.5% 9.1%
Operating Revenues (R$ million)
3Q20 2Q20 3Q19 3Q/2Q 3Q/3Q
Personnel 70 80 78 -12.5% -10.3%
Employees' and managers' profit sharing 19 1 4- 1800.0% -575.0%
Forluz – Post-retirement obligations 24 25 23 -4.0% 4.3%
Materials 6 3 5 100.0% 20.0%
Outsourced services 41 35 40 17.1% 2.5%
Depreciation and Amortization 51 52 57 -1.9% -10.5%
Operating provisions 12 24 289 -50.0% -95.8%
Charges for Use of Basic Transmission Network 50 49 50 2.0% 0.0%
Energy purchased for resale 1,068 871 1,126 22.6% -5.2%
Construction Cost 42 27 67 55.6% -37.3%
Other Expenses 22 33 3- -33.3% -833.3%
Total 1,405 1,200 1,728 17.1% -18.7%
Operating Expenses (R$ million)
3Q20 2Q20 3Q19 3Q/2Q 3Q/3Q
Net Revenue 1,926 1,898 1,766 1.5% 9.1%
Operating Expenses 1,405 1,200 1,728 17.1% -18.7%
EBIT 521 698 38 -25.4% 1271.1%
Equity gain in subsidiaries -34 0 -20 0.0% 70.0%
Restatement of prior equity holding in the subsidiaries acquired - - - 0.0% 0.0%
Adjustment for impairment of Investments - - - 0.0% 0.0%
EBITDA 538 750 75 -28.3% 617.3%
Financial Result -495 -134 -213 269.4% 132.4%
Provision for Income Taxes, Social Cont & Deferred Income Tax 11 -187 61 -105.9% -82.0%
Net Income 3 377 -134 -99.2% -102.2%
Statement of Results (R$ million)

41 Cem
Cemig Consolidated – Tables (R$ million)
3Q20 2Q20 3Q19 3Q/2Q 3Q/3Q
Residential 2,409 2,307 2,459 4.4% -2.0%
Industrial 1,063 934 1,239 13.8% -14.2%
Commercial 1,126 1,137 1,337 -1.0% -15.8%
Rural 632 511 594 23.7% 6.4%
Others 446 444 521 0.5% -14.4%
Subtotal 5,676 5,333 6,150 6.4% -7.7%
Own Consumption 109 139- 2- 0.0% 0.0%
Supply 908 726 728 25.1% 24.7%
TOTAL 6,693 5,920 6,876 13.1% -2.7%
Energy Sales (R$ million)
3Q20 2Q20 3Q19 3Q/2Q 3Q/3Q
Residential 2,652 2,658 2,558 -0.2% 3.7%
Industrial 3,282 3,106 3,972 5.7% -17.4%
Commercial 1,938 2,085 2,291 -7.1% -15.4%
Rural 1,140 897 1,055 27.1% 8.1%
Others 824 834 869 -1.2% -5.2%
Subtotal 9,836 9,580 10,745 2.7% -8.5%
Own Consumption 8 7 11 14.3% -27.3%
Supply 3,150 3,401 3,100 -7.4% 1.6%
TOTAL 12,994 12,988 13,856 0.0% -6.2%
Energy Sales (GWh)
3Q20 2Q20 3Q19 3Q/2Q 3Q/3Q
Sales to end consumers 5,675 5,333 6,150 6.4% -7.7%
Supply 909 726 727 25.2% 25.0%
TUSD 794 674 712 17.8% 11.5%
CVA and Other financial components in tariff adjustment 17 136 35- -87.5% -148.6%
Transmission concession revenue 134 300 132 -55.3% 1.5%
Transmission Indemnity Revenue 41 260 34 -84.2% 20.6%
Gain on monetary updating of Concession Grant Fee 82 46 68 - 20.6%
Transactions in the CCEE 59 7 10 742.9% 490.0%
Gas supply 428 403 582 6.2% -26.5%
Construction revenue 439 373 341 17.7% 28.7%
Others 649 363 458 78.8% 41.7%
Subtotal 9,227 8,621 9,179 7.0% 0.5%
Deductions 2858 2687 3109 6.4% -8.1%Net Revenues 6,369 5,934 6,070 7.3% 4.9%
Operating Revenues (R$ million)

42 Cem
3Q20 2Q20 3Q19 3Q/2Q 3Q/3Q
Personnel 290 339 304 -14.5% -4.6%
Employees’ and managers’ profit sharing 75 7 15- 971.4% -600.0%
Forluz – Post-Retirement Employee Benefits 111 118 105 -5.9% 5.7%
Materials 23 16 21 43.8% 9.5%
Outsourced services 303 303 308 0.0% -1.6%
Energy purchased for resale 2,959 2,755 3,034 7.4% -2.5%
Depreciation and Amortization 245 246 244 -0.4% 0.4%
Operating Provisions 102- 198 1,297 -151.5% -107.9%
Charges for use of the national grid 535 257 376 108.2% 42.3%
Gas bought for resale 207 232 375 -10.8% -44.8%
Construction costs 439 373 342 17.7% 28.4%
Other Expenses 68 84 95 -19.0% -28.4%
Total 5,153 4,928 6,486 4.6% -20.6%
Operating Expenses(R$ million)
3Q20 2Q20 3Q19 3Q/2Q 3Q/3Q
Personnel 290 339 304 -14.5% -4.6%
Employees’ and managers’ profit sharing 75 7 15- 971.4% -600.0%
Forluz – Post-Retirement Employee Benefits 111 118 105 -5.9% 5.7%
Materials 23 16 21 43.8% 9.5%
Outsourced services 303 303 308 0.0% -1.6%
Energy purchased for resale 2,959 2,755 3,034 7.4% -2.5%
Depreciation and Amortization 245 246 244 -0.4% 0.4%
Operating Provisions 102- 198 1,297 -151.5% -107.9%
Charges for use of the national grid 535 257 376 108.2% 42.3%
Gas bought for resale 207 232 375 -10.8% -44.8%
Construction costs 439 373 342 17.7% 28.4%
Other Expenses 68 84 95 -19.0% -28.4%
Total 5,153 4,928 6,486 4.6% -20.6%
PMSO 3Q20 2Q20 3Q19 3Q/2Q 3Q/3Q
Personnel 476 464 394 2.6% 20.8%
Materials 23 16 21 43.8% 9.5%
Outsourced services 303 303 308 0.0% -1.6%
Other Expenses 68 84 95 -19.0% -28.4%
Total 870 867 818 0.3% 6.4%
Operating Expenses(R$ million)

43 Cem
3Q20 2Q20 3Q19 3Q/2Q 3Q/3Q
FINANCE INCOME
Income from cash investments 23 21 32 9.5% -28.1%
Arrears fees on sale of energy 106 85 90 24.7% 17.8%
Monetary variations – CVA 6 14 32 -57.1% 0.0%
Monetary updating on Court escrow deposits 0 38 12 -100.0% -100.0%
Pasep and Cofins charged on finance income -22 -7 -13 214.3% 69.2%
Gain on Financial instruments - Swap 3 486 486 -99.4% -99.4%
Liabilities with related parties 17 3 2 - -
Monetary uptading of PIS/Cofins credits 7 12 22 -41.7% -68.2%
Others 25 18 19 38.9% 31.6%
165 670 682 -75.4% -75.8%
FINANCE EXPENSES
Costs of loans and financings 312 276 319 13.0% -2.2%
Foreign exchange variations 247 406 499 -39.2% -50.5%
Monetary updating – loans and financings 46 32 17 43.8% 170.6%
Charges and monetary updating on post-retirement
obligation 12 -4
11 -400.0% 9.1%
Others 44 -5 69 -980.0% -36.2%
661 705 915 -6.2% -27.8%
NET FINANCE INCOME (EXPENSES) -496 -35 -233 0.0% 112.9%
Financial Result Breakdown (R$ million)
3Q20 2Q20 3Q19 3Q/2Q 3Q/3Q
Net Revenue 6,369 5,934 6,070 7.3% 4.9%
Operating Expenses 5,153 4,928 6,487 4.6% -20.6%
EBIT 1,216 1,006 -417 20.9% -391.6%
Equity gain (loss) in subsidiaries 98 -8 58 0.0% 69.0%
Lucro Proveniente de operações descontinuadas 0 0 224 0.0% -100.0%
Valor recuperável ativos mantidos para venda -136 0 0 0.0% 0.0%
EBITDA 1,423 1,244 195 14.4% 629.7%
Financial Result -497 -35 -234 1320.0% 112.4%
Provision for Income Taxes, Social Cont & Deferred Income Tax -136 -187 87 -27.3% -256.3%
Net profit for the period 545 776 -282 -29.8% -293.3%
Statement of Results(R$ million)

44 Cem
9M20 9M19
Cash at beginning of period 536 891
Cash generated by operations 6,833 1,149
Net income for the period from going concern operations 1,532 2,631
Current and deferred income tax and Social Contribution tax -273 -1,232
Depreciation and amortization 734 723
CVA and other financial components 1,245 66
Equity gain (loss) in subsidiaries -262 -161
Provisions (reversals) for operational losses 255 2,275
Dividends receivable 247 187
Interest and monetary variation 835 881
Interest paid on loans and financings -669 -846
Foreign exchange variations - loans and financings 2,410 429
Redução ao valor recuperável de ativos mantidos para venda 270 0
Variation in fair value of derivative financial instruments 177 34
PIS/Pasep and Cofins Credits 0 -2,962
Escrow deposits 1,506 0
Others -1,174 -876
Investment activity -4,522 -944
Securities - Financial Investment -3,341 -43
Contract assets - Distribution and gas infrastructure -957 -612
Financial assets -37 -29
Fixed and Intangible assets -187 -260
Financing activities -1,426 -401
Lease payments -64 -49
Payments of loans and financings -2,187 -4,750
Interest on Equity, and dividends 0 -79
Cash at end of period 1,421 695
Cash Flow Statement (R$ million)

45 Cem
Sep/20 2019
CURRENT
Cash and cash equivalents 1,421 536
Marketable securities 3,689 740
Customers, traders, concession holders and Transport of energy 4,436 4,524
Concession financial assets 581 1,080
Concession contract assets 247 172
Tax offsetable 2,183 99
Income tax and Social Contribution tax recoverable 579 621
Dividends receivable 84 186
Refund tariff subsidies 165 165
Derivative financial instruments – Swaps 86 97
Public lighting contribution 619 235
Other credits 373 425
Assets classified as held for sale 988 1,258
TOTAL CURRENT 15,451 10,137 - -
NON-CURRENT - -
Securities 409 13
Consumers and traders 163 77
Tax offsetable 3,691 6,349
Income tax and Social Contribution tax recoverable 196 228
Deferred income tax and Social Contribution tax 2,505 2,430
Escrow deposits in legal actions 1,089 2,540
Derivative financial instruments – Swaps 2,665 1,456
Accounts receivable from the State of Minas Gerais 132 115
Financial assets of the concession 4,470 4,850
Contractual assets 2,529 1,832
Investments 5,505 5,399
Property, plant and equipment 2,404 2,450
Intangible assets 11,789 11,624
Leasing – rights of use 230 277
Other credits 98 147
TOTAL NON-CURRENT 37,875 39,790
TOTAL ASSETS 53,326 49,927
BALANCE SHEETS - ASSETS(R$ million)

46 Cem
Sep/20 2019
CURRENT
Suppliers 1,991 2,080
Regulatory charges 387 457
Profit sharing 100 212
Taxes 492 359
Income tax and Social Contribution tax 101 134
Interest on Equity, and dividends, payable 854 745
Loans and financings 2,374 2,746
Payroll and related charges 238 200
Public Lighting Contribution 234 252
Post-retirement liabilities 297 288
Sectoral financial liabilities of the concession 331 -
PIS/Pasep and Cofins taxes to be reimbursed to customers 631 -
Leasing operations 69
Derivative financial instruments - options 516 0
Other obligations 465 356
9,079 7,9120 0NON-CURRENT
Regulatory charges 277 147
Loans and financings 13,733 12,030
Income tax and Social Contribution tax 685 661
Provisions 1,884 1,888
Post-retirement liabilities 6,514 6,421
PASEP / COFINS to be returned to consumers 3,535 4,193
Derivative financial instruments - options 516 483
Leasing operations 175 203
Others 143 97
TOTAL NON-CURRENT 26,945 26,124
TOTAL LIABILITIES 36,024 34,036
TOTAL EQUITY
Share capital 7,594 7,294
Capital reserves 2,250 2,250
Profit reserves 8,451 8,750
Equity valuation adjustments -2,420 -2,407
Subscription of shares, to be capitalized 1,423 -
NON-CONTROLLING INTERESTS 17,298 15,887
Non-Controlling Interests 5 4
TOTAL EQUITY 17,302 15,891
TOTAL LIABILITIES AND EQUITY 53,326 49,927
BALANCE SHEETS LIABILITIES AND
SHAREHOLDERS' EQUITY(R$ Million )