HIGHLIGHTS FROM The 2013 Global Innovation 1000 Study · PDF filethe 2013 global innovation...
12
HIGHLIGHTS FROM The 2013 Global Innovation 1000 Study NAVIGATING THE DIGITAL FUTURE Download the full strategy+business article and view infographics, our past studies, and more at www.booz.com/innovation1000.
Transcript of HIGHLIGHTS FROM The 2013 Global Innovation 1000 Study · PDF filethe 2013 global innovation...

HIGHLIGHTS FROM
The 2013 GlobalInnovation 1000 StudyNAVIGATING THE DIGITAL FUTURE
Download the full strategy+business article and view infographics, our past studies, and more at www.booz.com/innovation1000.
ejohnson018
Stamp booz

2Booz & Company
Booz & Company’s ninth annual study of innovation trends and spending shows that R&D investment at the public companies that were the 1,000 biggest spenders globally reached the highest level ever this year, US$638 billion. However, after two years of more than 9 percent growth post-recession, this year’s spending growth of 5.8 percent is a return to the long-term trend.
Apple, Google, and 3M have been at the top of the global “Most Innovative Companies” ranking for the last three years, but this year Samsung has overtaken 3M to claim the third spot. Amazon has also made a significant move, leaping six spots into fourth place this year. Tesla joins the list for the first time, and Facebook makes a return after a year’s hiatus, while Toyota and P&G have fallen farther down the list.
This year, we also surveyed the use of digital tools at 350 companies around the world. On average, we found that 8.1 percent of R&D spending is being allocated to digital enablers, from familiar project management software to the newest crowdsourcing and collaborative design tools. The tried-and-true productivity enablers are must-haves in the innovator’s digital tool kit. But many companies have started to also use digital enablers to develop market and customer insights. The benefits are measurable: The heaviest users of digital tools are 77 percent more likely to report that their companies financially outperform the competition.
2013
Apple
3M
GE
Microsoft
Samsung
Amazon
IBM
Tesla
2010 2011 2012
1st
2nd
3rd
4th
5th
6th
7th
8th
9th
10th
Apple Apple Apple
Google Google Google
3M 3M 3M
GE GE
GEToyota
Toyota
Toyota
Microsoft
Microsoft
Microsoft
P&G
P&G P&G
Samsung
Samsung
Samsung
IBM
IBM
IBM
Intel Facebook
Tie
Amazon
THE 2013 GLOBAL INNOVATION 1000 STUDY SNAPSHOT
CHANGES IN THE 10 MOST INNOVATIVE COMPANIES

3Booz & Company
R&D Spending [read more]• R&D spending among the top 1,000 spenders globally reached an all-time
high of $638 billion in 2013, an increase of 5.8 percent from 2012, com-pared to 9 percent-plus growth in the two previous years.
• China’s R&D spending increase of 35.8 percent this year was the highest of any region, but it is the second lowest increase for China over the past five years, likely a reflection of the country’s slowing economic expansion.
• R&D spending was once again highest in dollar terms at North American companies ($248 billion, an 8.6 percent increase over last year). And Europe’s R&D spending ($189 billion, a 4.5 percent increase from 2012) continues to be the second-highest.
• The computing and electronics industry spent the most on R&D in dollar terms ($170 billion); the software and Internet sector saw the highest per-centage increase in spending (22.1 percent, or $9.3 billion).
Performance Drivers [read more]• For the ninth year in a row, we have found no correlation between how
much companies spend on R&D and their financial performance. • How companies spend their innovation dollars is much more important.
Our studies have consistently shown that innovation investments in select capabilities, tools, talent, and culture which are tightly aligned with a business’s strategy are what drive sustained success.
Navigating the Digital Future [read more]• Respondents to our survey say their companies are using a mix of digital
tools: tried-and-true productivity enablers and newer market and customer insight enablers. The right mix, which many are still struggling to find, depends on a company’s industry, capabilities, and innovation model.
• On average, our survey respondents say their companies spend 8.1 per-cent of their R&D budgets on digital enablers.
• Less than half of respondents say they use digital enablers to a significant extent, but those that do are 77 percent more likely to report that they financially outperform competitors than are those who use them to a low or moderate extent.
Digital enabler: electronic tool, or process supported by an electronic tool, that improves speed, cost, quality and/or complexity. Examples relating to innovation: visual simulation, rapid prototyping/3D printing, computer-aided design, customer relationship management system.
KEY FINDINGS OF THE 2013 GLOBAL INNOVATION 1000 STUDY
4Booz & Company
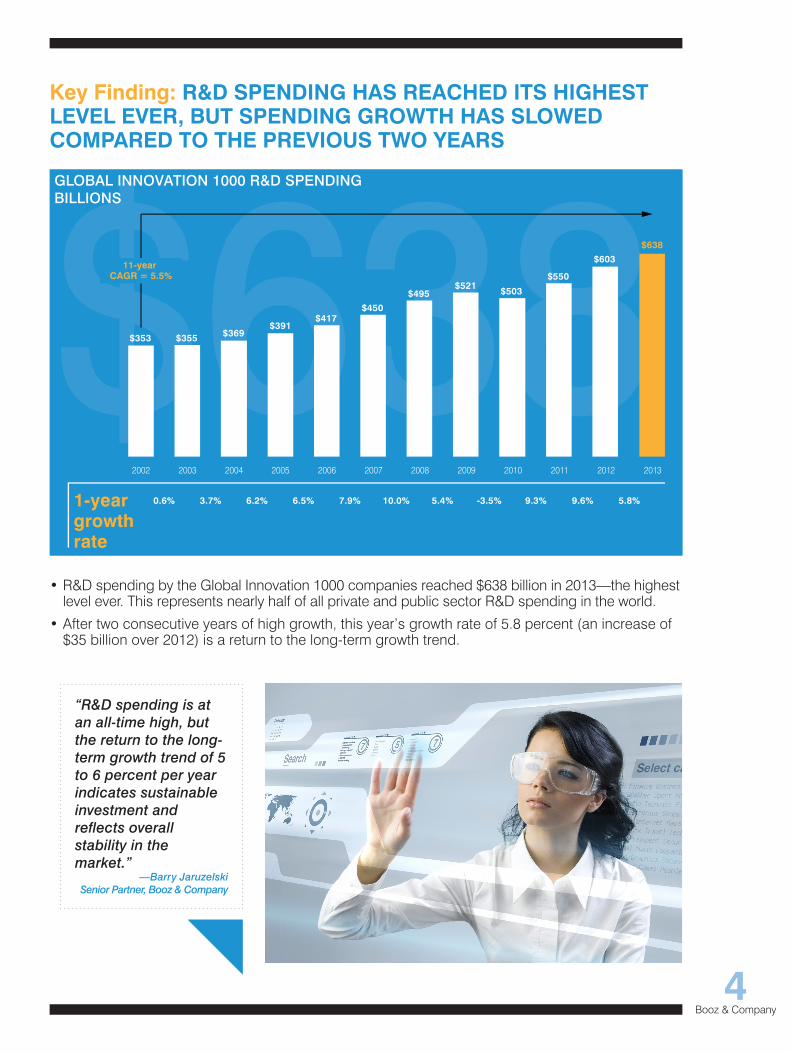
Key Finding: R&D SPENDING HAS REACHED ITS HIGHEST LEVEL EVER, BUT SPENDING GROWTH HAS SLOWED COMPARED TO THE PREVIOUS TWO YEARS
• R&D spending by the Global Innovation 1000 companies reached $638 billion in 2013—the highest level ever. This represents nearly half of all private and public sector R&D spending in the world.
• After two consecutive years of high growth, this year’s growth rate of 5.8 percent (an increase of $35 billion over 2012) is a return to the long-term growth trend.
1-yeargrowthrate
0.6% 6.5% 7.9% 10.0%3.7% 6.2% 5.4% -3.5% 9.3% 9.6% 5.8%
$603
$638
$550
$503$521$495
$450$417
$391$369$355$353
2011 2012 2013201020092008200720062005200420032002
11-year CAGR = 5.5%
GLOBAL INNOVATION 1000 R&D SPENDINGBILLIONS
“R&D spending is at an all-time high, but the return to the long-term growth trend of 5 to 6 percent per year indicates sustainable investment and reflects overall stability in the market.”
—Barry Jaruzelski Senior Partner, Booz & Company
5Booz & Company
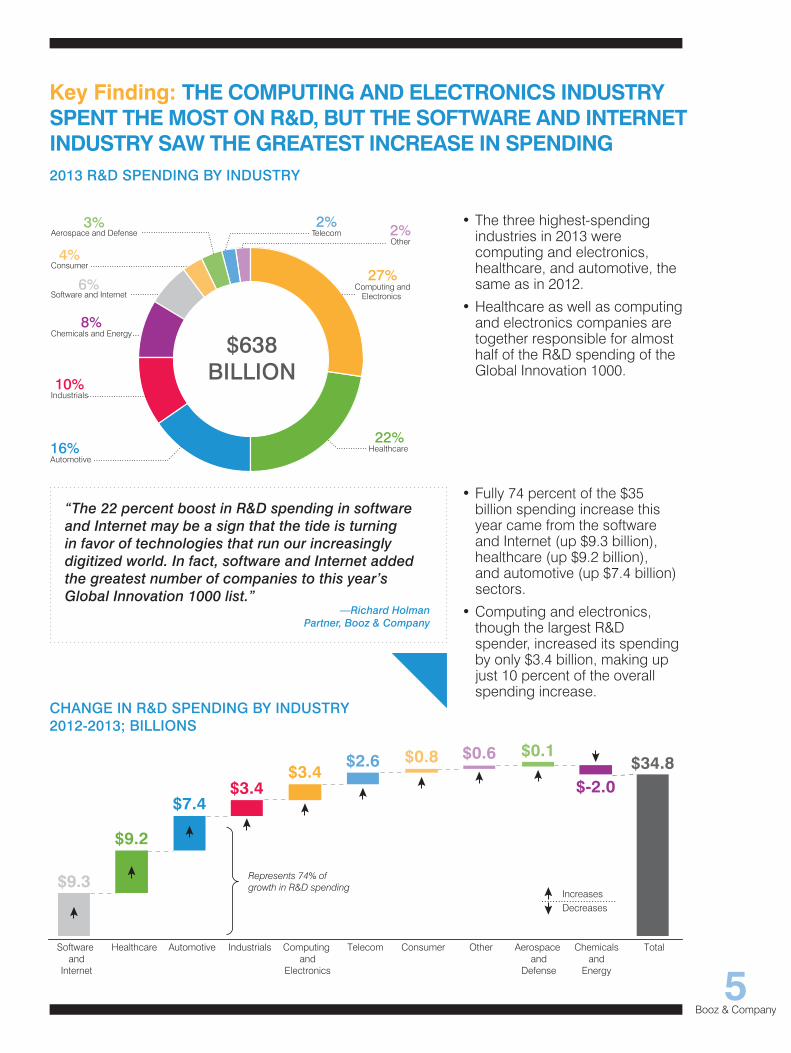
Key Finding: THE COMPUTING AND ELECTRONICS INDUSTRY SPENT THE MOST ON R&D, BUT THE SOFTWARE AND INTERNET INDUSTRY SAW THE GREATEST INCREASE IN SPENDING
• The three highest-spending industries in 2013 were computing and electronics, healthcare, and automotive, the same as in 2012.
• Healthcare as well as computing and electronics companies are together responsible for almost half of the R&D spending of the Global Innovation 1000.
• Fully 74 percent of the $35 billion spending increase this year came from the software and Internet (up $9.3 billion), healthcare (up $9.2 billion), and automotive (up $7.4 billion) sectors.
• Computing and electronics, though the largest R&D spender, increased its spending by only $3.4 billion, making up just 10 percent of the overall spending increase.
2013 R&D SPENDING BY INDUSTRY
CHANGE IN R&D SPENDING BY INDUSTRY2012-2013; BILLIONS
Consumer
TelecomOther
Aerospace and Defense
Healthcare
Industrials
Automotive
Software and Internet
Chemicals and Energy
Computing andElectronics
2%2%3%
4%
6%
8%
10%
16%
27%
22%
$638BILLION
TotalAerospace and
Defense
Telecom Consumer Other Chemicalsand
Energy
HealthcareSoftware and
Internet
IndustrialsAutomotive
$9.3
$9.2
$7.4$3.4
$3.4$2.6 $0.8 $0.6 $0.1
$-2.0$34.8
Computing and
Electronics
IncreasesDecreases
Represents 74% of growth in R&D spending
“The 22 percent boost in R&D spending in software and Internet may be a sign that the tide is turning in favor of technologies that run our increasingly digitized world. In fact, software and Internet added the greatest number of companies to this year’s Global Innovation 1000 list.”
—Richard HolmanPartner, Booz & Company
6Booz & Company
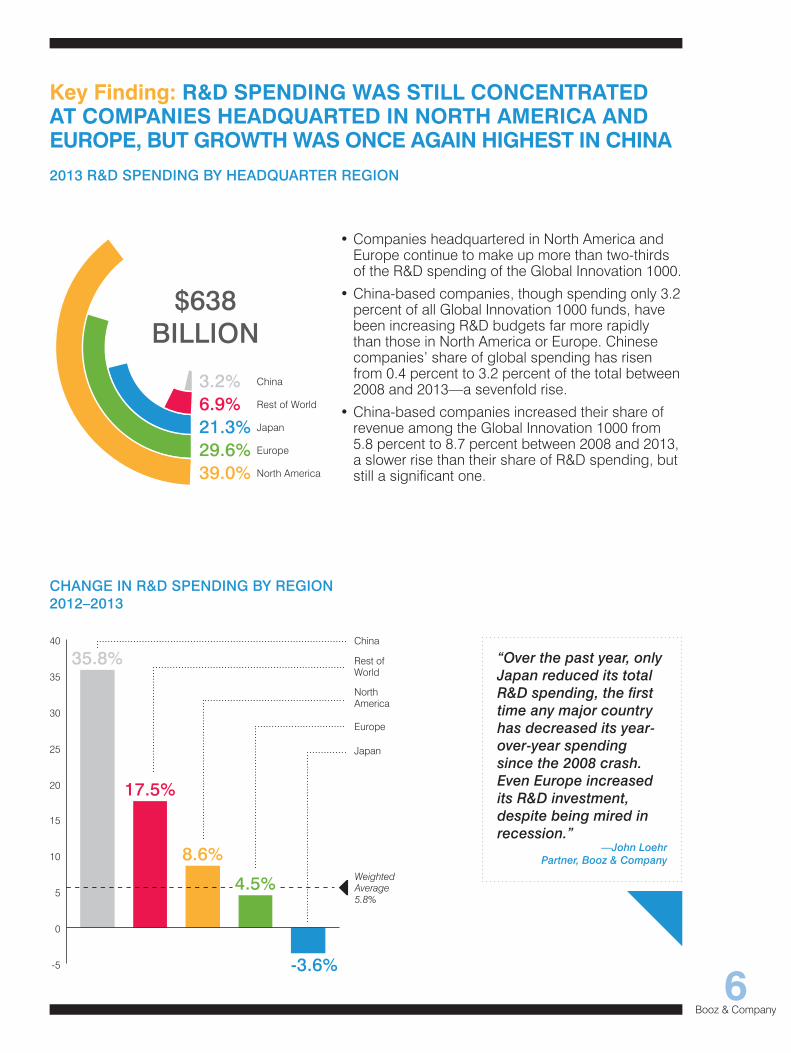
Key Finding: R&D SPENDING WAS STILL CONCENTRATED AT COMPANIES HEADQUARTED IN NORTH AMERICA AND EUROPE, BUT GROWTH WAS ONCE AGAIN HIGHEST IN CHINA
• Companies headquartered in North America and Europe continue to make up more than two-thirds of the R&D spending of the Global Innovation 1000.
• China-based companies, though spending only 3.2 percent of all Global Innovation 1000 funds, have been increasing R&D budgets far more rapidly than those in North America or Europe. Chinese companies’ share of global spending has risen from 0.4 percent to 3.2 percent of the total between 2008 and 2013—a sevenfold rise.
• China-based companies increased their share of revenue among the Global Innovation 1000 from 5.8 percent to 8.7 percent between 2008 and 2013, a slower rise than their share of R&D spending, but still a significant one.
2013 R&D SPENDING BY HEADQUARTER REGION
China 3.2%Rest of World6.9%Japan21.3%Europe29.6%North America39.0%
$638BILLION
CHANGE IN R&D SPENDING BY REGION 2012–2013
WeightedAverage5.8%
Japan
Europe
China
Rest ofWorld
North America
-5
0
5
10
15
20
25
30
35
40
-3.6%
4.5%
8.6%
17.5%
35.8% “Over the past year, only Japan reduced its total R&D spending, the first time any major country has decreased its year-over-year spending since the 2008 crash. Even Europe increased its R&D investment, despite being mired in recession.”
—John Loehr Partner, Booz & Company

7Booz & Company
Key Finding: FOR THE FOURTH YEAR, THE MOST INNOVATIVE COMPANIES WEREN’T THE TOP SPENDERS
• Healthcare companies have consistently been on the top spenders list but have never made it on the most innovative list.
• Only two companies, Samsung and Microsoft, have been on both the most innovative and the top spenders lists all four years.
Company
Apple
3M
Samsung
GE
Microsoft
Tesla
IBM
Amazon
Rank
1st
2nd
5th
3rd
6th
7th
9th
10th
8th
4th
Industry
Computing and Electronics
Software and Internet
Industrials
Computing and Electronics
Industrials
Software and Internet
Automotive
Software and Internet
Computing and Electronics
Software and Internet
R&D Spending (Billions)
$3.4
$6.8
$1.6
$10.4
$4.5
$9.8
$1.4
$0.3
$6.3
$4.6
Automotive
Computing and Electronics
Software and Internet
Healthcare
Automotive
Healthcare
Healthcare
Healthcare
Healthcare
Computing and Electronics
Industry
Volkswagen
Samsung
Microsoft
Roche
Toyota
Novartis
Pfizer
Johnson &Johnson
Merck
Intel
Company R&D Spending (Billions)
$11.4
$10.4
$9.8
$10.2
$9.8
$9.3
$7.7
$7.9
$8.2
$10.1
Rank
1st
2nd
5th
3rd
6th
7th
9th
10th
8th
4th
10 MOST INNOVATIVE COMPANIES IN 2013
TOP 10 R&D SPENDERS IN 2013
“For the ninth straight year, our research has demonstrated that there is no correlation between how much you spend and how well you perform over the long term. It has been proven time and time again that you can’t buy your way to the top. When it comes to innovation, how you spend is much more important than how much you spend.”
—Barry Jaruzelski Senior Partner, Booz & Company
8Booz & Company
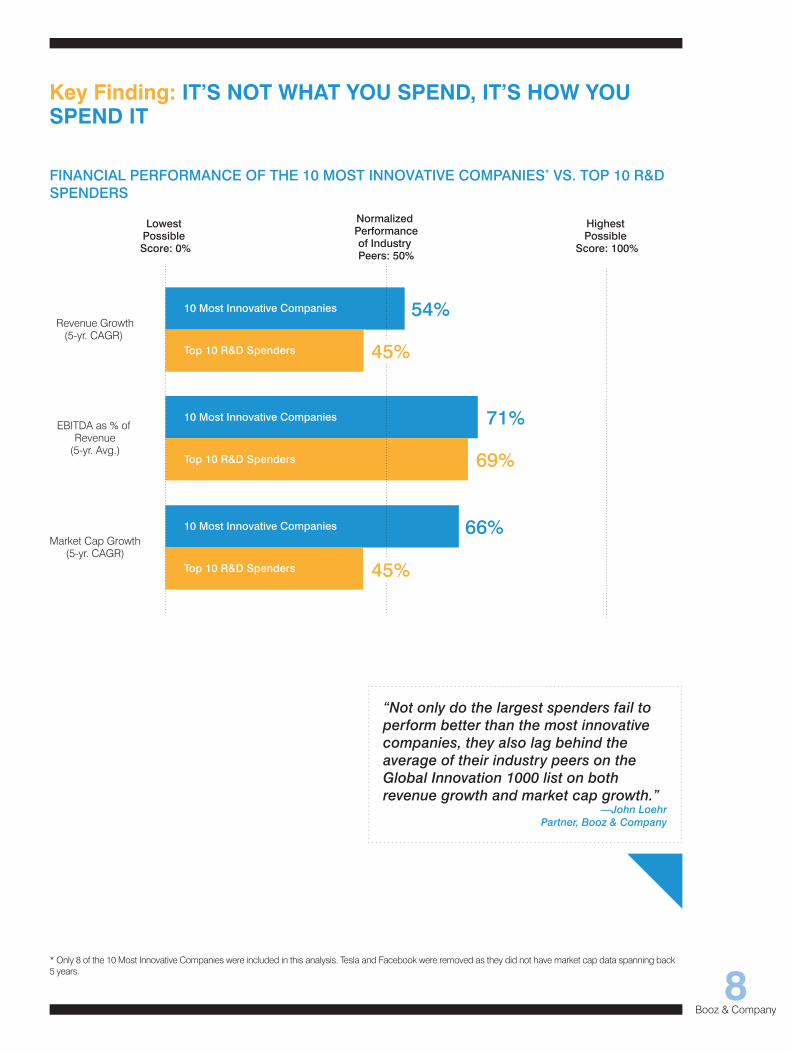
Key Finding: IT’S NOT WHAT YOU SPEND, IT’S HOW YOU SPEND IT
Revenue Growth(5-yr. CAGR)
EBITDA as % of Revenue
(5-yr. Avg.)
Market Cap Growth(5-yr. CAGR)
71%
69%
66%
54%
Normalized Performanceof Industry Peers: 50%
Highest Possible
Score: 100%
Lowest Possible Score: 0%
45%
45%
10 Most Innovative Companies
Top 10 R&D Spenders
10 Most Innovative Companies
Top 10 R&D Spenders
10 Most Innovative Companies
Top 10 R&D Spenders
FINANCIAL PERFORMANCE OF THE 10 MOST INNOVATIVE COMPANIES* VS. TOP 10 R&D SPENDERS
* Only 8 of the 10 Most Innovative Companies were included in this analysis. Tesla and Facebook were removed as they did not have market cap data spanning back 5 years.
“Not only do the largest spenders fail to perform better than the most innovative companies, they also lag behind the average of their industry peers on the Global Innovation 1000 list on both revenue growth and market cap growth.”
—John Loehr Partner, Booz & Company

9Booz & Company
Key Finding: COMPANIES ARE USING A MIX OF TRIED-AND-TRUE DIGITAL PRODUCTIVITY ENABLERS AND NEWER MARKET AND CUSTOMER INSIGHT ENABLERS
• Our survey results show that productivity enablers, used primarily in the development phase of innovation, have reached maturity; most are widely used and effective.
• In other phases, particularly the front end of the innovation process, companies are experimenting with new market and customer insight enablers that have transformative potential. But most tools aren’t widely used yet, and companies find their effectiveness varies wildly.
• Among the most effective tools is 3D printing for rapid prototyping in the ideation phase of the innovation process.
THE DIGITAL TOOL LANDSCAPE
Application development
Collaborative environments
Mashup tools
Computer-aided design
Interaction simulation
Project management
Customer immersion labs
Visual simulation
Digital focus groups
Big data tools
Customer profiling
Automated productusage tools
Monitoring tools
E-commerce tracking
Customer sentimentanalysis
Discussion platforms
Rapid prototyping(e.g, 3D printing)
Simulation tools
Co-design tools
Social voting
Idea capture tools
Patent scanning
CrowdsourcingVision narratives
Enhanced product lifecyclemanagement systems
Usage sensors
Visualization andengagement tools
Automated marketingplatforms
Enterprise resource planning
Community engagementplatforms
Customer relationshipmanagement
Automated feedback systems
Social media dashboards
Product sales simulation tools
CUSTOMER INSIGHT IDEATION DEVELOPMENT LAUNCH
Emerging, high-potential way to simulate user experiences
Most Effective Tools
Least Effective
Often used to researchthe market, withlimited effectiveness
Cutting-edge butnascent tool monitorsengagement patterns
Applications thatcombine data aren’twidely used, or useful
TYPE OF TOOL Productivity EnablerMarket and Customer Insight Enabler Percent of
respondents using each tool
CIRCLE SIZE =
15%
70%SCALE
“There are many digital enablers out there. Productivity enablers have become must-haves in any innovator’s digital tool kit. More and more companies are starting to use newer market and customer insight enablers to create better and more inventive products. The right mix of tools will depend on a company’s industry, capabilities, and innovation model.”
—Barry Jaruzelski Senior Partner, Booz & Company

10Booz & Company
Low or ModerateUsage of
Digital Enablers
SignificantUsage of
Digital Enablers
30%
53%
+77%
PERCENTAGE SAYING THEY
OUTPERFORM COMPETITORS
Key Finding: DIGITAL ENABLERS APPEAR TO BOOST PERFORMANCE WHEN USED SIGNIFICANTLY
• Companies from our survey allocated an average of 8.1 percent of their R&D budgets to digital tools, which when extrapolated to the Global Innovation 1000 companies adds up to $52 billion of spending in 2013.
• Less than half of respondents say their companies use digital enablers to a significant extent, but those that do are 77 percent more likely to report that they financially outperform competitors than are those that use enablers to a low or moderate extent.
• Only 49 percent of respondents say their companies are spending on digital enablers that they rated as highly effective.
• By industry, the percentage of R&D budgets spent on digital enablers by our respondents varied, as did the types of enablers used.
• Aerospace and defense respondents, relied heavily on CAD software and visual simulation, whereas respondents from the software and Internet sector made extensive use of social media—suitable choices given the high development costs and levels of complexity of the aerospace and defense industry and the business-to-consumer business model of the software and Internet sector.
USAGE OF DIGITAL ENABLERS AND FINANCIAL PERFORMANCE
ESTIMATED R&D SPENDING ON DIGITAL ENABLERS BY INDUSTRY
15.0% HEIGHT =Percent of
R&D Budget
AREA =Amount Spent
(Billions)
12.0%
10.0% 7.9% 7.2% 7.1%6.9%
6.3%5.7%
8.6%
$2.9 $4.7 $6.5 $9.7 $0.91.7 $12.6
Telecom Other Aerospaceand
Defense
Consumer Computing andElectronics
Healthcare Industrials AutomotiveChemicalsand
Energy
Softwareand
Internet
$13.8$7.7
AVERAGE8.1%
“With all the talk out there about digital enablers, more companies should be making significant use of them. It’s good news for innovation that some companies have found the tools that contribute to higher performance—the rest should follow their lead.”
—Richard Holman Partner, Booz & Company
11Booz & Company
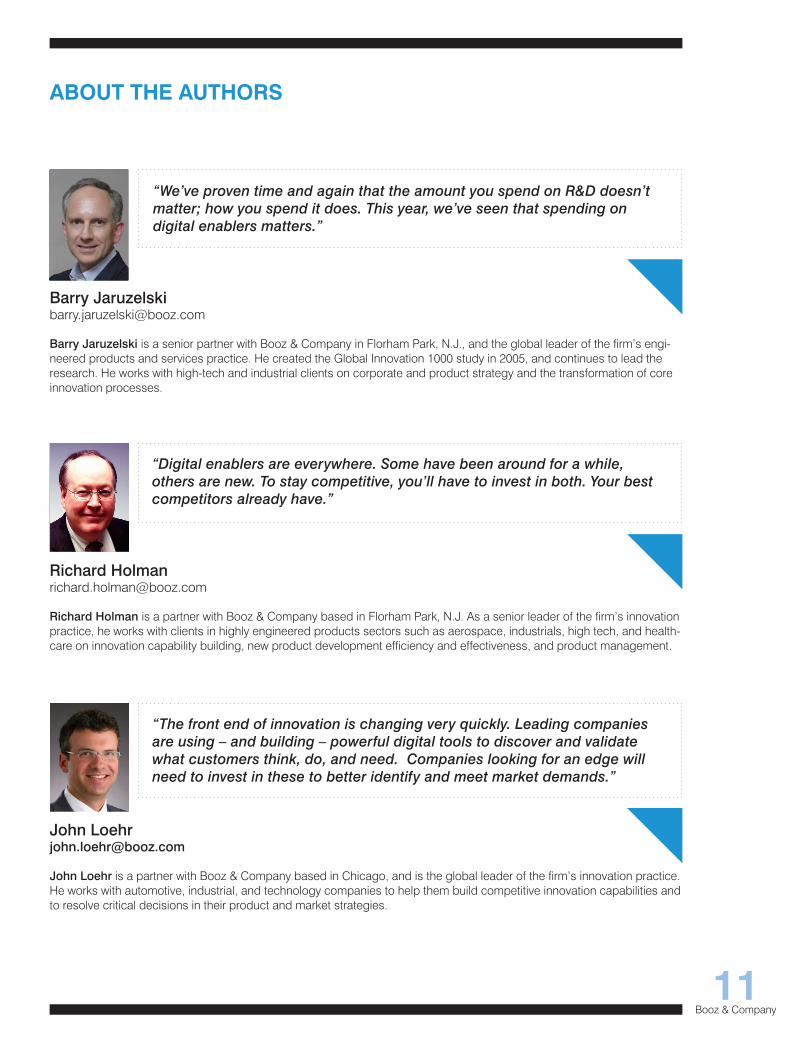
ABOUT THE AUTHORS
Barry [email protected]
Barry Jaruzelski is a senior partner with Booz & Company in Florham Park, N.J., and the global leader of the firm’s engi-neered products and services practice. He created the Global Innovation 1000 study in 2005, and continues to lead the research. He works with high-tech and industrial clients on corporate and product strategy and the transformation of core innovation processes.
Richard [email protected]
Richard Holman is a partner with Booz & Company based in Florham Park, N.J. As a senior leader of the firm’s innovation practice, he works with clients in highly engineered products sectors such as aerospace, industrials, high tech, and health-care on innovation capability building, new product development efficiency and effectiveness, and product management.
John [email protected]
John Loehr is a partner with Booz & Company based in Chicago, and is the global leader of the firm’s innovation practice. He works with automotive, industrial, and technology companies to help them build competitive innovation capabilities and to resolve critical decisions in their product and market strategies.
“We’ve proven time and again that the amount you spend on R&D doesn’t matter; how you spend it does. This year, we’ve seen that spending on digital enablers matters.”
“Digital enablers are everywhere. Some have been around for a while, others are new. To stay competitive, you’ll have to invest in both. Your best competitors already have.”
“The front end of innovation is changing very quickly. Leading companies are using – and building – powerful digital tools to discover and validate what customers think, do, and need. Companies looking for an edge will need to invest in these to better identify and meet market demands.”

MEDIA CONTACTS
Abu DhabiJoanne [email protected]
AmsterdamMonique De [email protected]
LondonDeirdre [email protected]
MunichDavina [email protected]
New York CityKatrina [email protected]
ParisBeatrice [email protected]
São Paulo Deborah [email protected]
ShanghaiMichelle Wang+86-21-2327-9825 [email protected]
StockholmLinda [email protected]
SydneyKristine [email protected]
TokyoTomoko [email protected]
ZurichKarla Schulze [email protected]
ABOUT THE GLOBAL INNOVATION 1000 As we have in each of the past eight editions of the Global Innovation 1000, this year Booz & Company identified the 1,000 public companies around the world that spent the most on R&D during the last fiscal year, as of June 30, 2013. To be included, companies had to make their R&D spending numbers public. Subsidiaries that were more than 50 percent owned by a single corporate parent during the period were excluded if their financial results were included in the parent company’s financials. The Global Innovation 1000 companies collectively account for just under half of the entire world’s R&D spending.
Methodology
In order to gain a more accurate and complete picture of innovation spending, Booz & Company made some adjustments to the data collection process this year. In past years, both capitalized and amortized R&D expenditures were excluded. This year, for companies with capitalized R&D expenditures, we included the most recent fiscal year’s amortization of those costs in calculating the total R&D investment, while continuing to exclude any non-amortized capitalized costs.
For each of the top 1,000 companies, we obtained from Bloomberg and Capital IQ the key financial metrics for 2008 through 2013, including sales, gross profit, operating profit, net profit, historical R&D expenditures, and market capitalization. All sales and R&D expenditure figures in foreign currencies were translated into U.S. dollars according to an average of the exchange rate over the relevant period; for data on share prices, we used the exchange rate on the last day of the period.
All companies were coded into one of nine industry sectors (or “other”) according to Bloomberg’s industry designations, and into one of five regional designations, as determined by their reported headquarters locations. To enable meaningful comparisons across industries, the R&D spending levels and financial performance metrics of each company were indexed against the average values in its own industry.
Booz & Company conducted a separate online survey of nearly 400 innovation leaders at 350 companies around the world to explore how their companies employ various digital enablers.
ABOUT BOOZ & COMPANY
Booz & Company (booz.com) is a leading global management consulting firm focused on serving and shaping the senior agenda of the world’s leading institutions. Drawing on the talents and insights of more than 3,000 people in 57 offices around the world, we help our clients achieve essential advantage by working with them to identify and build the differentiating capabilities they need to outperform.
Download the full strategy+business article and view infographics, our past studies, and more at www.booz.com/innovation1000.