HIGHER EDUCATION MARKETING: A COMPARATIVE ANALYSIS...
36
196 Beykoz Akademi Dergisi, 2017; 5(2), 196-231 MAKALE Gönderim tarihi: 17.11.2017 Kabul tarihi: 27.11.2017 DOI: 10.14514/BYK.m.21478082.2017.5/2.196-231 HIGHER EDUCATION MARKETING: A COMPARATIVE ANALYSIS OF PUBLIC AND FOUNDATION UNIVERSITIES IN TURKEY Okt. Mustafa Ertürk 20 Yrd.Doç.Dr. Tutku Eker İşcioğlu 21 ABSTRACT In the process of transition to the Information Age, the role of higher education institutions has been a pivotal one all around the globe, as well as in Turkey. It has become more and more important for higher education institutions to give accurate, clear and authentic messages to their existing and potential students in addition to ensuring that they are capable of providing high-quality and meaningful education experiences. To this end, Turkish higher education institutions, which are rapidly increasing in number, have been working toward adopting a more marketing oriented approach in their student recruitment strategies. Considering that research is limited as to the adoption of marketing activities of higher education institutions in Turkey, this study aims to investigate current marketing actions of the universities within the framework of 7P’s of services. To this end, the similarities and differences between the public and foundation universities through a total of 32 universities was put forth and if these two types substantially differ in the way they prefer to formulate their marketing activities was examined. The data were gathered through questionnaires applied to the staff of these universities who are primarily responsible for coordinating the marketing activities of their institutions. According to the results of the study, public and foundation universities demonstrate varying rates of similarity and difference in specific considerations of their marketing activities. While marketing-mix elements such as product, place, people, process and physical evidence display high degrees of similarity, foundation and public universities especially differ in their current situation in marketing activities and, price and promotion decisions. Keywords: Marketing, Educational Marketing, Higher Education, Services Marketing Jel codes: M31, M39 20 İstanbul Üniversitesi, Okutman, [email protected] 21 Piri Reis Üniversitesi, Yrd.Doç.Dr., [email protected]
Transcript of HIGHER EDUCATION MARKETING: A COMPARATIVE ANALYSIS...
196
Beykoz Akademi Dergisi, 2017; 5(2), 196-231 MAKALE Gönderim tarihi: 17.11.2017 Kabul tarihi: 27.11.2017 DOI: 10.14514/BYK.m.21478082.2017.5/2.196-231
HIGHER EDUCATION MARKETING: A COMPARATIVE ANALYSIS OF PUBLIC AND FOUNDATION UNIVERSITIES IN TURKEY
Okt. Mustafa Ertürk20 Yrd.Doç.Dr. Tutku Eker İşcioğlu21
ABSTRACT
In the process of transition to the Information Age, the role of higher education institutions has been a pivotal one all around the globe, as well as in Turkey. It has become more and more important for higher education institutions to give accurate, clear and authentic messages to their existing and potential students in addition to ensuring that they are capable of providing high-quality and meaningful education experiences. To this end, Turkish higher education institutions, which are rapidly increasing in number, have been working toward adopting a more marketing oriented approach in their student recruitment strategies. Considering that research is limited as to the adoption of marketing activities of higher education institutions in Turkey, this study aims to investigate current marketing actions of the universities within the framework of 7P’s of services. To this end, the similarities and differences between the public and foundation universities through a total of 32 universities was put forth and if these two types substantially differ in the way they prefer to formulate their marketing activities was examined. The data were gathered through questionnaires applied to the staff of these universities who are primarily responsible for coordinating the marketing activities of their institutions. According to the results of the study, public and foundation universities demonstrate varying rates of similarity and difference in specific considerations of their marketing activities. While marketing-mix elements such as product, place, people, process and physical evidence display high degrees of similarity, foundation and public universities especially differ in their current situation in marketing activities and, price and promotion decisions.
Keywords: Marketing, Educational Marketing, Higher Education, Services Marketing
Jel codes: M31, M39
20 İstanbul Üniversitesi, Okutman, [email protected]
21 Piri Reis Üniversitesi, Yrd.Doç.Dr., [email protected]

197
YÜKSEKÖĞRETİM PAZARLAMASI: TÜRKİYE’DEKİ DEVLET VE VAKIF ÜNİVERSİTELERİ ÜZERİNE KARŞILAŞTIRMALI BİR ANALİZ
ÖZET
Bilgi Çağına geçiş sürecinde, yüksek öğrenim kurumlarının rolü dünyada olduğu kadar Türkiye'de de önemli bir rol oynamaktadır. Yükseköğretim kurumlarının yüksek kalitede ve anlamlı öğrenim tecrübeleri sunmaya ek olarak, kayıtlı ve potansiyel öğrencilerine açık, net ve gerçekçi mesajları verebilmeleri giderek daha da önemli bir hale gelmiştir. Bu amaçla, sayıları giderek artmakta olan Türk yükseköğretim kurumları, öğrenci çekme stratejilerine daha pazarlama odaklı bir yaklaşım sergilemek üzere çalışmaktadırlar. Türkiye’de üniversitelerin pazarlama faaliyetlerine yönelik araştırmaların kısıtlı olmasını göz önünde bulunduran bu çalışma, hizmet pazarlamasına yönelik 7P çerçevesinde üniversitelerin mevcut pazarlama faaliyetlerini araştırmayı amaçlamaktadır. Bu doğrultuda, yükseköğretim kurumları tarafından benimsenmiş pazarlama stratejileri arasındaki benzerlik ve farkları devlet ve vakıf olmak üzere toplam 32 üniversite üzerinden incelenmiş ve bu iki tür üniversitenin pazarlama faaliyetlerini şekillendirmedeki tercihlerinde köklü farklar olup olmadığı araştırılmıştır. Veriler pazarlama faaliyetlerini koordine etme sorumluluğuna sahip çalışanlara uygulanan anketler yoluyla toplanmıştır. Araştırma bulguları, devlet ve vakıf üniversitelerinin pazarlama stratejilerinin belirli etmenlerinde değişen oranlarda benzerlik ve farklılık gösterdiğini ortaya koymaktadır. Üniversiteler ürün, yer, insanlar, süreç ve fiziksel kanıt gibi pazarlama karması unsurlarına yönelik benzerlik sergilerken, özellikle mevcut pazarlama faaliyetlerinde, fiyat ve tanıtım kararlarında vakıf ve kamu üniversiteleri arasında farklılık görülmektedir.
Anahtar Kelimeler: Pazarlama, Eğitim Pazarlaması, Yükseköğretim, Hizmet Pazarlaması
Jel kodu: M31, M39

198
1. Introduction
Education institutions have been one of the most significant and indispensable components of science and life in general since the earliest times in history. Higher Education Institutions (HEIs) have assumed the particular role of developing and improving skillsets in new generations and increasing their cultural, intellectual and scholastic abilities and aptitudes. Certain roles of HEIs such as creating and transferring knowledge, disseminating innovative and critical perspectives and developing qualified manpower have given these institutions the potential to make a significant impact on society. Accordingly, HEIs have been quite active in shaping the cultural, political and societal dynamics regardless of time and place.
Higher education (HE) serves as a crucial element in the cultivation of qualified human power, the production of knowledge and the community service that a country needs (Erdem, 2006). The term HE is used interchangeably with the term “University” which was derived from the Latin word “Universitas” meaning a unity (Güler, 1994). For the purposes of this study HE is used to refer to the educational institutions that encompass universities, vocational schools and bodies that have the authorization to grant associate degrees, bachelor’s degrees, master’s degrees and doctoral degrees. Nevertheless, it should be noted that the educational services that HEIs provide can, and do, go beyond these academic degrees in the forms of certificate programs, training courses, public education services and so on (Kilic, 1999).
Universities worldwide serve three most basic purposes: creating knowledge through research, disseminating knowledge by means of education and providing services that meet societal needs (Kucukcan & Gur, 2009). Nevertheless, it is important to note that the degree of importance of these three purposes might vary among universities depending on the strategic vision identified by decision makers in HEIs. Apart from these functions, in the current state of higher education in Turkey, universities set the goals of meeting the increasing demand for higher education and maintaining scientific research programs and projects. As a direct result of the former, there has been a dramatic increase in the number of public and foundation universities in Turkey in recent years and this substantial increase has been most notable in foundation universities.
As a result of the significant jump in the number of universities starting from 2006, the number of students also increased accordingly and the number of students in Turkey has reached almost 5 million as of 2014 (Penpece, 2014). Based on this fact, it is safe to assume that the relatively recently founded universities are involved in attempts to find a place in this increasing competition. This, however, does not mean that this endeavor is limited to the recently founded universities since their efforts to make themselves more visible to potential students enforce previously founded universities to make changes in the way they also formulate their messages and marketing activities in general.
Studies in Turkey mostly investigate student perceptions and their preferences to select a university.

199
Due to the inadequate number of research studies about the current marketing activities of HEs with the point of view of their managers, the purpose of this study is to investigate and identify the degree of difference and/or similarity between the two types of universities in Turkey considering the changes in market dynamics. In the following parts of the study, the previous researches on marketing of education and marketing mix of higher education will be discussed. This will be followed by the research conducted in the form of a questionnaire with staffers of 32 public and foundation universities who hold positions with primarily marketing responsibilities in their institutions. Results show that, in terms of the universities’ current situation in marketing, price and promotion activities, there are significant differences in terms of university ownership type. Yet, decisions regarding product, place, people, process and physical evidence components of services marketing demonstrate high degree of similarity between public and foundation universities.
2. Previous Research on Higher Education Marketing
In the management of education services, it is possible to talk about strategy, politics and tactics just as in businesses. With the advent of new models of management, today marketing activities of higher education institutions are recognized as an important tool in achieving organizational goals (Sütlaş, 2010).
In an environment of competition, most educational institutions have recognized that they need to market themselves and as a result, extensive literature on the transfer of the practices and concepts of marketing from other sectors to HE has been developed (Gibbs, 2002). According to Oplatka and Hemsley-Brown (2004), literature on education marketing initiated in the UK and US in the 1980s and was based on models developed for use by the business sector. Kotler and Fox (1985: 6) offered one of the earliest definitions of education marketing as “the analysis, planning, implementation and control of carefully formulated programs designed to bring about voluntary exchanges of values with a target market to achieve organizational objectives”. Basic strategies of marketing for universities was also listed by Kotler and Fox (1985) as:
i. Empowering the university ii. Changing the perception of the university iii. Changing the perceptions of other universities iv. Changing values of importance v. Calling attention to overlooked matters vi. Practicing change to become an ideal university
During 1990s and thereafter, it was acknowledged that higher education was in fact a service, rather than a product, and required different marketing tools from the marketing of products (Nicholls et al., 1995). For instance, Mazzarol (1998) pointed out main characteristics that provided a basis for services marketing: that education is “people based”, and emphasized the importance of relationships with customers. However, there was an inconsistency as to who the customers of HE were. As stated by Conway et al. (1994: 31), “students can be either considered as customers (with courses as the higher education products) or as products with

200
the employers being the customers”. Considering prospective students as the customers, while some studies examined the factors that influence students’ choice of universities and their programs (Gatfield et al., 1999; Grey et al., 2003; Hesketh and Knight, 1999), some others focused on the critical success factors for marketing education (Mazzarol, 1998), main effects of institutional image and reputation on customer loyalty and market positioning (Nguyen and LeBlanc, 2001), the viability of strategic planning goals in the HEIs (Rindfleish, 2003) and the effect of marketing communications (Hesketh and Knight, 1999; Gatfield et al., 1999; Grey et al., 2003; Mortimer, 1997).
Rockholz (2002) states that until very recently marketing activities of HEIs were irregular, instinctive and at smaller scales and that swiftly improving marketing applications have made an impact on education services as well and made it possible for such services to be handled in a more conscious way and at larger scales. That’s why, some researches also examined the point of view of university managers to see how universities use their marketing to differentiate their images in the HE market (Ivy, 2001), marketing challenges university marketers perceive (Maringe and Foskett, 2002) and the perceptions of marketing among vice chancellors of universities (Maringe, 2004).
Considering the large array of above mentioned international researches, HE literature in Turkey has also dedicated considerable attention on the topic. Torlak (2001) puts forward that higher education marketing comprises of development of education services that meet the needs and demands of students and parents, pricing these services at acceptable levels, providing education services at locations appropriate to the nature of the services and finally introducing and promoting these services to potential consumers. He continues to highlight that increasing competition and expectations in the sector necessitate institutions to take such actions, and that those institutions that choose not to be involved in such endeavors find it increasingly difficult to attract consumers and even continue their services for that matter. Binbaşıoğlu (2011) points out that while success of a business is measured by its profitability, it can be measured by student numbers or the frequency of selection by potential students in a higher education setting. An alternative method could also be measuring the increase in the number of graduating students and/or the drop in the number of students who transfer to other institutions.
Research on HE marketing in Turkey appears to emphasize mostly on the factors affecting university preference of students. Factors such as student expectations and university facilities (Gülcan et al. (2002); the attractiveness of the city where university is located and its proximity to the family (Gavcar et al. (2005); academic staff, student consultancy, university management, resources, curriculum and IT facilities (Şahin, 2009); student affairs, social activities, laboratories, classrooms and buildings, technological infrastructure (Yalçın et al., 2013); were all analyzed for this purpose. Some studies examined HE marketing within the framework of service quality of the HEs in Turkey (Okumuş and Duygun, 2008; Sakarya, 2006) and evaluated the quality of academic personnel, non-academic personnel, physical evidence and services other than education. Altan et al. (2003) and Bayrak (2007) compared service quality of public and foundation universities and found that service quality perception of public universities is lower than their foundation counterparts.

201
All of the acknowledged studies above took students as the main subject of analysis. No study has been found that examines current marketing activities of HEs as indicated by university managers and makes comparisons with respect to university ownership type, i.e. public and foundation universities.
3. Marketing mix in higher education
In order to achieve both marketing goals and organizational missions, it is important to have the ability to make decisions in a fast and efficient manner. Classifying targets of common qualities in nature will facilitate these processes by providing a framework (Sütlaş, 2010). To this end, the traditional 4 P’s of marketing (product, price, place and promotion) was put forward by McCarthy in 1960 and has been used by marketing professionals ever since. However, in time it has been understood that the 4 P’s framework might sometimes fall short to meet the marketing requirements of differing businesses, such as the marketing of services. Booms and Bitner (1981) proposed an expanded marketing mix for services with additional 3 P’s (people, process and physical evidence), as well as including the traditional 4 P’s. The framework that is used in this study is the extended 7 P’s framework.
a. Product Traditionally product is defined as any item that can be offered to a market to satisfy a want or need (Kotler and Karen, 1985). Nevertheless, the concept of product and the physical structure of products are quite different when compared to services. Education services as a product involve quality of education, brand name of the university, education programs (faculties, programs, exchange programs), available facilities (library, laboratories, cafeteria etc.) and additional student services (student clubs, sports and social activities) (Marangoz and Arslan, 2015; Nicholls et al., 1995).
Design of the degree is central to the product element of the marketing mix. Education services must be designed in a manner that will meet the expectations of target groups. As also stated by Ivy (2008), curriculum and program duration must be appropriately developed and adapted to meet the needs of the students so that an influence on university choice can be created. In this sense, it is highly important for HEIs to consider the future needs of potential students, business environments and the country. Furthermore, additional opportunities including minor or double-major programs, international student exchange programs and cooperation with businesses are usually the elements that HEIs offer their students as a component of their services.
Enache (2011) offers a different perspective on the services of universities as a product by offering two approaches. In the first one education provided by the universities is considered to be the product delivered and in this case students are categorized as customers. In the second scenario, the graduates of education programs are considered to be the products and the labor markets to be the customers. In both cases, it is essential not to consider one of the two approaches to be superior to the other, and that the objective must be to strike a balance between these two approaches.

202
b. Place The place component of the marketing mix relates to providing access to products and services in the right place and at the right time. In higher education, place refers to where university facilities are physically located and the characteristics of these facilities. Some universities prefer to be set up outside cities with fascinating and big campuses, while some others appeal to potential students with in-city campuses that provide easy transportation. HEIs in Turkey are also located either in areas close to city life or in distant areas. This distinction leads to the categorization of universities as ‘campus universities’ or ‘city universities. Due to the increasing number of students and the fact that there are not sufficient buildings in the city, the campuses that are moved out of the city are visually appreciated, but the difficulty in transportation has an influence on the university preference of students (Marangoz and Arslan, 2015).
Technological developments allow universities to develop alternative modes of education where students are no longer confined to classrooms. Access to lecture and support materials are increasingly available through virtual learning media and distance learning opportunities have also developed through the post, email, web, video and teleconferencing options and more recently pod-casts (Ivy, 2008). Therefore in addition to physical location, technological infrastructure of universities should be taken into account both as a place and product shaping instrument.
c. Price Price has the capacity to have a direct influence on the incomes of HEIs. Price, or “tuition fee”, as it is called, in higher education settings, can be influenced by costs, demand for programs and the tuition fees of other universities targeting the same segment. In particular, studies conducted abroad show that price is one of the main factors affecting university selection (Yavuzalp, 2011). However, it should not be forgotten that pricing decisions not only influence the revenues that a university derives from its enrolment, but also affects student perceptions of the quality (Ivy, 2008).
The pricing process of public universities in Turkey is directly managed by Higher Education Council (YÖK). As part of a regulation that was passed in 2013, students of public universities enrolled in programs other than distance education programs, evening education, master’s degrees and doctorate degrees are held exempt from tuition (Penpece, 2014). In Turkey, foundation universities have three different sources of revenue: contribution of the foundation, tuition fees and state support. The percentage of these sources varies for each university. It is important to note that since price is out of the equation for undergraduate programs in public universities, it mostly relates to foundation universities within the scope of this study. The pricing strategies of these universities, as identified by the board of trustees, largely depend on the vision and long-term goals that they set for themselves (Enache, 2011).

203
d. Promotion In marketing communications, promotion constitutes the largest number of and most widespread activities. Any and every method that will allow for customers to learn about and demand products and services is called promotion (Sütlaş, 2010). Advertisement, sales promotion, personal selling, direct marketing, and public relations are listed as tools of promotion.
In higher education, promotion takes place between the institution and the most fundamental stakeholders such as potential students, parents and academics. It can be defined as the communication process that aims to create a positive image of the services provided. In this respect, effective communication entails a thorough understanding of students’ needs and demands. In comparison to the previous three P’s (product, place and price), on which it is more difficult to make frequent changes, promotion can allow for more flexibility. Although different combinations of promotion strategies can be used to address different audiences, the main strategies include advertisement, direct marketing, online marketing, personal selling and public relations (Madran et al., 2008). More specifically higher education exhibitions, conventions, direct mail and advertising are but a few of the tools the universities employ to inform, remind and persuade prospective students to select their institution (Ivy, 2008). In their study specifically examining promotion tools used by the universities, Marangoz and Arslan (2015) indicate that, advertising and public relations activities are used extensively by universities. However, in addition to these two, it is seen that universities regularly use activities such as catalogs, web sites, gifts to prospective students, stands and fairs.
Increasing competition in the higher education market can be said to make the biggest impact on the way HEIs promote their services. Especially after the number of universities (both public and foundation) started increasing, the channels that were previously thought to be inappropriate for education services started to be heavily used. Therefore, it has become of utmost importance to give accurate messages to potential students using the right channels. In order for promotion activities to be successful, all remaining components of the marketing mix must complement one another and work in harmony.
e. People In marketing terms, people dimension refers to both target people and people directly related to the business. Firms need to discover who form their target market, whether or not there is enough number of people in the target market and what these people expect and demand. Other than target people, employees are also vital for the success of marketing activities because they are the ones who deliver the service. The tight people need to be hired and trained in order to offer superior service to the customers.
The people component in higher education includes target people (prospective students, parents etc.), existing students, academic staff, administrative staff and other parties in direct connection with the institution and students. Quality of educational services is strongly tied

204
to the people involved in the provision of these services. In many studies conducted in this regard, it is stated that one of the most important factors in providing HE quality is "academic staff" (Yavuzalp, 2011). For this reason, determining how the quality of education services is perceived by the students who are the receivers of these services, is a very important point of action for the universities that care about quality in education (Saydan, 2008). In addition to importance of academic staff, Torsten, Langer and Hansen (2001) stated that universities having long-term relationships with students will benefit from it as those students would attract potential students through word-of-mouth communication, which in turn provide competitive advantage.
In fact, all university personnel have an extremely important role in the achievement of the institution’s mission (Çeken, 2012). It would not be wrong to state that all personnel regardless of their roles and responsibilities have the significant duty of ensuring customer satisfaction, which is providing quality education for students and helping create an environment that will facilitate this end. As also stated by Sütlaş (2010), starting from the security at the campus entrance, all staff of the education institution is responsible for both internal and external customer satisfaction.
f. Process The process component in higher education encompasses all experiences of students from the moment they enroll in the university to the moment they graduate. For instance, from the handling of enquiries to registration of correct courses, from course evaluation to examinations, from result dissemination to correctly calculation grades for graduation, are the ones to name but a few (Ivy, 2008). In fact, the process can still continue after graduation thanks to the ties that students can maintain with the university through the alumni networks or associations. Also, the intangible and variable nature of services makes the impact of process even more significant.
Procedures, mechanisms, flow of activities and operation systems are all within the scope of the process strategy. As a result of this process strategy, an output is obtained in terms of educated people, employment, research findings and services for society (Cafoğlu, 1996). Identifying a strong process strategy will ensure the smooth and easy provision of services (Enache, 2011). Therefore, the process strategy can be useful in enhancing the image of the institution and attract more potential students.
g. Physical Evidence Physical evidence is the tangible element in the provision of a service. It includes, but is not limited to teaching materials, design of buildings, facilities at the campus etc. Physical evidence plays an important role not only in ensuring that students spend more time on institution premises but also in creating a sense of belonging to the institution (Sütlaş, 2010). In this sense, the colors, the size and the physical layout of buildings, decorations, availability of facilities such as pools, cafes and restaurants play an important role in students’ and parents’ choice of university. As stated by (Marangoz and Arslan, 2015), today appearance has become very essential in the marketing of universities and thus universities are trying to make their campuses more attractive to gain competitive advantage. Therefore, it is essential

205
for decision makers in the institution to understand the true value of physical evidence and to take steps to improve it so as to successfully compete with other institutions.
4. Higher Education System in Turkey
The demand for higher education has been gradually increasing across the world and Turkey is not an exception. The reasons for this increase can be attributed to the rise in living standards, the growing number of students that qualify to receive higher education (in accordance with the growth in population), the inadequacy of primary and secondary education in satisfying the increasingly complex requirements of livelihood, and that graduates of HEIs can achieve higher incomes in comparison to the graduates of primary and secondary education institutions (Gölpek & Uğurlugelen, 2013). These reasons result in a highly competitive transition system and complex institutional structures.
Thr Turkish higher education system has deep roots that can be traced back to pre-republic period when the Ottoman Empire still reigned. Following the foundation of the Turkish Republic and the years of political, administrative and constitutional changes, Turkey currently has a higher education system that fundamentally depends on secondary education (high schools). The scope of higher education encompasses education services that include programs that grant associate degrees, bachelor’s degrees, master’s degrees and doctoral degrees. These degree programs can be offered by both public and foundation universities as well as vocational schools. Currently, there are 179 HEIs of which 112 are public and 67 are foundation universities (YÖK, n.d.)
In order to enable HEIs to reach the highest levels in international education areas, The Higher Education Council (YÖK) was established in accordance with the 1982 Constitution based on basic principles of higher education in Turkey. Çeken (2012) quotes the fundamental mission of YÖK as contributing to the economic and technological growth of the country by managing, planning, organizing and auditing HEIs. Although Turkish HEIs are autonomous by law, they are regulated - by the Higher Education Council. YÖK is responsible for ensuring that the resources provided for these institutions are utilized in the most efficient way. Decisions, including the number of students to be accepted to programs and the number of teaching staff to be recruited to programs, can also be listed among the typical responsibilities that YÖK assumes.
In Turkey, universities can be established by the state or through the foundations that are funded by private enterprises. Regulation for Foundation Higher Education Institutions of 2005 defines foundation universities as “HEIs established by foundations that engage in higher-level and scientific research, education and training, publication and consultation with their units such as faculties, institutes, vocational schools, preparatory schools etc. on condition that they use their revenues only to sustain themselves or their relevant organs.” Additionally, Hopoğlu (2012) cites the 130th item of the constitution concerning foundation universities which reads “HEIs can be established by foundations on condition that they do not intend to generate profit as dictated in the regulations and procedures highlighted in the law. HEIs established by foundations are subject to constitutional laws regarding academic

206
studies, recruitment of academic staff and security just as public universities are, except for the financial and administrative issues”. As can be inferred from this constitutional statement, public and foundation universities both have to observe the regulations of YÖK and the fact that foundation universities are established through different channels does not, in any way, mean that they enjoy more autonomy than public universities in the aforementioned aspects.
5. Methodology
This study aims to understand the current state of marketing applications of HEIs in Turkey and to identify the differences between public and foundation universities, if any. Therefore, the research is descriptive in nature and tries to answer following research questions:
1. How do HEIs in Turkey apply the 7 P’s of marketing? 2. Are there any differences between public and foundation universities regarding the
application of 7P’s? The scope of the study includes all higher education institutions in Turkey that were founded before 2013, the number of which is 159 (YÖK, n.d.). The rationale behind identifying these universities is that the questionnaire included questions regarding graduates. Considering that an undergraduate HE education lasts at least four years in Turkey, for the purpose of this study a university could have its first graduates in 2017. Therefore, participating universities had to have been founded before 2013.
In the study, the best method to collect data was identified to be survey method considering the possibilities of reaching a large number of participants and for being more convenient and efficient. The websites of 159 universities were visited to identify the people who were primarily responsible for coordinating the marketing activities of these institutions and at times it was necessary to make phone calls to identify the right people. Following this step, each responsible person was contacted by phone, email or both and was asked to participate in the study by filling out the online questionnaire. From 159 universities, the staff of 32 universities filled in the questionnaire, which provides a response rate of 20,1%.
To demonstrate sample characteristics, the names of all participant universities, as well as their ownership type (public vs. foundation) and establishment year are provided, but details regarding each of their marketing applications are kept confidential throughout the study. As revealed in Table 1., 23 public universities as opposed to 9 foundation universities from 21 cities participated in the study.

207
Table 1. Sample Characteristics
University Name Ownershi
p Type Establishme
nt Year Size (# of students)
City
Adana Bilim ve Teknoloji University Public 2011 1431 Adana Aksaray University Public 2006 22535 Aksaray Ardahan University Public 2008 5029 Ardahan
Atılım University Foundation 1996
9108 Ankara
Bartın University Public 2008 14239 Bartın Bayburt University Public 2008 9186 Bayburt
Bezmialem Vakıf University Foundation 2010
3037 İstanbul
Bingöl University Public 2007 14105 Bingöl Boğaziçi University Public 1971 16653 İstanbul Bozok University Public 2006 15935 Yozgat Bursa Teknik University Public 2010 2501 Bursa Çanakkale Onsekiz Mart University Public 1992 48078 Çanakkale Çankırı Karatekin University Public 2007 13806 Çankırı Çukurova University Public 1973 53966 Adana Dumlupınar University Public 1992 55748 Kütahya Düzce University Public 2006 27247 Düzce Erciyes University Public 1978 61961 Kayseri
Fatih Sultan Mehmet Vakıf University Foundation 2010
6182 İstanbul
Fırat University Public 1967 41224 Elazığ Hitit University Public 2006 17251 Çorum
İstanbul Kemerburgaz University Foundation 2008
7304 İstanbul
İstanbul Medeniyet University Public 2010 4159 İstanbul
İstanbul Sabahattin Zaim University Foundation 2010
7053 İstanbul
İzmir Ekonomi University Foundation 2001
9962 İzmir
Karamanoğlu Mehmetbey University Public 2007 14137 Karaman
Maltepe University Foundation 1997
11750 İstanbul
Mardin Artuklu University Public 2007 8379 Mardin
Piri Reis University Foundation 2008
3113 İstanbul
Sabancı University Foundation 1996
4704 İstanbul
Türk Alman University Public 2010 883 İstanbul

208
Yalova University Public 2008 14184 Yalova Yüzüncü Yıl University Public 1982 29520 Van
Resource: https://istatistik.yok.gov.tr/
The large majority of the survey questions and items were adapted from Penpece (2014), who compiled most sections of the survey primarily from Tucking (2009) and Jager (2009). The major differences between the way survey was used in Penpece (2014) and the present study are the people who participated and the general purpose of the two studies given the fact that Penpece (2014) carried out the survey nationwide to presidents of HEIs and analyzed findings without observing a distinction between public and private HEIs. Furthermore, several questions were either removed or adapted based on the fact that they did not relate to higher education environment in Turkey (i.e. questions regarding institution mascots and so forth). The questions regarding the existence of a marketing plan, education programs offered, the types of media and social media used were included by the researchers considering the marketing applications in HE marketing. It is important to note that the survey was conducted in Turkish in order to sidestep potential language barriers for the reliability of responses after the relevance of back translation was ensured.
In the analysis of the survey findings, to answer the first research question, the frequency of responses was chosen as the main analysis method considering the number of participants. For some questions percentages of the responses were also included in order to present a clearer interpretation of the given responses. To identify the differences between public and foundation universities and thus answer the second research question, Cross tabulation, Independent Samples t-test and Mann-Whitney U test were used. Mann-Whitney U test is a non-parametric test that compares two sample means which come from the same population and is used when the normality assumption of the t-test is not met (Bajpai, 2010). In cases where normal distribution of each group of the independent variable was not observed, Mann-Whitney U test was used instead of Independent Samples t-test.
6. Findings
a. Current state in marketing To understand the universities’ current state in marketing, five indicators were used: the degree of marketing importance, existence of a marketing plan, divisions responsible for marketing, number of staff responsible for marketing and responsibility areas of marketing staff.
Table 2. demonstrates to what extent marketing is important for the universities, measured by a 5-point Likert scale (1: Not important at all ……. 5: Very important). Considering all universities, the average mean score was found 4,69. However, when ownership type is taken into account the importance of marketing for public universities decreased to 4,57, whereas for all foundation universities full score of 5 was obtained. This difference is also statistically significant at p<0,1 level, indicating that foundation universities attach more importance on marketing of HEIs than public universities do.

209
Table 2. The Degree of Importance of Marketing across Universities
University
Ownership Type n Mea
n
Std. Deviatio
n Significan
ce How important to you are the marketing activities of your university?
Public 23 4,57 0,59 0,094
Foundation 9 5 0
To understand which type of universities has a written marketing plan, Cross tabulation was used as revealed in Table 3. Findings indicate that 65,2% of the public universities do not have a marketing plan, whereas 66,7% of the foundation universities have a marketing plan. It can be said that foundation universities pay more attention to planning their marketing activities in writing in comparison to foundation universities, although this difference is not confirmed statistically through Chi-square test due to low expected counts in each cell.
Table 3. Existence of a Marketing Plan
University Ownership Type Total
Public Foundation
Does your institution have a written marketing plan?
No Frequency 15 3 18
% 65,20% 33,30% 56,30%
Yes Frequency 6 6 12
% 26,10% 66,70% 37,50%
Do not know Frequency 2 0 2
% 8,70% 0,00% 6,30%
University divisions responsible for marketing activities were examined with a single question but participants could select more than one answer. The responses to this question showed inconsistent variations as there is not a clear pattern of distinction between the two types of universities in this respect. While for public universities press and public relations office (52,9%) deals with marketing activities for the most part, for foundation universities it is the corporate communications office (50%) engaging in marketing. Considering the total number of responses regardless of university ownership type, the given responses show that the following divisions mostly bear responsibility for marketing the institutions: Press and public relations office (41,6%), rector’s office (27%) and corporate communications office (16,6%).

210
Table 4. Divisions Responsible for Marketing
Public Foundation Total Frequency %
Frequency %
Frequency %
Which divisions are responsible for marketing activities in your university?
Press and public relations office 18 52,9 2 14,2 20 41,6 Rectorate 10 29,4 3 21,4 13 27,0 Corporate communications office 1 2,9 7 50,0 8 16,6 Deans' offices 2 5,8 1 7,1 3 6,2 Marketing department 1 2,9 1 7,1 2 4,1 Student affairs 2 5,8 0 0 2 4,1
Total 34 100 14 100 48 100
The number of people responsible for marketing activities was assessed to see if there is a difference in terms of university ownership type. Independent Samples t-test was used because normality and equality of variances assumptions were met as well as other assumptions of t-test. As the findings demonstrate in Table 5, the average number of people responsible for marketing activities in foundation universities (7,33) is higher than that of public universities (4,91) and this difference is statistically significant at p<0,05 level.
Table 5. Average Number of People Responsible for Marketing Activities
University Ownership Type n Mean
Std. Deviatio
n
Significance
How many people in your institution are responsible for marketing activities?
Public 22 4,91 2,448 0,044
Foundation 9 7,33 3,873
Finally, to identify the areas of marketing responsibilities of staff, another question asked which 7 P’s of services marketing the staff was responsible for. The frequency and percentage of responses can be seen in Table 6. The staff mostly deals with the activities regarding promotion (27, 8%), product (20,6%) and place (15,4%). When examined on the basis of university ownership type, the most prominent difference seems to be in price and people. Foundation universities appear to deal with price more than public universities (10,7% vs. 4,3%). On the other hand, public universities seem to engage in people more than foundation universities (10,1% vs. 3,5%). The other P’s seem to be distributed in a similar manner in the two types of universities.

211
Table 6. Areas of Marketing Responsibilities of Staff
Public Foundation Total Frequen
cy % Frequen
cy % Frequen
cy %
Which of the following responsibilities does the marketing staff in your institution have?
Product (Decisions relating to education programs, materials etc.) 14
20,2 6
21,4 20
20,6
Place (Decisions relating to location and delivery of education) 11
15,9 4
14,2 15
15,4
Price (Decisions relating to pricing of services) 3 4,3 3
10,7 6 6,1
Promotion (Decisions relating to communication and informing students) 20
28,9 7 25 27
27,8
People (Decisions relating to target people, selection of academic and administrative staff) 7
10,1 1 3,5 8 8,2
Physical Evidence (Decisions relating to campus facilities, uniforms, business cards etc.) 7
10,1 3
10,7 10
10,3
Process (Decisions relating to student enrollment, course registration, other bureaucratic processes) 7
10,1 4
14,2 11
11,3
Total 69 10
0 28 10
0 97 10
0
b. Product The marketing activities of universities regarding the product dimension were assessed to understand universities’ current program offerings and the extent to which they try to make education better. First, participants were asked what type of HE programs were offered in their institutions. As it can be understood from Table 7., all public and foundation universities provide undergraduate and master’s degree programs to their students. The most substantial difference seems to be in the number of Continuous Education Centers, of which foundation universities have more of in comparison to public universities (100% vs. 82,6%). Other than this, another difference is observed in the number of vocational studies, which is offered by 87% of the public universities, as opposed to 77,8% of foundation universities.

212
Table 7. Programs Offered by the Universities
Public Foundation Frequency %
Frequency %
Which of the following programs are available in your institution?
Undergraduate 23 100 9 100 Master's 23 100 9 100 Doctorate 21 91,3 9 100 Vocational Studies 20 87 7 77,8 Continuous Education Center 19 82,6 9 100
In order to delineate to what extent universities try to make their education better, nine items were used measured by a 5-point Likert scale (1: Strongly disagree ……. 5: Strongly agree). Table 8. shows the mean scores of public and foundation universities with respect to these items. The differences between university ownership type were tested by Mann-Whitney U test because the normality assumption of t-test was not fulfilled. Statistically significant results arose in the fourth, fifth and sixth items only. As a result, foundation universities were found to meet more frequently with potential students and ask them what departments they want to study in, investigate the expectations of their potential students more each year and believe more market research studies determine their education policies.
Table 8. Attempts to Make Education Better
University
Ownership Type n
Mean
Std. Dev
. Significan
ce
1-We frequently meet with students and ask their demands/needs.
Public 23 3,74 1,096 0,133 Foundatio
n 9 4,44 0,527
2-We meet with students at regular intervals and discuss the quality of education and the way classes are conducted.
Public 23 3,26 1,096 0,321 Foundatio
n 9 3,67 0,866
3-Student opinions and views are very important to us and we take steps based on their suggestions.
Public 23 4,04 0,767 0,229 Foundatio
n 9 4,44 0,527
4-We frequently meet with potential students and ask them what departments they want to study in.

213
Public 23 3,48 0,898 0,019
Foundation 9 4,33 0,5
5-We investigate the expectations of our potential students each year.
Public 23 3,22 0,951 0,003 Foundatio
n 9 4,33 0,5 6-Market research studies determine our education policies. Public 23 3,22
0,998 0,047 Foundatio
n 9 4 0,866
7-Our graduates visit our institution regularly and chat with students.
Public 23 3,09 1,083 0,363 Foundatio
n 9 3,56 1,236
8-We try to make best use of our graduates in the employment of our students.
Public 23 2,96 0,976 0,246 Foundatio
n 9 3,44 0,882
9-We always maintain our relationship with graduates and they serve as a bridge to university-business cooperation.
Public 23 3,35 1,071 0,386 Foundatio
n 9 3,78 1,093
c. Place Place component of 7 P’s in the universities was assessed in terms of university type (city university vs. campus university) and the location of the universities.
Table 9. reveals that almost equal percentages of public and foundation universities are organized as campus or city universities. In total, the majority of universities were founded as campus universities (62,5%).
Table 9. Campus vs. City University
Public Foundation Total Frequency %
Frequency %
Frequency %
Which of the following do you think better describes
Campus University 14
60,9 6
66,7 20
62,5

214
the current state of your institution in terms of campuses?
City University 9 39,1 3
33,3 12
37,5
Total 23 100 9
100 32
100
Regarding the location, two questions were asked with a 5-point Likert scale (1: Strongly disagree ……. 5: Strongly agree) and the differences with respect to university ownership type were evaluated using a Mann-Whitney U test. As the results indicate in Table 10., most of the participating universities believe location is an important quality for their universities as the mean scores are very close to 5. However, when the centrality of their location was assessed, mean scores dropped and this drop is more obvious for foundation universities. Apparently, there are mean differences between the two types of universities, yet none of these differences are statistically significant.
Table 10. Location of the Universities
University Ownership Type n Me
an Std. Dev. Significance
a-I believe that our institution's location is an important marketing quality.
Public 23 4,48 0,79 0,711 Foundation 9 4,67 0,5
b-Our institution is located in a central location.
Public 23 4,13 0,968 0,877 Foundation 8 3,88 1,356
d. Price Universities were asked which pricing strategy they adopt in pricing their undergraduate and graduate degree programs. According to the results shown in Table 11., 95,7% of public universities and 55,6% of foundation universities implement officially determined prices in undergraduate programs. It is not surprising to see that almost all public universities stated that their prices are determined officially, which actually means that YÖK has full authority over this and actually students registered to undergraduate programs in public universities are not charged for this service. On the other hand, for 33,3% of the foundation universities, pricing vary for each department. In total, 84,4% of the universities apply officially determined prices.
Table 11. Pricing Strategy in Undergraduate Programs
Public Foundation Total Frequency %
Frequency %
Frequency %

215
Please select the pricing strategy you follow in undergraduate programs.
Officially determined prices are implemented. 22
95,7 5
55,6 27
84,4
Each department determines price according to competition. 0 0 1
11,1 1 3,1
Pricing methods vary for each department 0 0 3
33,3 3 9,4
Do not know 1 4,3 0 0 1 3,1
Total 23 10
0 9 100 32 10
0
The results of the pricing strategy used for graduate programs are displayed in Table 12. Again, the majority of public universities (87%) implement officially determined prices as was the case in undergraduate programs. However, for two public universities, prices of non-thesis programs are determined either according to competition or prestige. Foundation universities also show a similar pattern to the one they demonstrate in pricing undergraduate programs. 66,7% of the foundation universities execute officially determined prices and 33,3% of them determine pricing differently for each program.
Table 12. Pricing Strategy in Graduate Programs
Public Foundation Total Frequency %
Frequency %
Frequency %
Please select the pricing strategy you follow in masters and doctoral degree programs.
Officially determined prices are implemented. 20 87 6
66,7 26
81,3
For thesis officially determined prices, for non-thesis according to competition. 1
4,3 0 0 1 3,1
For thesis officially determined prices, for non-thesis according to prestige. 1
4,3 0 0 1 3,1
Each program determines its own pricing method. 0 0 3
33,3 3 9,4
Do not know 1 4,3 0 0 1 3,1
Total 23 10
0 9 10
0 32 10
0
In terms of pricing decisions, another question asked participants whether or not they determined prices considering their corporate image. Table 13. reveals that 43,5% of the public universities do not know the answer to this question and in fact 39,1% of them

216
responded prices are not determined in accordance with corporate image. Since in public universities prices are mostly determined officially, clearly it was not possible for those universities to respond ‘yes’ to this question. Nevertheless, the majority of foundation universities seem to consider corporate image when they determine prices for their education services as 88,9% responded yes to the question.
Table 13. Price and Corporate Image
Public Foundation Total Frequency %
Frequency %
Frequency %
Are prices determined considering corporate image?
Yes 4 17,
4 8 88,
9 12 37,
5
No 9 39,
1 0 0 9 28,
1
Do not know 10 43,
5 1 11,
1 11 34,
4
Total 23 10
0 9 10
0 32 10
0
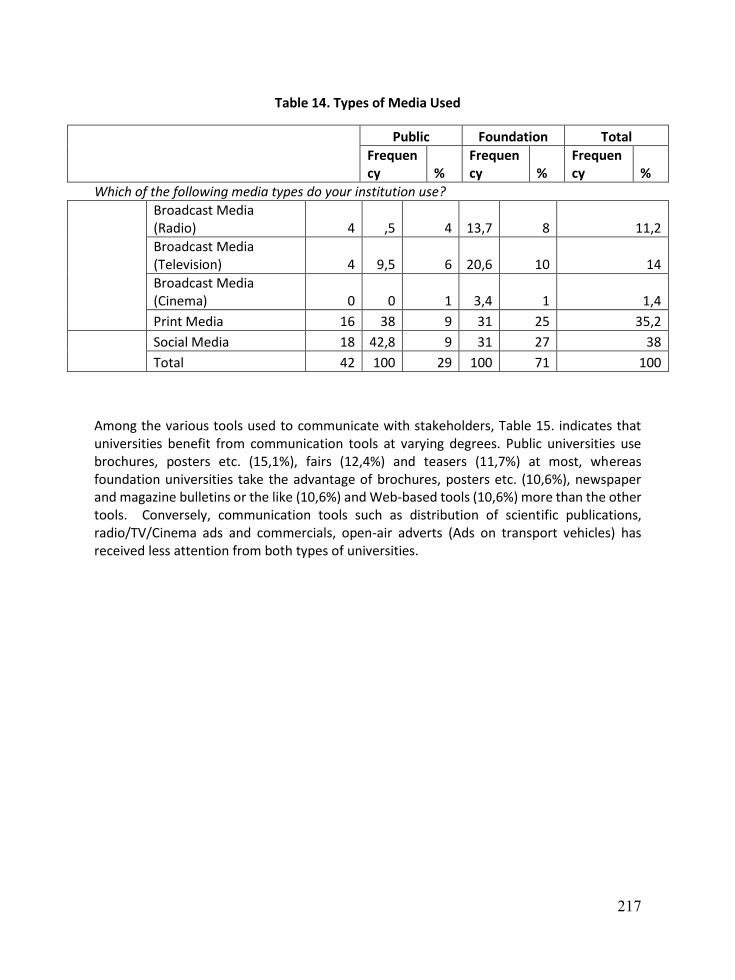
e. Promotion Several indicators were used to assess how promotion activities are handled by the universities: types of media used, tools to communicate with stakeholders, number of communication tools, usage of websites and social media. Table 14. displays the results for the types of media used. Apparently, for both types of the universities social media and print media are used at the highest level. On the contrary, cinema as a broadcast media receive less attention. Additionally, foundation universities seem to benefit from television and radio much more than public universities. The conclusion that can be drawn from this finding is that foundation universities use media types more heavily than public universities do.
217
Table 14. Types of Media Used
Public Foundation Total Frequency %
Frequency %
Frequency %
Which of the following media types do your institution use?
Broadcast Media (Radio) 4 ,5 4 13,7 8 11,2 Broadcast Media (Television) 4 9,5 6 20,6 10 14 Broadcast Media (Cinema) 0 0 1 3,4 1 1,4 Print Media 16 38 9 31 25 35,2
Social Media 18 42,8 9 31 27 38 Total 42 100 29 100 71 100
Among the various tools used to communicate with stakeholders, Table 15. indicates that universities benefit from communication tools at varying degrees. Public universities use brochures, posters etc. (15,1%), fairs (12,4%) and teasers (11,7%) at most, whereas foundation universities take the advantage of brochures, posters etc. (10,6%), newspaper and magazine bulletins or the like (10,6%) and Web-based tools (10,6%) more than the other tools. Conversely, communication tools such as distribution of scientific publications, radio/TV/Cinema ads and commercials, open-air adverts (Ads on transport vehicles) has received less attention from both types of universities.

218
Table 15. Tools to Communicate with Stakeholders
Public Foundation Total Frequency %
Frequency %
Frequency %
Which of the following tools do you use to communicate with your stakeholders?
Distribution of scientific publications 7 4,8 5 5,8 12 5,2
Brochures, posters etc. 22 15,
1 9 10,
6 31 13,
4 Newspaper and magazine bulletins or the like. 15
10,3 9
10,6 24
10,4
Radio/TV/Cinema ads and commercials 5 3,4 6 7 11 4,7 Open-air adverts (Ads on transport vehicles) 4 2,7 8 9,4 12 5,2 T-shirts, pens, mugs and products or the like. 13 8,9 7 8,2 20 8,6
Web-based tools 16 11 9 10,
6 25 10,
8
Fairs 18 12,
4 8 9,4 26 11,
3 Special events 14 9,6 8 9,4 22 9,5 Visits to potential students (high schools, companies, government institutions etc.) 14 9,6 8 9,4 22 9,5
Teasers 17 11,
7 8 9,4 25 10,
8
Total 145 10
0 85 10
0 230 10
0
The general conclusion that can be drawn from the findings above is that foundation universities use promotion tools much more heavily than public universities. To see if this finding can be statistically supported, the number of communication tools was calculated for each university and Mann-Whitney U test was applied to see if the mean score of communication tools differ for public and foundation universities. According to the findings presented in Table 16., on average foundation universities (9,4) benefit from communication tools more than public universities do (6,3) and this difference is statistically significant at p<0,01 level.

219
Table 16. Average Number of Communication Tools
University Ownership
Type n Mean
Std. Deviatio
n
Significance
Number of communication tools
Public 23 6,3 2,771 0,002 Foundation 9 9,4 1,236
As an important source of information for the stakeholders, the websites of universities need to provide the most up-to-date information. In order to see if universities actually do so, a question asked how often their corporate websites were updated. In line with the findings stated in Table 17. the majority of universities update the corporate website every day. More specifically, 52,2% of public universities and 66,7% of foundation universities provide updated information every day. It is interesting to note that, 21,7% of public and 11,1% of foundation universities update their websites every year, which is difficult to understand in today’s information and digital age.
Table 17. Corporate Website
Public Foundation Total Frequency %
Frequency %
Frequency %
In addition to websites, the usage of social media platforms, especially by prospective students, increases day by day. Therefore, universities need to take advantage of such platforms in an effective manner for the promotion of their universities. To see which of the social media platforms universities in Turkey use, a question asked participants to select the ones they use for communication purposes. As demonstrated in Table 18., Facebook and Twitter are the most popular social media platforms the universities prefer, followed by Instagram, Google+ and Linkedin. On the other hand, Pinterest, Tumblr, Youtube and blogs are used rarely, and mostly by foundation universities.
How often is your corporate website updated?
Every day 12 52,
2 6 66,
7 18 56,
3
Every week 3 13 1 11,
1 4 12,
5 Every month 3 13 1
11,1 4
12,5
Every Year 5 21,
7 1 11,
1 6 18,
8
Total 23 10
0 9 10
0 32 10
0

220
Table 18. Social Media Platforms
Public Foundation Total Frequency %
Frequency %
Frequency %
Which of the following media platforms does your institution use?
Blogs 1 1,5 3 6,9 4 3,6 Facebook 21
32,3 9
21,4 30 28
Twitter 21 32,
3 9 21,
4 30 28 Instagram 9
13,8 6
14,2 15 14
Linkedin 4 6,1 7
16,6 11
10,2
Google+ 8
12,3 5
11,9 13
12,1
Pinterest 0 0 1 2,3 1 0,9 Tumblr 0 0 1 2,3 1 0,9 Youtube 1 1,5 1 2,3 2 1,8
Total 65 10
0 42 10
0 107 10
0
Just like the tools used to communicate, the usage of social media platforms as indicated above implies that foundation universities take more advantage of these platforms. To support this idea statistically, the total number of social media platforms were calculated for each university and the mean scores of both university types were compared with Mann-Whitney U test. According to Table 19., on average the number of social media platforms used by foundation universities is 5,67, while for public universities it is 3,74. This difference is also statistically significant at p<0,01 level.
Table 19. Average Number of Social Media Platforms
University Ownership
Type n Mean
Std. Deviatio
n
Significance
Number of social media platforms
Public 23 3,74 1,356 0,002 Foundation 9 5,67 1,323

221
f. People The people component of marketing activities in HEIs encompass both the target market and people who take part in the operations of these institutions. To understand which people are considered to be the target market of the universities, a question asked participants to identify the target audience for their marketing activities, where they could select more than one option. As seen in Table 20, both public and foundation universities consider potential students (43,6%) and general public (29,5%) as the majority of their target people. For a small number of universities, graduates and strategically identified groups are also included in the target market.
Table 20. Target Market of the Universities
Public Foundation Total Frequency %
Frequency %
Frequency %
Who is the target audience of the marketing activities
Potential students 22 47,
8 9 36 31 43,
6 Graduates 3 6,5 4 16 7 9,8
General public 14 30,
4 7 28 21 29,
5 Strategically identified groups 7
15,2 5 20 12
16,9
Total 46 10
0 25 10
0 71 10
0
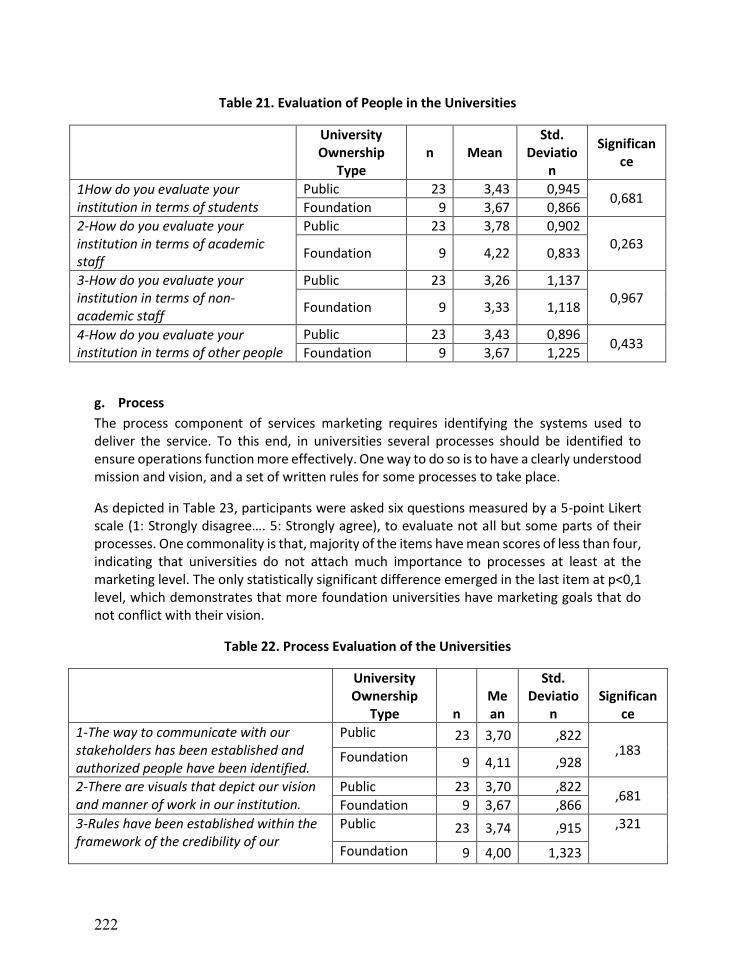
In addition to target market, how universities evaluate their students, academic staff, non-academic staff and other people was also assessed and measured by a 5-point Likert Scale (1: Poor…. 5: Excellent). Table 21. reveals that both type of universities evaluate people in their universities at a mediocre level as most of the mean scores are around 3. Statistically, no difference was found between public and foundation universities as demonstrated by Mann-Whitney U test.
222
Table 21. Evaluation of People in the Universities
University Ownership
Type n Mean
Std. Deviatio
n
Significance
1How do you evaluate your institution in terms of students
Public 23 3,43 0,945 0,681 Foundation 9 3,67 0,866 2-How do you evaluate your institution in terms of academic staff
Public 23 3,78 0,902 0,263 Foundation 9 4,22 0,833
3-How do you evaluate your institution in terms of non-academic staff
Public 23 3,26 1,137 0,967 Foundation 9 3,33 1,118
4-How do you evaluate your institution in terms of other people
Public 23 3,43 0,896 0,433 Foundation 9 3,67 1,225
g. Process The process component of services marketing requires identifying the systems used to deliver the service. To this end, in universities several processes should be identified to ensure operations function more effectively. One way to do so is to have a clearly understood mission and vision, and a set of written rules for some processes to take place.
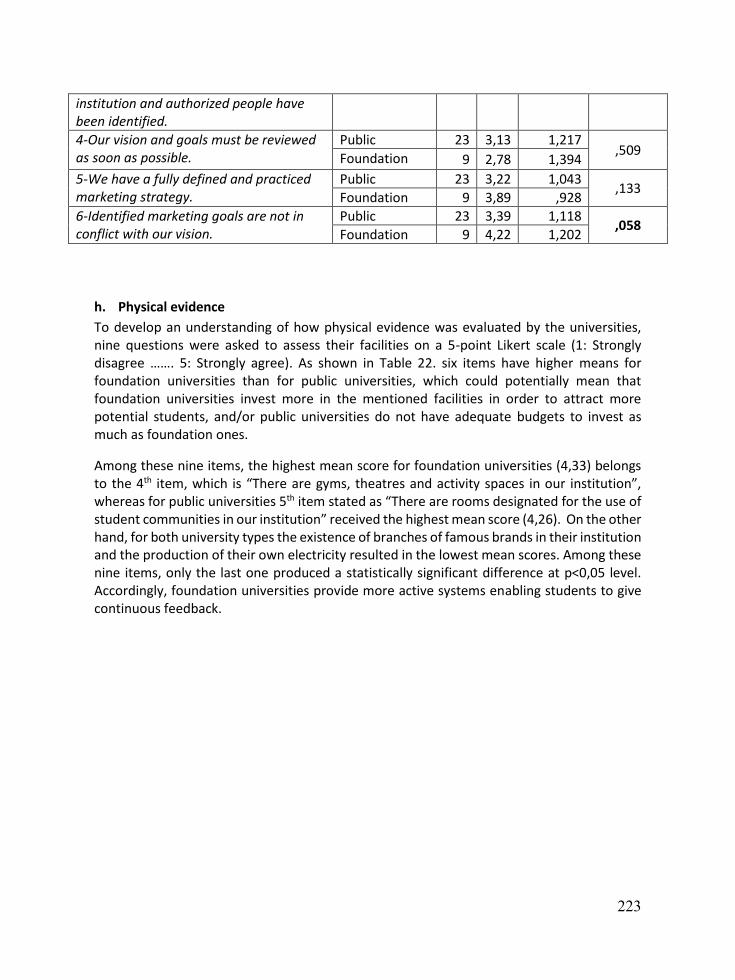
As depicted in Table 23, participants were asked six questions measured by a 5-point Likert scale (1: Strongly disagree…. 5: Strongly agree), to evaluate not all but some parts of their processes. One commonality is that, majority of the items have mean scores of less than four, indicating that universities do not attach much importance to processes at least at the marketing level. The only statistically significant difference emerged in the last item at p<0,1 level, which demonstrates that more foundation universities have marketing goals that do not conflict with their vision.
Table 22. Process Evaluation of the Universities
University Ownership
Type n Mean
Std. Deviatio
n Significan
ce 1-The way to communicate with our stakeholders has been established and authorized people have been identified.
Public 23 3,70 ,822 ,183 Foundation 9 4,11 ,928
2-There are visuals that depict our vision and manner of work in our institution.
Public 23 3,70 ,822 ,681 Foundation 9 3,67 ,866 3-Rules have been established within the framework of the credibility of our
Public 23 3,74 ,915 ,321 Foundation 9 4,00 1,323
223
institution and authorized people have been identified. 4-Our vision and goals must be reviewed as soon as possible.
Public 23 3,13 1,217 ,509 Foundation 9 2,78 1,394
5-We have a fully defined and practiced marketing strategy.
Public 23 3,22 1,043 ,133 Foundation 9 3,89 ,928 6-Identified marketing goals are not in conflict with our vision.
Public 23 3,39 1,118 ,058 Foundation 9 4,22 1,202
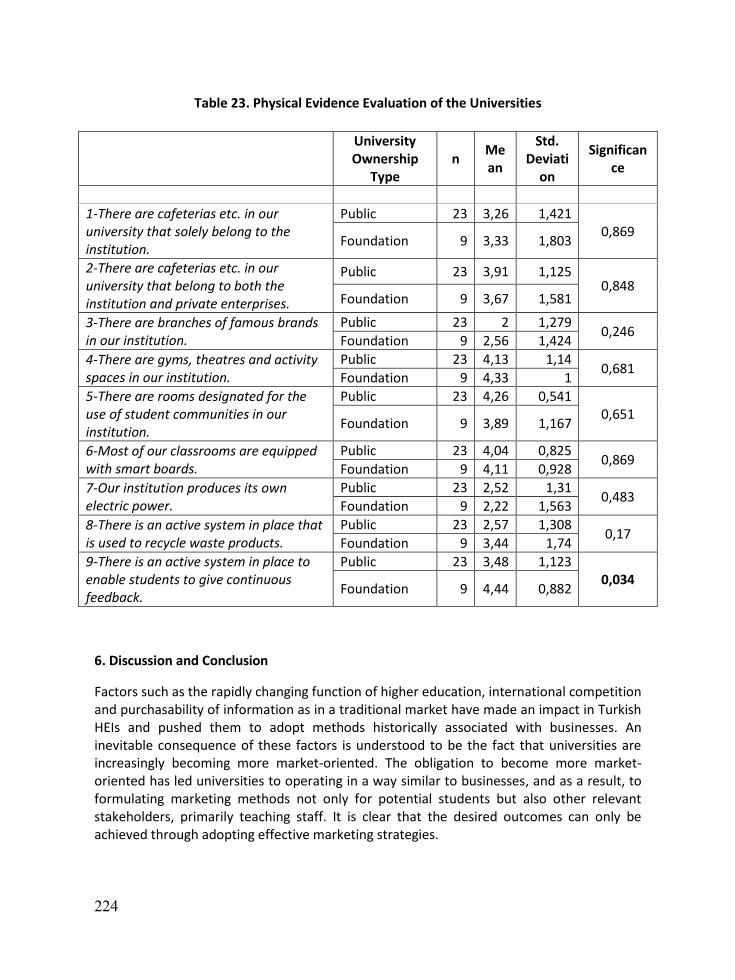
h. Physical evidence To develop an understanding of how physical evidence was evaluated by the universities, nine questions were asked to assess their facilities on a 5-point Likert scale (1: Strongly disagree ……. 5: Strongly agree). As shown in Table 22. six items have higher means for foundation universities than for public universities, which could potentially mean that foundation universities invest more in the mentioned facilities in order to attract more potential students, and/or public universities do not have adequate budgets to invest as much as foundation ones.
Among these nine items, the highest mean score for foundation universities (4,33) belongs to the 4th item, which is “There are gyms, theatres and activity spaces in our institution”, whereas for public universities 5th item stated as “There are rooms designated for the use of student communities in our institution” received the highest mean score (4,26). On the other hand, for both university types the existence of branches of famous brands in their institution and the production of their own electricity resulted in the lowest mean scores. Among these nine items, only the last one produced a statistically significant difference at p<0,05 level. Accordingly, foundation universities provide more active systems enabling students to give continuous feedback.
224
Table 23. Physical Evidence Evaluation of the Universities
1-There are cafeterias etc. in our university that solely belong to the institution.
Public 23 3,26 1,421 0,869 Foundation 9 3,33 1,803
2-There are cafeterias etc. in our university that belong to both the institution and private enterprises.
Public 23 3,91 1,125 0,848
Foundation 9 3,67 1,581
3-There are branches of famous brands in our institution.
Public 23 2 1,279 0,246 Foundation 9 2,56 1,424 4-There are gyms, theatres and activity spaces in our institution.
Public 23 4,13 1,14 0,681 Foundation 9 4,33 1 5-There are rooms designated for the use of student communities in our institution.
Public 23 4,26 0,541 0,651 Foundation 9 3,89 1,167
6-Most of our classrooms are equipped with smart boards.
Public 23 4,04 0,825 0,869 Foundation 9 4,11 0,928 7-Our institution produces its own electric power.
Public 23 2,52 1,31 0,483 Foundation 9 2,22 1,563 8-There is an active system in place that is used to recycle waste products.
Public 23 2,57 1,308 0,17 Foundation 9 3,44 1,74 9-There is an active system in place to enable students to give continuous feedback.
Public 23 3,48 1,123 0,034 Foundation 9 4,44 0,882
6. Discussion and Conclusion
Factors such as the rapidly changing function of higher education, international competition and purchasability of information as in a traditional market have made an impact in Turkish HEIs and pushed them to adopt methods historically associated with businesses. An inevitable consequence of these factors is understood to be the fact that universities are increasingly becoming more market-oriented. The obligation to become more market-oriented has led universities to operating in a way similar to businesses, and as a result, to formulating marketing methods not only for potential students but also other relevant stakeholders, primarily teaching staff. It is clear that the desired outcomes can only be achieved through adopting effective marketing strategies.
University Ownership
Type n Me
an
Std. Deviati
on
Significance

225
The effects of increasing number of HEIs all around the globe as well as in Turkey, attempts to create a positive image and maintain the achieved image and rising importance of marketing in education have been handled in many studies. However, many of these studies examine the topic with the perspective of students and try to understand the factors that affect their university selection (e.g. Gatfield et al., 1999; Gavcar et al., 2005; Grey et al., 2003; Gülcan et al., 2002; Hesketh and Knight, 1999; Şahin, 2009; Yalçın et al., 2013). Although, the number of studies conducted in Turkey to this end is many, no study has been found to understand the current situation of the HEI’s marketing activities, excluding that of Penpece (2014).
The fact that the number of universities has been increasing rapidly in Turkey results in changing understanding of marketing not only in foundation universities but also in public universities. As such, the purpose of this study is to investigate their marketing activities with the perspective of university managers and identify the degree of difference and/or similarity between these two types of universities in Turkey considering the changes in market dynamics. Some international researches examined the point of view of university managers with respect to their ideas of marketing challenges and applications of HEIs (Ivy, 2001; Maringe and Foskett, 2002; Maringe, 2004). However, at the national level, this study will be an endeavor that will fill this gap.
The scope of the study is comprised of HEIs in Turkey that were founded before 2013. The sample includes 23 public and 9 foundation universities. Vocational schools were not considered in the execution of the research. Data collection for the study was carried out through an online survey which was completed by a university staffer with primarily marketing responsibilities in each participating university.
Before starting to assess universities’ marketing activities in terms of 7P’s, their current situation in marketing was examined. As the findings indicate, foundation universities appear to engage in marketing activities much more seriously than public universities. Especially three outcomes suggest this inference: the importance of marketing in foundation universities is more than in public universities, the percentage of foundation universities having a written marketing plan is much more than public ones and the average number of staff working for marketing activities is higher in foundation universities. In public universities, the press and public relations office is engaged in marketing activities for the most part, whereas in most of the foundation universities it is the corporate communications office. The two types of universities seem to be in contrast in this respect. Universities seem to be involved in most of the 7 Ps of the services marketing with similar percentages other than price and people. Foundation universities deal with price more but engage in people less than public universities.
Universities’ product policies appear to be parallel with each other as all of them have undergraduate and graduate programs with a similar percentage. Only in terms of Continuous Education Centers and vocational studies, they have differences. Having more Continuous Education Centers, foundation universities might attempt to speak to general public as well, which could be thought of as another source of revenue. In terms of the

226
betterment of education services, foundation universities seem to dedicate more effort than public universities do. More specifically, foundation universities are found to meet more frequently with potential students and ask them what departments they want to study in, investigate more the expectations of their potential students each year and believe more market research studies determine their education policies. As suggested by Ivy (2008), foundation universitites appear to develop programs more appropriately to meet the needs of the students and influence university choice. Regarding place, an almost equal percentage of universities identify themselves as either campus or city universities. Marangoz and Arslan (2015), stated that location has an influence on the university preference of students and this understanding is well appreciated by the university managers as most of them believe location is an important quality for their universities. However, the centrality of their location is found to be lower for foundation universities than for public ones.
The price section of the survey asked questions to identify the pricing strategies for the two types of universities. While prices of undergraduate programs are officially determined in public universities, foundation universities show varying strategies in the way they determine their undergraduate program prices. The same pattern is also observed in the pricing of graduate programs. Additionally, the majority of participating foundation universities indicate that prices are determined considering corporate image. This finding is in line with the viewpoint of Ivy (2008) who suggested that price should be decided not only as a revenue generating element but also in a way that affects student perceptions of the quality.
In the promotion of their institutions, public universities mostly use brochures, posters, fairs and teasers, whereas foundation ones heavily use all available communication channels, primarily brochures, posters, newspaper and magazine bullets, and web-based tools. This finding is consistent with the proposition of Marangoz and Arslan (2015) who indicated that universities regularly use activities such as catalogs, web sites, gifts to prospective students, stands and fairs. Another difference is that, foundation universities use media types, promotion tools and social media platforms more heavily than public universities do. As for the similarities, the majority of universities update their corporate websites every day and for all of them Facebook and Twitter are the most popular social media platforms. Although not as much as foundation universities, public universities try to benefit from communication tools as well. However, as in pricing, promotion activities of public universities – especially advertising – might have been limited by YÖK.
Both university types identify the potential students and general public as their main target audience, and the remaining ones (graduates and strategically identified groups) receive less attention with similar percentages by both types. In terms of the quality level, both types of universities evaluate people in their universities at a mediocre level and no statistical difference was found between public and foundation universities. Research asserts that (Çeken, 2012; Sütlaş, 2010), all university personnel have an extremely important role to ensure customer satisfaction. Apparently, both types of universities neglect this point of view to a certain extent.

227
Strong process strategy ensures the smooth and easy provision of services (Enache, 2011), however marketing activities related to process dimension seem to receive less attention by the universities as low mean scores were obtained for the items asked. This could be because this aspect of services marketing might not be in the hands of marketing staff in the universities. Besides, apart from one item, indicating that marketing goals do not conflict with their vision, mean scores did not differ for foundation and public universities.
Considering the final P, physical evidence, results show that foundation universities have more potential to invest in aforementioned facilities in order to attract more potential students and/or public universities do not have adequate budget to invest as much as foundation ones. Although the mean scores of foundation universities are higher for most of the physical evidence related items, the only statistical difference emerged in providing more active systems enabling students to give continuous feedback. No matter what the university ownership type is, HEIs should bare in mind that the elements of physical evidence play an important role in target people’s choice of university as revealed by Marangoz and Arslan (2015) and Sütlaş (2010).
The general conclusion that can be arrived at is the fact that public and foundation universities demonstrated varying rates of similarity and difference for specific considerations of their marketing activities. While in considerations such as product, place, people, process and physical evidence they display high degrees of similarity, they display substantial difference particularly in price, promotion and current situation in marketing activities. While some of the differences can be attributed to legal or budget limitations, it can be concluded that as the competition increases, the majority of the differences will start to disappear as both types of universities start to become more marketing-oriented.
The most prominent limitation of the study is the size of the sample; 23 public and 9 foundation universities participated in the study, which makes it less safe to arrive at general conclusions. Although current response rate is found adequate, future research should attempt to increase the sample size. A relatively more general limitation is the fact that the concept of HE marketing and/or processes involved in marketing a service or a product may not have been fully comprehended by Turkish HEIs yet, especially considering the fact that most universities do not have specially designated marketing teams. Therefore, for future research it is suggested that data is collected from several divisions within the same university to arrive at more comprehensive results.

228
REFERENCES
Altan, Şenol, Ayşe Ediz ve Murat Atan (2003). “SERVQUAL Analizi İle Toplam Hizmet Kalitesinin Ölçümü ve Yüksek Eğitimde Bir Uygulama”, 12. Ulusal Kalite Kongresi, İstanbul.
Bajpai, Naval (2010). Business Statistics, Upper Saddle River: Pearson.
Bayrak, Berna (2007). Yükseköğretim Kurumlarından Beklenen Hizmet Kalitesi ve Hizmet Kalitesinin Algılanmasına Yönelik Bir Araştırma. Unpublished Doctorate Dissertation. İstanbul: Marmara Üniversitesi Sosyal Bilimler Enstitüsü.
Binbaşıoğlu, Hulusi (2011). “Yükseköğretimde Eğitim Hizmetlerinin Pazarlanmas: Bir Pilot Araştırma”, Uluslararası Yükseköğretim Kongresi: Yeni Yönelişler ve Sorunlar, Mayıs, s. 2465-2474.
Booms, Bernard H. and Mary J. Bitner (1981). “Marketing Strategies and Organization Structures for Service Firms”, in Marketing of Services (eds. James H. Donnelly and William R. George), p. 47-52, Chicago: American Marketing Association.
Cafoğlu, Zuhal (1996). Eğitimde Toplam Kalite Yönetimi, İstanbul: Avni Akyol Ümit Kültür ve Eğitim Vakfı.
Conway, Tony, Stephen Mackay and David Yorke (1994). “Strategic Planning in Higher Education: Who Are the Customers?”; The International Journal of Educational Management, 8(6), p. 29-36.
Çeken, Nilüfer (2012). Yükseköğretimde Eğitim Pazarlamasını Etkileyen Faktörler: Devlet ve Vakıf Üniversitelerine Yönelik Eğitim Pazarlaması Anket Uygulaması. Unpublished Graduate Dissertation, İstanbul: Beykent Üniversitesi, Sosyal Bilimler Enstitüsü.
Enache, Ioan-Constantin (2011). “Marketing Higher Education Using the 7 Ps Framework”; Bulletin of the Transilvania University of Braşov, p. 23-30.
Erdem, Ali Rıza (2006). “Dünyadaki Yükseköğretimin Değişimi”; Selçuk Üniversitesi Sosyal Bilimler Enstitüsü Dergisi, s. 299-314.
Gatfield, Terry, Michelle Barker and Peter Graham (1999). “Measuring Communication Impact for University Advertising Materials”; Corporate Communications: An International Journal, 4(2), p. 73-79.
Gavcar, Erdoğan, Zeki A. Bulut ve Ali N. Karabulut (2005). “Öğrencilerin İktisadi ve İdari Bilimler Fakültesini Tercih Nedenleri ve Beklentileri (Muğla Üniversitesi Örneği)”; İstanbul Ticaret Üniversitesi Sosyal Bilimler Dergisi, 4(7), s. 21-39.
Gibbs, Paul (2002). “From the Invisible Hand to the Invisible Hand-Shake: Marketing Higher Education”; Research in Post Compulsory Education, 7(3), p. 325-338.

229
Gölpek, Filiz ve Kenan Uğurgelen (2013). “Avrupa Ülkelerinde ve Türkiye'de Yükseköğretime Giriş Sistemleri”; Dicle Üniversitesi İktisadi ve İdari Bilimler Fakültesi Dergisi, 2(5), s. 64-77.
Gray, Brandon J., Kim Shyan Fam and Violeta A. Llanes (2003). “Cross Cultural Values and the Positioning of International Education Brands”; Journal of Product & Brand Management, 12(2), p. 108-119.
Gülcan, Yaprak, Yeşim Kuştepeli ve Ceyhan Aldemir (2002). “Yüksek Öğretimde Öğrenci Doyumu: Kuramsal Bir Çerçeve ve Görgül Bir Araştırma”; Süleyman Demirel Üniversitesi İktisadi ve İdari Bilimler Fakültesi Dergisi, 7(1), s. 99-114.
Güler, Ali (1994). Türkiye’de Üniversite Reformları, Ankara: Adım Yayınları.
Hesketh, Anthony J. and Peter T. Knight (1999). “Postgraduates’ Choice of Programme: Helping Universities to Market and Postgraduates to Choose”; Studies in Higher Education, 24(2), p. 151-163.
Hopoğlu, Sertaç (2012). Vakıf Üniversiteleri ve TRB1 Bölgesinde Vakıf Üniversitelerinin Kurulabilirliği. Fırat Kalkınma Ajansı, Malatya.
Ivy, Jonathan (2001). “Higher Education Institution Image: A Correspondence Analysis Approach”; The International Journal of Educational Management, 15(6), p. 276-282.
Ivy, Jonathan (2008). “A New Higher Education Marketing Mix: The 7Ps For MBA Marketing”; International Journal of Educational Management, 22(4), p. 288-299.
Kilic, Ramazan (1999). “Turkiye'de Yuksekogretimin Kapsami ve Tarihsel Gelisimi”; Dumlupinar Universitesi Sosyal Bilimler Dergisi, s. 289-310.
Kotler, Philip T. and Karen Fox (1985). Strategic Marketing for Educational Institutions, New Jersey: Prentice Hall.
Kucukcan, Talip and Bekir S. Gur (2009). Turkiye'de Yuksekogretim: Karsilastirmali Bir Analiz, SETA: Ankara.
Madran, Canan, İpek Altınbaş, Ayşe Akyol ve Sanem Alkibay (2008). Küresel Pazarlama Yönetimi, İstanbul: Beta.
Marangoz, Yavuzalp Aslıhan ve F. Müge Arslan (2015). “Üniversitelerin Pazarlanmasında Tutundurma Boyutu: Kavramsal Bir İrdeleme”; Toros Üniversitesi İktisadi ve İdari Bilimler Fakültesi Sosyal Bilimler Dergisi, 2(4), s. 138-155.
Maringe, Felix (2004). “Vice Chancellor’s Perceptions of University Marketing: A View From Universities in a Developing Country”; Higher Education Review, 36(2), p. 53-68.

230
Maringe, Felix and Nick Foskett (2002). “Marketing University Education: The South African Experience”; Higher Education Review, 34(3), p. 35-51.
Mazzarol, Tim (1998). “Critical Success Factors for International Education Marketing”; International Journal of Educational Management, 12(4), p. 163-175.
Mortimer, Kathleen (1997). “Recruiting Overseas Undergraduate Students: Are Their Information Requirements Being Satisfied?”; Higher Education Quarterly, 51(3), p. 225-238.
Nguyen Nha and Gaston LeBlanc (2001). “Image and Reputation of Higher Education Institutions in Students Retention Decisions”; The International Journal of Educational Management, 15(6), p. 303-311.
Nicholls, John, John Harris, Eleanor Morgan, Ken Clarke and David Sims (1995). “Marketing Higher Education: The MBA Experience”, The International Journal of Educational Management, 9(2), p. 31-38.
Okumuş, Abdullah and Adnan Duygun (2008). “Eğitim Hizmetlerinin Pazarlanmasında Hizmet Kalitesinin Ölçümü ve Algılanan Hizmet Kalitesi ile Öğrenci Memnuniyeti Arasındaki İlişki”; Anadolu Üniversitesi Sosyal Bilimler Dergisi, 8(2), s. 17-38.
Oplatka, Izhar and Jane Hemsley-Brown (2004). “The Research on School Marketing: Current Issues, Future Directions”; Journal of Educational Administration, 42(3), p. 375-400.
Penpece, Dilek (2014). Yuksekogretim Kurumlarinda Pazarlama: Turkiye'deki Mevcut Durum, Adana: Karahan.
Rindfleish Jennifer M. (2003). “Segment Profiling: Reducing Risk in Higher Education Management”, Journal of Higher Education Policy and Management, 25(2), p. 147-159.
Rockholz, Daria Marie (2002). Strategic Marketing for Public Schools: A Study of Implementation by Connecticut Superintendents and Assistant Superintendents. Unpublished Doctorate Dissertation, Connecticut: Connecticut University.
Sakarya, Cem M. (2006). Yükseköğretimde Öğrenciye Yönelik Hizmet Kalitesinin Ölçülmesi: Akdeniz Üniversitesi İ.İ.B.F. Öğrencileri Üzerinde Bir Araştırma. Unpublished Graduate Dissertation, Antalya: Akdeniz Üniversitesi Sosyal Bilimler Enstitüsü.
Saydan, Reha (2008). “Üniversite Öğrencilerinin Öğretim Elemanlarından Kalite Beklentileri: Yüzüncü Yıl Üniversitesi İİBF Örneği”; Gazi Üniversitesi İktisadi ve İdari Bilimler Fakültesi Dergisi, 10(1), s. 63-79.
Sütlaş, Nurhan (2010). Eğitim Hizmetleri Pazarlaması: Türkiye’deki Üniversitelerin Pazarlama Stratejileri Konusunda Ampirik Bir Araştırma. Unpublished Doctorate Dissertation. Istanbul: Marmara Üniversitesi, Eğitim Bilimleri Enstitüsü.

231
Şahin, Ali E. (2009). “Eğitim Fakültesinde Hizmet Kalitesinin Eğitim Fakültesi Öğrenci Memnuniyet Ölçeği (EFÖMÖ) İle Değerlendirilmesi”; Hacettepe Üniversitesi Eğitim Fakültesi Dergisi, 37, s. 106-122.
Thorsten Hennig-Thurau, F. Langer Markus and Hansen Ursula (2001). “Modeling and Managing Student Loyalty- An Approach Based on the Concept of Relationship Quality”; Journal of Service Research, 3(4), p. 331-344.
Torlak, Ömer (2001). “Eğitim Hizmetleri Pazarlaması Açısından Üniversite Öğrencilerinin Hizmet Kalitesini Algılamalarının Önemi”; Kuram ve Uygulamada Eğitim Yönetimi Dergisi, s. 397-416.
Yalçın, Fatma A., Müge F. Arslan, Necla Tektaş, Ayşe N. İşgören et al. (2013). “Positioning of Campuses in Terms of Satisfaction: A Research on Marmara University”; European Journal of Research on Education, Special Issue, s. 47-53.
Yavuzalp, Aslıhan (2011). Eğitim Pazarlamasında Konumlandırma: İstanbul’daki Üniversitelerin Dershane Öğrencileri Tarafından Algılanmasına İlişkin Bir Araştırma. Unpublished Doctorate Dissertation. Istanbul: Marmara Üniversitesi, Sosyal Bilimler Enstitüsü.
YÖK (Yükseköğretim Kurulu) (n.d). Accessed on 01.11.2017, Retrieved from https://yoksis.yok.gov.tr/websitesiuygulamalari/harita/