Higher Education Funding in Arkansas
22
Higher Education Funding in Arkansas Prepared for: ALC/Higher Education Subcommittee Senator Gilbert Baker, Chair Representative Phillip T. Jacobs, Chair September 17, 2003
Transcript of Higher Education Funding in Arkansas

Higher Education Funding in Arkansas
Prepared for:ALC/Higher Education Subcommittee
Senator Gilbert Baker, ChairRepresentative Phillip T. Jacobs, Chair
September 17, 2003

6
Distribution of Unrestricted Educational and General Revenues excluding Non-
formula Entities: 2001-2002
State58%
Other7%
Tuition35%
Total: $788 million
State funds $457 mTuition $278 mOther includes
•Local Tax Income $9 m
•Grants and Contracts $8 m
•Endowment/Investment & Gift Income $16 m
•Sales and Services $8 m
•Fines & Misc. Income $12 m

2001-02 Total Grants and Contracts from Federal, State, and Local
Institutions Unrestricted Restricted Total
ASUJ 1,009,186$ 28,684,975$ 29,694,161$ ATU - 9,636,806 9,636,806 HSU 250,071 6,663,091 6,913,162 SAUM 194,239 7,120,942 7,315,181 UAF 4,361,015 41,830,338 46,191,353 UAFS - 6,239,892 6,239,892 UALR 1,386,910 31,147,246 32,534,155 UAM - 5,561,365 5,561,365 UAPB - 22,249,079 22,249,079 UCA - 12,888,856 12,888,856 4-Year Total 7,201,421 172,022,590 179,224,010
ASUB 16,139$ 1,151,797$ 1,167,936$ ASUMH - 607,428 607,428 ASUN - 548,909 548,909 BRTC - 2,751,457 2,751,457 CCCUA - 2,574,652 2,574,652 EACC - 2,909,409 2,909,409 GCCC - 3,786,644 3,786,644 MCCC - 4,736,979 4,736,979 MSCC - 3,097,411 3,097,411 NAC 87,557 5,064,412 5,151,969 NWACC - 2,740,432 2,740,432 OTC 21,735 2,086,903 2,108,638 OZC - 3,012,226 3,012,226 PCCUA - 4,352,424 4,352,424 PTC 27,094 6,756,807 6,783,901 RMCC 108,444 3,299,447 3,407,891 SACC 23,527 2,460,046 2,483,573 SAUT - 1,483,976 1,483,976 SEAC - 3,485,855 3,485,855 UACCB - 2,190,831 2,190,831 UACCH 43,034 3,112,350 3,155,384 UACCM 14,879 2,446,068 2,460,947 2-Year Total 342,409 64,656,463 64,998,872
Grand Total 7,543,830$ 236,679,053$ 244,222,883$

Higher Education Fund Balances All of the amount in the fund balance may not be cash in the bank or cash equivalents. The fund balance presented is a snapshot of the
balance as of June 30, 2002.
The fund balance is the value of the excess of assets over liabilities in any fund group or subgroup; it may be equated to commercial equity (NACUBO definition).
For some institutions a large portion of the Unrestricted Educational and General Fund Balance may be accounts receivable, which is
not cash. An institution may appear to have large fund balances and in fact be cash poor.
Even an institution with a fund balance in excess of $50 million may, at times, experience serious cash flow problems, i.e., lack of cash during certain periods of the year when state revenues ebb and flow, untimely receipt of federal Pell funds after the institution has paid the student based on the federal notification of the award to the student or untimely receipt of any reimbursements. The cash portion of the fund balance is required for any such occasions.
To spend it is comparable to spending the cash in your personal savings account, once it’s spent it’s gone. For an institution, it is
fiscally inadvisable to spend fund balances for recurring operating expenses.
The Auxiliary Fund Balance, in addition to accounts receivable also contains such things as bookstore inventory, vending inventory, and food service/cafeteria inventory. All inventories of goods purchased for resale that are on hand June 30 each year are included in the auxiliary fund balance.
Historically, a minimum fund balance for four-year institutions has been approximately 15% of the annual operating budget. In
Arkansas this minimum is often difficult to achieve without neglecting critical facilities maintenance. However, there are other factors, which may necessitate a larger fund balance. Fund balances should be sufficient to cover:
insurance deductibles for all fleet vehicles and all buildings and facilities. 10% of the accumulated plant depreciation, providing a reserve for failure of a major system (roof, chillers,
sewer, boilers, etc.). 10% of instructional equipment and computing hardware inventories 60 - 90 days of contracted salaries and benefits and uncontrollable M&O expenses
A targeted minimum fund balance for an institution might be determined by using these and other factors pertinent to a specific
institution. However, institutions differ in their needs for a fund balance just as they differ in missions and those needs are not determinable by a formula.
In addition, sufficient fund balances are important to an institution’s credit rating, which translates to lower interest rates when the
institution must issue bonds.

Arkansas Higher Education Educational and General Revenue and Fund Balances for 2001-02Unrestricted Unrestricted Fund BalancesEducational Educational UNRESTRICTED RESTRICTED& General & General Educational Auxiliary Educational
Institutions Current Fund Balances Current Current CurrentRevenue as a Percent of Fund Fund Fund2001-02 Revenue Balances Balances Balances
Arkansas State University - Jonesboro $96,639,143 6.5% $6,311,415 $1,514,349 $2,625,660Arkansas Tech University $37,588,680 34.2% $12,856,359 $1,470,268 $48,759Henderson State University $28,395,740 8.6% $2,442,617 $425,669 $62,718Southern Arkansas University $22,821,384 4.8% $1,104,664 $1,900,643 $276,417University of Arkansas at Fayetteville $197,351,503 21.9% $43,297,855 $11,936,542 $13,990,263University of Arkansas at Ft. Smith $27,100,114 8.3% $2,255,332 $717,915 $1,020,599University of Arkansas at Little Rock $89,701,254 13.9% $12,464,319 $885,027 $2,702,224University of Arkansas at Monticello $17,902,660 8.7% $1,553,865 $590,544 $287,142University of Arkansas at Pine Bluff $31,074,687 3.9% $1,207,166 -$135,473 $3,542,092University of Central Arkansas $73,200,901 8.0% $5,826,574 $1,819,405 $470,619Four-Year Total $621,776,066 14.4% $89,320,166 $21,124,889 $25,026,493
Arkansas Northeastern College $8,386,812 23.2% $1,943,741 $198,131 $8,546Arkansas State University - Beebe $13,052,982 20.6% $2,690,839 $152,155 $60,780Arkansas State University - Mountain Home $5,660,133 20.6% $1,163,616 $187,998 $229,973Arkansas State University - Newport $4,104,607 14.7% $603,816 $62,712 $43,494Black River Technical College $8,300,513 110.4% $9,167,390 $335,576 $1,763Cossatot Community College of the University of Arkansas $4,402,059 14.6% $643,692 $2,996 -$123,956East Arkansas Community College $7,152,884 17.3% $1,235,030 $716,851 $4,800Mid-South Community College $5,042,943 36.9% $1,862,235 -$42,628 $66,917National Park Community College $8,625,567 16.6% $1,434,978 $654,196 $21,979North Arkansas College $9,709,165 10.5% $1,023,865 $13,423 $47,940Northwest Arkansas Community College $14,645,390 11.1% $1,625,304 $0 $173,385Ouachita Technical College $4,420,068 23.9% $1,054,706 $25,625 $12,131Ozarka College $3,765,650 63.6% $2,393,860 $0 $0Phillips Community College of the University of Arkansas $12,735,313 17.8% $2,265,082 $198,993 $3,369,055Pulaski Technical College $13,698,302 25.3% $3,461,903 $0 $89,717Rich Mountain Community College $4,205,030 76.4% $3,212,952 $148,827 $4,395South Arkansas Community College $7,477,623 23.7% $1,769,008 $0 $21,846Southeast Arkansas College $7,305,480 32.8% $2,396,985 $303,892 $146,741Southern Arkansas University Tech $6,379,812 19.0% $1,209,320 $87,085 $74,660University of Arkansas Community College at Batesville $5,647,060 28.1% $1,587,286 $155,369 $1,688University of Arkansas Community College at Hope $6,011,370 15.9% $956,546 $0 $843University of Arkansas Community College at Morrilton $6,508,115 37.1% $2,417,670 $0 $117,788Two-Year Total $167,236,878 27.6% $46,119,824 $3,201,201 $4,374,485UAMS $626,807,655 11.7% $73,316,069 $648,802 $14,391,770Total Teaching Campuses $1,415,820,599 14.7% $208,756,059 $24,974,892 $43,792,748
9/12/2003 fundbalance2001-02.xls

FOUR-YEAR INSTITUTIONS
Institution2002-03 SREB
Category 2000 Carnegie ClassificationUAF 2 Doctoral/Research Ext
ASUJ 3 Master's IUALR 3 Doctoral/Research IntUCA 3 Master's I
ATU 5 Master's IHSU 5 Master's ISAUM 5 Master's I
UAFS 2yr - 2 Associate'sUAM 6 Baccalaureate-GenUAPB 6 Baccalaureate-Gen
TWO-YEAR INSTITUTIONS
Institution2002-03 SREB
Category 2000 Carnegie ClassificationASUB 2 Associate'sNWACC 2 Associate'sPTC 2 Associate's
ANC 3 Associate'sASUMH 3 Associate'sASUN 3 Associate'sBRTC 3 Associate'sCCCUA 3 Associate'sEACC 3 Associate'sMSCC 3 Associate'sNAC 3 Associate'sNPCC 3 Associate'sOTC 3 Associate'sOZC 3 Associate'sPCCUA 3 Associate'sRMCC 3 Associate'sSACC 3 Associate'sSAUT 3 Associate'sSEAC 3 Associate'sUACCB 3 Associate'sUACCH 3 Associate'sUACCM 3 Associate's
Arkansas Public Higher Education InstitutionsSREB and Carnegie Classifications
SREB&CARN classifications.xls

SREB Institutional Category Definitions Designed for use in making statistical comparisons among states, the SREB system for categorizing postsecondary education institutions is based on a number of factors relevant to determining resource requirements. Institutions are classified based on size (numbers of degrees or full-time-equivalent enrollment), role (types of degrees), breadth of program offerings (number of program areas in which degrees are granted), and comprehensiveness (distribution of degrees across program areas). The SREB classifications do not take into accounts other factors relevant to determining resource requirements such as cost differences among programs or externally funded research. Institutions are assigned to categories using data on program completions. To keep the statistical comparison groups relatively stable over time from the previous academic year or for two-year colleges and technical institution or college using data or estimated full-time-equivalent enrollment for the current academic year, an institution changes categories when they meet the criterion for another category for the third consecutive time. Four-Year Universities and Colleges • Four-Year 1 - Institutions awarding at least 100 doctoral degrees that are distributed among
at least 10 CIP categories (2-digit classification) with no more than 50 percent in any one category.
• Four-Year 2 - Institutions awarding at least 30 doctoral degrees that are distributed among at least 5 CIP categories (2-digit classification).
• Four-Year 3 - Institutions awarding at least 100 master's, education specialist, post-master's, or doctoral degrees with master's, education specialist, and post-master's degrees distributed among at least 10 CIP categories (2-digit classification).
• Four-Year 4 - Institutions awarding at least 30 master's, education specialist, post-master's, or doctoral degrees with master's, education specialist, and post-master's degrees distributed among at least 5 CIP categories (2-digit classification).
• Four-Year 5 - Institutions awarding at least 30 master's, education specialist, post-master's or doctoral degrees.
• Four-Year 6 - Institutions awarding less than 30 master's, education specialist, post-master's or doctoral degrees.
Two-Year Colleges Two-Year with Bachelor's Institutions awarding primarily associate degrees and offering college transfer courses; some bachelor's degrees may also be awarded. • Two-Year 1 - Institutions awarding associate degrees and offering college transfer courses
with FTE enrollment of 5,000 or more; some certificates and diplomas may also be awarded. • Two-Year 2 - Institutions awarding associate degrees and offering college transfer courses
with FTE enrollment of between 2,000 and 4,999; some certificates and diplomas may also be awarded.
• Two-Year 3 - Institutions awarding associate degrees and offering college transfer courses with FTE enrollment of less than 2,000; some certificates and diplomas may also be awarded.

Carnegie Category Definitions The 2000 Carnegie Classification includes all colleges and universities in the United States that are degree-granting and accredited by an agency recognized by the U.S. Secretary of Education. The 2000 edition classifies institutions based on their degree-granting activities from 1995-96 through 1997-98. The next publication will not be available until 2005. Doctorate-granting Institutions • Doctoral/Research Universities—Extensive: These institutions typically offer a wide
range of baccalaureate programs, and they are committed to graduate education through the doctorate. During the period studied, they awarded 50 or more doctoral degrees per year across at least 15 disciplines.
• Doctoral/Research Universities—Intensive: These institutions typically offer a wide range
of baccalaureate programs, and they are committed to graduate education through the doctorate. During the period studied, they awarded at least ten doctoral degrees per year across three or more disciplines, or at least 20 doctoral degrees per year overall.
Master's Colleges and Universities • Master's Colleges and Universities I: These institutions typically offer a wide range of
baccalaureate programs, and they are committed to graduate education through the master's degree. During the period studied, they awarded 40 or more master's degrees per year across three or more disciplines.
• Master's Colleges and Universities II: These institutions typically offer a wide range of
baccalaureate programs, and they are committed to graduate education through the master's degree. During the period studied, they awarded 20 or more master's degrees per year.
Baccalaureate Colleges • Baccalaureate Colleges—Liberal Arts: These institutions are primarily undergraduate
colleges with major emphasis on baccalaureate programs. During the period studied, they awarded at least half of their baccalaureate degrees in liberal arts fields.
• Baccalaureate Colleges—General: These institutions are primarily undergraduate colleges
with major emphasis on baccalaureate programs. During the period studied, they awarded less than half of their baccalaureate degrees in liberal arts fields.
• Baccalaureate/Associate's Colleges: These institutions are undergraduate colleges where
the majority of conferrals are below the baccalaureate level (associate's degrees and certificates). During the period studied, bachelor's degrees accounted for at least ten percent of undergraduate awards.
Associate's Colleges These institutions offer associate's degree and certificate programs but, with few exceptions, award no baccalaureate degrees. This group includes institutions where, during the period studied, bachelor's degrees represented less than 10 percent of all undergraduate awards.

Admin/Aux Acad Total4-yr Institutions 4,926 5,630 10,556
Arkansas % 47% 53% 100%National Average 58% 42% 100%
2-yr Institutions 1,437 3,073 4,510Arkansas % 32% 68% 100%
National Average 42% 58% 100%4-yr & 2-yr Inst Total 6,363 8,703 15,066
Arkansas % 42% 58% 100%National Average 56% 44% 100%
Non-Formula Total 4,998 2,410 7,408Grand Total 11,361 11,113 22,474
Sources: Arkansas Public Higher Ed Personal Services Recommendations 2003-05 Biennium, 12-Band U.S. Department of Education, National Center for Education Statistics, "Fall Staff, 1999"
2001-02 Paid Positions in Arkansas Higher EducationWith Comparison to National Staffing Averages
Arkansas Four-year & Two-year Institutions
Academic58%
Admin/Aux42%
National Staffing Averages
Academic44%
Admin56%
34

AcademicIncludes Non-classified:
Department Chairs Housing Executive StaffFaculty eg. Resident Hall Staff eg. Chancellor/PresidentPT Faculty Bookstore (non-contract) DeanGraduate & Research Assts Food-service (non-contract) ProfessionalLibrarians eg. Food Service Workers (Baker, Cooks) eg. ControllerResearch Associates Vending Personnel Network Manager
Athletic Department Staff CounselorsFor Non-Formula eg. Coaches Paraprofessional
Archeologists Athletic Trainers eg. AccountantsResearch Scientists Equipment Managers Skilled Trades (Electrician, Plumber)
Public Safety OfficersSupport Staff
Hospital and Patient Care Positions eg. Maintenance WorkersPharmacy Positions Admin Asst/Secretarial Staff
Custodial Workers
County Extension AgentsArchaeological Field Assistants
For Non-Formula
AdministrativeIncludes Classified and Non-classified:
Examples of Types of Positions for Higher Education Institution Personnel
For Non-Formula
Includes Classified and Non-Classified:Auxiliary

Arkansas Higher Education's Share of General Revenues Fiscal 1979/80 to 2002/2003
12.0%
13.0%
14.0%
15.0%
16.0%
17.0%
18.0%
19.0%19
79-8
0
1980
-81
1981
-82
1982
-83
1983
-84
1984
-85
1985
-86
1986
-87
1987
-88
1988
-89
1989
-90
1990
-91
1991
-92
1992
-93
1993
-94
1994
-95
1995
-96
1996
-97
1997
-98
1998
-99
1999
-00
2000
-01
2001
-02
2002
-03
Fiscal Years
Perc
ent o
f Gen
eral
Rev
enue
s
Source: Annual Revenue Report of Bureau of Legislative Research
annualftehistory.xls/sharegraph 9/16/2003

Response to request for information, Higher Education Subcommittee Question: What coordination is there between the two-year technical schools and programs at the high school level? Is there duplication? How could a professional review of this topic be obtained and who should be involved doing the review? Postsecondary-Secondary Coordination Efforts to coordinate programs between two-year technical schools (postsecondary) and high schools (secondary) have been on-going for at least a decade. A number of programs and activities can be cited for which this sort of coordination is paramount: Tech Prep
Tech Prep programs involve both secondary and postsecondary institutions in joint efforts to provide students with an articulated, seamless program beginning at the high school and extending through the completion of an Associate of Applied Science (A.A.S.) degree at a postsecondary institution. A primary feature of Tech Prep programs is that students are not required to repeat at the postsecondary institution identical courses they took in high school. A Tech Prep Consortium comprised of a number of local high schools and at least one local postsecondary institution conducts Tech Prep programs. The operation of each consortium is set forth in the provisions of an Articulation Agreement entered into by all consortium members. Certain courses taken while in high school are acceptable for college credit at the member postsecondary institution, provided these courses are applicable toward the requirements of the A.A.S. degree program the student pursues. These courses are said to have been “articulated”…e.g., their content, delivery, etc., has been examined by a committee representative of both secondary and postsecondary personnel. This committee certifies that the course taught at the high school level (as is, or with prescribed upgrades) is comparable to the same course taught at the postsecondary institution. It is not uncommon that a Tech Prep student may graduate from high school with upwards of 15 semester hours that could be applied toward the requirements of an A.A.S. program at the postsecondary institution. Virtually every two-year postsecondary institution in the state is a member of a Tech Prep consortium and the various consortia are extending the programs to additional high schools each year. The number of Tech Prep consortia in Arkansas greatly increased when Carl D. Perkins funding in support of Tech Prep programs became available in 1990.
High Schools on College Campuses
More recently, a movement has been underway to establish high schools within the organization of two-year colleges. The federal Office of Vocational and Adult Education (OVAE) is promoting this model through demonstration projects under the Tech Prep provisions of the current federal Carl D. Perkins legislation. Students of these high schools would have at their disposal the full range of

courses, programs, faculty, and facilities of the college. To date, at least three postsecondary institutions in the state have considered applying for such a grant, but to date no applications have been submitted. One such program is currently in operation at the University of Arkansas at Fort Smith, but this was undertaken without a Carl D. Perkins grant. Concurrent Credit Students throughout the state are taking courses while in high school which provide that student with credit toward high graduation as well as credit toward a college degree. These courses are offered in a variety of formats. College personnel may teach the course on a high school campus, college courses may be offered on a college campus, courses are offered via distance learning, or qualified high school teachers may teach college courses on a high school campus. Qualified means that the teacher meets the academic credential qualifications a college has for adjunct instructors. Concurrent credit courses are quite popular across the state and almost every higher education institution offers concurrent courses. All the two-year colleges have a significant enrollment of high school students in concurrent courses. Concurrent credit is not to be confused with articulated credit earned via a Tech Prep program. Concurrent credit normally involves dual enrollment at both the high school and the postsecondary institution while Tech Prep articulated credit earned at the high school is usually held in “escrow” until the student enrolls at the postsecondary institution and completes a prescribed number of semester hours credit.
Institutions at both the postsecondary and secondary levels recognize that cooperation is a key to serving the varying needs of today’s students, and thus America’s workforce, and that offering cooperative programs to students is a win-win situation. It would be virtually unimaginable these days that either would pass up an opportunity. Furthermore, postseconday-secondary cooperation is expected to be a key component (requirement) of the upcoming reauthorization of the Carl D. Perkins Act as well as other federal education legislation. Is there duplication? While cooperation between postsecondary and secondary institutions serves a number of ends, all cooperative efforts, regardless of their nature, result in the elimination of duplicate programs offered at postsecondary and secondary institutions. Professional Review of this Topic. Should a professional review of this topic be deemed appropriate, it might best be conducted by a task force representative of postsecondary institutions, high schools, the workforce, and recent graduates of postsecondary institutions who participated in a program offered jointly between their high school and a postsecondary institution.

Arkansas Higher Education Institutions Unrestricted Educational and General Income by Source for 2001-02.Income Sources Tuition Fall Annualized
Percent Local State per 2001 to 2003 Tuition Tuition and Other State 2001/02 Income Funding Credit Hour Tuition Increases
Institutions State Funds Fees Local* Supported FTE Per FTE per FTE 2001/02 2003-04 Percent Dollars 2001/02 2003-04Four-Year Colleges A B C I J = (B+C)/I K = A/I University of Arkansas at Fayetteville $100,433,366 $75,569,484 $21,348,653 50.9% 14,487 $6,690 $6,933 $139 $159 14.7% $20 $4,158 $4,768 Other local income includes:
Arkansas State University $53,887,073 $38,043,610 $4,708,460 55.2% 9,064 $4,717 $5,945 $142 $160 12.6% $18 $4,270 $4,810 Sales and service of educational departmentsUniversity of Arkansas at Little Rock $50,705,578 $34,341,877 $4,653,799 56.5% 8,667 $4,499 $5,850 $130 $153 18.1% $24 $3,893 $4,598 Investment incomeUniversity of Central Arkansas $41,704,210 $29,268,733 $2,227,958 57.0% 8,130 $3,874 $5,130 $125 $150 20.5% $26 $3,738 $4,505 Sale of parking permits and reserved spaces
Arkansas Tech University $20,868,888 $15,181,961 $1,537,831 55.5% 5,324 $3,140 $3,920 $99 $127 28.8% $28 $2,966 $3,820 Parking finesHenderson State University $17,421,107 $10,000,040 $974,593 59.9% 3,301 $3,325 $5,278 $101 $128 27.1% $27 $3,029 $3,851 Library finesSouthern Arkansas University $13,145,259 $8,325,649 $1,350,476 56.9% 2,921 $3,313 $4,500 $90 $118 31.2% $28 $2,706 $3,550 Graduation Fees
University of Arkansas at Ft. Smith $17,609,678 $6,838,310 $2,652,126 65.0% 3,824 $2,482 $4,605 $53 $74 39.6% $21 $1,590 $2,220 Non-credit course feesUniversity of Arkansas at Monticello $11,401,081 $3,210,740 $3,290,839 60.7% 2,143 $3,034 $5,320 $98 $113 15.3% $15 $2,935 $3,385 Operating portion of local taxesUniversity of Arkansas at Pine Bluff $20,410,485 $9,874,098 $790,104 65.7% 3,041 $3,507 $6,712 $107 $123 14.9% $16 $3,209 $3,687 Grant indirect cost recovery Total Four-Year $347,586,725 $230,654,502 $43,534,839 58.3% 60,902 $4,502 $5,707 $108 $131 20.6% $22 $3,249 $3,919 Endowment income
Two-Year Colleges Unrestricted GiftsArkansas Northeastern College $5,967,101 $1,853,288 $566,423 71.1% 1,398 $1,731 $4,268 $35 $50 41.6% $15 $1,052 $1,490Arkansas State University - Beebe $8,958,990 $3,676,735 $417,257 66.6% 2,076 $1,972 $4,316 $55 $68 23.6% $13 $1,650 $2,040Arkansas State University - Mountain Home $3,068,247 $1,586,145 $1,005,741 54.2% 833 $3,112 $3,683 $58 $68 17.2% $10 $1,740 $2,040Arkansas State University - Newport $2,361,678 $1,616,712 $126,217 56.6% 666 $2,617 $3,546 $52 $65 25.0% $13 $1,560 $1,950Black River Technical College $5,693,262 $2,261,686 $345,565 68.6% 1,205 $2,164 $4,725 $48 $55 15.4% $7 $1,430 $1,650Cossatot Community College of the University of Arkansas $3,050,160 $1,054,417 $297,482 69.3% 615 $2,198 $4,960 $42 $45 4.9% $2 $1,274 $1,336East Arkansas Community College $5,734,269 $1,294,362 $124,253 70.3% 1,006 $1,410 $5,700 $33 $46 40.2% $13 $984 $1,380Mid-South Community College $3,699,282 $959,730 $383,931 70.5% 641 $2,096 $5,771 $41 $43 4.9% $2 $1,230 $1,290National Park Community College $6,393,270 $2,103,312 $128,985 74.1% 1,465 $1,524 $4,364 $34 $39 12.6% $4 $1,028 $1,158North Arkansas College $7,500,942 $1,943,715 $264,508 77.3% 1,413 $1,563 $5,309 $36 $49 36.1% $13 $1,080 $1,470Northwest Arkansas Community College $6,169,781 $5,602,416 $2,873,193 40.1% 2,479 $3,419 $2,489 $43 $49 14.0% $6 $1,290 $1,470Ouachita Technical College $3,138,338 $1,208,893 $72,837 68.0% 637 $2,012 $4,927 $51 $59 15.7% $8 $1,530 $1,770Ozarka College $2,750,285 $929,145 $86,220 73.0% 602 $1,687 $4,569 $55 $66 20.7% $11 $1,640 $1,980Phillips Community College of the University of Arkansas $8,712,218 $2,016,651 $2,006,444 68.4% 1,499 $2,684 $5,812 $37 $51 38.7% $14 $1,100 $1,526Pulaski Technical College $7,080,855 $6,003,430 $614,017 51.7% 3,677 $1,800 $1,926 $54 $70 30.2% $16 $1,620 $2,110Rich Mountain Community College $2,842,067 $847,000 $515,963 67.6% 616 $2,213 $4,614 $30 $40 35.1% $10 $888 $1,200South Arkansas Community College $5,819,021 $1,476,121 $182,481 77.8% 841 $1,972 $6,919 $42 $60 43.9% $18 $1,258 $1,810Southeast Arkansas College $4,992,446 $1,899,799 $413,235 65.5% 1,560 $1,483 $3,200 $38 $53 40.4% $15 $1,140 $1,600Southern Arkansas University Tech $4,773,306 $1,378,263 $228,243 74.8% 777 $2,068 $6,143 $56 $64 14.3% $8 $1,680 $1,920University of Arkansas Community College at Batesville $3,274,146 $1,247,719 $1,125,195 58.0% 862 $2,753 $3,798 $40 $52 31.3% $12 $1,196 $1,570University of Arkansas Community College at Hope $4,586,219 $1,216,837 $208,314 75.4% 843 $1,691 $5,440 $50 $57 12.6% $6 $1,510 $1,700University of Arkansas Community College at Morrilton $3,985,857 $1,779,657 $742,601 51.5% 1,039 $2,428 $3,836 $42 $60 43.7% $18 $1,260 $1,810 Two-Year Total/Average $110,551,740 $43,956,033 $12,729,105 64.5% 26,750 $1,643 $4,133 $44 $55 24.5% $11 $1,325 $1,649
University of Arkansas for Medical Sciences $77,215,182 $11,245,019 $538,347,454 12.3% 2,191 $250,841 $35,242 $10,080 Total/Average All $535,353,647 $285,855,554 $594,611,398 37.6% 87,652 $3,261 $6,108
9/5/2003 statesupport by sreb.xls final

Relationship of State Funds per FTE and Tuition in Two-Year Institutions - Fiscal 2001-02
$20$25$30$35$40$45$50$55$60$1,926
$3,200
$3,683
$3,836
$4,316
$4,569
$4,725
$4,960
$5,440
$5,771
$6,143
State Funds per FTE
Tuiti
on p
er C
redi
t Hou
r
9/5 /2003 statesupport by sreb.xls sheet6 40

Average State Funds per FTE Student 1979-80 to 2002-2003
$1,000
$1,500
$2,000
$2,500
$3,000
$3,500
$4,000
$4,500
$5,000
$5,500
$6,000
1979
-8019
80-81
1981
-8219
82-83
1983
-8419
84-85
1985
-8619
86-97
1987
-8819
88-89
1989
-9019
90-91
1991
-9219
92-93
1993
-9419
94-95
1995
-9619
96-97
1997
-9819
98-99
1999
-0020
00-01
2001
-0220
02-03
Fiscal Years
Stat
e Fu
nds
per F
TE
Actual
Adjusted for Inflation - CPI
Adjusted for Inflation - HEPI
annualftehistorygraphs.xls 41

FTE Enrollments in Arkansas Public Universities 1979-80 to 2002-03
1,000
3,000
5,000
7,000
9,000
11,000
13,000
15,000
17,000
1979-80
1980-81
1981-82
1982-83
1983-84
1984-85
1985-86
1986-97
1987-88
1988-89
1989-90
1990-91
1991-92
1992-93
1993-94
1994-95
1995-96
1996-97
1997-98
1998-99
1999-00
2000-01
2001-02
2002-03
Fiscal Years
FTE
Enro
llmen
ts UAF
ASUJ
UALR UCA
ATU
UAFS
HSU
UAM
UAPBSAUM
annualftehistory/ftegraph.xls 9/5/2003 42

2003 UpdateType of Tax Tax Rate Amt Collected Date Tax
Institution (Millage and/or Sales) (#mills or %) FY2002-03 Allowable Use for Tax ExpiresLOCAL TAXESANC* Millage 1.2 mills 486,181 No restrictions exist No ExpirationASU/Heber Springs County Sales Tax 0.5% 350,000 Capital and Operating No ExpirationASUMH Millage 1.8 mills 791,258 Capital and Operating No ExpirationASUN* County Sales Tax 0.5% 224,944 Capital and Operating No Expiration
CCCUA Howard Cty Sales Tax 0.25% 348,931 Capital or Operating, excluding salary No Expiration
CCCUA Sevier Cty Sales Tax 0.25% 303,167 Capital or Operating, excluding salary No ExpirationEACC Millage 1.3 mills 253,583 Debt service then operating No Expiration
MSCC Millage 4 mills 1,588,927Capital & operating after debt service obligations No Expiration
NPCC Millage 0.8 mills 704,889 No restrictions exist No ExpirationNWACC* Millage 2.7 mills 3,808,218 2/3 Operating; 1/3 Debt Retirement No Expiration
NAC* Millage 1.7 mills 515,115Capital & operating after debt service obligations No Expiration
OZC-Ash Flat City Sales Tax 0.375% 122,881 Capital and Operating No ExpirationPCCUA Millage 1.7 mills 251,235 Operating 100% No Expiration Stuttgart/Dewitt County Sales Tax 0.5% 1,215,549 Operating 100% No ExpirationRMCC Millage 1.9 mills 270,680 No restrictions exist No ExpirationSACC Millage 0.5 mills 224,237 Capital No ExpirationUACCB* County Sales Tax 0.25% 967,502 Capital and Operating No ExpirationUACCH Sales Tax 0.25% 571,800 Bonds, Capital & Operating No ExpirationUACCM Sales Tax 0.25% 476,489 Capital and Operating No Expiration
UAFS County Sales Tax 0.25% 4,323,658Committed for debt service & capital; no restrictions for operating Dec-2022
NO LOCAL TAXESASUB NABRTC NAOTC NAOZC-Melbourne NAPTC NASAUT NASEAC NA
*Notes:(ANC) Primarily used for debt service, capital & equipment.
(ASUN) Reflects amount collected for 4 months.
(NWACC) 2/3rds is used for college operations and 1/3 for debt retirement. Board of Trustees may vote to transfer funds.not needed for debt retirement to pay for capital improvement (buildings/equipment) purchases.
(NAC) The millage has always been intended and used for capital type projects - or for debt service of capital type projects. However, with Board approval any uncommitted portion may be used for operations. Through 2016 about $270,000 per year is restricted for debt service for an outstanding general obligation bond issue - the proceed of which funded a capital project.
(UACCB) Commitment that no sales tax revenues will be used for salary expenses.
Arkansas Department of Higher EducationSurvey of Sales Tax/Millage Information
Millage Survey 2003.xls

Educational Excellence Trust Fund 2003-04
ASUJ 4,840,473 10.24% ATU 1,622,559 3.43% HSU 1,678,461 3.55% SAUM 992,343 2.10% UAF 7,350,981 15.56% UAFS 2,459,417 5.21% UALR 4,262,463 9.02% UAM 856,423 1.81% UAPB 1,486,732 3.15% UCA 3,693,991 7.82%4-YR SUBTOTAL 29,243,843 61.89% ANC 578,924 1.23% ASUB 1,154,847 2.44% ASUMH ASUN BRTC CCCUA EACC 604,360 1.28% MSCC NPCC 903,906 1.91% NAC 356,928 0.76% NWACC 798,820 1.69% OTC OZC PCCUA 588,565 1.25% PTC RMCC 159,529 0.34% SACC 413,339 0.87% SAUT 162,944 0.34% SEAC UACCB UACCH UACCM
2-YR SUBTOTAL 5,722,162 12.11%
ASUJ-MT ATU-AVTI SAUT-ECC 27,230 0.06% SAUT-FTA 68,917 0.15% UA-SYS 211,400 0.45% UA-Div Agri 4,344,527 9.20% UA-AS 104,499 0.22% UA-CJI UAM-Forest Echoes UAM-Great Rivers UAMS 7,339,125 15.53% UAMS - IC 182,626 0.39%
NON-FORM SUBTOTAL 12,278,324 26.00%
TOTAL 47,244,329 100.00%
Source Act 1305 of 2003
Ed. Excell. Trust Fund (08/13/03)INSTITUTION Percentage of Pie

TOTAL ON-CAMPUS HEADCOUNT BY RACE / ETHNICITY, 2000 - 2002
2 0 0 0 2 0 0 1 2 0 0 2INSTITUTION Black White Other Total Black White Other Total Black White Other Total
Public Four-YearASUJ 1,217 7,780 330 9,327 1,229 7,734 337 9,300 1,275 7,611 370 9,256
13.0% 83.4% 3.5% 13.2% 83.2% 3.6% 13.8% 82.2% 4.0%ATU 185 4,311 310 4,806 218 4,711 351 5,280 243 4,984 345 5,572
3.8% 89.7% 6.5% 4.1% 89.2% 6.6% 4.4% 89.4% 6.2%HSU 488 2,778 164 3,430 485 2,772 171 3,428 494 2,699 251 3,444
14.2% 81.0% 4.8% 14.1% 80.9% 5.0% 14.3% 78.4% 7.3%SAUM 642 2,161 174 2,977 711 2,167 185 3,063 737 2,087 217 3,041
21.6% 72.6% 5.8% 23.2% 70.7% 6.0% 24.2% 68.6% 7.1%UAF 901 12,205 1,837 14,943 906 12,439 2,015 15,360 931 12,518 2,100 15,549
6.0% 81.7% 12.3% 5.9% 81.0% 13.1% 6.0% 80.5% 13.5%UAFS 199 4,507 415 5,121 193 4,810 488 5,491 247 5,197 574 6,018
3.9% 88.0% 8.1% 3.5% 87.6% 8.9% 4.1% 86.4% 9.5%
UALR 2,880 6,623 891 10,394 3,161 6,629 885 10,675 3,234 6,584 881 10,699 27.7% 63.7% 8.6% 29.6% 62.1% 8.3% 30.2% 61.5% 8.2%
UAM 505 1,724 66 2,295 520 1,684 54 2,258 588 1,780 62 2,430 22.0% 75.1% 2.9% 23.0% 74.6% 2.4% 24.2% 73.3% 2.6%
UAMS 149 1,566 140 1,855 182 1,599 155 1,936 206 1,652 159 2,017 8.0% 84.4% 7.5% 9.4% 82.6% 8.0% 10.2% 81.9% 7.9%
UAPB 2,795 138 38 2,971 2,911 111 56 3,078 2,959 122 46 3,127 94.1% 4.6% 1.3% 94.6% 3.6% 1.8% 94.6% 3.9% 1.5%
UCA 1,159 6,631 536 8,326 1,227 6,482 617 8,326 1,301 6,446 682 8,429 13.9% 79.6% 6.4% 14.7% 77.9% 7.4% 15.4% 76.5% 8.1%
Four-Year Subtotal 11,120 50,424 4,901 66,445 11,743 51,138 5,314 68,195 12,215 51,680 5,687 69,582 16.7% 75.9% 7.4% 17.2% 75.0% 7.8% 17.6% 74.3% 8.2%
Public Two-YearASUB 96 1,991 64 2,151 97 1,896 64 2,057 112 2,088 81 2,281
4.5% 92.6% 3.0% 4.7% 92.2% 3.1% 4.9% 91.5% 3.6%ASUMH 3 1,121 17 1,141 4 1,208 26 1,238 3 1,213 32 1,248
0.3% 98.2% 1.5% 0.3% 97.6% 2.1% 0.2% 97.2% 2.6%ASUN 49 409 24 482 55 476 23 554 93 610 40 743
10.2% 84.9% 5.0% 9.9% 85.9% 4.2% 12.5% 82.1% 5.4%BRTC 9 1,211 15 1,235 4 1,441 24 1,469 7 1,636 24 1,667
0.7% 98.1% 1.2% 0.3% 98.1% 1.6% 0.4% 98.1% 1.4%COTC 79 673 62 814 80 715 95 890 96 780 69 945
9.7% 82.7% 7.6% 9.0% 80.3% 10.7% 10.2% 82.5% 7.3%EACC 474 657 33 1,164 554 628 31 1,213 687 720 26 1,433
40.7% 56.4% 2.8% 45.7% 51.8% 2.6% 47.9% 50.2% 1.8%GCCC 149 1,931 139 2,219 178 2,136 108 2,422 187 2,534 258 2,979
6.7% 87.0% 6.3% 7.3% 88.2% 4.5% 6.3% 85.1% 8.7%MCCC 529 1,413 38 1,980 535 1,270 35 1,840 666 1,303 41 2,010
26.7% 71.4% 1.9% 29.1% 69.0% 1.9% 33.1% 64.8% 2.0%
MSCC 476 571 25 1,072 448 520 29 997 551 556 31 1,138 44.4% 53.3% 2.3% 44.9% 52.2% 2.9% 48.4% 48.9% 2.7%
NAC 6 1,671 38 1,715 5 1,726 44 1,775 5 1,864 55 1,924 0.3% 97.4% 2.2% 0.3% 97.2% 2.5% 0.3% 96.9% 2.9%
NWACC 31 3,312 401 3,744 38 3,379 480 3,897 47 3,800 562 4,409 0.8% 88.5% 10.7% 1.0% 86.7% 12.3% 1.1% 86.2% 12.7%
OUTC 123 581 10 714 141 687 19 847 133 901 30 1,064 17.2% 81.4% 1.4% 16.6% 81.1% 2.2% 12.5% 84.7% 2.8%
OZC 2 643 15 660 2 660 16 678 5 794 18 817 0.3% 97.4% 2.3% 0.3% 97.3% 2.4% 0.6% 97.2% 2.2%
PCC/UA 943 1,367 47 2,357 914 1,322 31 2,267 961 1,255 32 2,248 40.0% 58.0% 2.0% 40.3% 58.3% 1.4% 42.7% 55.8% 1.4%
PTC 1,655 2,516 135 4,306 1,836 2,931 198 4,965 2,142 2,963 243 5,348 38.4% 58.4% 3.1% 37.0% 59.0% 4.0% 40.1% 55.4% 4.5%
RMCC - 814 37 851 1 812 44 857 915 47 962 0.0% 95.7% 4.3% 0.1% 94.7% 5.1% 0.0% 95.1% 4.9%
Arkansas Department of Higher Education
STUDENT RACE / ETHNICITY FOR FALL TERM --

TOTAL ON-CAMPUS HEADCOUNT BY RACE / ETHNICITY, 2000 - 2002
2 0 0 0 2 0 0 1 2 0 0 2INSTITUTION Black White Other Total Black White Other Total Black White Other Total
Arkansas Department of Higher Education
STUDENT RACE / ETHNICITY FOR FALL TERM --
Public Two-YearSACC 266 908 26 1,200 309 804 22 1,135 315 892 27 1,234
22.2% 75.7% 2.2% 27.2% 70.8% 1.9% 25.5% 72.3% 2.2%SAUT 199 443 11 653 198 434 11 643 220 486 12 718
30.5% 67.8% 1.7% 30.8% 67.5% 1.7% 30.6% 67.7% 1.7%SEAC 769 1,151 35 1,955 889 1,219 44 2,152 942 1,192 64 2,198
39.3% 58.9% 1.8% 41.3% 56.6% 2.0% 42.9% 54.2% 2.9%UACCB 30 966 28 1,024 34 1,164 38 1,236 37 1,284 35 1,356
2.9% 94.3% 2.7% 2.8% 94.2% 3.1% 2.7% 94.7% 2.6%
UACCH 280 821 52 1,153 311 781 31 1,123 329 695 26 1,050 24.3% 71.2% 4.5% 27.7% 69.5% 2.8% 31.3% 66.2% 2.5%
UACCM 92 1,034 46 1,172 91 1,159 40 1,290 118 1,331 41 1,490 7.8% 88.2% 3.9% 7.1% 89.8% 3.1% 7.9% 89.3% 2.8%
Two-Year Subtotal 6,260 26,204 1,298 33,762 6,724 27,368 1,453 35,545 7,656 29,812 1,794 39,262 18.5% 77.6% 3.8% 18.9% 77.0% 4.1% 19.5% 75.9% 4.6%
PUBLIC TOTAL 17,380 76,628 6,199 100,207 18,467 78,506 6,767 103,740 19,871 81,492 7,481 108,84417.3% 76.5% 6.2% 17.8% 75.7% 6.5% 18.3% 74.9% 6.9%
Percentages are based on institutional total or group subtotal and may not total 100% due to rounding.UAFS became a four-year institution January 2002.
Source: ADHE 02 Supplement; I:\Enrollment Book FAll 2001\3Race\Enroll-tbl16-TOTAL.xls
Notes: 'Other' includes students reported as American Indian/Alaskan Native, Asian/Pacific Islander, Hispanic, non-resident alien, and those whose race or ethnicity is unknown.
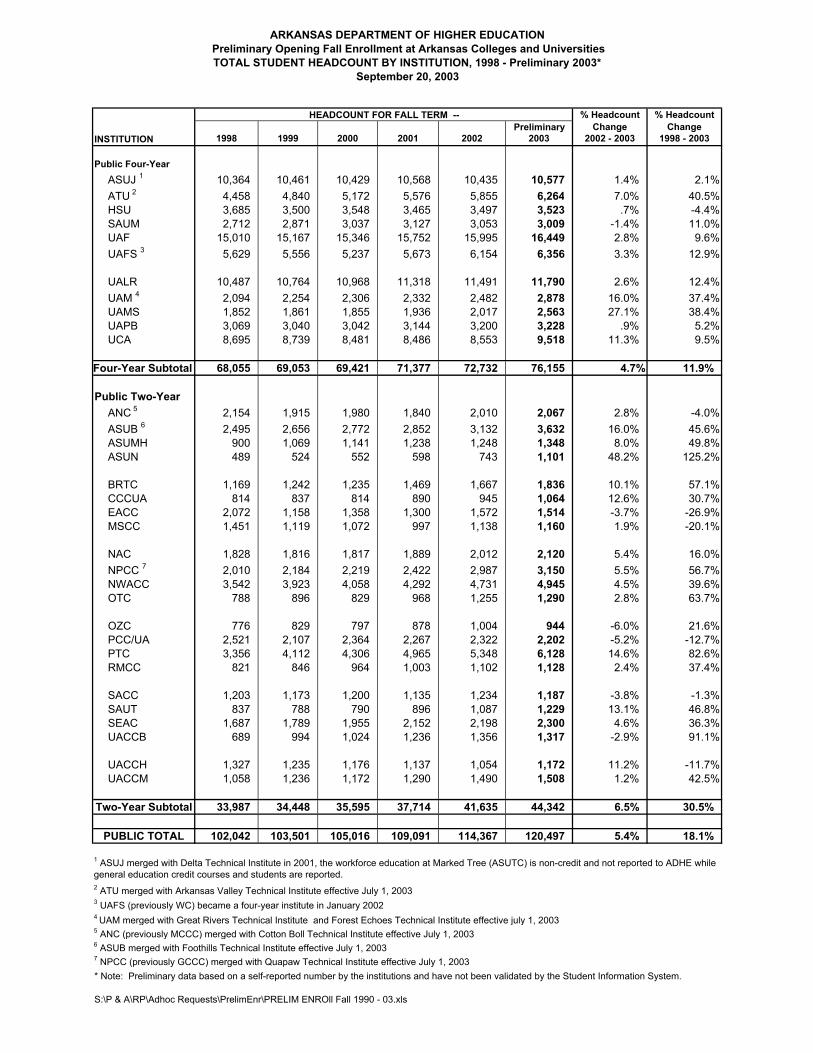
% Headcount % HeadcountPreliminary Change Change
INSTITUTION 1998 1999 2000 2001 2002 2003 2002 - 2003 1998 - 2003
Public Four-YearASUJ 1 10,364 10,461 10,429 10,568 10,435 10,577 1.4% 2.1%ATU 2 4,458 4,840 5,172 5,576 5,855 6,264 7.0% 40.5%HSU 3,685 3,500 3,548 3,465 3,497 3,523 .7% -4.4%SAUM 2,712 2,871 3,037 3,127 3,053 3,009 -1.4% 11.0%UAF 15,010 15,167 15,346 15,752 15,995 16,449 2.8% 9.6%UAFS 3 5,629 5,556 5,237 5,673 6,154 6,356 3.3% 12.9%
UALR 10,487 10,764 10,968 11,318 11,491 11,790 2.6% 12.4%UAM 4 2,094 2,254 2,306 2,332 2,482 2,878 16.0% 37.4%UAMS 1,852 1,861 1,855 1,936 2,017 2,563 27.1% 38.4%UAPB 3,069 3,040 3,042 3,144 3,200 3,228 .9% 5.2%UCA 8,695 8,739 8,481 8,486 8,553 9,518 11.3% 9.5%
Four-Year Subtotal 68,055 69,053 69,421 71,377 72,732 76,155 4.7% 11.9%
Public Two-YearANC 5 2,154 1,915 1,980 1,840 2,010 2,067 2.8% -4.0%ASUB 6 2,495 2,656 2,772 2,852 3,132 3,632 16.0% 45.6%ASUMH 900 1,069 1,141 1,238 1,248 1,348 8.0% 49.8%ASUN 489 524 552 598 743 1,101 48.2% 125.2%
BRTC 1,169 1,242 1,235 1,469 1,667 1,836 10.1% 57.1%CCCUA 814 837 814 890 945 1,064 12.6% 30.7%EACC 2,072 1,158 1,358 1,300 1,572 1,514 -3.7% -26.9%MSCC 1,451 1,119 1,072 997 1,138 1,160 1.9% -20.1%
NAC 1,828 1,816 1,817 1,889 2,012 2,120 5.4% 16.0%NPCC 7 2,010 2,184 2,219 2,422 2,987 3,150 5.5% 56.7%NWACC 3,542 3,923 4,058 4,292 4,731 4,945 4.5% 39.6%OTC 788 896 829 968 1,255 1,290 2.8% 63.7%
OZC 776 829 797 878 1,004 944 -6.0% 21.6%PCC/UA 2,521 2,107 2,364 2,267 2,322 2,202 -5.2% -12.7%PTC 3,356 4,112 4,306 4,965 5,348 6,128 14.6% 82.6%RMCC 821 846 964 1,003 1,102 1,128 2.4% 37.4%
SACC 1,203 1,173 1,200 1,135 1,234 1,187 -3.8% -1.3%SAUT 837 788 790 896 1,087 1,229 13.1% 46.8%SEAC 1,687 1,789 1,955 2,152 2,198 2,300 4.6% 36.3%UACCB 689 994 1,024 1,236 1,356 1,317 -2.9% 91.1%
UACCH 1,327 1,235 1,176 1,137 1,054 1,172 11.2% -11.7%UACCM 1,058 1,236 1,172 1,290 1,490 1,508 1.2% 42.5%
Two-Year Subtotal 33,987 34,448 35,595 37,714 41,635 44,342 6.5% 30.5%
PUBLIC TOTAL 102,042 103,501 105,016 109,091 114,367 120,497 5.4% 18.1%
2 ATU merged with Arkansas Valley Technical Institute effective July 1, 20033 UAFS (previously WC) became a four-year institute in January 20024 UAM merged with Great Rivers Technical Institute and Forest Echoes Technical Institute effective july 1, 20035 ANC (previously MCCC) merged with Cotton Boll Technical Institute effective July 1, 20036 ASUB merged with Foothills Technical Institute effective July 1, 20037 NPCC (previously GCCC) merged with Quapaw Technical Institute effective July 1, 2003
S:\P & A\RP\Adhoc Requests\PrelimEnr\PRELIM ENROll Fall 1990 - 03.xls
* Note: Preliminary data based on a self-reported number by the institutions and have not been validated by the Student Information System.
ARKANSAS DEPARTMENT OF HIGHER EDUCATIONPreliminary Opening Fall Enrollment at Arkansas Colleges and UniversitiesTOTAL STUDENT HEADCOUNT BY INSTITUTION, 1998 - Preliminary 2003*
September 20, 2003
1 ASUJ merged with Delta Technical Institute in 2001, the workforce education at Marked Tree (ASUTC) is non-credit and not reported to ADHE while general education credit courses and students are reported.
HEADCOUNT FOR FALL TERM --