Higher Education Funding - Imperial College Union · PDF fileyears and the debate in the...
24
14 Higher Education Funding Survey Analysis Alex Savell – Deputy President (Finance & Services)
Transcript of Higher Education Funding - Imperial College Union · PDF fileyears and the debate in the...
14
Higher Education
Funding Survey Analysis
Alex Savell – Deputy President (Finance & Services)
1
Contents
Why did we Conduct the Survey? 2
How did we Conduct the Survey? 2
How did we Advertise the Survey? 3
Does it Reflect what Respondents Thought? 3
How did we Handle the Data? 4
Who Took the Survey? 4
How did People Answer? 7
Issue 1 7
Issue 2 9
Issue 3 10
How do we resolve the ‘Student’s should contribute’ vs. Free Education Problem? 15
What Should Our Stance Be? 16
Appendix – The Survey i
2
Why did we Conduct the Survey?
In June 2014 the Union’s previous Higher Education Policy expired. Union Council,
the main policy setting body of the Union, mandated the Officer Trustees to collate direct
information reflective of the views of all students in order to form a new policy. With approval
from the Union Council of the 2014-15 years we took the decision to do this by implementing
a survey.
The issue is important to the Union because it will affect thousands of students over
the coming years from every possible background. In particular, with a general election
occurring in May 2015 there could be significant changes to policy occurring in the coming
years and the debate in the lead-up to the elections could feature Higher Education Funding
prominently. As a leading university who have recently been ranked 2nd in the world in the
QS survey we have a very strong platform to lobby from and our views may genuinely
influence opinion at a high level. As such, forming a strong policy that is well founded on the
opinions of our real students and based on evidence is highly important in giving us our best
chance to exert this influence.
How did we Conduct the Survey?
A survey, such as this, allows a great deal of information to be gained and it was
important to us to try to use this opportunity to gain data on a number of issues to try to
create a thorough policy. However, this has to be tempered with respect to how many people
would fill in the survey and so the decision was taken to focus primarily around Home
Undergraduate funding. While this narrowed the scope of the survey significantly, it allowed
a relatively extensive exploration of the issues surrounding the current and other proposed
systems without making the survey too long and onerous to complete. This was also
assisted by the use of the colleges online survey platform; qualtrics, which allowed a great
deal of data to be gathered without manual user input based on respondant college logins.
The platform does have potential downsides though, some comments suggested that the
look of the platform was unappealing and inaccessible and there is the disadvantage with a
purely online survey that there may be accessibility problems, however it was felt that this
was the best option.
The survey was initially drafted by the Officer Trustee team and focussed on three
issues around higher education funding before asking some more general questions. This
draft was then fed back to Union Council for feedback and input prior to the final version
being launched at midday on 4 November 2014. The survey ran for two weeks closing on 19
November with open surveys being allowed to conclude.
The full text of the presented survey can be found in screenshots appended to this
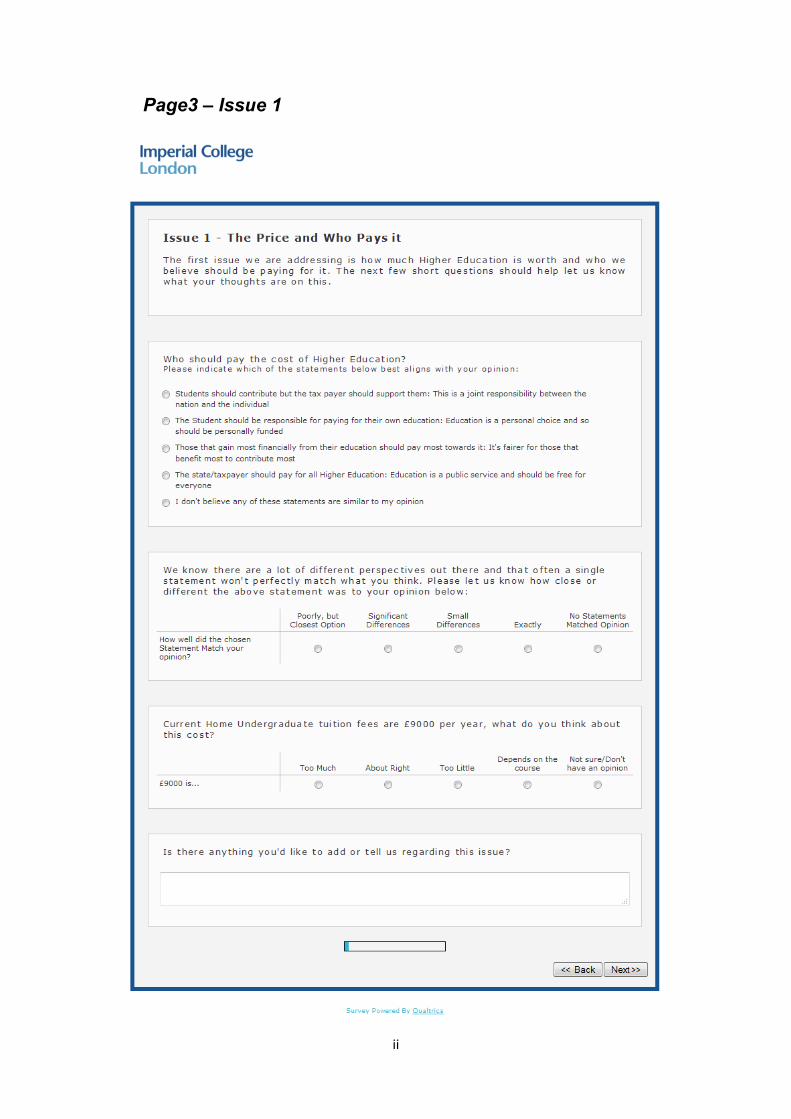
document. However, format remained as described. The three issues probed were:
1. ‘The Price and Who Pays It’ – intended to discover how much we think
university should cost and who we believe should be contributing to paying it
2. ‘How do we Ensure the Best Education’ – intended to look at how the way we
fund higher education may affect the quality and calibre of education students
receive
3
3. ‘Will I be in debt’ – intended to look at how perception of the price of university
and the debt accrued affects attitudes towards education
We finally then asked students to rank these areas in what they felt was importance
order as well as asking them both what system of funding they would ultimately like to see
as well as what they felt was the model that was most pressing in terms of a lobbying
objective. The models focussed upon were Tuition Fees, Free Education and Graduate Tax.
For a description of these models please see our HEF Factsheet at
imperialcollegeunion.org/HEF-Factsheet.
How did we Advertise the Survey?
One criticism of the survey was that it was not well publicised. As such, an
explanation of our marketing strategy for the survey seems appropriate. The first port of call
for the survey was intended to be the Union website. A news piece about the survey was
promoted to the website homepage during the course of the survey. In addition we used
Union twitter accounts to promote this further with the #HEF_ICU hashtag. Further to this we
made use of posters in the bar area and circulated promotional material and information to
the ~500 strong rep network. Finally, with thanks to Andrew Tranter for his contribution here,
we added to that an article on the HEF debate and mentioning the survey, kindly published
by our student newspaper Felix, which can be found at
felixonline.co.uk/features/4871/educating-the-masses-on-funding/. It is our hope that this
shows sufficient effort was made to try to gain a broad reach and exposure for the survey in
order to try to get a representative set of responses.
Does it Reflect what Respondents Thought?
It would be very easy to relate the results of this survey without assessing its validity.
With such a limited space available it is important that our survey is addressing the correct
issues and within those issues allowing options that reflect the spread of opinions. As such
we used several metrics within the survey that gave a hint as to whether these opinions were
actively reflecting opinions. Firstly, when asked to rank the three main issues in order of
importance over ¾ of students had “Issues we have not covered” as last on their list of
priorities and only 5% had this as their most important. These students, in their free-text
comments, mentioned a number of interesting things including reverting to previous systems
of university funding as well as the problems of university living costs, the system of grants
4
and student loans available being made or maintained to support any student attending
university and the system letting down PG students, particularly those on 1 year masters
courses. These thoughts were often echoed by other students and also featured the cost for
overseas students and a number of comments about transparency about how Tuition Fees
are spent.
For all our questions we tried to give a negative response option. In our 3 main
opinion questions regarding the issues described we had less than 2% return a negative
response for Issue 1 above and less than 10% for Issue 3. For Issue 2 there was a higher
(~20%) rate of students feeling that none of the statements matched their opinion suggesting
that a range of opinions were felt about this difficult issue. We also looked at how closely
peoples opinion’s matched with the statements they chose. Using a ranking running from
Exactly at 100% down through 75% for Small differences, 50% for Significant differences
and 25% for Poorly but closest option we took an average and found that most people
considered they had small differences of opinion to their chosen statement and on average
for all but one issue people had 70% confidence in their answer or better. As such we feel
that this is good evidence that the issues probed and the options given were valid and did
reflect reasonably well most respondents’ views.
How did we Handle the Data?
After the survey closed a period of time for open surveys to conclude was given prior
to downloading the tabulated results as a spreadsheet. This raw data contained personal
login data. This was used to add departmental, course and fee status data to the results
before individual information was deleted to maintain anonymity. Duplicate results were then
reconciled using the most recent answers to questions chronologically or combining free text
responses where possible. Results from non-students, incorrect login details and empty
surveys were eliminated. The resulting spreadsheet was compared with historical and
current demographic information and statistics created primarily using automated formulas.
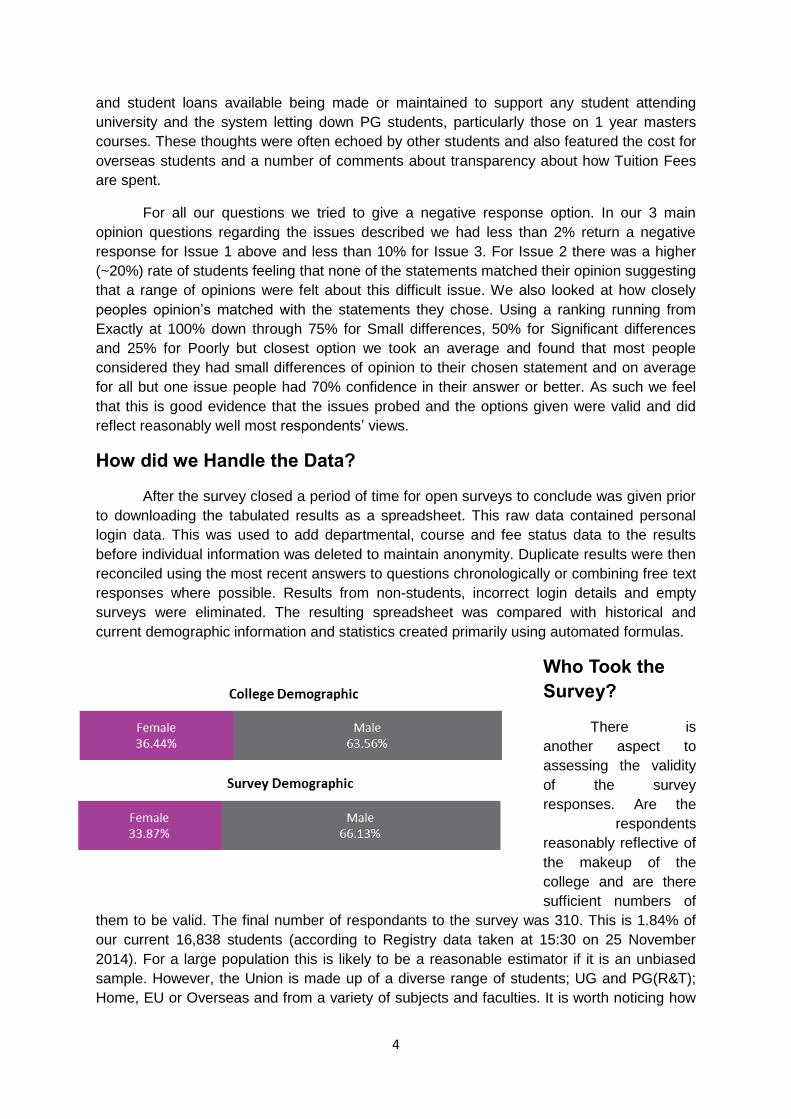
Who Took the
Survey?
There is
another aspect to
assessing the validity
of the survey
responses. Are the
respondents
reasonably reflective of
the makeup of the
college and are there
sufficient numbers of
them to be valid. The final number of respondants to the survey was 310. This is 1.84% of
our current 16,838 students (according to Registry data taken at 15:30 on 25 November
2014). For a large population this is likely to be a reasonable estimator if it is an unbiased
sample. However, the Union is made up of a diverse range of students; UG and PG(R&T);
Home, EU or Overseas and from a variety of subjects and faculties. It is worth noticing how
5
closely our survey aligns with the Student population. Perhaps the easiest statistic to look at
is the gender ratio. As can be seen below, good agreement between our survey data and the
historic (June 2013) college gender ratio.
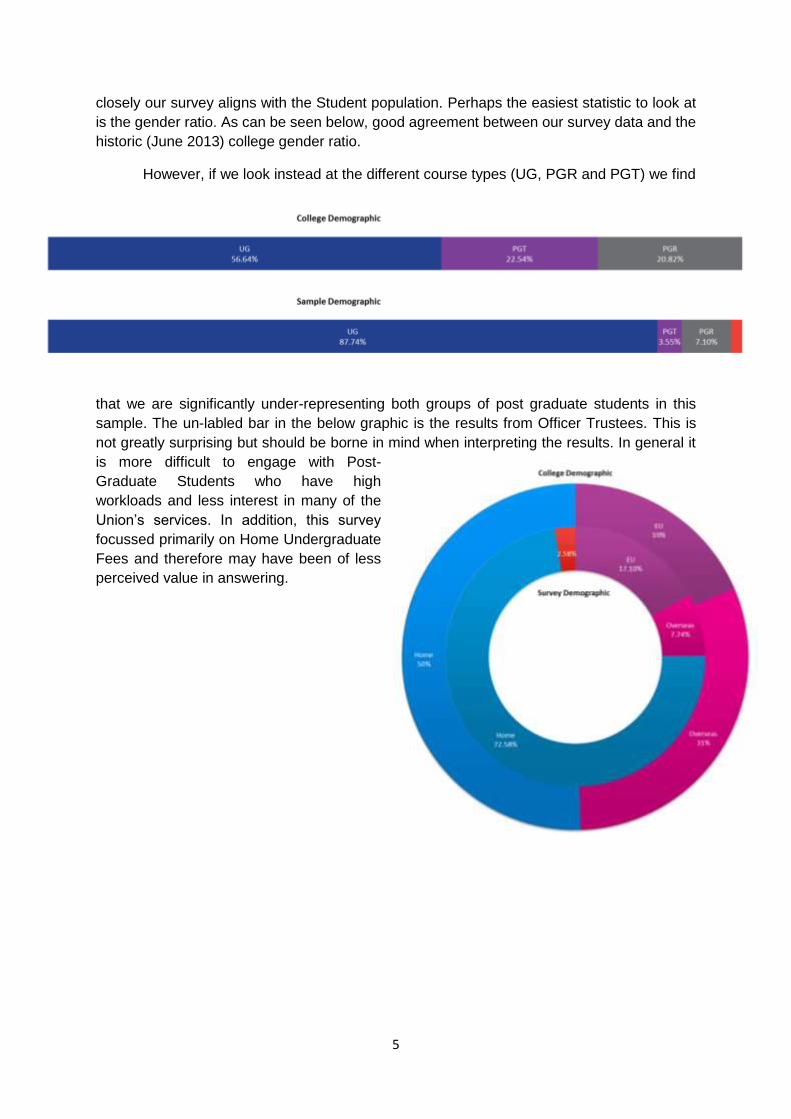
However, if we look instead at the different course types (UG, PGR and PGT) we find
that we are significantly under-representing both groups of post graduate students in this
sample. The un-labled bar in the below graphic is the results from Officer Trustees. This is
not greatly surprising but should be borne in mind when interpreting the results. In general it
is more difficult to engage with Post-
Graduate Students who have high
workloads and less interest in many of the
Union’s services. In addition, this survey
focussed primarily on Home Undergraduate
Fees and therefore may have been of less
perceived value in answering.
6
This may also be true for
EU and Overseas students. As
we can see from the chart here
this is surprisingly not the case
for EU students who have a very
similar response rate to their
proportion in the June 2013
makeup of college. However, this
is not the case for Overseas
students who are again, under-
represented here quite
significantly and commensurately
our Home students are the best
represented set of opinions here.
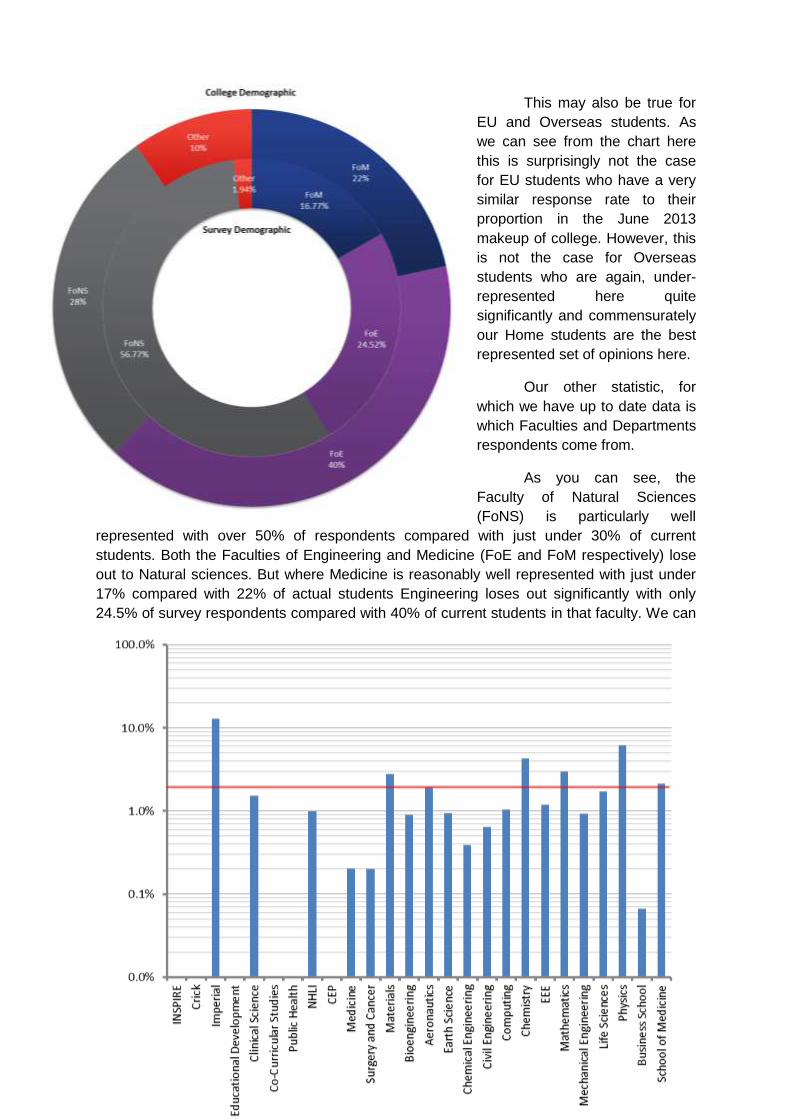
Our other statistic, for
which we have up to date data is
which Faculties and Departments
respondents come from.
As you can see, the
Faculty of Natural Sciences
(FoNS) is particularly well
represented with over 50% of respondents compared with just under 30% of current
students. Both the Faculties of Engineering and Medicine (FoE and FoM respectively) lose
out to Natural sciences. But where Medicine is reasonably well represented with just under
17% compared with 22% of actual students Engineering loses out significantly with only
24.5% of survey respondents compared with 40% of current students in that faculty. We can
7
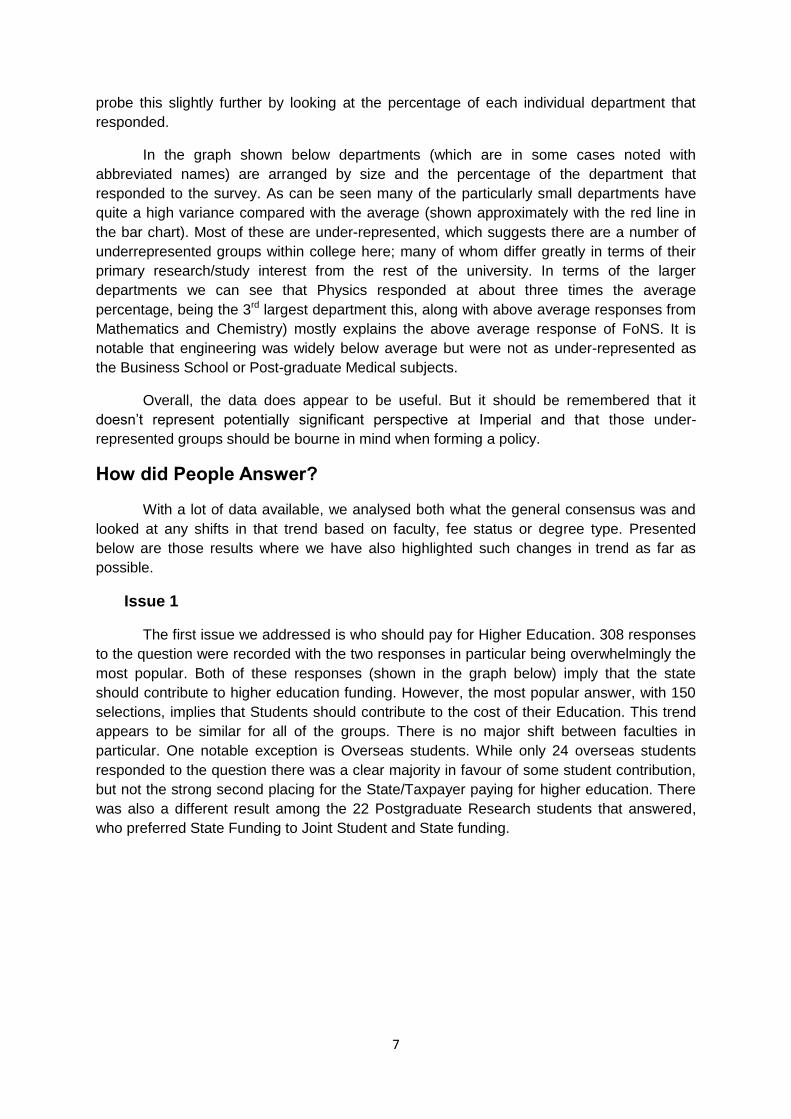
probe this slightly further by looking at the percentage of each individual department that
responded.
In the graph shown below departments (which are in some cases noted with
abbreviated names) are arranged by size and the percentage of the department that
responded to the survey. As can be seen many of the particularly small departments have
quite a high variance compared with the average (shown approximately with the red line in
the bar chart). Most of these are under-represented, which suggests there are a number of
underrepresented groups within college here; many of whom differ greatly in terms of their
primary research/study interest from the rest of the university. In terms of the larger
departments we can see that Physics responded at about three times the average
percentage, being the 3rd largest department this, along with above average responses from
Mathematics and Chemistry) mostly explains the above average response of FoNS. It is
notable that engineering was widely below average but were not as under-represented as
the Business School or Post-graduate Medical subjects.
Overall, the data does appear to be useful. But it should be remembered that it
doesn’t represent potentially significant perspective at Imperial and that those under-
represented groups should be bourne in mind when forming a policy.
How did People Answer?
With a lot of data available, we analysed both what the general consensus was and
looked at any shifts in that trend based on faculty, fee status or degree type. Presented
below are those results where we have also highlighted such changes in trend as far as
possible.
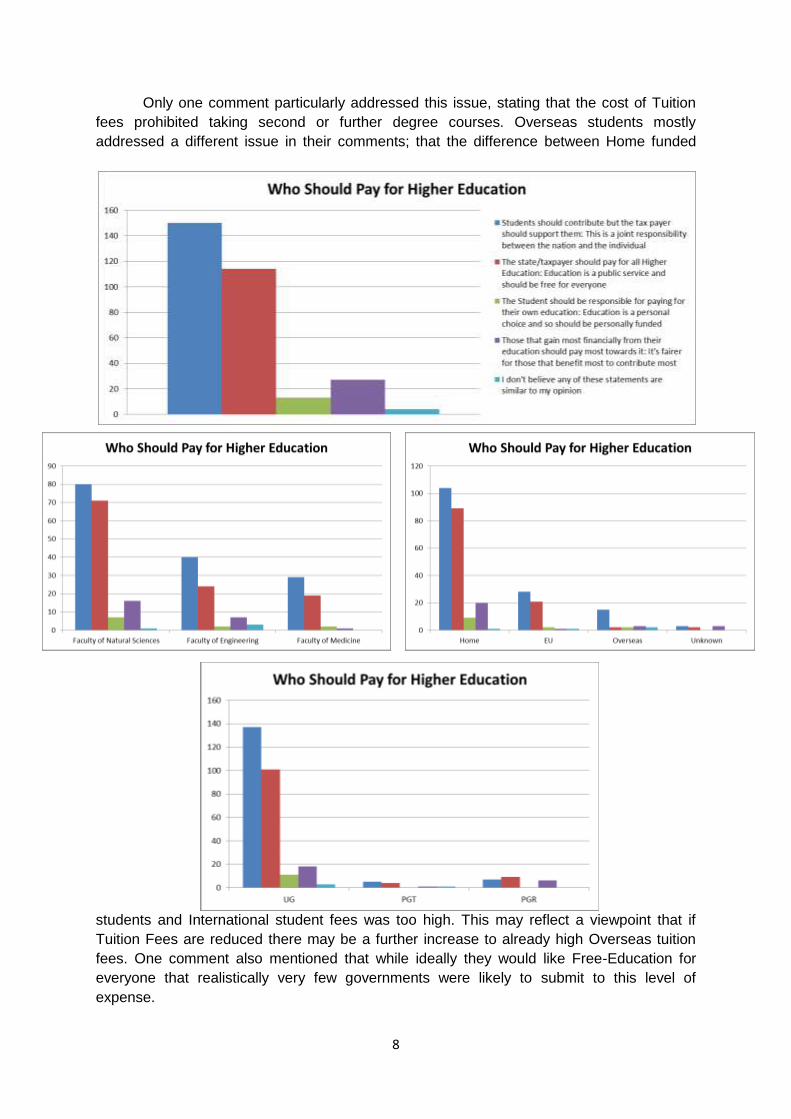
Issue 1
The first issue we addressed is who should pay for Higher Education. 308 responses
to the question were recorded with the two responses in particular being overwhelmingly the
most popular. Both of these responses (shown in the graph below) imply that the state
should contribute to higher education funding. However, the most popular answer, with 150
selections, implies that Students should contribute to the cost of their Education. This trend
appears to be similar for all of the groups. There is no major shift between faculties in
particular. One notable exception is Overseas students. While only 24 overseas students
responded to the question there was a clear majority in favour of some student contribution,
but not the strong second placing for the State/Taxpayer paying for higher education. There
was also a different result among the 22 Postgraduate Research students that answered,
who preferred State Funding to Joint Student and State funding.
8
Only one comment particularly addressed this issue, stating that the cost of Tuition
fees prohibited taking second or further degree courses. Overseas students mostly
addressed a different issue in their comments; that the difference between Home funded
students and International student fees was too high. This may reflect a viewpoint that if
Tuition Fees are reduced there may be a further increase to already high Overseas tuition
fees. One comment also mentioned that while ideally they would like Free-Education for
everyone that realistically very few governments were likely to submit to this level of
expense.
9
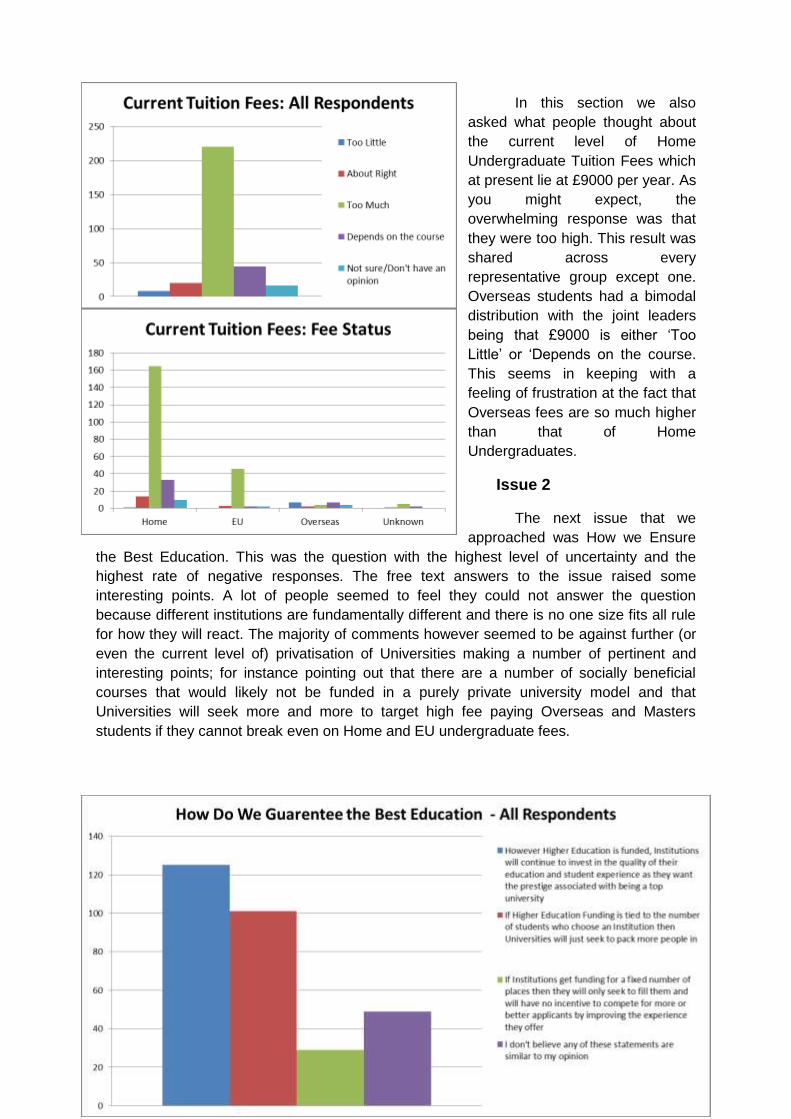
In this section we also
asked what people thought about
the current level of Home
Undergraduate Tuition Fees which
at present lie at £9000 per year. As
you might expect, the
overwhelming response was that
they were too high. This result was
shared across every
representative group except one.
Overseas students had a bimodal
distribution with the joint leaders
being that £9000 is either ‘Too
Little’ or ‘Depends on the course.
This seems in keeping with a
feeling of frustration at the fact that
Overseas fees are so much higher
than that of Home
Undergraduates.
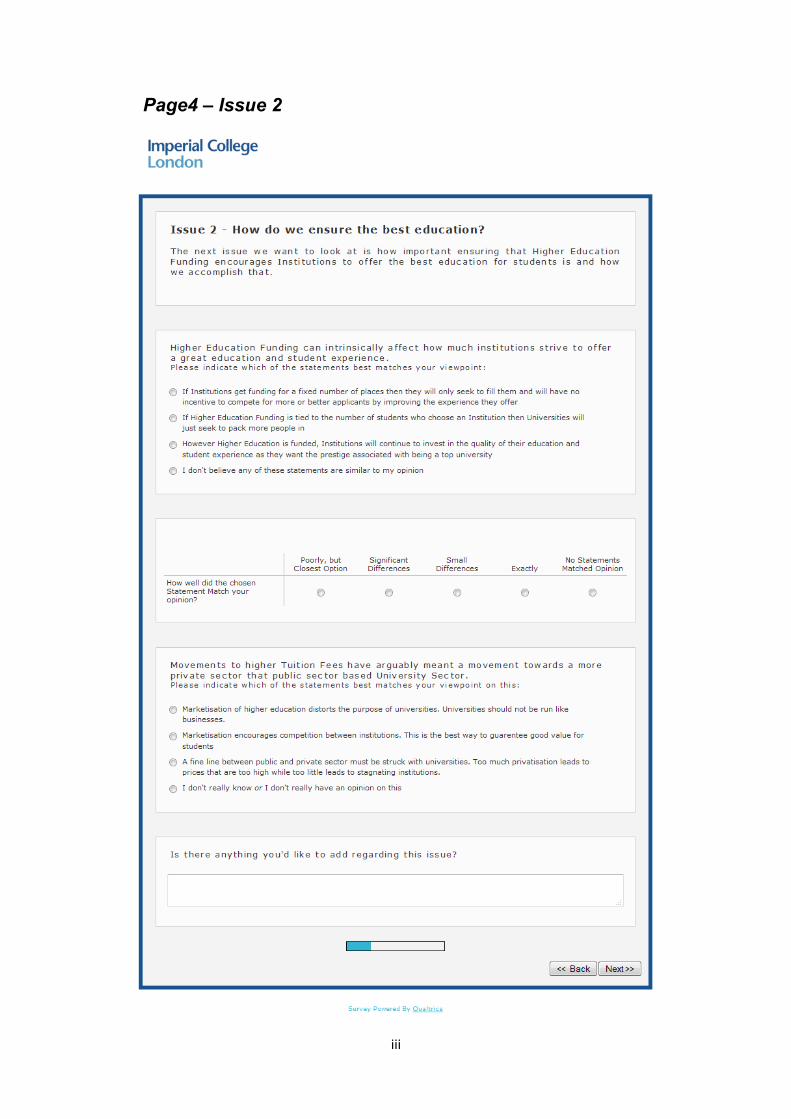
Issue 2
The next issue that we
approached was How we Ensure
the Best Education. This was the question with the highest level of uncertainty and the
highest rate of negative responses. The free text answers to the issue raised some
interesting points. A lot of people seemed to feel they could not answer the question
because different institutions are fundamentally different and there is no one size fits all rule
for how they will react. The majority of comments however seemed to be against further (or
even the current level of) privatisation of Universities making a number of pertinent and
interesting points; for instance pointing out that there are a number of socially beneficial
courses that would likely not be funded in a purely private university model and that
Universities will seek more and more to target high fee paying Overseas and Masters
students if they cannot break even on Home and EU undergraduate fees.
10
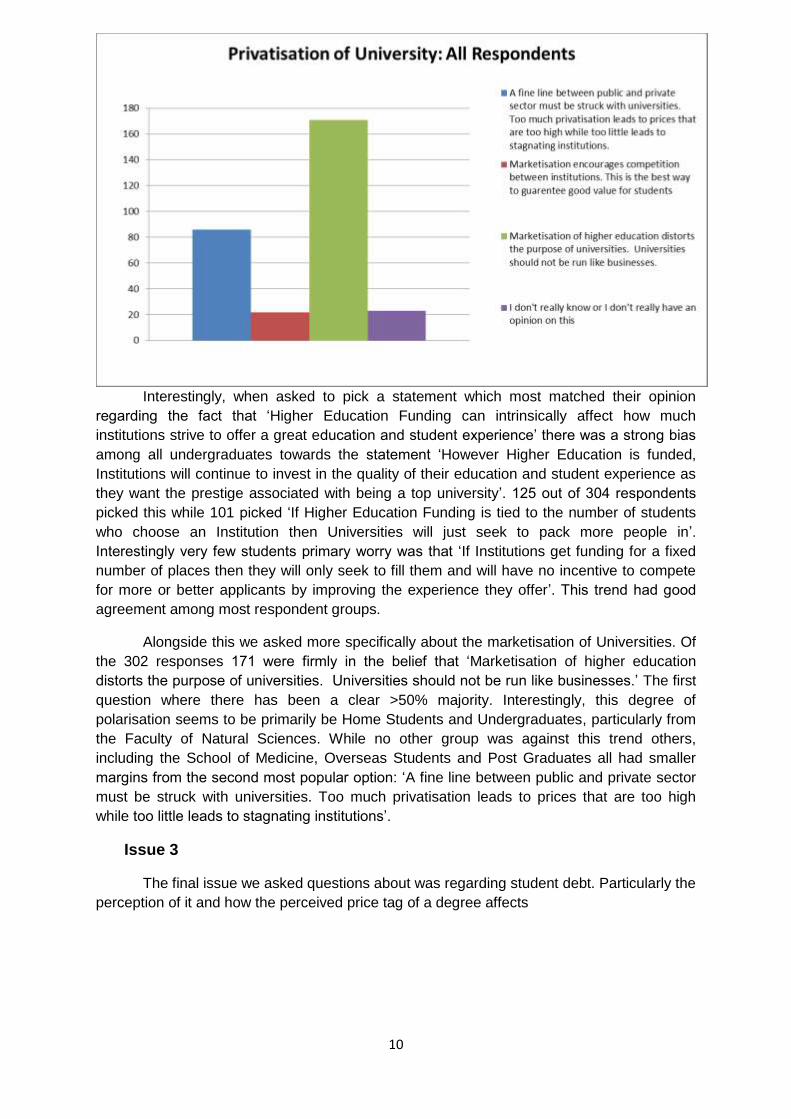
Interestingly, when asked to pick a statement which most matched their opinion
regarding the fact that ‘Higher Education Funding can intrinsically affect how much
institutions strive to offer a great education and student experience’ there was a strong bias
among all undergraduates towards the statement ‘However Higher Education is funded,
Institutions will continue to invest in the quality of their education and student experience as
they want the prestige associated with being a top university’. 125 out of 304 respondents
picked this while 101 picked ‘If Higher Education Funding is tied to the number of students
who choose an Institution then Universities will just seek to pack more people in’.
Interestingly very few students primary worry was that ‘If Institutions get funding for a fixed
number of places then they will only seek to fill them and will have no incentive to compete
for more or better applicants by improving the experience they offer’. This trend had good
agreement among most respondent groups.
Alongside this we asked more specifically about the marketisation of Universities. Of
the 302 responses 171 were firmly in the belief that ‘Marketisation of higher education
distorts the purpose of universities. Universities should not be run like businesses.’ The first
question where there has been a clear >50% majority. Interestingly, this degree of
polarisation seems to be primarily be Home Students and Undergraduates, particularly from
the Faculty of Natural Sciences. While no other group was against this trend others,
including the School of Medicine, Overseas Students and Post Graduates all had smaller
margins from the second most popular option: ‘A fine line between public and private sector
must be struck with universities. Too much privatisation leads to prices that are too high
while too little leads to stagnating institutions’.
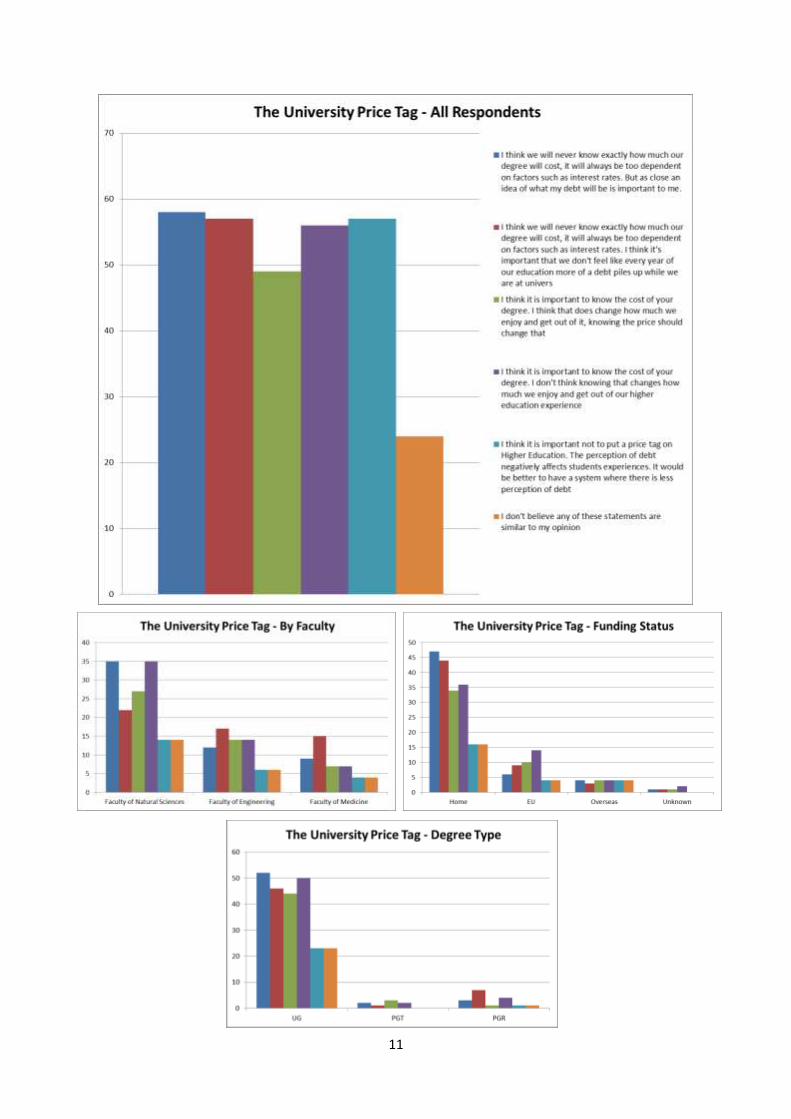
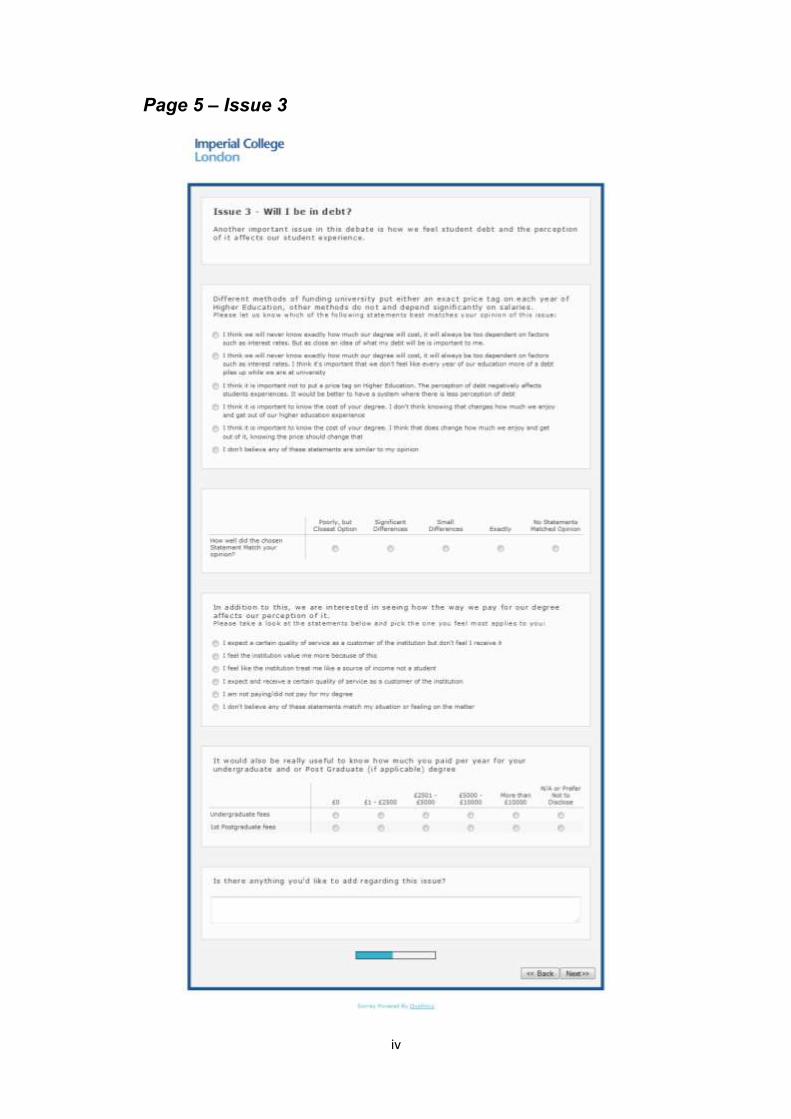
Issue 3
The final issue we asked questions about was regarding student debt. Particularly the
perception of it and how the perceived price tag of a degree affects
11
12
student attitudes towards their education. Interestingly, the distribution of opinions for this is
nearly flat. With 288 responses the top 5 answers all had between 49 and 58 selections with
the top 4 answers only spread between 58 and 56 responses. Perhaps unsurprisingly the
trends vary between faculty, funding status and degree type. This seems to indicate that
there are genuinely a variety of perspectives within our student body.
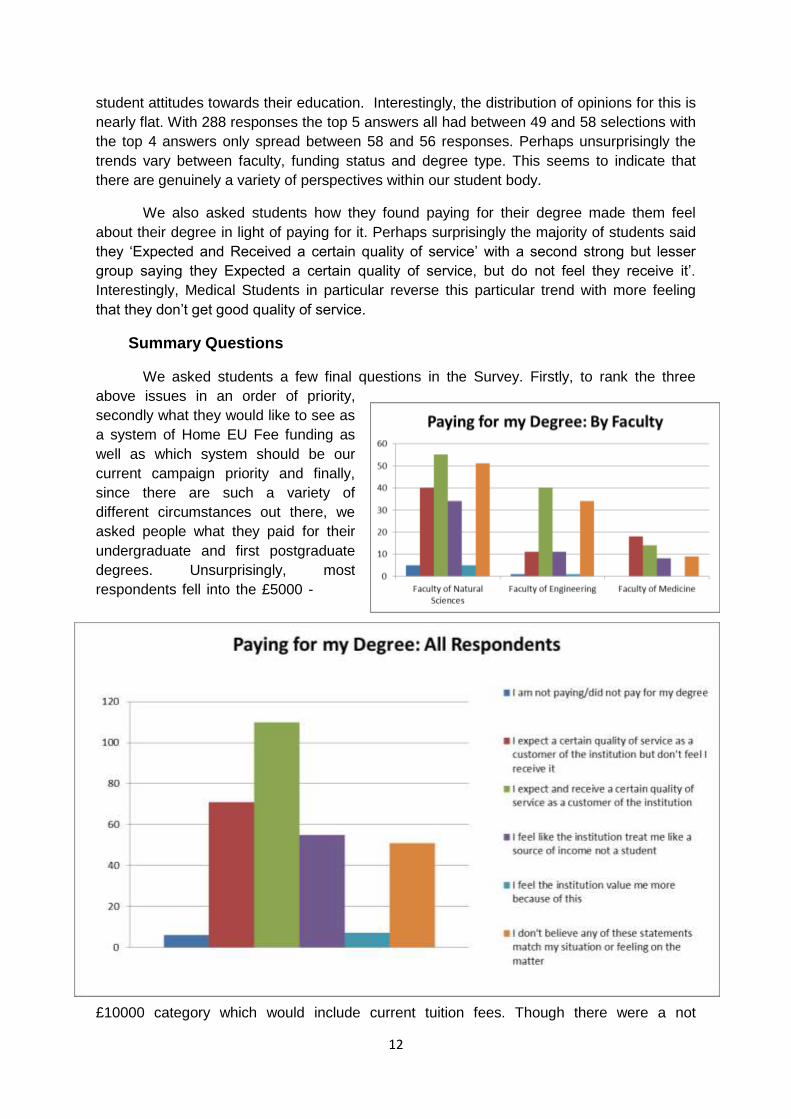
We also asked students how they found paying for their degree made them feel
about their degree in light of paying for it. Perhaps surprisingly the majority of students said
they ‘Expected and Received a certain quality of service’ with a second strong but lesser
group saying they Expected a certain quality of service, but do not feel they receive it’.
Interestingly, Medical Students in particular reverse this particular trend with more feeling
that they don’t get good quality of service.
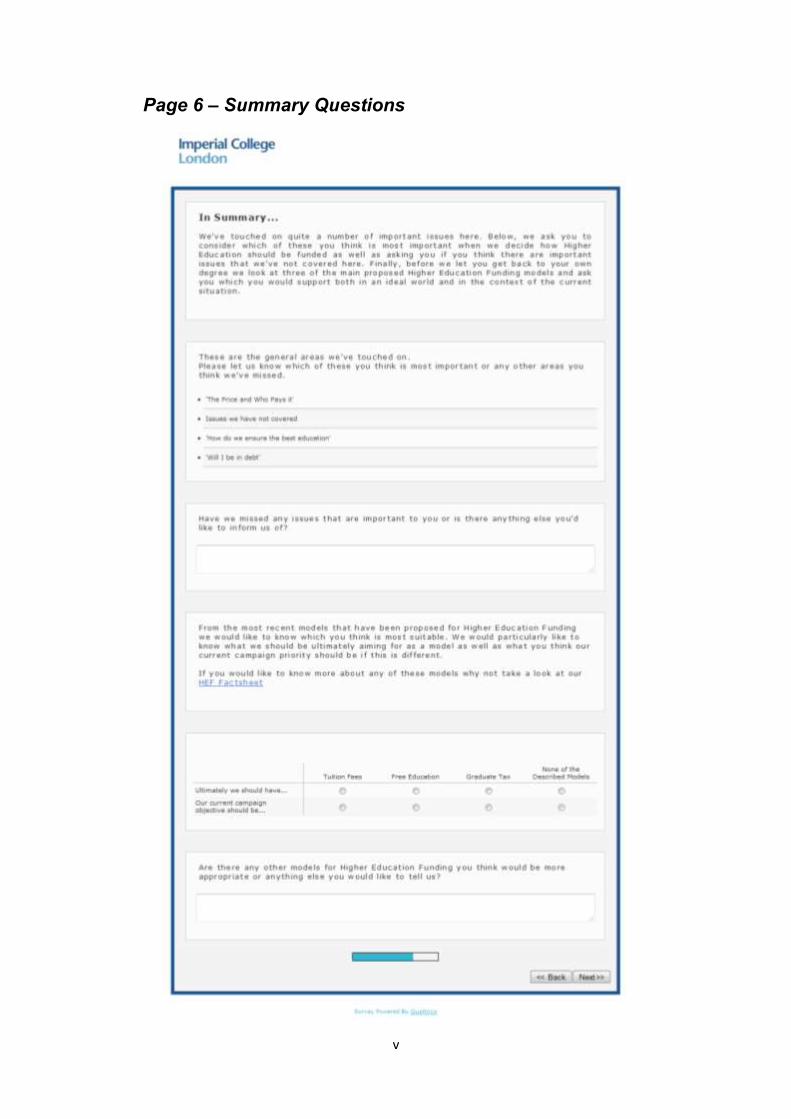
Summary Questions
We asked students a few final questions in the Survey. Firstly, to rank the three
above issues in an order of priority,
secondly what they would like to see as
a system of Home EU Fee funding as
well as which system should be our
current campaign priority and finally,
since there are such a variety of
different circumstances out there, we
asked people what they paid for their
undergraduate and first postgraduate
degrees. Unsurprisingly, most
respondents fell into the £5000 -
£10000 category which would include current tuition fees. Though there were a not
13
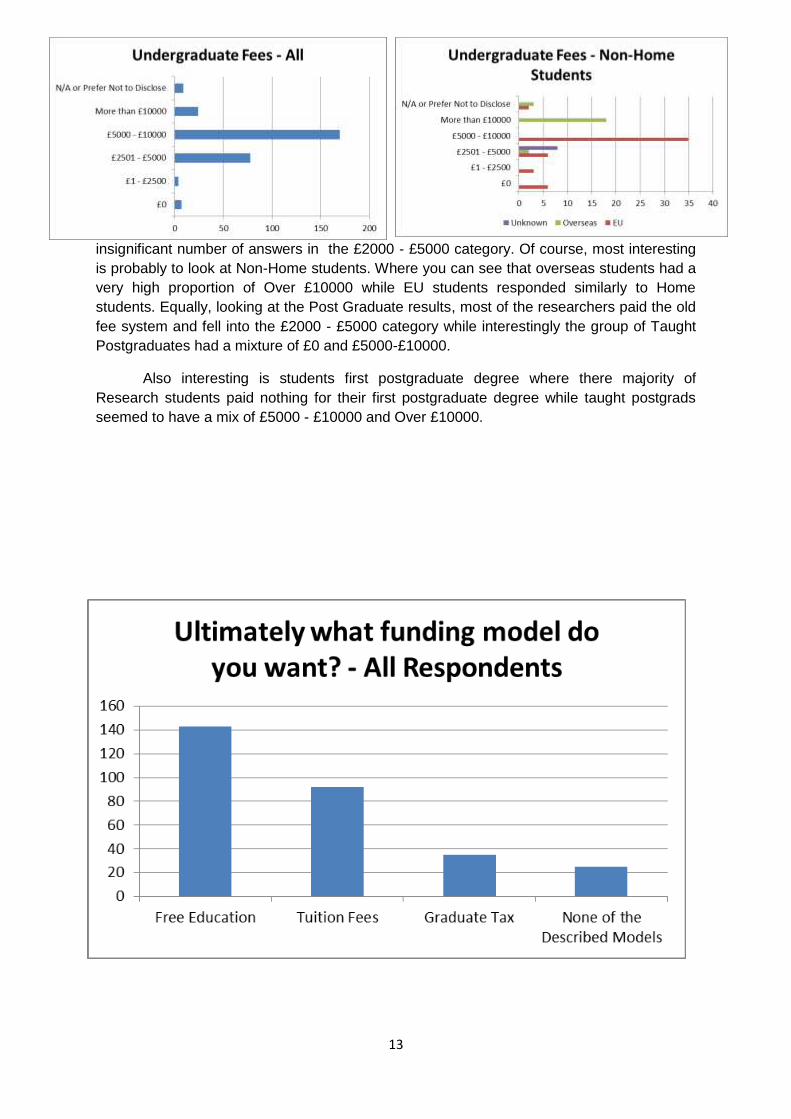
insignificant number of answers in the £2000 - £5000 category. Of course, most interesting
is probably to look at Non-Home students. Where you can see that overseas students had a
very high proportion of Over £10000 while EU students responded similarly to Home
students. Equally, looking at the Post Graduate results, most of the researchers paid the old
fee system and fell into the £2000 - £5000 category while interestingly the group of Taught
Postgraduates had a mixture of £0 and £5000-£10000.
Also interesting is students first postgraduate degree where there majority of
Research students paid nothing for their first postgraduate degree while taught postgrads
seemed to have a mix of £5000 - £10000 and Over £10000.
14
When asked what funding model we should ultimately be aiming for, just over 140 of
the 295 respondents said Free Education. The trend shown in this graph seems to be
common across all respondent groups. This is particularly interesting as, despite the fact that
Tuition Fees was the second most popular answer this seems to fly completely contrary to
what was suggested in Issue 1 – where there seemed to be a clear consensus that, while
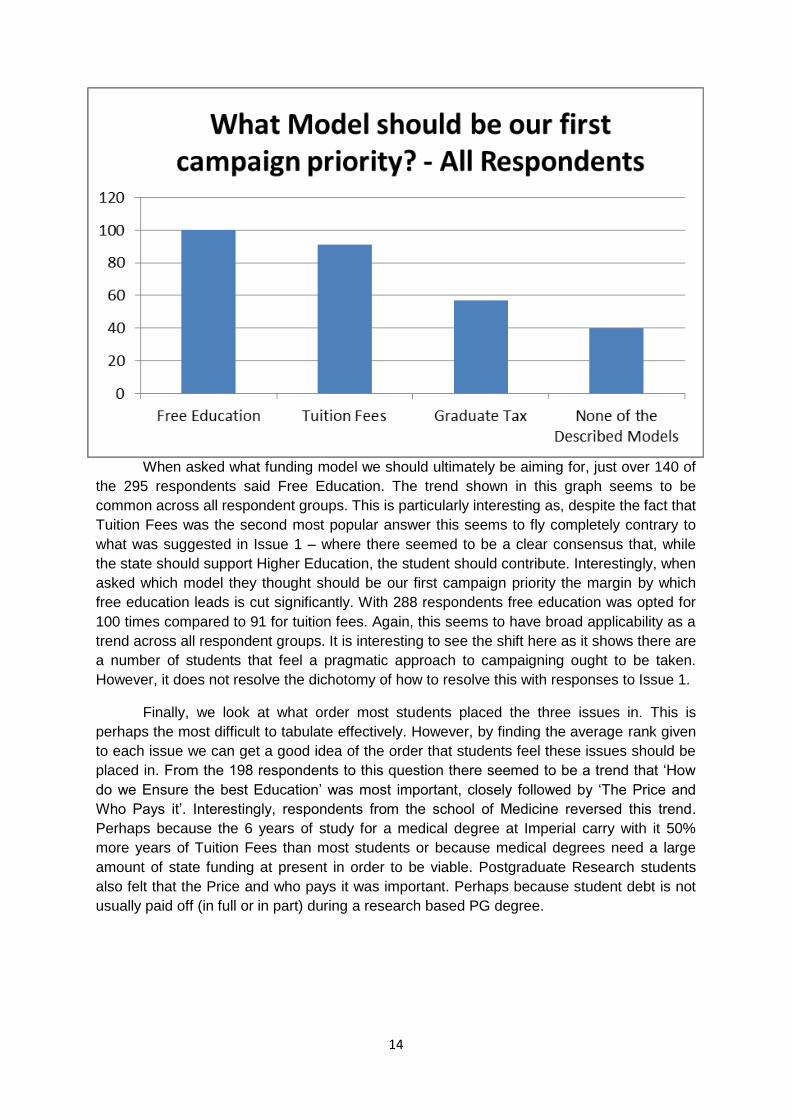
the state should support Higher Education, the student should contribute. Interestingly, when
asked which model they thought should be our first campaign priority the margin by which
free education leads is cut significantly. With 288 respondents free education was opted for
100 times compared to 91 for tuition fees. Again, this seems to have broad applicability as a
trend across all respondent groups. It is interesting to see the shift here as it shows there are
a number of students that feel a pragmatic approach to campaigning ought to be taken.
However, it does not resolve the dichotomy of how to resolve this with responses to Issue 1.
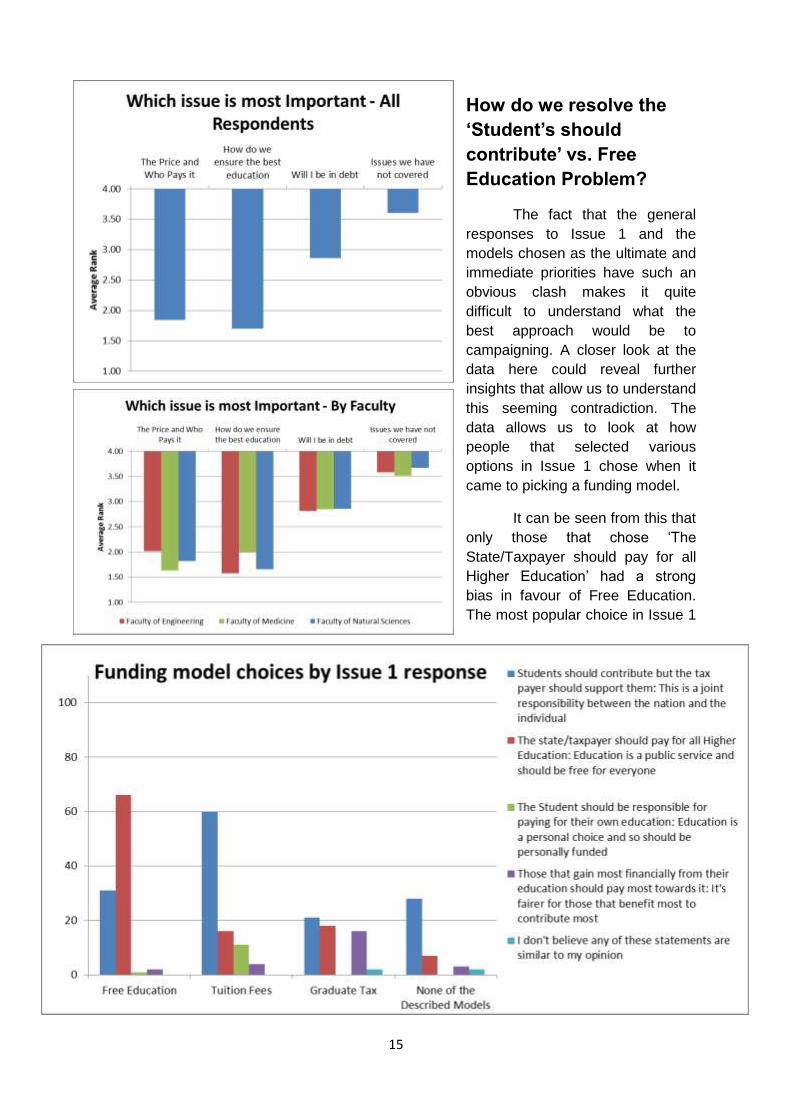
Finally, we look at what order most students placed the three issues in. This is
perhaps the most difficult to tabulate effectively. However, by finding the average rank given
to each issue we can get a good idea of the order that students feel these issues should be
placed in. From the 198 respondents to this question there seemed to be a trend that ‘How
do we Ensure the best Education’ was most important, closely followed by ‘The Price and
Who Pays it’. Interestingly, respondents from the school of Medicine reversed this trend.
Perhaps because the 6 years of study for a medical degree at Imperial carry with it 50%
more years of Tuition Fees than most students or because medical degrees need a large
amount of state funding at present in order to be viable. Postgraduate Research students
also felt that the Price and who pays it was important. Perhaps because student debt is not
usually paid off (in full or in part) during a research based PG degree.
15
How do we resolve the
‘Student’s should
contribute’ vs. Free
Education Problem?
The fact that the general
responses to Issue 1 and the
models chosen as the ultimate and
immediate priorities have such an
obvious clash makes it quite
difficult to understand what the
best approach would be to
campaigning. A closer look at the
data here could reveal further
insights that allow us to understand
this seeming contradiction. The
data allows us to look at how
people that selected various
options in Issue 1 chose when it
came to picking a funding model.
It can be seen from this that
only those that chose ‘The
State/Taxpayer should pay for all
Higher Education’ had a strong
bias in favour of Free Education.
The most popular choice in Issue 1
16
was a joint responsibility between the state and the student for the cost of higher education.
This group voted strongly in favour of Tuition fees, though their response was less polar than
those that chose ‘State/Taxpayer funded education’. This trend is roughly duplicated in those
that said that the student should be responsible for the cost of their education and no
obvious trend was present in the other two groups.
This leads me to believe that there is not a clear enough majority to campaign purely
for free education. Especially since this is such a polar group. However, our priorities clearly
ought to take some account of this strongly polar – based on the free text comments most of
these are responses are based on principal rather than the personal benefit that could be
caused by getting free education. We should note, however, that in any survey such as this
there will be a bias towards those that feel particularly strongly about the issue in the
responses as such we should still consider all of our data with a critical eye to what may be
influencing it.
What should our stance be?
The survey data has been very interesting and has, it is our belief, broadly fulfilled the
objective of gaining in depth information about the views of students. In our stance we
should however be careful to try to accommodate the views of under-represented student
groups at the same time as finding a stance that represents a consensus viewpoint moving
forwards. Perhaps the best place to start this is with the issue that students broadly thought
was the most important.
Any proposed funding model should identify how that model will help to ensure
Higher Education Institutions offer the best education to students. There is broad agreement
from our student population that the further Universities move towards a private sector model
the less Student focused education will become and as such we should oppose any steps
for government to reduce state funding and force universities to rely on generating revenue.
In particular, the level of uncertainty around the solution to this problem; and several free-
text comments suggesting no one knows the best funding model for this means we should
support any attempt to research or gain data on how Education can be improved or hindered
by using a particular funding scheme.
The second most important issue to students was the price of higher education and
who pays it. The only student groups that seemed to feel £9000 was an appropriate price for
students to pay for higher education were those that already pay much higher than this and
while the majority of students felt that it was appropriate for the student to contribute
something towards higher education it is clear that an increased amount of state support for
higher education is widely supported by respondents. As such, one of our highest priorities
should be reduction of the Tuition Fee as it is strongly felt that the free market model
experiment with higher education has failed.
Within this bracket it should be noted that several at risk groups of students raised
serious concerns over the high price of postgraduate courses and overseas fees. There also
appears to be a financial concern held by students of Medicine who have 6 years rather than
3 or 4 of potential Tuition Liability to contend with. Based on this, we should contain within
our policy a section to support regulation of these fees. This should come with a commitment
from government to support Universities that train skilled academics to help universities
17
move away from a reliance on unregulated fees to compensate for loss making
undergraduate subjects. This is particularly true in STEM subjects.
These goals mean that our broad campaign strategy need not be to tightly tie our
colours to the mast of any particular model. We can instead respond to any and all models
or ideas that are proposed with our broad principles in mind. However, it seems that there is
definitely little support for a Graduate Tax and while there is a strong push by proponents of
Free Education the majority of students seem to believe some Student contribution is
appropriate. As such we are suggesting support of significantly reduced tuition fees; to be in
line with the majority of student opinion. This has the added advantage that it is not at cross
purposes to those who did want free education, as it is clearly closer to this than the current
system and therefore makes for a good compromise lobbying position which should be
closely aligned with the goals of most students.
i
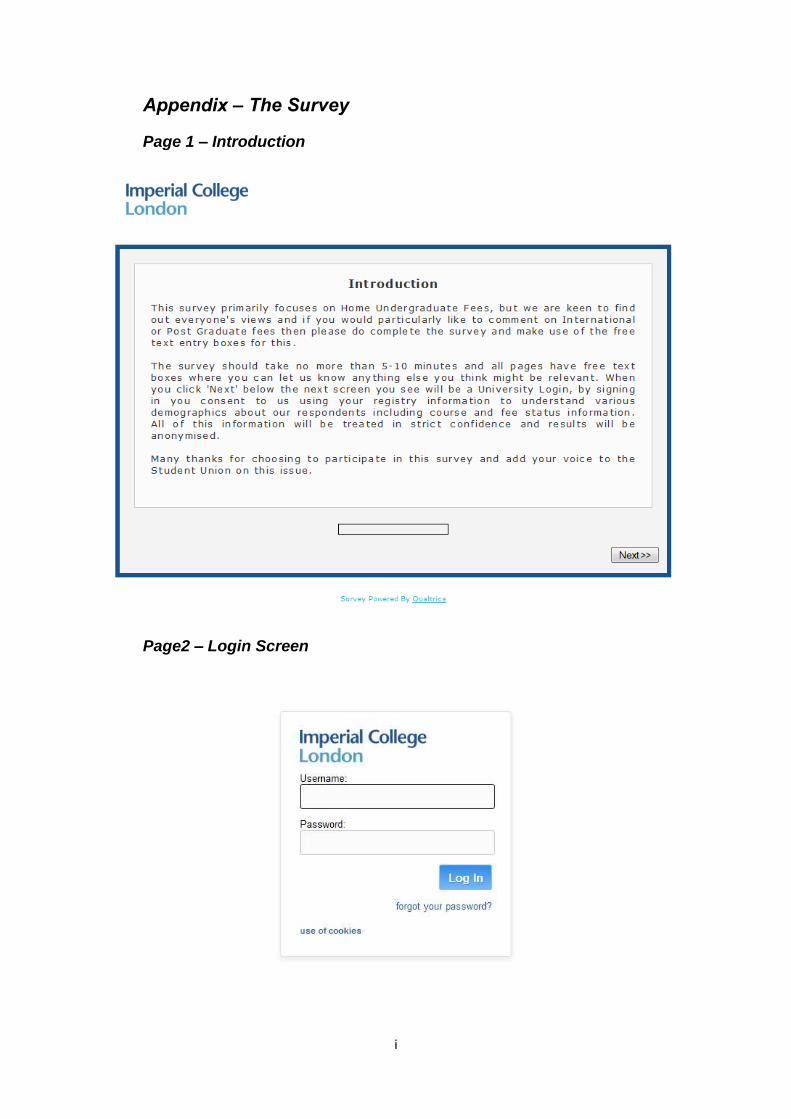
Appendix – The Survey
Page 1 – Introduction
Page2 – Login Screen
ii
Page3 – Issue 1
iii
Page4 – Issue 2
iv
Page 5 – Issue 3
v
Page 6 – Summary Questions
vi
Page 7 – Finished