Higher Education Cost and Financial Aid: Unraveling the Pieces Larry Warder Acting Chief Operating...
25
Higher Education Cost and Financial Aid: Unraveling the Pieces Larry Warder Acting Chief Operating Officer Federal Student Aid
-
Upload
dominique-keeler -
Category
Documents
-
view
218 -
download
0
Transcript of Higher Education Cost and Financial Aid: Unraveling the Pieces Larry Warder Acting Chief Operating...

Higher Education Cost and Financial Aid:
Unraveling the Pieces
Larry WarderActing Chief Operating Officer
Federal Student Aid

2
Lagging performance internationally
• The United States ranks 18th among OECD nations in college graduation rates, a drop from 12th
• The U.S. ranks 1st among OECD nations in college dropout rates
• The U.S. ranks 21st among OECD nations in high school graduations rates
• While the U.S. leads the world in the percentage of its population aged 55 to 64 with college degrees, we drop to 10th among those aged 25 to 34
• The U.S. ranks first among OECD nations in total expenditure on higher education as a percentage of GDP

3% of students that benefit from public aid
Tu
itio
n a
nd
fees
Source: OECD, Education at a Glance 2007
Australia
Austria
Belgium (Fr.)
DenmarkFinlandFrance
Iceland
Italy
Japan
Netherlands
Spain
Turkey
United States
Poland0
1500
3000
4500
6000
0 25 50 75 100
Sweden & Norway
Czech Republic

4
Rising Higher ED Costs in Every SectorCost of attendance in constant (2005) dollars
$27,317
$21,170
$12,108
$6,492
$0
$5,000
$10,000
$15,000
$20,000
$25,000
$30,000
1992 1994 1996 1998 2000 2002 2004
Public 2-Yr
Public 4-Yr
Private 2-Yr
Private 4-Yr

5
Growth of Cost Outpaces Family IncomePercent increase (constant dollars)
53.28% Priv. 2-Yr
48.33% Pub. 4-Yr
33.61% Priv. 4-Yr
24.96% Pub. 2-Yr
9.04% Med Inc.
-10%
0%
10%
20%
30%
40%
50%
60%
1991 1993 1995 1997 1999 2001 2003 2005

6
Triple the Investment, but Enrollment and Attainment are Virtually Flat
Constant 2005 dollars
$0
$20
$40
$60
$80
$100
$120
$140
$160
92-93 94-95 96-97 98-99 00-01 02-03 04-05
% pop age 20-21 Enrolled in College
% of pop age 25-34 with B.A. or Higher
25%
20%
30%
35%
40%
45%
50%
55%
60%
Federal Grants
Federal Loans
Non-Federal Aid

7
1992-93
2005-06
$0
$10
$20
$30
$40
$50
$60
$70
$80$bn
Everyone is Doing More… Estimated student aid by source for 1992-93
and 2005-06 in current dollars (in billions)

8
…Burden is Shifting Percentage of student aid by source for 1992-93
and 2005-06 in current dollars (in billions)
1992-1993
20%
10%
16%
41%
5%
7%7%
51%
9%
6%
2005-2006
19%
5%
4%
Education Tax BenefitsPrivate & Employer Grants
Institutional GrantsState GrantsOther Federal Programs
Federal LoansPell Grants

9
Buying Power of Pell VariesLeast power in states with fastest growing youth population
In t
housa
nds
Source: Award Year 2005-06 Pell Grant Sample File. Unmet need is average cost of attendance, as defined in statute and reported by institutions, minus the average Pell Grant.
$0
$5
$10
$15
$20
$25
$30
Puer
to R
ico
Miss
issip
pi
Arkan
sas
Oklah
oma
North
Dak
ota
Alaba
ma
Kans
as
North
Car
olin
aId
aho
Wes
t Virg
inia
Hawaii
Texa
s
Loui
sianaUta
h
Wyo
min
g
Nebra
ska
Mon
tana
New M
exico
Sout
h Dak
ota
Michi
gan
Delaw
areMaine
Nevad
a
Was
hing
ton
Wisc
onsin
Orego
n
Tenn
esse
e
Sout
h Car
olin
aOhi
o
Califo
rnia
Kent
ucky
Miss
ouri
Virgin
ia
Illin
ois
Flor
ida
Mar
ylan
d
Verm
ont
Alask
a
Indi
ana
New Je
rsey
Color
ado
New Y
ork
Min
neso
ta
Georg
iaIo
wa
Penn
sylvan
ia
Conne
cticut
Rhode
Island
Mas
sach
uset
ts
New H
amp
Arizon
a
Distric
t of C
olum
bia
Average Pell Grant Average Cost of Education
10
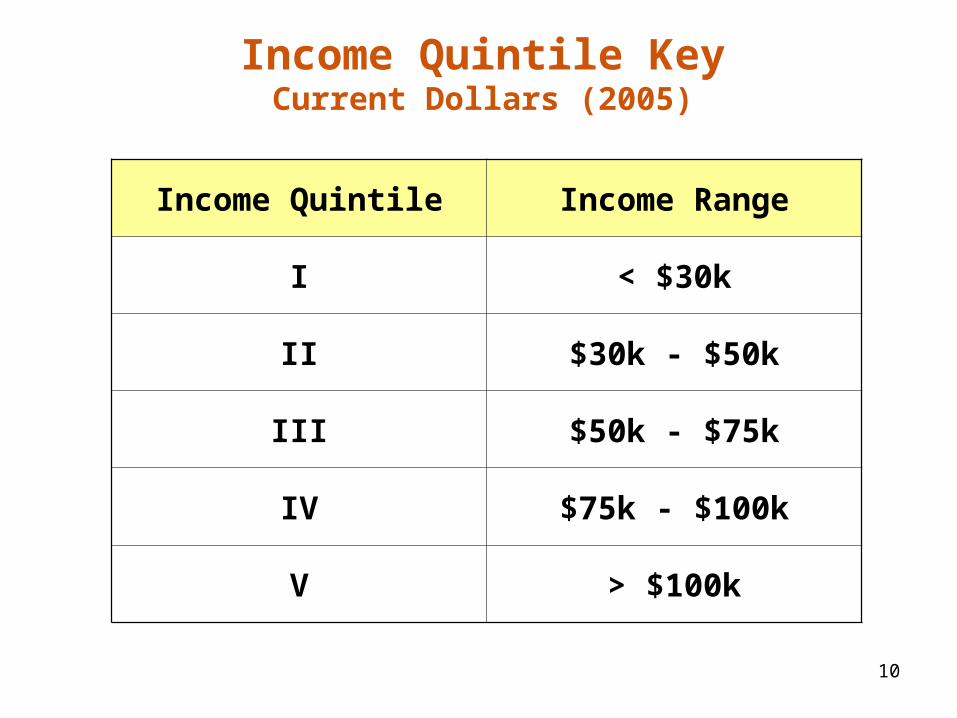
Income Quintile KeyCurrent Dollars (2005)
Income Quintile Income Range
I < $30k
II $30k - $50k
III $50k - $75k
IV $75k - $100k
V > $100k

11
0%
2%
4%
6%
8%
10%
12%
14%
16%
18%
I II III IV V I II III IV V16.3%1%
Full-Time, Full-Year Dependent Undergraduates at Public 4-Year Institutions
Full Aid Covers Cost of Attendance for Increasing Number of Students
Income Quintiles 1993 Income Quintiles 2004

12
0%
2%
4%
6%
8%
10%
12%
14%
16%
18%
I II III IV V I II III IV V
Aid Plus EFC Does Not Cover Tuition for Increasing Number of Students
Full-Time, Full-Year Dependent Undergraduates at Public 4-Year Institutions
16.3%1%
Income Quintiles 1993 Income Quintiles 2004

13
Aid Available from Multiple Programs…
Pell Grants
Other Fed Grants
Work Study
Non-Fed Need-Based Aid
Non-Fed Non-Need-Based Aid
Fed Student Loans
Federal Parent Loans (PLUS)
Non-Fed LoansTax Benefits
Aid
Am
ou
nts
per
Stu
den
t
$0
$1,000
$2,000
$3,000
$4,000
$5,000
$6,000
$7,000
$8,000
$9,000
$10,000
I II III IV V
Income Quintiles 2004

14
Unmet Need, an Undue Burden on Low and Moderate-Income Families
Additional Family Contribution
EFC
Full-Time, Full-Year Dependent Undergraduates at Public 4-Year Institutions
$0
$2,000
$4,000
$6,000
$8,000
$10,000
$12,000
I II III IV V
Income Quintiles 2004
CO
A m
inu
s A
id p
er
Stu
den
t

15
Among Traditional Students at 4-Year Public Schools, About 40% Need a Quarter to a Third of Income to Complement AID Package
$0
$2,000
$4,000
$6,000
$8,000
$10,000
$12,000
$14,000
$16,000
$18,000
I II III IV V I II III IV V
Annual Cost
36%
22%
17%
13%
10%
33%
18%
14%15
%
10%
Unmet need as % of family income
Income Quintiles 1993 Income Quintiles 2004

Under Secretary’s Listening Tours
Real stories from students

17
What is needed
• Access to student financial aid needs to be simplified
• Student financial aid needs fewer programs better targeting recipients
• Student financial aid should facilitate attainment of a postsecondary credential

18
The Department of Education’s Focus Areas:
• Refocus the Federal investment toward simplified access and increased attainment
• Enable more student access to a rigorous and aligned curriculum
• Help more adults attain their first postsecondary credential
• Engage families and students before high school to prepare for postsecondary education
• Increase transparency and information available to students and families

19
• Almost half of 17-year-olds are not proficient enough in math for factory floor jobs
• Two-thirds of college-bound high school graduates are not ready for college-level math and one-third for college-level English
• Only 4% of low-income high school students complete a rigorous college preparatory curriculum
Enable more student access to a rigorous and aligned curriculum

20
Help more adults attain their first postsecondary credential
• Greater numbers of adults are looking for ways to upgrade or expand their skills
• Nearly 40% of today's postsecondary students are self-supporting adults age 24 and up, almost half attend part-time, more than 1/3 work full-time and 27% have children
• 44% of Americans don’t believe they have the education they need for the jobs they want
• 32 states do not have enough young adults in the pipeline to replace college-educated, retiring Baby Boomers
• There are 32 million adults who started, but did not complete, a college education

21
Engage families and students before high school to prepare for and participate in postsecondary education
• Research shows that most students have some post-high school educational or job plans by the ninth grade
• Nearly 2 million low and moderate-income students a year do not apply for federal financial aid
• Financial obstacles will prevent over 400,000 college-qualified students from attending a four-year college and nearly 170,000 will attend no college at all
• By age 24, 75% of students from the top-income bracket have earned a degree, while less than 9% of low-income students have earned one

22
What has to happen outside the Federal government?
• Aligning high school, college, and work expectations
• Serving adults and other nontraditional students
• Increasing need-based aid
• Improving affordability, reducing costs, and increasing productivity
• Supporting and emphasizing student learning outcomes

23
• Access– Redesign services to improve pathways to and
within postsecondary education for all students
• Affordability– Increase need-based aid– Develop strategies that reduce overall
institutional cost
TO DO: Institutional Leadership

24
• Accountability– Create ownership at the institutional
level for designing measures of student learning and achievement that are linked to mission and publicly communicate the results
TO DO: Institutional Leadership

25
• We've spent a year ensuring "buy-in" for the problem
• We've identified the areas that can have the greatest impacts
• We know what has to be done – by the Federal government and others
• We're turning the spotlight towards solutions
• And we're holding ourselves and the others who must act accountable
Conclusion