Higher Ed Budgets for the Post-COVID Era
50
Higher Ed Budgets for the Post-COVID Era Now’s Our Chance to Do This Right NOVEMBER 2020
Transcript of Higher Ed Budgets for the Post-COVID Era

Higher Ed Budgets for the Post-COVID Era
Now’s Our Chance to Do This Right
NOVEMBER 2020
1 Higher Ed Budgets for the Post-COVID Era: Now’s Our Chance to Do This Right
Not only would another round of higher education cuts hamper our economic resiliency, it would also increase inequality. Since COVID-19 hit, millions of Americans have lost their jobs, with low-income, Black, Hispanic, and Native Americans hardest hit. The enormous toll the virus has taken on communities of color—coupled with the protests following the deaths of George Floyd, Ahmaud Arbery, and Breonna Taylor—have forced a new reckoning with our nation’s history of racial injustice. Higher education is beginning to grapple with its own legacy on race, part of which involves less funding for institutions serving Black students. “Across-the-board” cuts would continue that policy.
Despite this history, a movement in higher education to improve completion rates and eliminate disparities in student outcomes by race and income has made progress over the past decade.3 Lumina Foundation and the Bill & Melinda Gates Foundation have been fortunate during this time to work with a wide range of stakeholders—including policymakers committed to ambitious attainment goals, institutional leaders reorienting their schools around student needs, and faculty experimenting with advanced teaching methods. Together, we have built a body of evidence about efforts that increase completion and promote equitable student outcomes, including new approaches to developmental education, advising, and course planning for digital learning. Cuts to successful initiatives such as these will only make things worse.
Recognizing the urgency of the moment, we have solicited advice from leading experts in higher education policy and finance and developed a framework to help a wide range of state leaders face the crisis. Reductions in state support to postsecondary education may be unavoidable, and they will cause harm. However, by rejecting the customary “across-the-board” approach and prioritizing what works, states can implement longer-term solutions that create equitable, accessible, affordable paths to postsecondary credentials that provide upward economic mobility for the most vulnerable populations.
The COVID-19 pandemic has disrupted the global and U.S. economy more
profoundly than any other event since World War II. Just as the subprime
mortgage crisis ushered in an 18-month economic decline and an ensuing
state budget crisis, the current economic slide threatens to leave us in an
even larger fiscal hole. The Great Recession also taught the nation several
lessons about higher education. Generally, the more education you have,
the more likely you are to remain employed during economic hardship.
States with higher educational attainment also see greater economic
growth.1,2 Conversely, disproportionate cuts to higher education undermine
statewide attainment goals. States will often pursue “across-the-board”
cuts to institutions in what may appear to be a “fair” way to distribute
losses, but this can cause significant harm.
Executive Summary

2 Higher Ed Budgets for the Post-COVID Era: Now’s Our Chance to Do This Right
First-order funding priorities
Reject proportional, across-the-board cuts or investments by protecting and prioritizing those institutions that effectively serve larger numbers of individuals affected by COVID-19 and populations that are historically underserved, namely low-income students and students of color.
•
•
•
•
•
•
Commit to meeting the demand for need-based financial aid and reallocate funding from elsewhere, if needed, to meet the demand.
Allocate dollars to institutions in ways that provide adequate support for low-income students, students of color, and adult students (particularly unemployed adults who need to retrain), and require postsecondary providers to efficiently support students so they can complete credentials aligned to in-demand careers in a post-COVID-19 economy.
Consider this a “rainy day” and tap into resources that can help meet shortfalls. Direct these resources to programs and supports that help the most vulnerable populations affected by COVID-19. This may include protecting postsecondary funding from the typical disproportionate recession-driven cuts in the short term while laying the foundation for longer-term financing reform.
Facilitate collaboration among institutions, particularly to address new challenges created by COVID-19, so institutions can dedicate more of their resources to serving students.
Make new resources, such as new federal money, count by using these principles to allocate any additional investments into postsecondary education.
What follows is a detailed framework to help policymakers make strategic budget decisions. This framework includes an assessment of states’ economic and policy contexts and applies the following principles:
• Principle 1: Prioritize funding for institutions that can best serve Black, Hispanic, Native American, and low-income students and those institutions that provide timely opportunities for unemployed or underemployed individuals to reskill.
• Principle 2: Protect and expand need-based financial aid through increased or reallocated investment.
• Principle 3: Support programs and strategies that advance students’ ability to complete credentials.
• Principle 4: Expand resources and invest differently to drive economic growth.
• Principle 5: Evaluate and improve system and institutional cost structures.
Each of the principles is described in more detail below and is accompanied by a recommended framework for how states can examine current practices against these principles and make strategic decisions over the long run. Wherever possible, we provide specific examples of what states have already done to make progress in a particular area. Recognizing the immediate challenges policymakers are navigating within their states, we highlight here a set of essential “first order” priorities that can guide funding decisions (outlined below).
3 Higher Ed Budgets for the Post-COVID Era: Now’s Our Chance to Do This Right
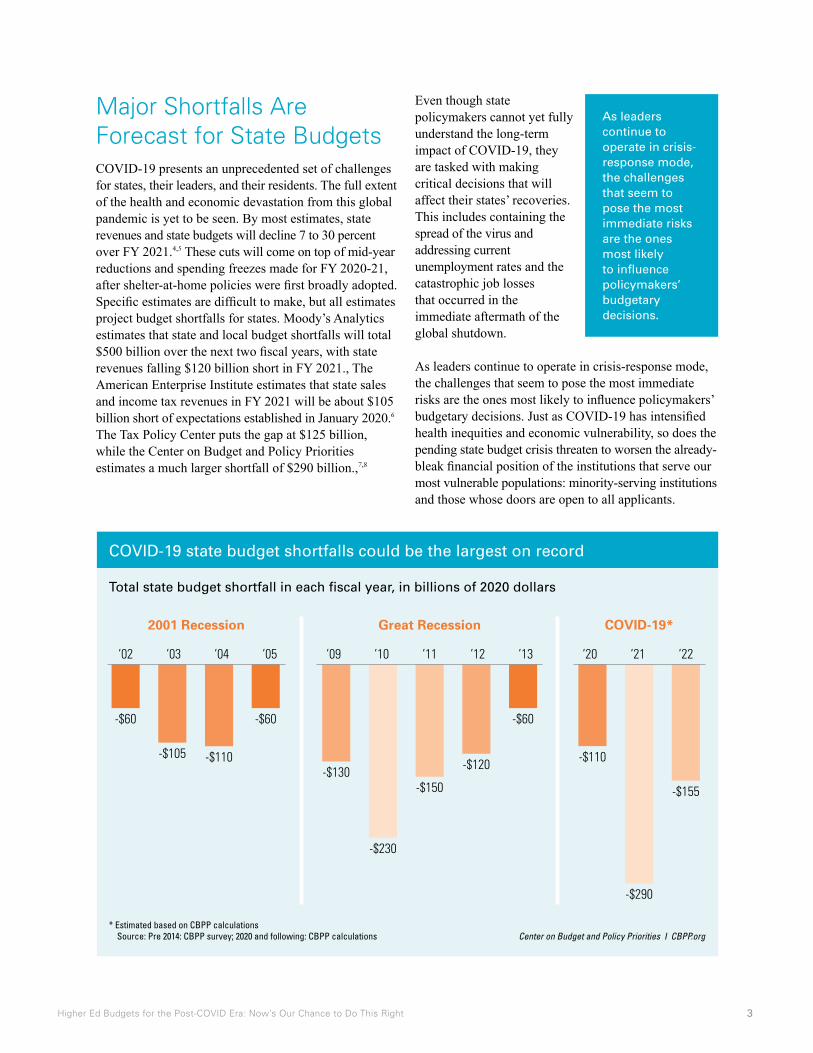
Major Shortfalls Are Forecast for State BudgetsCOVID-19 presents an unprecedented set of challenges for states, their leaders, and their residents. The full extent of the health and economic devastation from this global pandemic is yet to be seen. By most estimates, state revenues and state budgets will decline 7 to 30 percent over FY 2021.4,5 These cuts will come on top of mid-year reductions and spending freezes made for FY 2020-21, after shelter-at-home policies were first broadly adopted. Specific estimates are difficult to make, but all estimates project budget shortfalls for states. Moody’s Analytics estimates that state and local budget shortfalls will total $500 billion over the next two fiscal years, with state revenues falling $120 billion short in FY 2021., The American Enterprise Institute estimates that state sales and income tax revenues in FY 2021 will be about $105 billion short of expectations established in January 2020.6 The Tax Policy Center puts the gap at $125 billion, while the Center on Budget and Policy Priorities estimates a much larger shortfall of $290 billion.,7,8
Even though state policymakers cannot yet fully understand the long-term impact of COVID-19, they are tasked with making critical decisions that will affect their states’ recoveries. This includes containing the spread of the virus and addressing current unemployment rates and the catastrophic job losses that occurred in the immediate aftermath of the global shutdown.
As leaders continue to operate in crisis-response mode, the challenges that seem to pose the most immediate risks are the ones most likely to influence policymakers’ budgetary decisions. Just as COVID-19 has intensified health inequities and economic vulnerability, so does the pending state budget crisis threaten to worsen the already- bleak financial position of the institutions that serve our most vulnerable populations: minority-serving institutions and those whose doors are open to all applicants.
COVID-19 state budget shortfalls could be the largest on record
Total state budget shortfall in each fiscal year, in billions of 2020 dollars
* Estimated based on CBPP calculations Source: Pre 2014: CBPP survey; 2020 and following: CBPP calculations Center on Budget and Policy Priorities I CBPP.org
2001 Recession COVID-19*Great Recession
‘09 ‘10 ‘11 ‘12 ‘13‘02
-$60
-$105 -$110
-$60
-$130
-$230
-$150
-$120
-$60
-$110
-$290
-$155
‘03 ‘04 ‘05 ‘20 ‘21 ‘22
As leaders continue to operate in crisis-response mode, the challenges that seem to pose the most immediate risks are the ones most likely to influence policymakers’ budgetary decisions.

4 Higher Ed Budgets for the Post-COVID Era: Now’s Our Chance to Do This Right
COVID-19 Widens Gaps in Access and OpportunityAs the pandemic closed K-12 schools, colleges and universities, lack of access to broadband, digital curriculum, and inadequate advising and instructional resources hampered the transition to online and remote learning for the most vulnerable learners. In the immediate aftermath of the pandemic, students expressed serious concerns about their ability to remain enrolled as the crisis undermined colleges’ ability to address their needs.9
A national survey of undergraduate students found that internet connectivity issues were serious enough to interfere with many students’ ability to participate in courses, with rather stark differences across race, ethnicity, and income groups.10 This disruption was not
limited to connectivity and access to the “classroom.” Many students’ plans for summer jobs or internships were canceled, and in some cases the need to care for or financially support themselves or family members forced them to forgo career-aligned summer opportunities.11
Even more troubling is that, for many students, access to technology is a secondary issue. For many, meeting basic needs such as physical and mental health, food, and housing was the primary concern. These worries, present before, were heightened by the pandemic— and once again, the impacts were most pernicious for populations of color and low-income populations.12 A survey conducted by Ithaka S+R revealed that nearly twice the share of students of color had concerns for their basic needs compared to white students, with comparable differences found between Pell-eligible students and those who were not Pell eligible.13
Undergraduate enrollment changes, by race/ethnicity
Fall 2020: Percentage change from the previous year
White
Asian
Black
Hispanic
Non-Resident Alien
American Indian/Native American
Other
Public four-year
-6.1%
-3.3%
-4.5%
-1.2%
-12.5%
-6.8%
-3.0%
-5%
White
Asian
Black
Hispanic
Non-Resident Alien
American Indian/Native American
Other
Public two-year
-9.0%
-4.9%
-12.1%
-8.3%
-10.9%
-7.7%
-6.7%
0%10% 5%15%20%
5 Higher Ed Budgets for the Post-COVID Era: Now’s Our Chance to Do This Right
Not only do we know the immediate and inequitable effects of the disruption brought on by COVID-19, but data also illustrate the potential longer-term impacts on these populations and on state economies. A survey conducted by Strada Education Network in June 2020 indicated that half of Hispanic students and 42 percent of Black students changed or canceled their college plans as a result of COVID-19.14
Further, FAFSA renewals for the lowest-income individuals, those making $25,000 or less, were down 5.8 percent as of July 2020.15
Early enrollment data also show that this recession has been atypical. The National Student Clearinghouse’s Summer Enrollment report indicates that lingering health and public safety concerns brought on by COVID-19 are discouraging displaced workers and adults from pursuing educational opportunities. And once again, these data highlight significant implications for equity. While the report found relatively flat reductions in enrollment overall, there are significant differences across student groups and institutions. Specifically, the reductions were most stark among Black, non-resident and Native American populations, with the starkest declines seen at community colleges.16
Without an intentional, targeted, strategic policy response, we risk reversing decades of progress in expanding access and increasing success for low-income students and students of color.
These realities are not limited to people already engaged in the postsecondary education system. The economic fallout of COVID-19 underscores the divide between those participating in the economy and those who are not. And this divide further highlights the disparities across racial and socioeconomic categories. The industries most
affected by the shutdown employ a disproportionate number of workers of color. At the same time, lower levels of postsecondary attainment among low-income individuals and people of color often translate to few employment opportunities beyond these sectors.17
Of course, the challenges posed by COVID-19 don’t exist in a vacuum; they’re occurring along with other challenges states face, in conditions shaped by other powerful forces. A series of events this summer, from social unrest following the slayings of George Floyd and other Black Americans, to natural disasters, to the economic dislocation of large industries, put the challenge into sharp focus. Combined with the global pandemic, pressure has never been greater for lawmakers to take action that builds hope for a better future—for individuals and society.
Rejecting Business-As-Usual State BudgetingBusiness-as-usual state budgeting18 that applies across-the-board cuts for postsecondary education is the worst possible response to this pandemic and fiscal crisis. Typically, there would be a countercyclical increase in enrollments during a recession. However, the pandemic will likely fuel an atypical crisis. The risks of crowded spaces due to COVID-19, uncertainty about whether campuses will remain open, and challenges with remote learning may depress enrollment. And that demands an atypical response from state policymakers.
A wise investment strategy for postsecondary education will direct resources to the individuals who are most vulnerable and to the institutions that enroll them. An effort to stabilize funding for community, technical, and regional colleges and minority-serving institutions—typically the point of entry for the recently unemployed— will protect essential postsecondary paths to meaningful lives and thriving, resilient economies.
From studies conducted in California, we know the long- term effects of business-as-usual funding responses. In response to the Great Recession, California cut funding to the state’s community college system by more than $1.5 billion. Those cuts resulted in a reduction in the number of full-time equivalent instructors, a decline in course offerings and ultimately a double-digit reduction in enrollment.19 While Proposition 30, passed in 2012, helped restore and stabilize some funding for the system, community college enrollment is still down a decade later.
The challenges posed by COVID-19
don’t exist in a vacuum; they’re
occurring along with other
challenges states face, in conditions
shaped by other powerful forces.

6 Higher Ed Budgets for the Post-COVID Era: Now’s Our Chance to Do This Right
The typical starting point for state higher education budgeting presumes that the finance and investment structure now supporting postsecondary education is the right one. Proposed budgets and adopted spending bills demonstrate that historic spending patterns are viewed as protected, and that any revenue shortfall will be made up by students through increased tuition. Under this “normal” process, any new initiatives require additional resources and can only be pursued after the status quo is maintained.
While this may be sustainable in times of economic prosperity, each recession highlights the flaws of this approach. The continued use of postsecondary education as the balancing wheel for shrinking state budgets is clearly counterproductive, particularly in light of the widening gaps in prosperity across population groups. This approach also provides no incentive for institutions to better serve vulnerable groups. By adopting the principles described below, state leaders can prioritize the spending of scarce funds now, thus protecting their institutional assets and maintaining affordable pathways for students in order to realize a long-term economic return.
The Pre-Budgeting Analysis That States Need State budgets are driven by the calendar, and policymakers are often required by law or constitutional directive to avoid deficits—to balance spending with revenue.20 Before the annual or biennial budgeting
process gets underway, state policymakers should recognize the need to reset higher education financing. They should begin with a clear-eyed assessment of economic, workforce, and demographic data, preferably disaggregated by region and necessarily disaggregated by race, ethnicity, income, and age in the workforce.
States should embrace a student-first orientation. While institutions will be the unit of analysis for the purposes of financing, if the state puts students and their timely completion of high-quality credentials at the center, a better, more creative way to organize and fund institutions of higher education may emerge.
This analysis sets the context for where the good jobs will be and helps identify the populations that need to be better served.
National Context Data (See Appendix for more detail)• Unemployment rate, disaggregated by race and ethnicity. • Postsecondary access data (enrollment, disaggregated by race and ethnicity).• Attainment rates, disaggregated by race and ethnicity.• Short- and long-term COVID-19 impacts on employment, by industry.
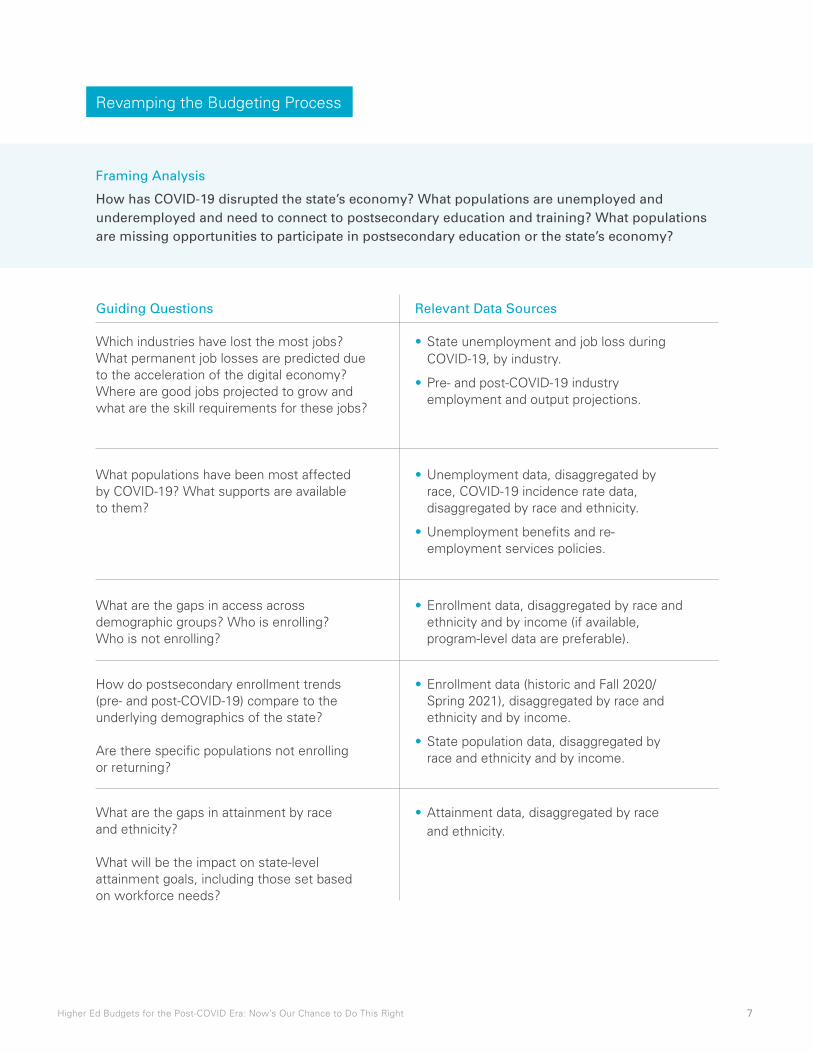
The figure on the following page offers a guide to key context-setting questions and data elements that can help staff in legislative and executive budget offices revamp the state postsecondary budgeting process.
7 Higher Ed Budgets for the Post-COVID Era: Now’s Our Chance to Do This Right
How has COVID-19 disrupted the state’s economy? What populations are unemployed and underemployed and need to connect to postsecondary education and training? What populations are missing opportunities to participate in postsecondary education or the state’s economy?
Framing Analysis
Which industries have lost the most jobs? What permanent job losses are predicted due to the acceleration of the digital economy? Where are good jobs projected to grow and what are the skill requirements for these jobs?
What populations have been most affected by COVID-19? What supports are available to them?
What are the gaps in access across demographic groups? Who is enrolling? Who is not enrolling?
How do postsecondary enrollment trends (pre- and post-COVID-19) compare to the underlying demographics of the state?
Are there specific populations not enrolling or returning?
What are the gaps in attainment by race and ethnicity?
What will be the impact on state-level attainment goals, including those set based on workforce needs?
• State unemployment and job loss during COVID-19, by industry.
• Pre- and post-COVID-19 industry employment and output projections.
• Unemployment data, disaggregated by race, COVID-19 incidence rate data, disaggregated by race and ethnicity.
• Unemployment benefits and re- employment services policies.
• Enrollment data, disaggregated by race and ethnicity and by income (if available, program-level data are preferable).
• Enrollment data (historic and Fall 2020/ Spring 2021), disaggregated by race and ethnicity and by income.
• State population data, disaggregated by race and ethnicity and by income.
• Attainment data, disaggregated by race and ethnicity.
Guiding Questions Relevant Data Sources
Revamping the Budgeting Process
8 Higher Ed Budgets for the Post-COVID Era: Now’s Our Chance to Do This Right
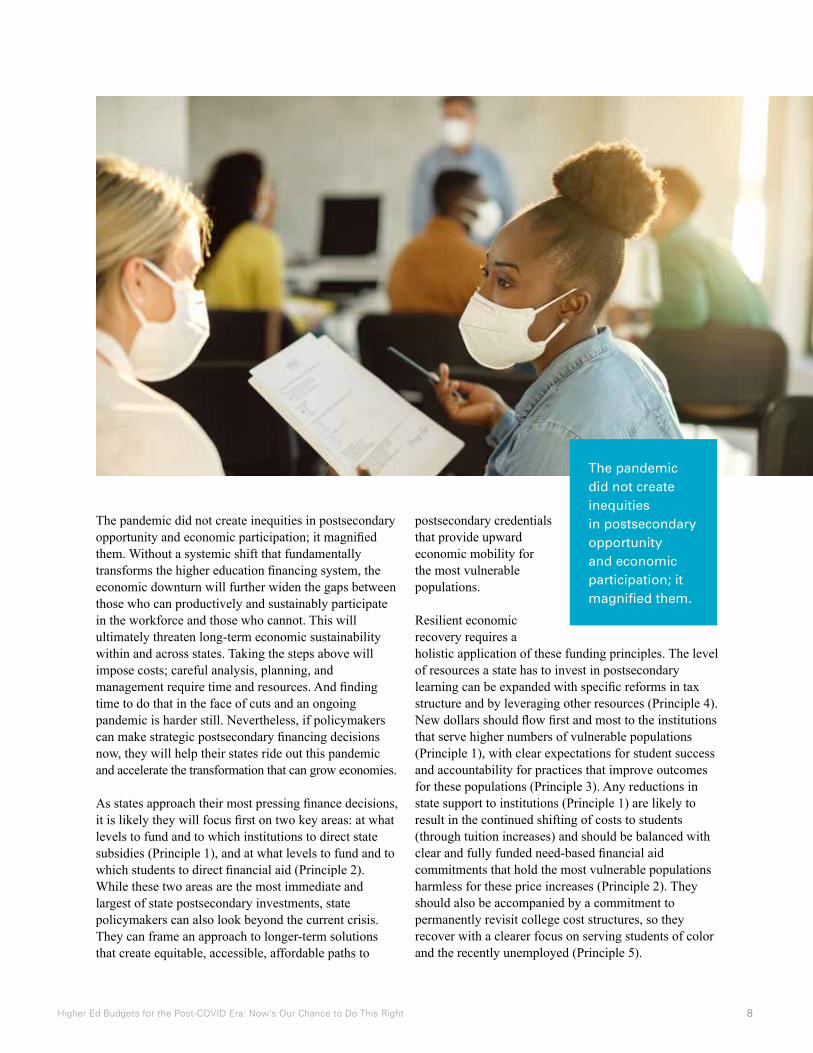
The pandemic did not create inequities in postsecondary opportunity and economic participation; it magnified them. Without a systemic shift that fundamentally transforms the higher education financing system, the economic downturn will further widen the gaps between those who can productively and sustainably participate in the workforce and those who cannot. This will ultimately threaten long-term economic sustainability within and across states. Taking the steps above will impose costs; careful analysis, planning, and management require time and resources. And finding time to do that in the face of cuts and an ongoing pandemic is harder still. Nevertheless, if policymakers can make strategic postsecondary financing decisions now, they will help their states ride out this pandemic and accelerate the transformation that can grow economies.
As states approach their most pressing finance decisions, it is likely they will focus first on two key areas: at what levels to fund and to which institutions to direct state subsidies (Principle 1), and at what levels to fund and to which students to direct financial aid (Principle 2). While these two areas are the most immediate and largest of state postsecondary investments, state policymakers can also look beyond the current crisis. They can frame an approach to longer-term solutions that create equitable, accessible, affordable paths to
postsecondary credentials that provide upward economic mobility for the most vulnerable populations.
Resilient economic recovery requires a holistic application of these funding principles. The level of resources a state has to invest in postsecondary learning can be expanded with specific reforms in tax structure and by leveraging other resources (Principle 4). New dollars should flow first and most to the institutions that serve higher numbers of vulnerable populations (Principle 1), with clear expectations for student success and accountability for practices that improve outcomes for these populations (Principle 3). Any reductions in state support to institutions (Principle 1) are likely to result in the continued shifting of costs to students (through tuition increases) and should be balanced with clear and fully funded need-based financial aid commitments that hold the most vulnerable populations harmless for these price increases (Principle 2). They should also be accompanied by a commitment to permanently revisit college cost structures, so they recover with a clearer focus on serving students of color and the recently unemployed (Principle 5).
The pandemic did not create inequities in postsecondary opportunity and economic participation; it magnified them.
9 Higher Ed Budgets for the Post-COVID Era: Now’s Our Chance to Do This Right
State budgets are driven by the calendar, and state budgets should prioritize public funding for institutions that can best serve low-income, Black, Latino, and indigenous students who, prior to COVID-19, did not equitably participate in education beyond high school and who have been most affected by the pandemic. States should also prioritize education and training that is essential for supporting unemployed and underemployed individuals and restarting economic growth.
As institutions grapple with the immediate impacts of the pandemic—with declining enrollments among the most critical and vulnerable populations, and at the institutions that often serve as their entry points to education and training—states should assess how to ensure these institutions remain viable in the short term and student-ready in the long term.
This analysis sets the context for where the good jobs will be and helps identify the populations that need to be better served.
National Context Data (See Appendix for more detail)• Disaggregated enrollment data by institution type.• Disaggregated completion rates.• Revenues per FTE (state and tuition) by Carnegie Classification and percent of enrolled undergraduates (broken out by percent Black, Hispanic, and Native American Undergraduates Enrolled).• Aggregate Federal CARES Act dollars (FTE versus headcount).
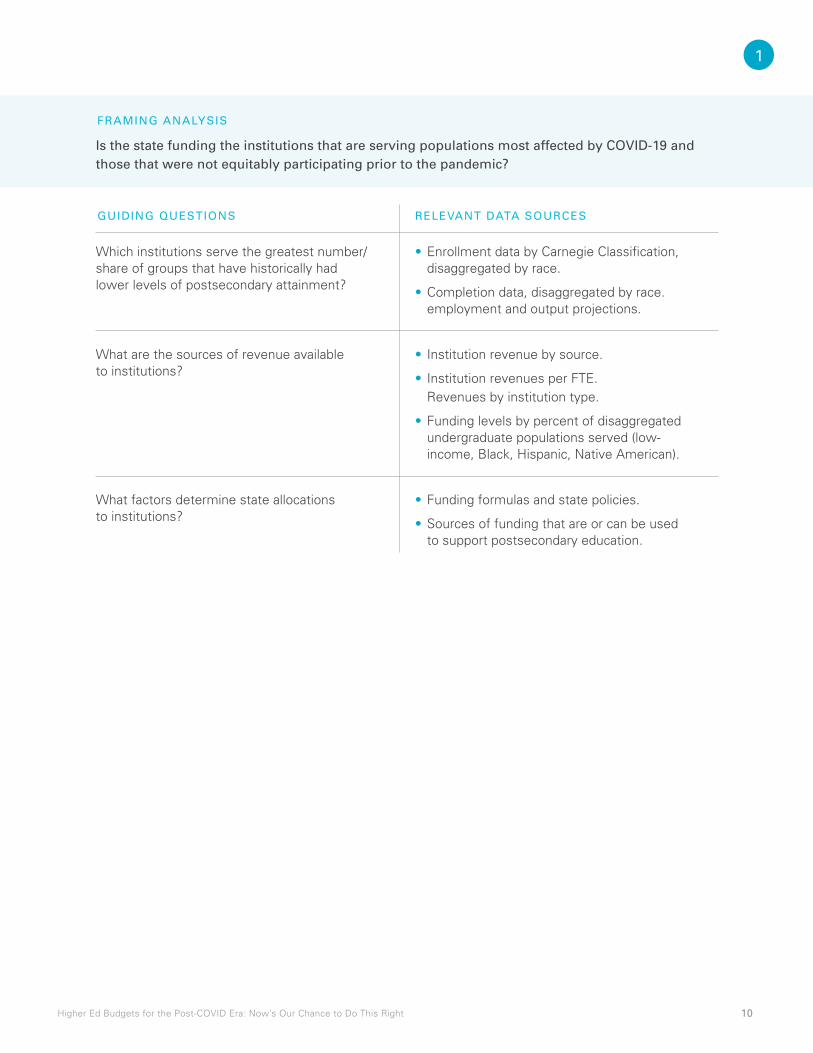
The figure on the following page offers a guide to key context-setting questions and data elements that can help staff in legislative and executive budget offices prioritize funding for institutions that serve populations most affected by COVID-19.
Principle 1:Prioritize funding for institutions serving populations most affected by COVID-19
1
10 Higher Ed Budgets for the Post-COVID Era: Now’s Our Chance to Do This Right
Is the state funding the institutions that are serving populations most affected by COVID-19 and those that were not equitably participating prior to the pandemic?
Which institutions serve the greatest number/share of groups that have historically had lower levels of postsecondary attainment?
What are the sources of revenue available to institutions?
What factors determine state allocations to institutions?
• Enrollment data by Carnegie Classification, disaggregated by race.
• Completion data, disaggregated by race. employment and output projections.
• Institution revenue by source.
• Institution revenues per FTE. Revenues by institution type.
• Funding levels by percent of disaggregated undergraduate populations served (low- income, Black, Hispanic, Native American).
• Funding formulas and state policies.
• Sources of funding that are or can be used to support postsecondary education.
FRAMING ANALYSIS
GUIDING QUESTIONS RELEVANT DATA SOURCES
1
11 Higher Ed Budgets for the Post-COVID Era: Now’s Our Chance to Do This Right
Recommendations for Postsecondary Education Funding Decisions
FISCAL IMPACT
FISCAL IMPACT
ECONOMIC RECOVERY OPPORTUNITY
ECONOMIC RECOVERY OPPORTUNITY
WHO BENEFITS
WHO BENEFITS
TECHNICAL NOTES AND EXAMPLES
RECOMMENDATION
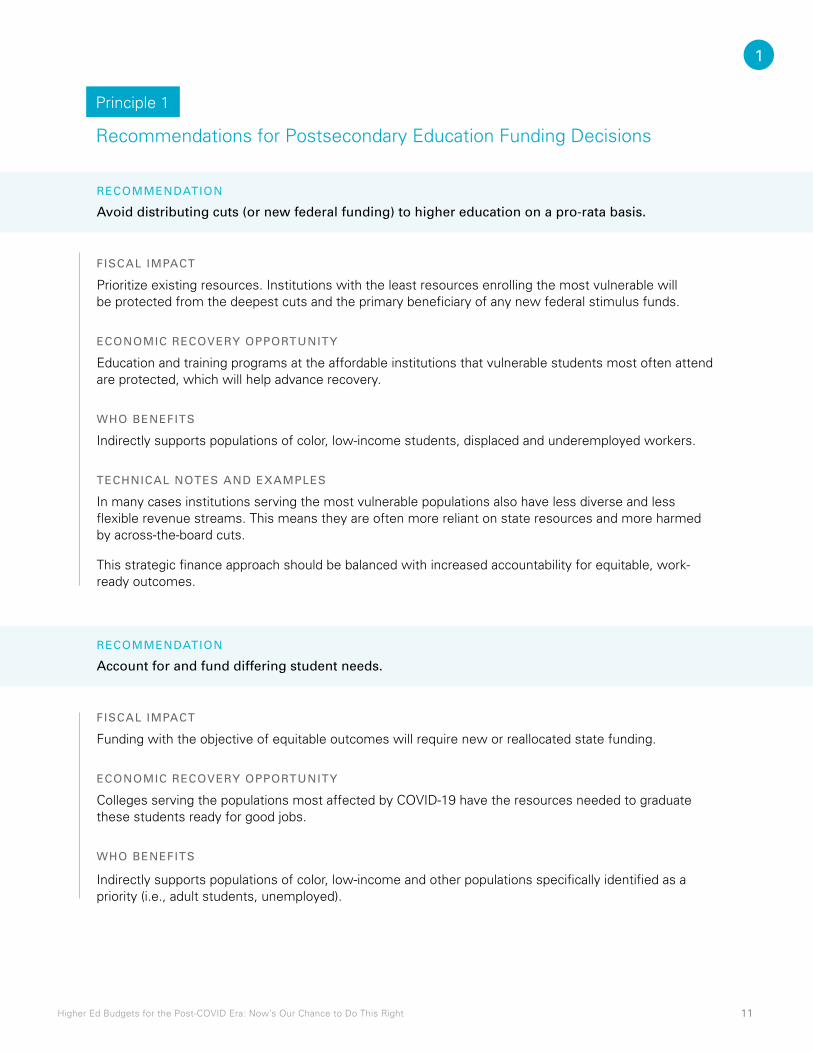
Avoid distributing cuts (or new federal funding) to higher education on a pro-rata basis.
RECOMMENDATION
Account for and fund differing student needs.
Prioritize existing resources. Institutions with the least resources enrolling the most vulnerable will be protected from the deepest cuts and the primary beneficiary of any new federal stimulus funds.
Funding with the objective of equitable outcomes will require new or reallocated state funding.
Education and training programs at the affordable institutions that vulnerable students most often attend are protected, which will help advance recovery.
Colleges serving the populations most affected by COVID-19 have the resources needed to graduate these students ready for good jobs.
Indirectly supports populations of color, low-income and other populations specifically identified as a priority (i.e., adult students, unemployed).
Indirectly supports populations of color, low-income students, displaced and underemployed workers.
In many cases institutions serving the most vulnerable populations also have less diverse and less flexible revenue streams. This means they are often more reliant on state resources and more harmed by across-the-board cuts.
This strategic finance approach should be balanced with increased accountability for equitable, work- ready outcomes.
Principle 1
1
12 Higher Ed Budgets for the Post-COVID Era: Now’s Our Chance to Do This Right
TECHNICAL NOTES AND EXAMPLES
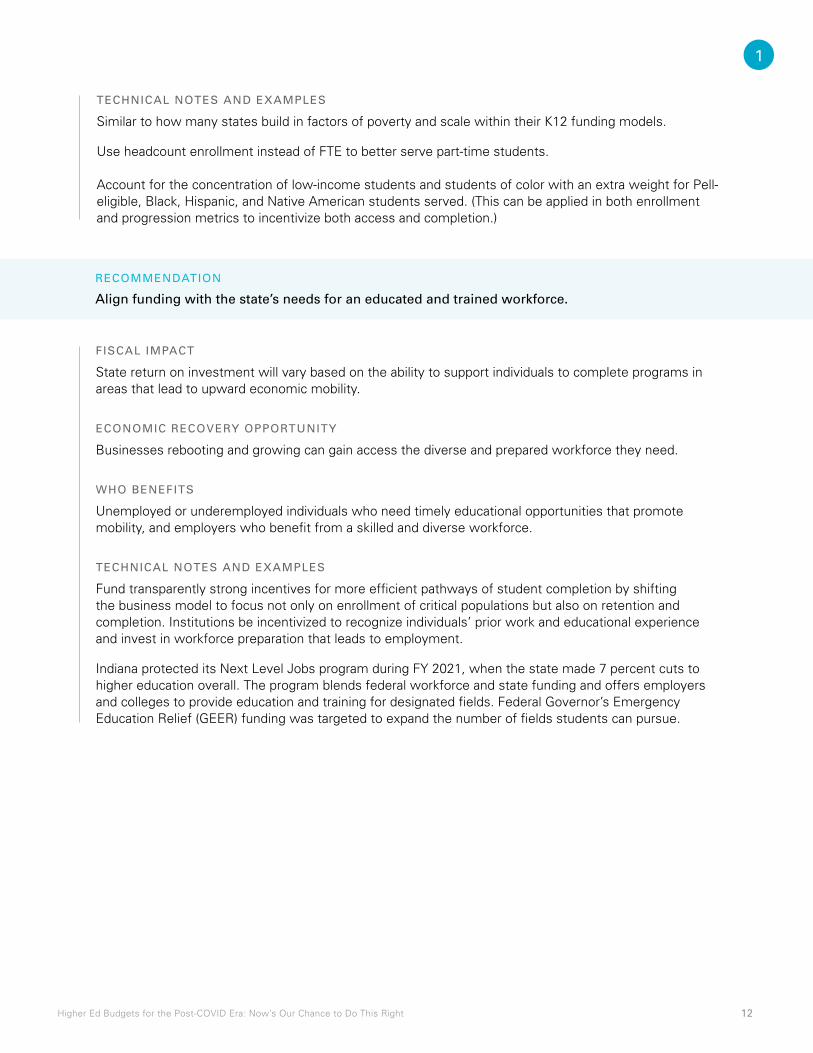
Similar to how many states build in factors of poverty and scale within their K12 funding models.
Use headcount enrollment instead of FTE to better serve part-time students. Account for the concentration of low-income students and students of color with an extra weight for Pell-eligible, Black, Hispanic, and Native American students served. (This can be applied in both enrollment and progression metrics to incentivize both access and completion.)
RECOMMENDATION
Align funding with the state’s needs for an educated and trained workforce.
FISCAL IMPACT
ECONOMIC RECOVERY OPPORTUNITY
WHO BENEFITS
TECHNICAL NOTES AND EXAMPLES
State return on investment will vary based on the ability to support individuals to complete programs in areas that lead to upward economic mobility.
Businesses rebooting and growing can gain access the diverse and prepared workforce they need.
Unemployed or underemployed individuals who need timely educational opportunities that promote mobility, and employers who benefit from a skilled and diverse workforce.
Fund transparently strong incentives for more efficient pathways of student completion by shifting the business model to focus not only on enrollment of critical populations but also on retention and completion. Institutions be incentivized to recognize individuals’ prior work and educational experience and invest in workforce preparation that leads to employment.
Indiana protected its Next Level Jobs program during FY 2021, when the state made 7 percent cuts to higher education overall. The program blends federal workforce and state funding and offers employers and colleges to provide education and training for designated fields. Federal Governor’s Emergency Education Relief (GEER) funding was targeted to expand the number of fields students can pursue.
1
13 Higher Ed Budgets for the Post-COVID Era: Now’s Our Chance to Do This Right
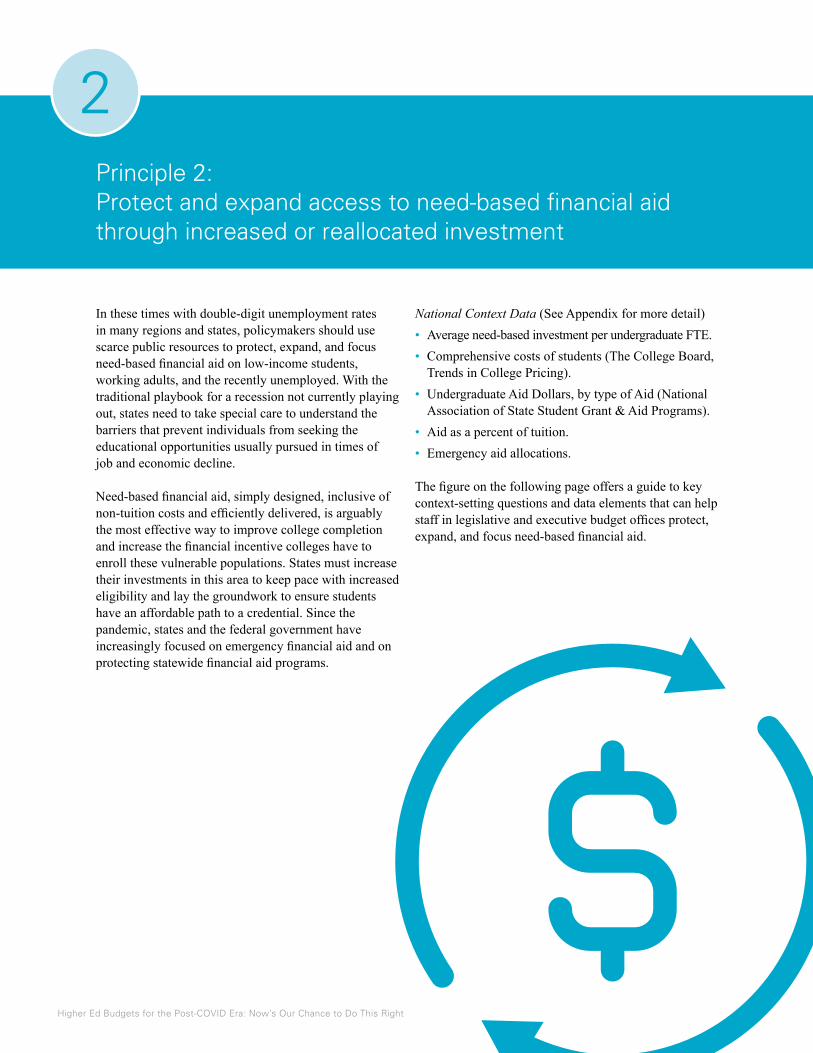
In these times with double-digit unemployment rates in many regions and states, policymakers should use scarce public resources to protect, expand, and focus need-based financial aid on low-income students, working adults, and the recently unemployed. With the traditional playbook for a recession not currently playing out, states need to take special care to understand the barriers that prevent individuals from seeking the educational opportunities usually pursued in times of job and economic decline.
Need-based financial aid, simply designed, inclusive of non-tuition costs and efficiently delivered, is arguably the most effective way to improve college completion and increase the financial incentive colleges have to enroll these vulnerable populations. States must increase their investments in this area to keep pace with increased eligibility and lay the groundwork to ensure students have an affordable path to a credential. Since the pandemic, states and the federal government have increasingly focused on emergency financial aid and on protecting statewide financial aid programs.
National Context Data (See Appendix for more detail)• Average need-based investment per undergraduate FTE.• Comprehensive costs of students (The College Board, Trends in College Pricing).• Undergraduate Aid Dollars, by type of Aid (National Association of State Student Grant & Aid Programs).• Aid as a percent of tuition.• Emergency aid allocations.
The figure on the following page offers a guide to key context-setting questions and data elements that can help staff in legislative and executive budget offices protect, expand, and focus need-based financial aid.
Principle 2:Protect and expand access to need-based financial aid through increased or reallocated investment
2
14 Higher Ed Budgets for the Post-COVID Era: Now’s Our Chance to Do This Right
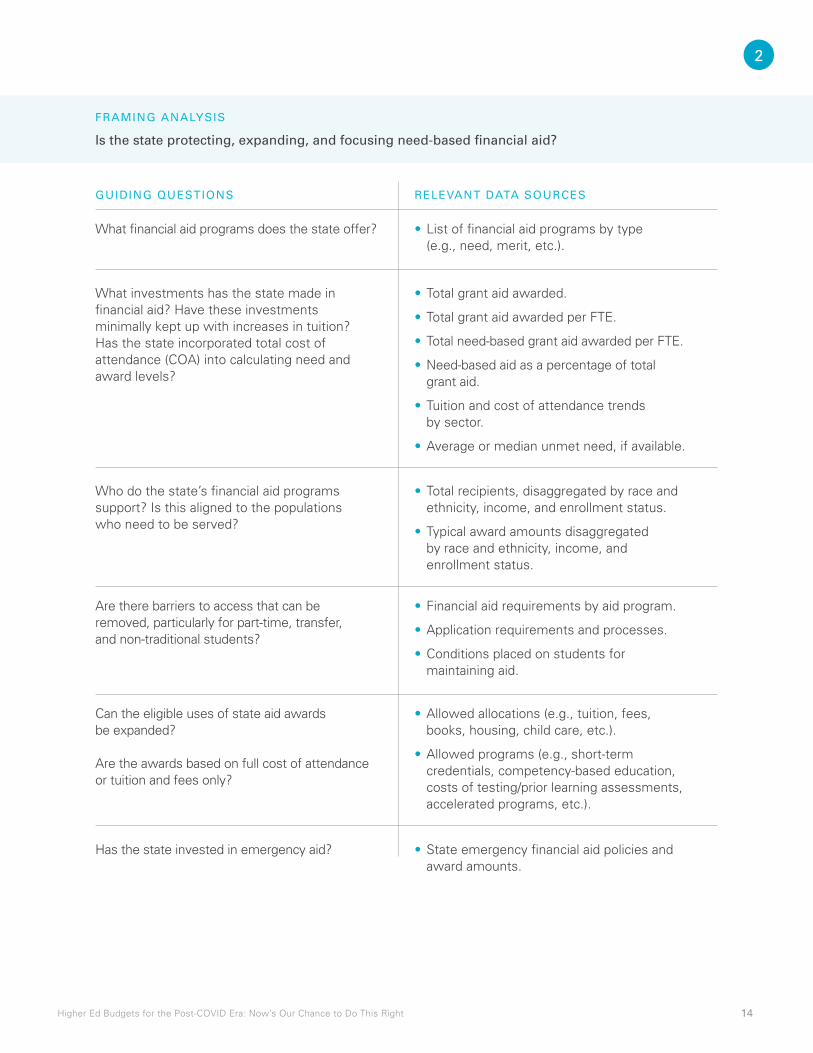
Are there barriers to access that can be removed, particularly for part-time, transfer, and non-traditional students?
Can the eligible uses of state aid awards be expanded?
Are the awards based on full cost of attendance or tuition and fees only?
Has the state invested in emergency aid?
• Financial aid requirements by aid program.
• Application requirements and processes.
• Conditions placed on students for maintaining aid.
• Allowed allocations (e.g., tuition, fees, books, housing, child care, etc.).
• Allowed programs (e.g., short-term credentials, competency-based education, costs of testing/prior learning assessments, accelerated programs, etc.).
• State emergency financial aid policies and award amounts.
Is the state protecting, expanding, and focusing need-based financial aid?
What financial aid programs does the state offer?
What investments has the state made in financial aid? Have these investments minimally kept up with increases in tuition? Has the state incorporated total cost of attendance (COA) into calculating need and award levels?
Who do the state’s financial aid programs support? Is this aligned to the populations who need to be served?
• List of financial aid programs by type (e.g., need, merit, etc.).
• Total grant aid awarded.
• Total grant aid awarded per FTE.
• Total need-based grant aid awarded per FTE.
• Need-based aid as a percentage of total grant aid.
• Tuition and cost of attendance trends by sector.
• Average or median unmet need, if available.
• Total recipients, disaggregated by race and ethnicity, income, and enrollment status.
• Typical award amounts disaggregated by race and ethnicity, income, and enrollment status.
FRAMING ANALYSIS
GUIDING QUESTIONS RELEVANT DATA SOURCES
2

15 Higher Ed Budgets for the Post-COVID Era: Now’s Our Chance to Do This Right
Recommendations for State Postsecondary Education Funding Decisions
FISCAL IMPACT
ECONOMIC RECOVERY OPPORTUNITY
WHO BENEFITS
TECHNICAL NOTES AND EXAMPLES
RECOMMENDATION
At a minimum, hold harmless support to state need-based financial aid programs.
Prioritization of existing resources, new revenue or willingness to reallocate state funding from other programs.
Maintain purchasing power of increased investment by working with institutions on price moderation and cost restructuring.
Students able to continue to attend school, graduate, and promote economic growth, particularly if states meet the increased demand for those on waiting lists and those newly eligible due to the economic impacts of COVID-19.
Directly supports low-income students and the recently unemployed who need to enroll for upskilling and reskilling.
Rigorous research has found a 3-5 percent increase in the odds of completion for every $1,000 reduction in unmet financial need. Several states, including California and Tennessee, have prioritized need-based financial aid programs in initial FY 2021 budgets. Texas and Virginia prioritized need-based financial aid through the allocation of CARES Act and GEER dollars.
Principle 2
RECOMMENDATION
Discontinue the allocation of state dollars for non-need-based financial aid programs and the spreading of funding across multiple complex and small programs.
FISCAL IMPACT
ECONOMIC RECOVERY OPPORTUNITY
Increases available resources for public investment of scarce funds that will deliver the highest return on investment for taxpayers.
Facilitates increased investment in the most cost-effective state programs without the need to increase taxes.
2
16 Higher Ed Budgets for the Post-COVID Era: Now’s Our Chance to Do This Right
WHO BENEFITS
TECHNICAL NOTES AND EXAMPLES
Potential to directly support more eligible low-income students if dollars are consolidated and reallocated to need-based programs.
At a minimum, states should coordinate review of existing financial aid policies to ensure current aid is meeting low-income students and build in means-testing to any existing merit-based program to ensure those populations are prioritized.
FISCAL IMPACT
ECONOMIC RECOVERY OPPORTUNITY
WHO BENEFITS
TECHNICAL NOTES AND EXAMPLES
RECOMMENDATION
Ensure adult populations have access to financial aid.
Better target financial aid awards without increasing public investment.
Immediate productive engagement of the current and dislocated workforce into training that aligns with growing good jobs.
Directly supports adult students by ensuring they have access to need-based programs.
Adults often face barriers in their pursuit of postsecondary education that other students do not.
States can ensure that need-based aid programs do not have eligibility requirements that restrict adult students’ access to need-based aid.
Statewide programs such as Tennessee Reconnect that promise adults a clear, affordable path have proven effective because they provide opportunity to communicate directly to these students.
RECOMMENDATION
Expand the eligible uses of state financial aid and ensure students can use awards for those purposes by supplanting awards from other sources of funding.
FISCAL IMPACT
Increases the state’s ability to bridge the unmet need gap with existing resources.
Better leverages federal financial aid resources.
2
17 Higher Ed Budgets for the Post-COVID Era: Now’s Our Chance to Do This Right
ECONOMIC RECOVERY OPPORTUNITY
WHO BENEFITS
TECHNICAL NOTES AND EXAMPLES
Looking at the full cost of attendance for students with low or zero expected family contribution can decrease the number of awards but increase the return on investment.
Directly supports low-income students and other populations hard hit by COVID-19.
For students attending a public two-year college, tuition and fees represent only 20 percent of their student budget, which also includes housing expenses, books and supplies, transportation, and other personal expenses. For students at four-year institutions, tuition and fees represent 39 percent of the total college budget.
FISCAL IMPACT
ECONOMIC RECOVERY OPPORTUNITY
WHO BENEFITS
TECHNICAL NOTES AND EXAMPLES
RECOMMENDATION
Leverage (and fill in gaps of) federal relief to address emergency financial needs.
Likely requires new investments as few states currently have a funded emergency aid program or part-nership with colleges that host these programs.
This is a low-cost, high-impact strategy.
Supports retention and completion by providing aid for student emergencies; addresses affordability.
Low-income students who are close to a credential or those for whom an unexpected financial emergency could forestall continued enrollment.
In the survey conducted by Education Trust and Global Strategy Group, 82 percent of respondents indicated that emergency financial aid would help them stay in school, yet just 37 percent indicated that their college or university offers this type of support.
Build on the CARES Act program by continuing access to emergency aid beyond the time-limited federal funding by targeting limited state resources and understanding return on investment through increased graduation rates.
Various studies of emergency aid indicate emergency financial relief can help students remain in college. Emergency aid funding and design vary considerably. An issue brief developed by MDRC highlights lessons from prior evaluations and best practices for the design and administration of these resources.
States such as Minnesota, North Carolina, and Wisconsin have state-funded programs that are administered by institutions or across the system.
2

18 Higher Ed Budgets for the Post-COVID Era: Now’s Our Chance to Do This Right
During the last decade, faculty, college leaders, systems, and states have focused on what it takes for students to complete the credentials they start—and to do so in a timely way and thus enter or re-enter the workforce quickly. This often leads to a “win-win” for taxpayers, who benefit from lower per-student expenses and more rapid economic growth. The decade of investment in improved teaching methods, aligned and holistic supports, clearer degree pathways, and improved use of data now risks being dismantled by deep, double-digit cuts in state funding, spread proportionally across institutions.
However, states can reset state budgeting for higher education in the midst of this pandemic by investing in effective, evidence-backed practices; dropping what isn’t working; and supporting institutions that are already serving students well.
National Context Data (See Appendix for more detail)• Average time to degree.• Student debt.• Unemployment.• Students with some college/no degree.• Transfer data.
The figure on the following page offers a guide to key context-setting questions and data elements that can help staff in legislative and executive budget offices support efforts that advance students’ ability to complete programs and earn credentials.
Principle 3:Preserve and strengthen programs and strategies that advance students’ ability to complete credentials
3

19 Higher Ed Budgets for the Post-COVID Era: Now’s Our Chance to Do This Right
Is the state supporting programs and strategies that advance students’ ability to complete credentials?
What investments in student success has the state made? What investments to support student success should be strengthened or created?
Are there student support service investments specifically targeted toward, and proven successful with, critical populations (adult learners, student parents, populations of color, first-generation) that face specific barriers to success?
Does the state have a student success funding model? How does it prioritize underrepresented groups?
How are state investments in postsecondary education supporting the completion of workforce-aligned credentials?
How is the state ensuring these programs are equitably available, financially accessible and achieving needed and equitable outcomes?
• Investments to support student advising.
• Investments to support student transfer.
• Investments in open educational resources.
• Investments to provide broadband and/or technology access.
• Investments in development of widely available, affordable online courses.
• Investments in equity-centered and fully transferable dual-enrollment paths.
• Independent national, state and/or institutional evaluations of intervention programs and strategies.
• Student success funding policies.
• Percentage of postsecondary budget distributed through the formula.
• Formula components that address equity.
• Industry projections and a list of high- demand fields and jobs.
• Examples of academic programs aligned to those fields.
• Financial aid available and aligned to those fields.
• Disaggregated enrollment and outcomes/ jobs data for programs.
FRAMING ANALYSIS
GUIDING QUESTIONS RELEVANT DATA SOURCES
3
20 Higher Ed Budgets for the Post-COVID Era: Now’s Our Chance to Do This Right
Recommendations for State Postsecondary Education Funding Decisions
OPPORTUNITY FOR ECONOMIC RECOVERY
WHO BENEFITS
TECHNICAL NOTES AND EXAMPLES
TECHNICAL NOTES AND EXAMPLES
Opportunity to better align the “how” of state funding to institutions with the state’s needs for increased credential completion and more qualified citizens getting good jobs.
Indirectly supports populations of color, low-income and other populations specifically identified as a priority (i.e., adult students and the recently unemployed).
Well-designed student success funding models that encourage progression and completion and prioritize these outcomes for underserved populations have been shown to support the scaling of student success strategies at institutions. Oregon’s four-year sector allocation model and Tennessee’s models in both sectors align with this evidence-based design.
These programs often have high up-front costs that pose barriers to initial investment. However, research into CUNY ASAP in New York found improved outcomes across all groups with significant savings of $6,500 per graduate as well as significant financial returns on investment.
Principle 3
RECOMMENDATION
Allocate resources to institutions in ways that protect access while providing incentives for institutions to invest in strategies and reforms that increase student success.
FISCAL IMPACT
Allocates existing resources.
FISCAL IMPACT
ECONOMIC RECOVERY OPPORTUNITY
WHO BENEFITS
RECOMMENDATION
Directly fund accelerated career pathway programs that integrate wraparound services.
Likely requires new or reallocated investments.
Targeted investment in programs with proven completion outcomes.
Directly benefits students enrolled in these programs and employers through a pipeline of qualified candidates.
3

21 Higher Ed Budgets for the Post-COVID Era: Now’s Our Chance to Do This Right
TECHNICAL NOTES AND EXAMPLES
TECHNICAL NOTES AND EXAMPLES
Programs such as Virginia’s FastForward VA provide training for jobs in high-demand fields. The average age of program participants is 36, and in the 2.5 years of implementation, 90 percent of enrolled students have completed their credential courses.
There are various ways states can achieve this necessary outcome.
Reward institutions via the state funding formula for transfer student success.
Require four-year institutions to hold a percentage of seats for transfer students, including private, non-profit colleges eligible for state financial aid. In 2015, as part of an agreement for increased state support, the University of California System committed to ensure that at least a third of its new students enter as transfers and to implement reforms that expedite their completion.
Incentivize or require institutions to establish transfer student guarantees that commit to helping students reach bachelor’s degree completion within a certain time frame and/or costs. Examples include Fayetteville State University’s 10K Degree Pathway in North Carolina, Thomas Edison State University’s 3+1 program with New Jersey Community Colleges and Lorain County Community College’s University Partnership.
FISCAL IMPACT
FISCAL IMPACT
ECONOMIC RECOVERY OPPORTUNITY
ECONOMIC RECOVERY OPPORTUNITY
WHO BENEFITS
WHO BENEFITS
RECOMMENDATION
Expand funding to high-quality, workforce-aligned credential pathways.
RECOMMENDATION
Link state funding with a statewide credit applicability policy.
Scales existing investments and requires new or reallocated funding.
Allocates existing resources.
Targeted investment in specific pathways that lead to jobs with better economic opportunity for individuals.
Opportunity to alter the inefficiencies in the postsecondary transfer system by altering the credit-based incentive for institutions.
Depends on design. Likely most beneficial for the unemployed or underemployed as well as employers in high-demand industries.
All students who interact with multiple institutions.
3
22 Higher Ed Budgets for the Post-COVID Era: Now’s Our Chance to Do This Right
OPPORTUNITY FOR ECONOMIC RECOVERY
WHO BENEFITS
TECHNICAL NOTES AND EXAMPLES
Aligns state efforts to make college more affordable and to maximize efficiencies in delivery.
Does not target a specific population but would lower costs to institutions and taxpayers.
Texas allocated $10 million in federal CARES Act funding to improve the quality of online learning by strengthening distance education course offerings and bolstering institutions’ capabilities to use data to support student success. This will include funds to develop Open Educational Resource course materials that significantly reduce costs to students.
RECOMMENDATION
Use resources to advance cost-effective quality teaching and learning, including open and statewide-shared online learning resources.
FISCAL IMPACT
Requires new investment, but investment can be minimal.
TECHNICAL NOTES AND EXAMPLES
Virginia conducted a digital divide analysis of Virginia students, using Census data from the American Community Survey. This revealed gaps in access to broadband in both rural and urban areas, as well as computer ownership, particularly across racial and ethnic groups.
FISCAL IMPACT
ECONOMIC RECOVERY OPPORTUNITY
WHO BENEFITS
RECOMMENDATION
Use resources to provide access to technology and broadband.
Requires more investment, but investment can be minimal.
Access to broadband and technology are critical to student success and future career opportunities.
Gaps in access are most prevalent among low-income populations and populations of color, in both urban and rural settings.
3

23 Higher Ed Budgets for the Post-COVID Era: Now’s Our Chance to Do This Right
With revenues falling for state and local governments, states must expand the scope of resources they harness and explore innovative and creative financial mechanisms to augment funding specifically for higher education. For example, states can provide debt and other cost relief to institutions, leverage federal relief dollars to direct funding toward priorities, provide relief to students by creating seamless access points for benefits that offset the cost of housing, food, or other needs, and advance public-private partnerships to coordinate and fund employer-based learning. In the immediate term, states should use every available financial flexibility to weather the economic costs of the pandemic. For longer-term sustainability and coordination of resources, Governors can charge (and staff) multiyear task forces that focus on economic recovery and postsecondary responsiveness to state needs. This could include evaluating and building out options for more recession-proof revenue sources (e.g., drawing more revenue from streams that are more economically stable).
Aggregate Contextual Data (See Appendix for more detail)• Public higher education support per $1,000 of personal income (SHEF). • Total taxable per capita income.• State and local own-source general tax revenues, by type (U.S. Census Bureau).• Rainy day fund balances (NASBO, 2019).• Transfer data.
The figure below offers a guide to key context-setting questions and data elements that can help staff in legislative and executive budget offices expand resources and invest more wisely for economic growth.
Principle 4:Strategically leverage all available resources and invest differently for economic growth
4

24 Higher Ed Budgets for the Post-COVID Era: Now’s Our Chance to Do This Right
How can the state expand resources and invest differently for resilient economic growth?
What is the current capacity of the state to invest in higher ed?
How has COVID-19 affected projected future capacity to invest?
What additional opportunities exist to increase state revenues to postsecondary and other priorities?
To what extent does the state invest in higher education? How does state investment differ by sector? By institution type?
How does current funding compare to funding levels prior to the Great Recession?
Are there examples of leveraging and aligning workforce investments or cultivating public-private partnerships?
Is there a broad group of stakeholders to ensure action on, and the integration of, funding and policy recommendations related to postsecondary funding?
• Size of the state economy.
• Tax revenue data.
• Rainy day capacity.
Policies regarding:
• Lottery revenue allocations.
• Public-private partnership opportunities.
• Investments in higher education as a percentage of tax and lottery revenues.
• State investments broken out by institution type.
• State 5-, 10- and 15-year investment trends.
• Examples of public-private partnerships in the state.
• Workforce investments.
• Examples of leadership groups overseeing higher education funding and policy recommendations.
FRAMING ANALYSIS
GUIDING QUESTIONS RELEVANT DATA SOURCES
4
25 Higher Ed Budgets for the Post-COVID Era: Now’s Our Chance to Do This Right
Recommendations for State Postsecondary Education Funding Decisions
OPPORTUNITY FOR ECONOMIC RECOVERY
WHO BENEFITS
TECHNICAL NOTES AND EXAMPLES
Publicly supported colleges and universities can restructure costs permanently and align current and future investments with the equity and skill requirements of a more resilient economy.
Taxpayers, publicly supported colleges and the students enrolled at these institutions.
Virginia has proposed a debt-restructuring option for public colleges and universities that could save them up to $300 million in capital debt over the next two years. This includes deferred payments on state-backed debt and bonds issued through the Virginia Building Authority, backed by revenues from university fees.
The cost to borrow funds is at historic lows. States can expedite changes in bond terms to allow debt to be refinanced.
No waivers should be granted without clear time- and milestone-specific outcomes aligned with the state’s economic and equity imperatives.
These flexibilities are best pursued and accomplished in the public’s interest -- if a statewide economic recovery task force reviews, recommends, and oversees.
Principle 4
RECOMMENDATION
Examine opportunities to extend borrowing authority, waiving loan payments, restructuring and refinancing bond debt, borrowing deeper into rainy day funds and temporarily waiving expensive mandates and cost-sharing requirements.
FISCAL IMPACT
Depending on terms of financing instrument, could be a reduction, increase or net neutral impact on the long-term cost of borrowing.
Depending on the accountability and/or repayment terms of the waived requirements facing institutions, could be a long-term savings to the state.
4

26 Higher Ed Budgets for the Post-COVID Era: Now’s Our Chance to Do This Right
RECOMMENDATION
Evaluate and align non-traditional non-core postsecondary resources and investments that support education and training.
OPPORTUNITY FOR ECONOMIC RECOVERY
OPPORTUNITY FOR ECONOMIC RECOVERY
WHO BENEFITS
WHO BENEFITS
TECHNICAL NOTES AND EXAMPLES
Opportunity for various streams of funding to be aligned and better coordinated to advance state goals for economic recovery and increased educational attainment.
Requires time and coordination across stakeholders and must start with a common understanding of critical state goals and priorities.
Adults seeking affordable, workforce-aligned training and credentials.
Students, taxpayers, policymakers and postsecondary providers all benefit when there is a more strategic and coordinated approach to how resources are leveraged and deployed to achieve state goals.
Before COVID-19, governors in states including Connecticut, Louisiana, Missouri, and Oregon consolidated leadership for economic development, workforce development and higher education into one agency or oversight entity. This consolidation allows agencies and personnel to collaborate and align data and accountability systems, consolidate public reporting into one integrated dashboard, and align siloes of funding from the local, state, and federal levels.
FISCAL IMPACT
FISCAL IMPACT
Leverages existing resources.
Augments institutional revenue during the current crisis and improves financial resilience thereafter.
Consolidating will require some up-front investment of time and resources to realize long-term savings.
Evaluate all available educational providers (including capacity), workforce needs, projected enrollment and resources to build a more resilient, long-term investment strategy and establish a fairer and more transparent funding approach.
RECOMMENDATION
Develop a comprehensive and coordinated view of postsecondary providers and resources.
TECHNICAL NOTES AND EXAMPLES
In 2019, the State Council of Higher Education for Virginia developed a Strategic Finance Plan. This plan is anchored in the state’s attainment goal and provides a detailed analysis of the level and types of investments necessary to achieve more equitable access and outcomes.
4
27 Higher Ed Budgets for the Post-COVID Era: Now’s Our Chance to Do This Right
RECOMMENDATION
Leverage and align state dollars with federal funds to increase affordable access for students and align resources for institutions.
OPPORTUNITY FOR ECONOMIC RECOVERY
WHO BENEFITS
TECHNICAL NOTES AND EXAMPLES
Provides students with increased access to financial supports that do not cost the state or the employer. Requires careful coordination with other state agencies and capacity and resources depending on the federal program.
Low-income students and students who are not part of the traditional pipeline.
To address comprehensive student costs and expand access to existing programs, states could look at ways to leverage federal benefit programs like SNAP E&T, TANF and WIOA funding.
North Carolina’s Finish Line Grant leverages federal WIOA dollars to provide students with financial relief to ensure they can stay enrolled.
The California Student Aid Commission must notify students in their award letters that they may be eligible for Cal-Fresh, California’s implementation of the SNAP program.
In 2018, New Jersey expanded the SNAP E&T program to students in community college career and technical education programs.
Minnesota allows individuals participating in the Minnesota Family Investment Program (MFIP, the state’s implementation of the federal TANF program) to “count” postsecondary enrollment as an approved work activity.
FISCAL IMPACT
Increases revenue to the postsecondary system through additional federal resources. No new state investment needed.
4

28 Higher Ed Budgets for the Post-COVID Era: Now’s Our Chance to Do This Right
RECOMMENDATION
Consider innovative revenue strategies that can be used to pay for postsecondary education or workforce training, now and over the long term.
OPPORTUNITY FOR ECONOMIC RECOVERY
OPPORTUNITY FOR ECONOMIC RECOVERY
WHO BENEFITS
WHO BENEFITS
TECHNICAL NOTES AND EXAMPLES
TECHNICAL NOTES AND EXAMPLES
Investment is a core business strategy. Economic recovery will entail new investment by business, investors, and states.
It assists in supporting regional needs, it can be structured to meet state goals, and it directly engages employers.
Students needing access to courses and programs.
Employers that can rebound more quickly because in-demand programs can quickly serve more students.
Focus is likely on certificate-seeking adults.
In 2018, the Oregon legislature created a tax credit auction to support need-based financial aid. Individuals and businesses with an Oregon income tax liability may bid on certificates and claim the credits on their returns.
California has a special payroll tax to fund training through an organization called the Employment T raining Panel.
The Texas Skills Development Fund finances the design and implementation of customized job-training projects and fosters collaboration among businesses, public community and technical colleges, workforce-development boards and economic development partners.
FISCAL IMPACT
FISCAL IMPACT
Increased revenue. Depending on structure of strategy, indeterminate impact on the underlying business climate for employers.
May require some new state investment.
RECOMMENDATION
Foster public-private partnerships that engage employers as partners in workforce training.
4
29 Higher Ed Budgets for the Post-COVID Era: Now’s Our Chance to Do This Right
Principle 5:Evaluate and improve system and institutional cost structures
In addition to directly supporting and investing in postsecondary education, states must also set expectations for educational providers to collaborate, consolidate, and integrate financing and learning at the community, state, and national levels. It is untenable to advance a “keep the lights on and change nothing” ethic in this transformative economic time.
Just like most other large industries, higher education must embrace data-driven investigation to respond to COVID-19 and the resulting economic crisis. This type of independent assessment can yield new partnerships and new ways of serving taxpayers. Public colleges and universities can work together to coordinate program offerings, centralize certain back-office operations, and consolidate other functions as a way to save and prioritize investments that benefit students. This transformation-minded approach, with value and quality at the center, can minimize costs for institutions and the students they serve.
Aggregate Contextual Data• Cost trends.• Cost drivers (health, pensions).• Efficiency and effectiveness efforts of Maryland and Ohio.
The figure below offers a guide to key context-setting questions and data elements that can help staff in legislative and executive budget offices evaluate and improve system and institutional cost structures.
5
30 Higher Ed Budgets for the Post-COVID Era: Now’s Our Chance to Do This Right
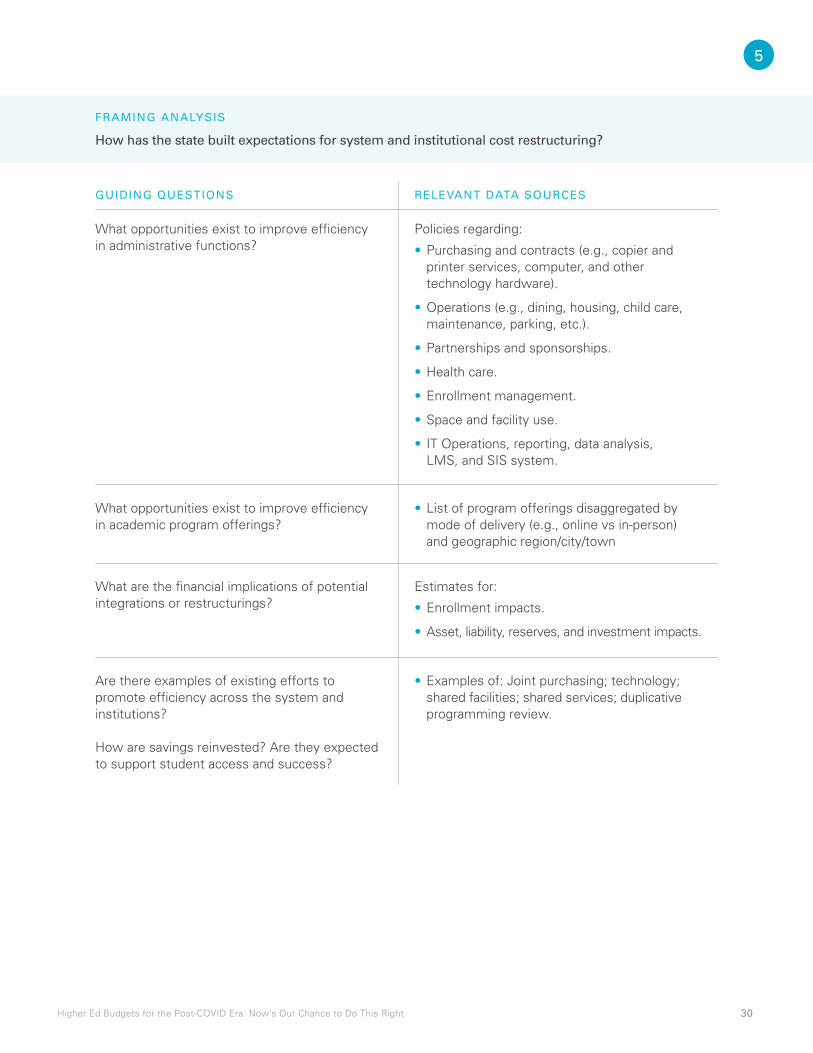
How has the state built expectations for system and institutional cost restructuring?
What opportunities exist to improve efficiency in administrative functions?
What opportunities exist to improve efficiency in academic program offerings?
Are there examples of existing efforts to promote efficiency across the system and institutions?
How are savings reinvested? Are they expected to support student access and success?
What are the financial implications of potential integrations or restructurings?
Policies regarding:
• Purchasing and contracts (e.g., copier and printer services, computer, and other technology hardware).
• Operations (e.g., dining, housing, child care, maintenance, parking, etc.).
• Partnerships and sponsorships.
• Health care.
• Enrollment management.
• Space and facility use.
• IT Operations, reporting, data analysis, LMS, and SIS system.
• List of program offerings disaggregated by mode of delivery (e.g., online vs in-person) and geographic region/city/town
• Examples of: Joint purchasing; technology; shared facilities; shared services; duplicative programming review.
Estimates for:
• Enrollment impacts.
• Asset, liability, reserves, and investment impacts.
FRAMING ANALYSIS
GUIDING QUESTIONS RELEVANT DATA SOURCES
5
31 Higher Ed Budgets for the Post-COVID Era: Now’s Our Chance to Do This Right
Recommendations for State Postsecondary Education Funding Decisions
Principle 5
OPPORTUNITY FOR ECONOMIC RECOVERY
OPPORTUNITY FOR ECONOMIC RECOVERY
WHO BENEFITS
TECHNICAL NOTES AND EXAMPLES
Adaptability is the key for companies and industries seeking to survive the economic crisis. Postsecondary education providers, integral to the talent supply chain in any state, support the coming economic transformation when they also adapt with a culture of continuous improvement and strategic resourcing.
This step allows the state to determine if it is using taxpayer dollars prudently by subsidizing providers and programs where the economy needs it and where people live.
Taxpayers, institutions, employers, communities, and students.
This could include financial exigency declarations that allow wide-scale buyouts for early retirement, initiatives to consolidate certain administrative functions and academic programs across institutions, better use of facilities and technology, and/or restructuring of staffing models to ensure most effective and student-aligned use of talent.
Prior to COVID-19, Maryland and Ohio established initiatives focused on improving efficiencies across postsecondary institutions to increase affordability and reallocate savings to student-focused activities.
This year Pennsylvania (State System of Higher Education) and Texas (Dallas Community District) both announced plans to consolidate campuses.
FISCAL IMPACT
FISCAL IMPACT
Requires some up-front capacity for analysis, planning and management, with the possibility of generating new resources that can be reinvested in student-centered strategies.
More effective use of resources aligned with state needs.
RECOMMENDATION
Foster evaluation and expectations for system and institutional efficiency.
RECOMMENDATION
Reduce redundancy in online and other program delivery.
5
32 Higher Ed Budgets for the Post-COVID Era: Now’s Our Chance to Do This Right
WHO BENEFITS
TECHNICAL NOTES AND EXAMPLES
Taxpayers, through increased efficiencies.
Students, if these efforts create courses and programs that provide affordable, accessible, timely learning.
States and state systems of postsecondary education can offer core and specialized courses centrally, through open instructional resources and credit reciprocity commitments. Partnerships with high-quality online providers, potentially outside the state, can increase access to affordable, high-quality programs in communities where access is limited.
In January 2020, 14 Pennsylvania community college presidents announced a new partnership and articulation agreement with Southern New Hampshire University (SNHU). The agreement allows students to transfer up to 90 credits to SNHU and complete their bachelor’s degrees online with a 10 percent tuition reduction.
RECOMMENDATION
Reallocate resources to invest in new structures, technologies, and approaches that improve student access and outcomes.
OPPORTUNITY FOR ECONOMIC RECOVERY
WHO BENEFITS
TECHNICAL NOTES AND EXAMPLES
New industries are spawned and supported by postsecondary institutions’ innovative research, practices, and collaboration. Strategic state budgeting supports institutional responsiveness to a rapidly changing digital economy.
Taxpayers, students, institutional faculty and staff, and employers who hire students who are better prepared for work and life.
Arizona State University’s Transfer Guide helps students plan their transfer process, including searching course equivalencies, and allows for an automated transcript evaluation process. This automation helps reduce some inefficiencies and human errors associated with manual transcript evaluation.
This institutional efficiency must be tied to an institution’s needs and embedded in the institution’s processes. In the long term, effectively applied and integrated technology and research can improve teaching and learning and reduce the cost per credential.
FISCAL IMPACT
Up-front costs may require a one-time investment, which could include states providing access to zero-interest or forgivable capital.
5
33 Higher Ed Budgets for the Post-COVID Era: Now’s Our Chance to Do This Right
Appendix
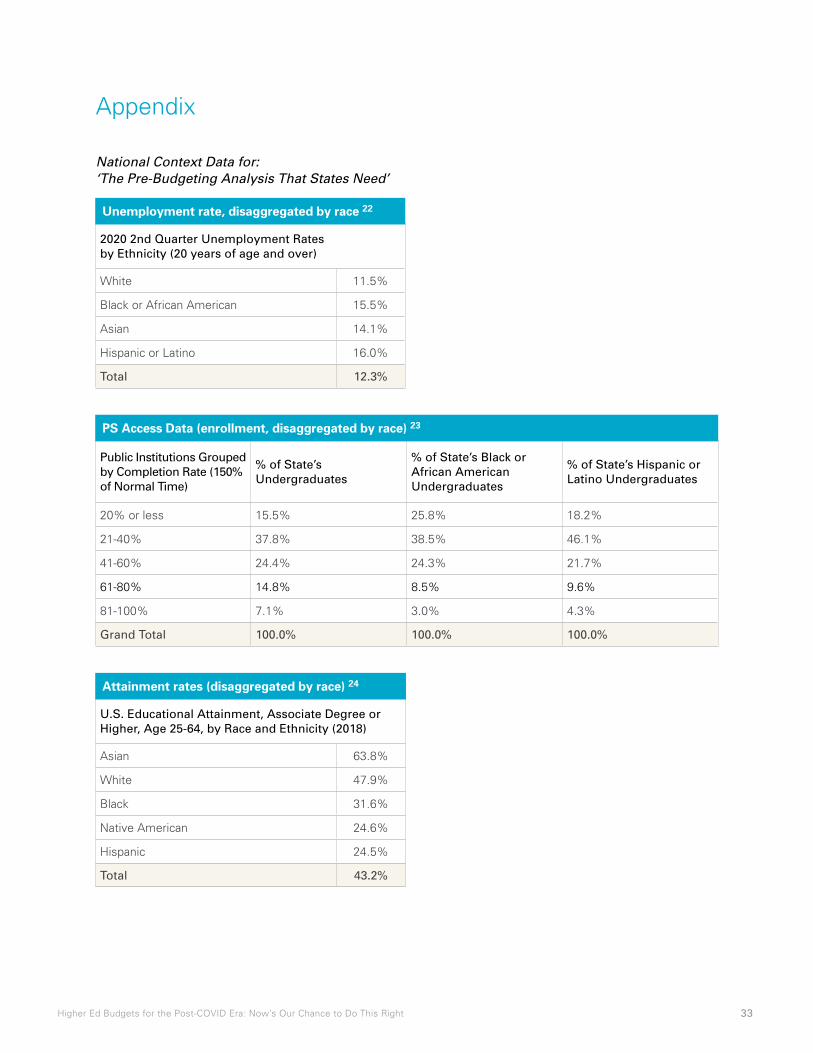
National Context Data for:‘The Pre-Budgeting Analysis That States Need’
2020 2nd Quarter Unemployment Rates by Ethnicity (20 years of age and over)
White 11.5%
Black or African American 15.5%
Asian 14.1%
Hispanic or Latino 16.0%
Total 12.3%
U.S. Educational Attainment, Associate Degree or Higher, Age 25-64, by Race and Ethnicity (2018)
Asian 63.8%
White 47.9%
Black 31.6%
Native American 24.6%
Hispanic 24.5%
Total 43.2%
Public Institutions Grouped by Completion Rate (150% of Normal Time)
% of State’s Undergraduates
% of State’s Black or African American Undergraduates
% of State’s Hispanic or Latino Undergraduates
20% or less 15.5% 25.8% 18.2%
21-40% 37.8% 38.5% 46.1%
41-60% 24.4% 24.3% 21.7%
61-80% 14.8% 8.5% 9.6%
81-100% 7.1% 3.0% 4.3%
Grand Total 100.0% 100.0% 100.0%
Unemployment rate, disaggregated by race 22
Attainment rates (disaggregated by race) 24
PS Access Data (enrollment, disaggregated by race) 23

34 Higher Ed Budgets for the Post-COVID Era: Now’s Our Chance to Do This Right
Short- and long-term COVID impacts on employment
• In the short term, low-income workers and workers with low education attainment levels are most at risk of becoming unemployed due to the pandemic.25,26
Long-term industry employment and output projections27
• Over the next 10 years, six of the 10 fastest-growing occupations are projected to be in the health care and social assistance sectors.
• Other sectors projected to increase employment in the next decade “include professional, business, and scientific services sectors, including computer systems design and related services as well as management, scientific, and technical consulting services.”
• Manufacturing and retail are projected to lose more than 350,000 jobs over the next 10 years.25,26
National Context Data for Principle 1: Prioritize funding for institutions serving populations most affected by COVID-19
Carnegie Classification% of State’s Undergraduates
% of State’s Black or African American Undergraduates
% of State’s Hispanic or Latino Undergraduates
Primarily Associate 49.3% 53.2% 59.4%
Baccalaureate Colleges 4.2% 5.3% 4.6%
Master’s Colleges 15.2% 15.8% 13.5%
Doctoral/Professional Universities 2.4% 3.0% 1.5%
Doctoral Universities: High Research Activity 9.3% 10.5% 6.9%
Doctoral Universities: Very High Research Activity 18.4% 11.0% 13.3%
Other 1.2% 1.1% 0.9%
Grand Total 100.0% 100.0% 100.0%
2018 Completion Rates (150% of Normal Time) Public 2 Year Public 4 Year
American Indian 21.0% 38.0%
Asian 35.8% 72.8%
Black/African American 16.1% 40.5%
Hispanic 24.1% 53.4%
Native Hawaiian/Pacific Islander 19.8% 49.5%
White 30.8% 63.2%
Two or More Races 22.5% 54.9%
Total 27.1% 59.6%
Disaggregated Enrollment data by institution type (Public Institutions) 28
Disaggregated completion rates 29
35 Higher Ed Budgets for the Post-COVID Era: Now’s Our Chance to Do This Right
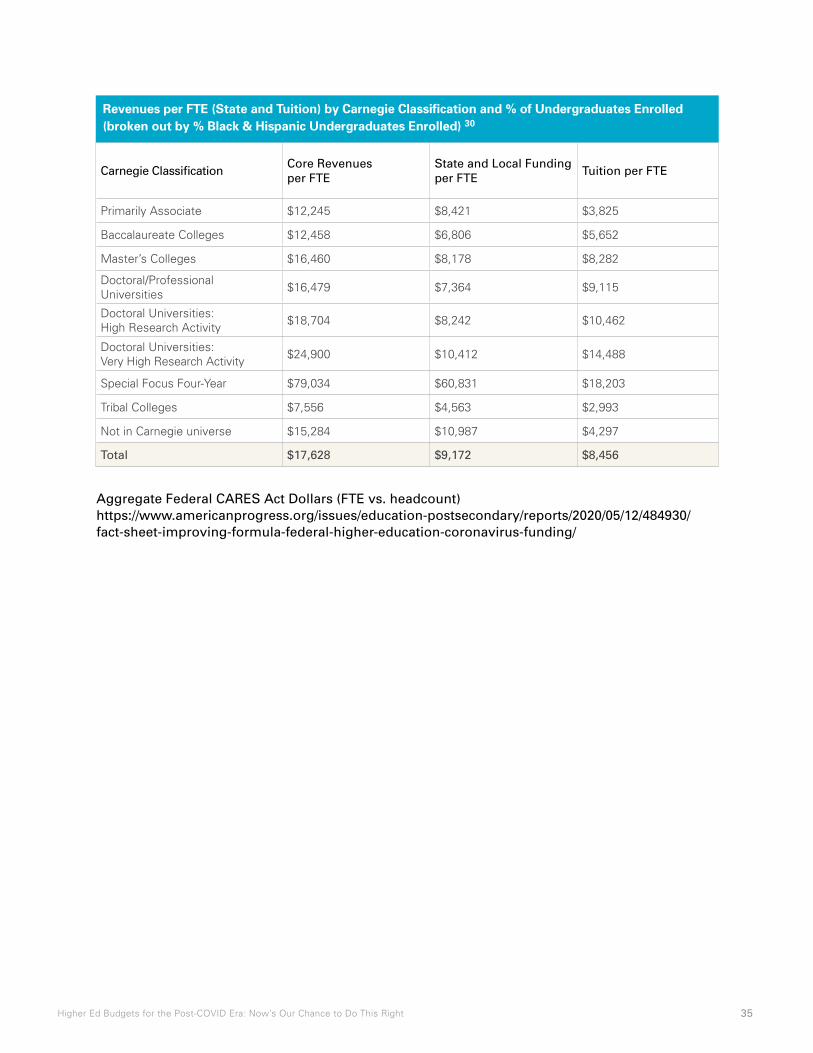
Carnegie ClassificationCore Revenues per FTE
State and Local Funding per FTE
Tuition per FTE
Primarily Associate $12,245 $8,421 $3,825
Baccalaureate Colleges $12,458 $6,806 $5,652
Master’s Colleges $16,460 $8,178 $8,282
Doctoral/Professional Universities $16,479 $7,364 $9,115
Doctoral Universities: High Research Activity $18,704 $8,242 $10,462
Doctoral Universities: Very High Research Activity $24,900 $10,412 $14,488
Special Focus Four-Year $79,034 $60,831 $18,203
Tribal Colleges $7,556 $4,563 $2,993
Not in Carnegie universe $15,284 $10,987 $4,297
Total $17,628 $9,172 $8,456
Revenues per FTE (State and Tuition) by Carnegie Classification and % of Undergraduates Enrolled (broken out by % Black & Hispanic Undergraduates Enrolled) 30
Aggregate Federal CARES Act Dollars (FTE vs. headcount)https://www.americanprogress.org/issues/education-postsecondary/reports/2020/05/12/484930/fact-sheet-improving-formula-federal-higher-education-coronavirus-funding/
36 Higher Ed Budgets for the Post-COVID Era: Now’s Our Chance to Do This Right
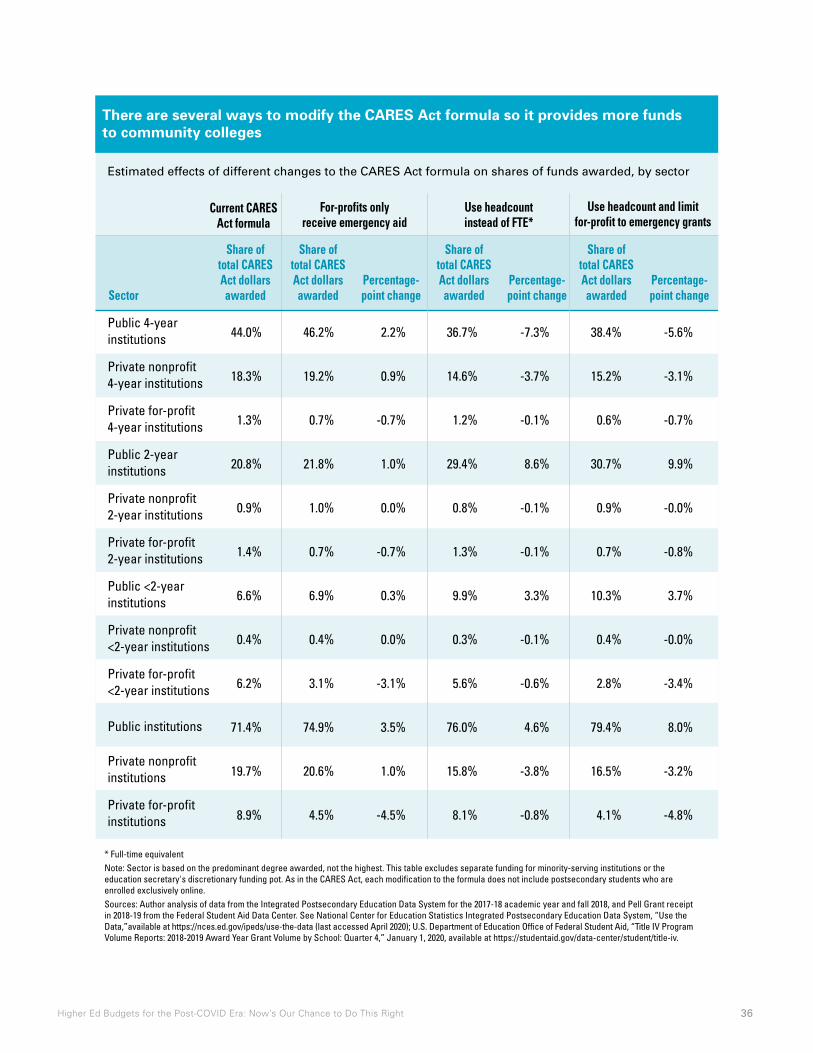
There are several ways to modify the CARES Act formula so it provides more funds to community colleges
Estimated effects of different changes to the CARES Act formula on shares of funds awarded, by sector
* Full-time equivalent Note: Sector is based on the predominant degree awarded, not the highest. This table excludes separate funding for minority-serving institutions or the education secretary's discretionary funding pot. As in the CARES Act, each modification to the formula does not include postsecondary students who are enrolled exclusively online.Sources: Author analysis of data from the Integrated Postsecondary Education Data System for the 2017-18 academic year and fall 2018, and Pell Grant receipt in 2018-19 from the Federal Student Aid Data Center. See National Center for Education Statistics Integrated Postsecondary Education Data System, “Use the Data,”available at https://nces.ed.gov/ipeds/use-the-data (last accessed April 2020); U.S. Department of Education Office of Federal Student Aid, “Title IV Program Volume Reports: 2018-2019 Award Year Grant Volume by School: Quarter 4,” January 1, 2020, available at https://studentaid.gov/data-center/student/title-iv.
Public 4-yearinstitutions
Private nonprofit4-year institutions
Private for-profit4-year institutions
Public 2-yearinstitutions
Private nonprofit2-year institutions
Private for-profit2-year institutions
Public <2-yearinstitutions
Private nonprofit<2-year institutions
Private for-profit<2-year institutions
Public institutions
Private nonprofitinstitutions
Private for-profitinstitutions
Share oftotal CARES Act dollarsawarded
Share oftotal CARES Act dollarsawardedSector
Current CARESAct formula
Use headcount and limit for-profit to emergency grants
Use headcountinstead of FTE*
For-profits onlyreceive emergency aid
Percentage-point change
Share oftotal CARES Act dollarsawarded
Percentage-point change
Share oftotal CARES Act dollarsawarded
Percentage-point change
44.0% 46.2% 2.2% 36.7% -7.3% 38.4% -5.6%
18.3% 19.2% 0.9% 14.6% -3.7% 15.2% -3.1%
1.3% 0.7% -0.7% 1.2% -0.1% 0.6% -0.7%
20.8% 21.8% 1.0% 29.4% 8.6% 30.7% 9.9%
0.9% 1.0% 0.0% 0.8% -0.1% 0.9% -0.0%
1.4% 0.7% -0.7% 1.3% -0.1% 0.7% -0.8%
6.6% 6.9% 0.3% 9.9% 3.3% 10.3% 3.7%
0.4% 0.4% 0.0% 0.3% -0.1% 0.4% -0.0%
6.2% 3.1% -3.1% 5.6% -0.6% 2.8% -3.4%
71.4% 74.9% 3.5% 76.0% 4.6% 79.4% 8.0%
19.7% 20.6% 1.0% 15.8% -3.8% 16.5% -3.2%
8.9% 4.5% -4.5% 8.1% -0.8% 4.1% -4.8%
There are several ways to modify the CARES Act formula so it provides more funds to community colleges
37 Higher Ed Budgets for the Post-COVID Era: Now’s Our Chance to Do This Right
National Context Data for Principle 2: Protect, expand, and focus need-based financial aid
Average need-based investment per undergraduate FTE
• The total state need-based grant aid per undergraduate FTE was $667 in 2017-18. This is a 38 percent (or $185) increase over the 2011-12 amount of $482 (current dollars).31
• In 2017-18, state need-based grant aid per undergraduate FTE ranged from under $100 in eight states to over $1,000 in six states.33,34
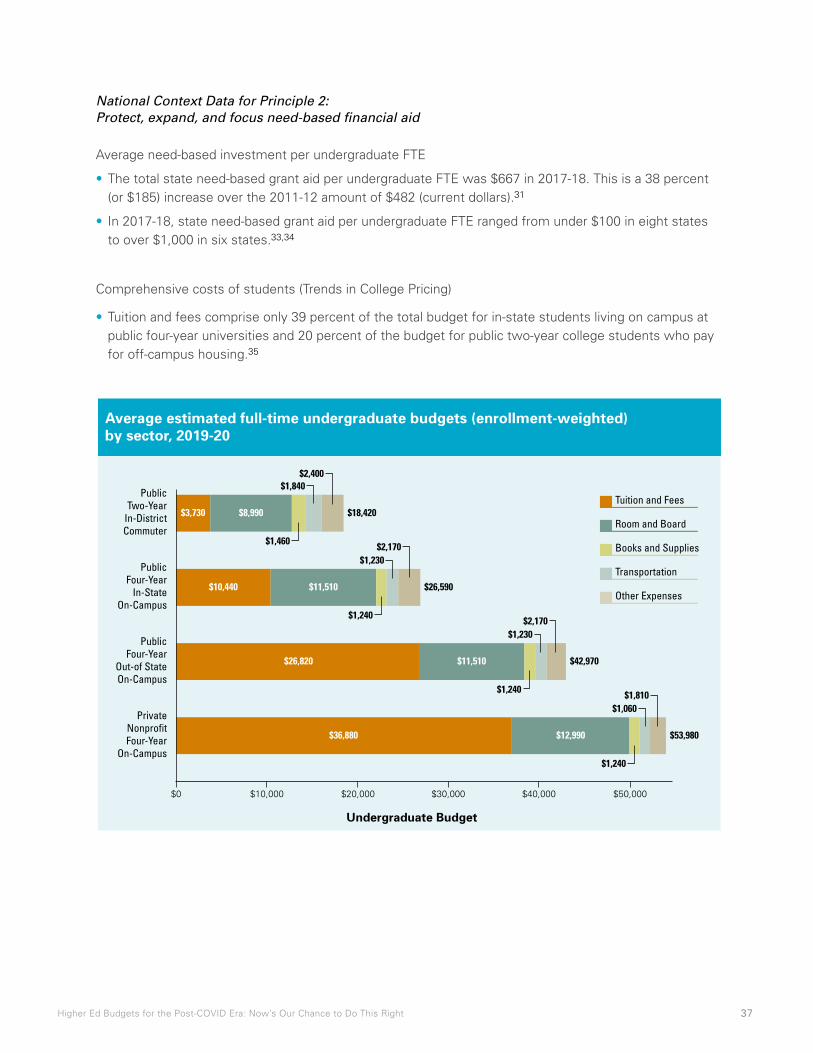
Comprehensive costs of students (Trends in College Pricing)
• Tuition and fees comprise only 39 percent of the total budget for in-state students living on campus at public four-year universities and 20 percent of the budget for public two-year college students who pay for off-campus housing.35
Average estimated full-time undergraduate budgets (enrollment-weighted)by sector, 2019-20
PublicTwo-Year
In-DistrictCommuter
$3,730 $8,990
$1,460
$1,840
$18,420
PublicFour-Year
In-StateOn-Campus
$10,440 $11,510
$1,240
$1,230
$26,590
$2,170
$2,400
PublicFour-Year
Out-of StateOn-Campus
$26,820 $11,510
$1,240
$1,230
$42,970
$2,170
PrivateNonprofit Four-Year
On-Campus
$36,880 $12,990
$1,240
$1,060
$53,980
$1,810
$10,000 $20,000 $30,000 $40,000 $50,000$0
Undergraduate Budget
Tuition and Fees
Room and Board
Books and Supplies
Transportation
Other Expenses
Average estimated full-time undergraduate budgets (enrollment-weighted) by sector, 2019-20
38 Higher Ed Budgets for the Post-COVID Era: Now’s Our Chance to Do This Right
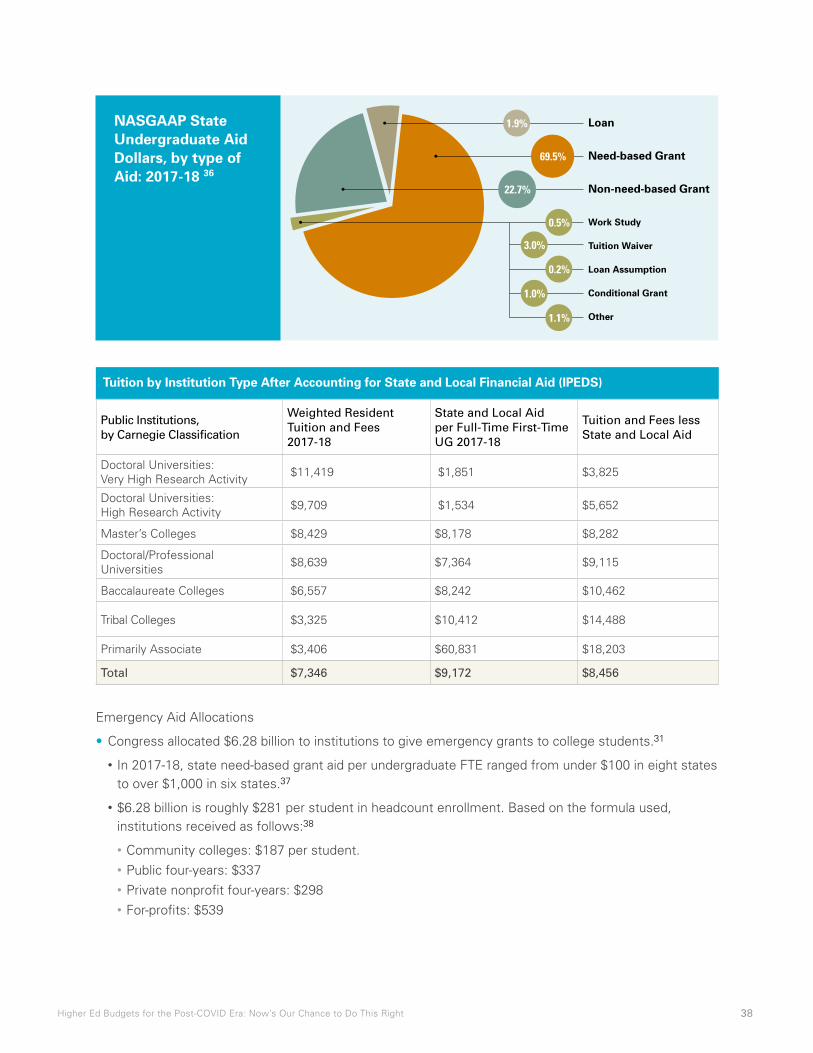
NASGAAP State Undergraduate Aid Dollars, by type of Aid: 2017-18 36
NASGAAP State Undergraduate Aid Dollars, by type of aid: 2017-18
Loan
Need-based Grant
Non-need-based Grant
Work Study
Tuition Waiver
Loan Assumption
Conditional Grant
Other
0.5%
1.9%
22.7%
69.5%
0.2%
1.1%
1.0%
3.0%
Public Institutions, by Carnegie Classification
Weighted Resident Tuition and Fees 2017-18
State and Local Aid per Full-Time First-Time UG 2017-18
Tuition and Fees less State and Local Aid
Doctoral Universities: Very High Research Activity $11,419 $1,851 $3,825
Doctoral Universities: High Research Activity $9,709 $1,534 $5,652
Master’s Colleges $8,429 $8,178 $8,282
Doctoral/Professional Universities $8,639 $7,364 $9,115
Baccalaureate Colleges $6,557 $8,242 $10,462
Tribal Colleges $3,325 $10,412 $14,488
Primarily Associate $3,406 $60,831 $18,203
Total $7,346 $9,172 $8,456
Tuition by Institution Type After Accounting for State and Local Financial Aid (IPEDS)
Emergency Aid Allocations
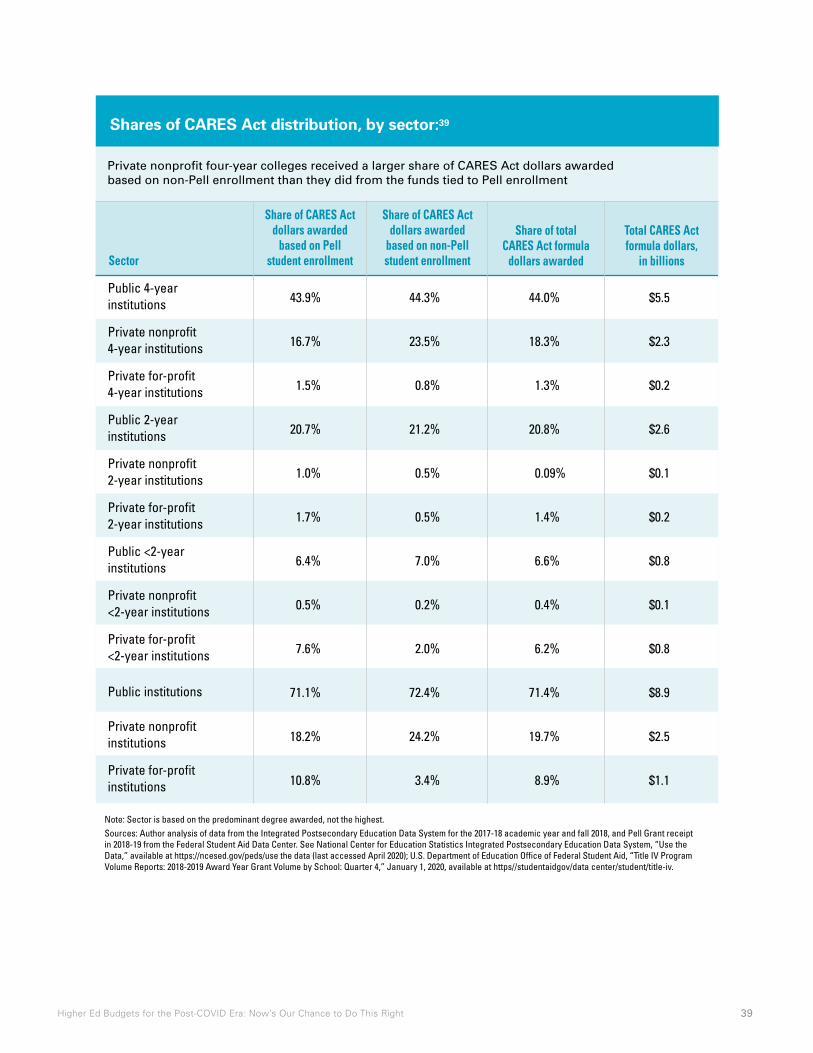
• Congress allocated $6.28 billion to institutions to give emergency grants to college students.31
• In 2017-18, state need-based grant aid per undergraduate FTE ranged from under $100 in eight states to over $1,000 in six states.37
• $6.28 billion is roughly $281 per student in headcount enrollment. Based on the formula used, institutions received as follows:38
• Community colleges: $187 per student. • Public four-years: $337 • Private nonprofit four-years: $298 • For-profits: $539
39 Higher Ed Budgets for the Post-COVID Era: Now’s Our Chance to Do This Right
Note: Sector is based on the predominant degree awarded, not the highest.Sources: Author analysis of data from the Integrated Postsecondary Education Data System for the 2017-18 academic year and fall 2018, and Pell Grant receipt in 2018-19 from the Federal Student Aid Data Center. See National Center for Education Statistics Integrated Postsecondary Education Data System, “Use the Data,” available at https://ncesed.gov/peds/use the data (last accessed April 2020); U.S. Department of Education Office of Federal Student Aid, “Title IV Program Volume Reports: 2018-2019 Award Year Grant Volume by School: Quarter 4,” January 1, 2020, available at https//studentaidgov/data center/student/title-iv.
Public 4-yearinstitutions
Private nonprofit4-year institutions
Private for-profit4-year institutions
Public 2-yearinstitutions
Private nonprofit2-year institutions
Private for-profit2-year institutions
Public <2-yearinstitutions
Private nonprofit<2-year institutions
Private for-profit<2-year institutions
Public institutions
Private nonprofitinstitutions
Private for-profitinstitutions
Share of CARES Actdollars awarded
based on non-Pellstudent enrollment
Share of CARES Actdollars awarded
based on Pellstudent enrollmentSector
Share of total CARES Act formula
dollars awarded
Total CARES Act formula dollars,
in billions
43.9% 44.3% 44.0% $5.5
16.7% 23.5% 18.3% $2.3
1.5% 0.8% 1.3% $0.2
20.7% 21.2% 20.8% $2.6
1.0% 0.5% 0.09% $0.1
1.7% 0.5% 1.4% $0.2
6.4% 7.0% 6.6% $0.8
0.5% 0.2% 0.4% $0.1
7.6% 2.0% 6.2% $0.8
71.1% 72.4% 71.4% $8.9
18.2% 24.2% 19.7% $2.5
10.8% 3.4% 8.9% $1.1
Private nonprofit four-year colleges received a larger share of CARES Act dollars awarded based on non-Pell enrollment than they did from the funds tied to Pell enrollment
Shares of CARES Act distribution, by sector:39

40 Higher Ed Budgets for the Post-COVID Era: Now’s Our Chance to Do This Right
National Context Data for Principle 3: Preserve and strengthen programs and strategies that advance students’ ability to earn credentials
Average time to degree40
• In 2014-15, only 7.4 percent of associate degree earners earned their degrees in two academic years of enrollment. Only 10.1percent of bachelor’s degree earners earned their degrees in four academic years of enrollment.
• Public two-year degree earners on average enrolled 3.4 academic years (and 5.6 calendar years) to earn an associate degree while public four-year degree earners on average enrolled 5.2 academic years (and 5.6 calendar years) to earn a bachelor’s degree.
• For public two-year degree earners who first enrolled in college at the age of 20 or younger, the average time to degree was 3.4 academic years or 5.1 calendar years. For those who first enrolled over the age of 20, the average time to degree was 3.3 academic years and 6.9 calendar years. For public four-year degree earners who first enrolled in college at the age of 20 or younger, the average time to degree was 5.2 academic years and 5.3 calendar years, while the average time to degree was 4.9 academic years and 8.4 calendar years for those who first enrolled after the age of 20.
Student debt41
• Nationally, about two in three (65 percent) college seniors who graduated from public and private nonprofit colleges in 2018 had student loan debt. These borrowers owed an average of $29,200, 2 percent higher than the 2017 average. Average student debt at graduation in 2018 ranged from $19,750 in Utah to $38,650 in Connecticut, and new graduates’ likelihood of having debt ranged from 36 percent in Utah to 76 percent in New Hampshire. High-debt states remain concentrated in the Northeast, and low-debt states are mainly in the West.
US student debt map by state
Average debt under $26,000 Average debt over $30,000Average debt $26,001 - $29,999
Student debt, by state
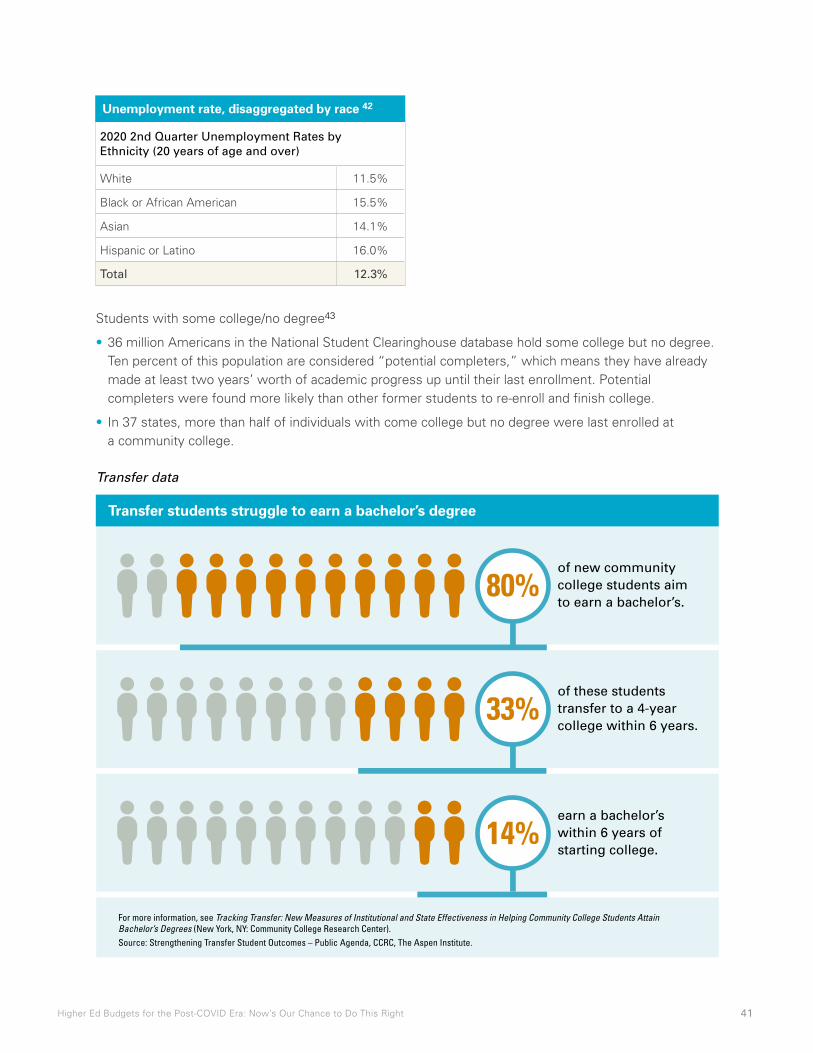
41 Higher Ed Budgets for the Post-COVID Era: Now’s Our Chance to Do This Right
2020 2nd Quarter Unemployment Rates by Ethnicity (20 years of age and over)
White 11.5%
Black or African American 15.5%
Asian 14.1%
Hispanic or Latino 16.0%
Total 12.3%
Unemployment rate, disaggregated by race 42
Students with some college/no degree43
• 36 million Americans in the National Student Clearinghouse database hold some college but no degree. Ten percent of this population are considered “potential completers,” which means they have already made at least two years’ worth of academic progress up until their last enrollment. Potential completers were found more likely than other former students to re-enroll and finish college.
• In 37 states, more than half of individuals with come college but no degree were last enrolled at a community college.
Transfer data
Transfer students to struggle to earn a bachelor’s degree
of new communitycollege students aimto earn a bachelor’s.
For more information, see Tracking Transfer: New Measures of Institutional and State Effectiveness in Helping Community College Students Attain Bachelor’s Degrees (New York, NY: Community College Research Center).Source: Strengthening Transfer Student Outcomes – Public Agenda, CCRC, The Aspen Institute.
of these studentstransfer to a 4-year college within 6 years.
earn a bachelor’s within 6 years of starting college.
80%
33%
14%
Transfer students struggle to earn a bachelor’s degree
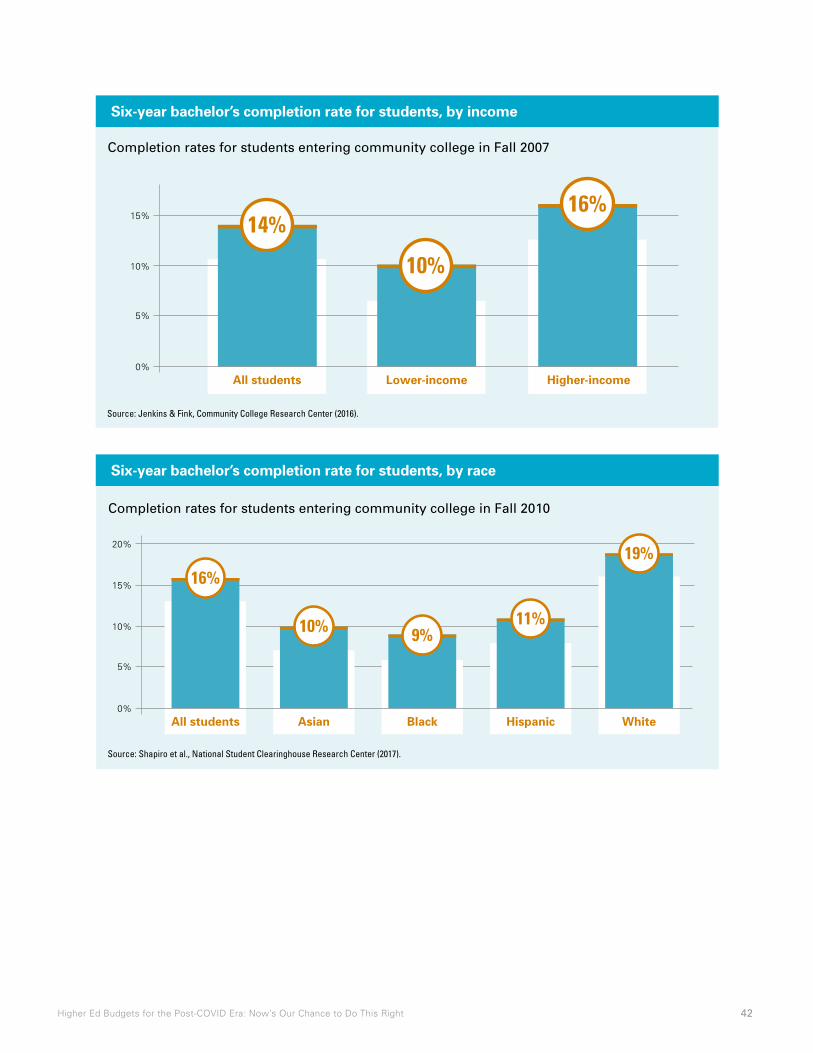
42 Higher Ed Budgets for the Post-COVID Era: Now’s Our Chance to Do This Right
Six-year bachelor’s completion rate for students by income
Source: Jenkins & Fink, Community College Research Center (2016).
Completion rates for students entering community college in Fall 2007
5%
0%
10%
15%
All students Lower-income Higher-income
14%
10%
16%
Six-year bachelor’s completion rate for students, by income
Six-year bachelor’s completion rate for students, by raceSix-year bachelor’s completion rate for students by race
Source: Shapiro et al., National Student Clearinghouse Research Center (2017).
Completion rates for students entering community college in Fall 2010
5%
0%
10%
15%
20%
All students Asian Black Hispanic White
16%
10% 9%11%
19%
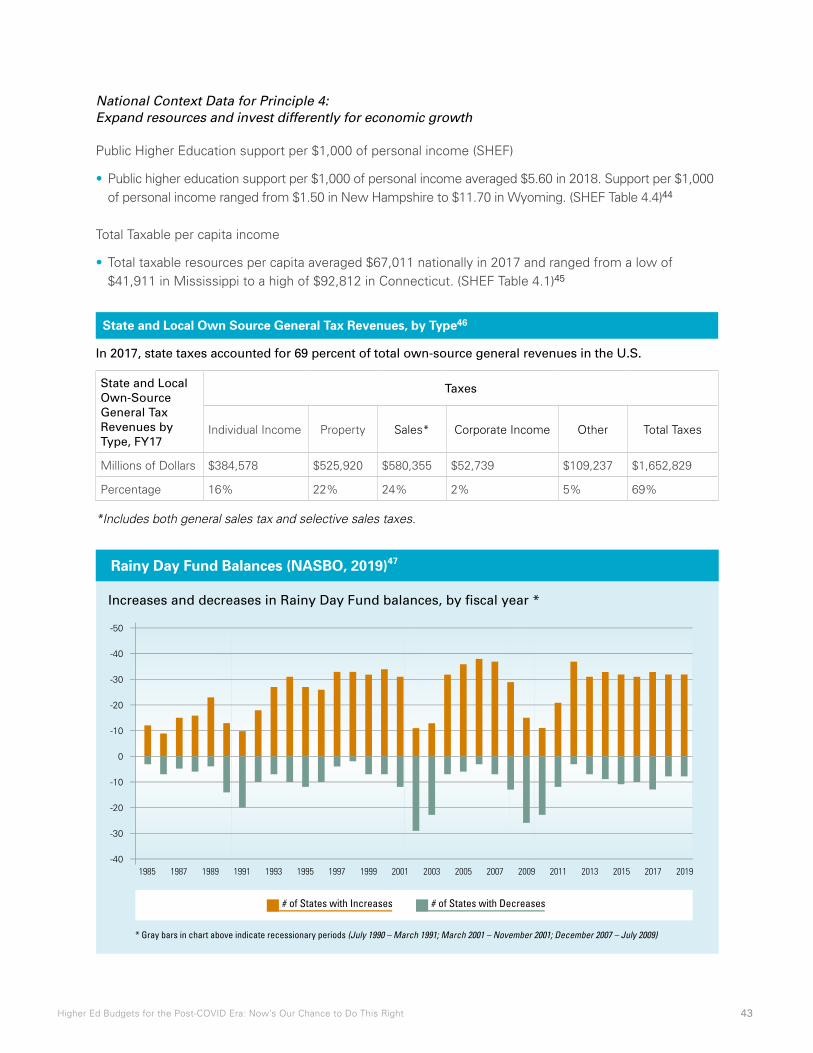
43 Higher Ed Budgets for the Post-COVID Era: Now’s Our Chance to Do This Right
National Context Data for Principle 4: Expand resources and invest differently for economic growth
Public Higher Education support per $1,000 of personal income (SHEF)
• Public higher education support per $1,000 of personal income averaged $5.60 in 2018. Support per $1,000 of personal income ranged from $1.50 in New Hampshire to $11.70 in Wyoming. (SHEF Table 4.4)44
Total Taxable per capita income
• Total taxable resources per capita averaged $67,011 nationally in 2017 and ranged from a low of $41,911 in Mississippi to a high of $92,812 in Connecticut. (SHEF Table 4.1)45
In 2017, state taxes accounted for 69 percent of total own-source general revenues in the U.S.
*Includes both general sales tax and selective sales taxes.
State and Local Own-Source General Tax Revenues by Type, FY17
Taxes
Individual Income Property Sales* Corporate Income Other Total Taxes
Millions of Dollars $384,578 $525,920 $580,355 $52,739 $109,237 $1,652,829
Percentage 16% 22% 24% 2% 5% 69%
State and Local Own Source General Tax Revenues, by Type46
Rainy Day Fund Balances (NASBO, 2019)47
* Gray bars in chart above indicate recessionary periods (July 1990 – March 1991; March 2001 – November 2001; December 2007 – July 2009)
Rainy Day Fund balances (NASBO, 2019)
Increases and decreases in Rainy Day Fund balances, by fiscal year *
-40
-30
-20
-10
0
-10
-20
-30
-40
-50
1985 1987 1989 1991 1993 1995 1997 1999 2001 2003 2005 2007 2009 2011 2013 2015 2017 2019
# of States with Increases # of States with Decreases

44 Higher Ed Budgets for the Post-COVID Era: Now’s Our Chance to Do This Right
National Context Data for Principle 5: Evaluate and improve system and institutional cost structures
Cost trends
Public 4-Years 2010-11 2017-187-Year Difference (Expenditures)
Total $242,591,219 100% $331,147,172 100% 37%
Instruction Total (3) $70,524,278 29% $90,341,563 27% 28%
Instruction (Salaries and Wages) $40,420,752 17% $52,367,162 16% 30%
Research $33,842,288 14% $38,615,952 12% 14%
Public service $12,497,023 5% $14,982,606 5% 20%
Academic support $19,037,101 8% $27,343,769 8% 44%
Student services $10,918,171 5% $15,734,637 5% 44%
Institutional support $20,760,495 9% $26,981,641 8% 30%
Auxillary enterprises (1) $24,856,936 10% $31,830,062 10% 28%
Net grant aid to sudents (2) $10,088,873 4% $11,285,805 3% 12%
Hospitals $29,980,642 12% $51,588,949 16% 72%
Independent operations $1,233,264 1% $1,751,610 1% 42%
Other $8,852,149 4% $20,690,580 6% 134%
Public 2-Years 2010-11 2017-187-Year Difference (Expenditures)
Total $54,271,635 100% $53,824,666 100% -1%
Instruction Total (3) $22,566,471 42% $22,200,158 41% -2%
Instruction (Salaries and Wages) $13,165,721 24% $12,689,323 24% -4%
Research $24,368 0% $28,707 0% 18%
Public service $929,308 2% $869,826 2% -6%
Academic support $4,404,597 8% $4,684,890 9% 6%
Student services $5,358,662 10% $6,049,974 11% 13%
Institutional support $8,290,916 15% $8,683,412 16% 5%
Auxillary enterprises (1) $2,792,902 5% $2,108,618 4% -25%
Net grant aid to sudents (2) $7,398,402 14% $4,866,639 9% -34%
Hospitals - - - - -
Independent operations - - - - -
Other $2,506,009 5% $4,332,442 8% 73%
Total expenditures of public degree-granting postsecondary institutions, by purpose and level of institution: 2010-11 and 2017-1848
45 Higher Ed Budgets for the Post-COVID Era: Now’s Our Chance to Do This Right
Cost drivers
Public Higher Education support per $1,000 of personal income (SHEF)
• A 2018 MHEC Report found rising college cost has been driven substantially by three factors:49
1. Lagging productivity growth is endemic to personal service industries, so service prices rise faster than goods prices. This is called “cost disease;”
2. The higher education workforce is highly educated and the cost of hiring highly educated workers has risen sharply since 1981; and
3. A college’s mission and market require it to meet a rising standard of educational care. More than any potential dysfunction on campus, these three factors have led to rising real costs.
• Public funding for higher education has declined on a per-student basis over the last 10 years.50
• There is some evidence that growing pension liabilities are crowding out higher education investment.51
• The reductions to public higher education funding have hit the two-year sector especially hard because community colleges have fewer alternative funding streams than universities and since they have been serving more students with greater academic and financial needs.52
46 Higher Ed Budgets for the Post-COVID Era: Now’s Our Chance to Do This Right
9 Global Strategy Group, “Higher Ed Survey Highlights the Academic, Financial, and Emotional Toll of Coronavirus on Students,” May 28, 2020, https://s3-us-east-2.amazonaws.com/edtrustmain/wp-content/uploads/sites/3/2017/11/27120859/Higher-Ed- Nationwide-CA-Memo-F05.27.20.pdf.
Endnotes1 Noah Berger and Peter Fisher, “A Well-Educated Workforce Is Key to State Prosperity,” Economic Policy Institute, August 22, 2013, https://www.epi.org/publication/states-education-productivity-growth-foundations/#:~:text=Evidence%20suggests%20that%20 states%20that,state%20product%20per%20hour%20worked.
2 Douglas Holtz-Eakin and Tom Lee, “The Economic Benefits of Educational Attainment,” American Action Forum, June 4, 2019, https://www.americanactionforum.org/project/economic-benefits-educational-attainment/.
3 Education Dive, “College completion rates still rising in most states,” September 28, 2020, https://www.educationdive.com/news/ college-completion-rates-still-rising-in-most-states/573337/.
4 Wall Street Journal, “Coronavirus-Hit State Budgets Create Drag on U.S. Recovery,” August 12, 2020, https://www.wsj.com/ articles/ coronavirus-hit-state-budgets-create-a-drag-on-u-s-recovery-11597224600.
5 Associated Press, “State and Local Governments need billions more in aid to avert 4 million layoffs, Moody’s finds,” June 24, 2020, https://www.marketwatch.com/story/state-local-governments-need-billions-more-in-aid-to-avert-4-million-layoffs-moodys- finds-2020-06-24.
6 American Enterprise Institute, “New estimates of state and local government revenue shortfalls,” September 8, 2020, https:// www.aei.org/economics/new-estimates-of-state-and-local-government-revenue-shortfalls/.
7 Wall Street Journal, Ibid.
8 Elizabeth McNichol and Michael Leachman, “States Continue to Face Large Shortfalls Due to COVID-19 Effects,” Center on Budget and Policy Priorities, Updated July 7, 2020, https://www.cbpp.org/research/state-budget-and-tax/states-continue-to-face-large- shortfalls-due-to-covid-19-effects.
10 Means, B., & Neisler, J., with Langer Research Associates, “Suddenly online: A national survey of undergraduates during the COVID-19 pandemic,” 2020, https://digitalpromise.org/wp-content/uploads/2020/07/ELE_CoBrand_DP_FINAL_3.pdf.
11 Global Strategy Group, “Higher Ed Survey Highlights the Academic, Financial, and Emotional Toll of Coronavirus on Students,” May 28, 2020, https://s3-us-east-2.amazonaws.com/edtrustmain/wp-content/uploads/sites/3/2017/11/27120859/Higher-Ed- Nationwide-CA-Memo-F05.27.20.pdf.
12 Jankowski, N.A. “Assessment during a crisis: Responding to a global pandemic,” August 2020, University of Illinois and Indiana University, National Institute for Learning Outcomes Assessment, https://www.learningoutcomesassessment.org/wp-content/ uploads/2020/08/2020-COVID-Survey.pdf.
13 Blankstein, M., Frederick, J. K., & Wolff-Eisenberg, C., “Student experiences during the pandemic pivot,” June 2020, Ithaka S+R, https://www.learningoutcomesassessment.org/wp-content/uploads/2020/08/2020-COVID-Survey.pdf.
14 Strada Education Network, “Students’ Plans Disrupted Strada Center for Consumer Insights, Public Viewpoint Disparities in Disruption COVID-19’s Disproportionate Impact on Work and Education for People of Color,” June 10, 2020, https://www. stradaeducation.org/wp-content/uploads/2020/06/Public-Viewpoint-Charts-Week-9.pdf.
15 National College Attainment Network, “Form Your Future FAFSA Tracker, FAFSA Application Renewals in the 2019-2020 and 2020-2021 Cycles,” https://public.tableau.com/profile/bill.debaun.national.college.access.network#!/vizhome/FAFSARenewals20-21/ FAFSARenewals.
16 National Student Clearinghouse, “National Student Clearinghouse Research Center’s Monthly Update on Higher Education Enrollment,” September, 1, 2020, https://nscresearchcenter.org/stay-informed/.
17 Connor Maxwell and Danyelle Solomon, “The Economic Fallout of the Coronavirus for People of Color,” Center for American Progress, April 14, 2020, https://www.americanprogress.org/issues/race/news/2020/04/14/483125/economic-fallout-coronavirus- people-color/.
18 While we focus on policy here, we also encourage institutional leaders to reject the business-as-usual approach.
19 Sarah Bohn, et al., “The Impact of Budget Cuts on California’s Community Colleges,” Public Policy Institute of California, March 2013, https://www.ppic.org/publication/the-impact-of-budget-cuts-on-californias-community-colleges/#:~:text=Student%20 enrollment%20rates%20in%20California’s,to%20declines%20in%20student%20access.
47 Higher Ed Budgets for the Post-COVID Era: Now’s Our Chance to Do This Right
20 Only Vermont lacks this balanced operating budget recommendation. For more information, National Conference of State Legislatures, “State Balanced Budget Provisions,” https://www.ncsl.org/research/fiscal-policy-state-balanced-budget-requuirements- provisions-and.aspx.
21 Bridget Terry Long, “State Support for Higher Education: How Changing the Distribution of Funds Could Improve College Completion Rates,” University of Virginia Miller Center, National Commission on Financing 21st Century Higher Education, http://web1.millercenter.org/commissions/higher-ed/Long_No9.pdf.
22 https://www.bls.gov/web/empsit/cpsee_e16.htm
24 https://www.luminafoundation.org/stronger-nation/report/2020/#nation
25 https://www.businessinsider.com/this-chart-shows-the-change-in-employment-for-us-industries-2020-8
27 https://www.bls.gov/news.release/ecopro.nr0.htm
26 https://www.businessinsider.com/jobs-that-are-most-vulnerable-to-the-response-from-coronavirus-2020-4#cashiers-33-million-jobs- are-vulnerable-to-short-term-effects-from-the-coronavirus-5
23 IPEDS
28 IPEDS
29 IPEDS
30 IPEDS
31 NASSGAP
33 New Jersey, California, Washington, Indiana, New York, Virginia
35 College Board, Trends in College Pricing, 2019
36 NASSGAP
37 https://www.americanprogress.org/issues/education-postsecondary/reports/2020/05/11/484838/better-formula-higher-educations- federal-coronavirus-funding/
38 https://tcf.org/content/report/how-colleges-can-advance-equity-with-cares-act-emergency-student-aid/#easy-footnote-bottom-28
40 https://nscresearchcenter.org/signaturereport11/?highlight=time%20to%20degree&hilite=%27time%27%2C%27degree%27
41 https://ticas.org/our-work/student-debt/
44 https://shef.sheeo.org/
45 https://shef.sheeo.org/
46 US Census Bureau, “2017 Annual Survey of State and Local Government Finances”
47 https://community.nasbo.org/budgetblogs/blogs/kathryn-white/2019/01/03/states-saving-for-a-rainy-day
48 https://nces.ed.gov/programs/digest/d19/tables/dt19_334.10.asp
42 https://www.bls.gov/web/empsit/cpsee_e16.htm
43 https://nscresearchcenter.org/some-college-no-degree-2019/?highlight=time%20to%20degree&hilite=%27time%27%2C%27 degree%27
39 https://www.americanprogress.org/issues/education-postsecondary/reports/2020/05/11/484838/better-formula-higher-educations- federal-coronavirus-funding/
32 Arizona, Arkansas, Montana, Utah, South Dakota, Georgia, New Hampshire, Wyoming
34 NASSGAP

48 Higher Ed Budgets for the Post-COVID Era: Now’s Our Chance to Do This Right
49 https://www.mhec.org/sites/default/files/resources/mhec_affordability_series7_20180730_2.pdf#:~:text=Yet%20the%20main%20 drivers%20of,forces%20buffeting%20the%20entire%20economy.&text=In%20most%20industries%2C%20prices%20are,firms %20to%20make%20a%20profit.
50 https://shef.sheeo.org/report/?report_page=sources-and-uses-of-funding
51 https://media4.manhattan-institute.org/sites/default/files/R-DD-0517.pdf
52 https://www.tandfonline.com/doi/full/10.1080/00091383.2019.1606583

At the Bill & Melinda Gates Foundation, we believe that every person deserves the chance to live a healthy, productive life. In the U.S., this means expanding life-changing opportunities, including – and especially – education. We are working toward a day when many more students achieve a certificate or degree that improves their economic prospects and the chance for educational success no longer depends on race, ethnicity, or income. We do this by focusing on innovation, transformation, data and information, and policy.
Lumina Foundation is an independent, private foundation in Indianapolis that is committed to making opportunities for learning beyond high school available to all. We envision a system that is easy to navigate, delivers fair results, and meets the nation’s need for talent through a broad range of credentials. Our goal is to prepare people for informed citizenship and for success in a global economy.
AcknowledgmentsThe Bill & Melinda Gates Foundation and Lumina Foundation are grateful for the analytical support provided by HCM Strategists in preparing this publication. The views expressed here are those of the foundations.
November 2020