
HIGH-WALL CONTROL AT ANGLO GOLD ASHANTI, … Jager.pdf · that could be used for timing modeling....
16
The South African Institute of Mining and Metallurgy International Symposium on Stability of Rock Slopes in Open Pit Mining and Civil Engineering André de Jager and Henk Ludik Page 509 HIGH-WALL CONTROL AT ANGLO GOLD ASHANTI, NAVACHAB MINE André de Jager, BME Delta Caps Henk Ludik, Anglo Gold Ashanti ABSTRACT Navachab Mine experiences difficulties with pit wall stability in certain areas of the mine. The main reason for the instability is the fact that the geology comprises many joints and faults. Blasting, without impacting negatively on the stability of the pit walls, poses a major challenge. The mine has installed a technologically advanced seismic monitoring system with monitoring sensors positioned at various locations and depths throughout the pit. The electronic data recording system records all relevant information on a continuous basis with early warning signals in cases of potential danger. From the information recorded by this micro-seismic system it was established that the energy release into the high-wall is predominantly influenced by the mining rate, water content and mining tempo and to a lesser extent by the blasting operations. To limit the negative effects of blast vibrations, the use of Electronic Delay Detonators (EDDs) was introduced. The optimal delays were determined through signature trace analysis. The vibrations obtained during blasts initiated by means of electronic delay detonators were monitored and compared to those traditionally obtained when standard pyrotechnic delay detonators had been used. The measured vibration data indicated an improvement of 25% to 100% drop in vibration amplitude compared. The accuracy and programmability of EDDs presented huge potential for blast optimization in terms of limiting the vibrations without compromising fragmentation. The whole project was conducted over a twelve week period with some 4000 EDDs. The average size of a blast was in the order of 350 holes using about 40kg explosives per hole, which equates to 14,000 kg explosives over 12 different blasts. The paper deals in detail with the blast optimization process with regard to: - determining the rock response time; - establishing the signature traces; - analyzing the wave interference patterns; - predicting the direction of constructive and destructive wave interferences; - optimizing of the inter-hole and inter-row delay periods; - measuring the ground vibrations.
Transcript of HIGH-WALL CONTROL AT ANGLO GOLD ASHANTI, … Jager.pdf · that could be used for timing modeling....
The South African Institute of Mining and Metallurgy International Symposium on Stability of Rock Slopes in Open Pit Mining and Civil Engineering André de Jager and Henk Ludik
Page 509
HIGH-WALL CONTROL AT ANGLO GOLD ASHANTI, NAVACHAB MINE
André de Jager, BME Delta Caps Henk Ludik, Anglo Gold Ashanti
ABSTRACT
Navachab Mine experiences difficulties with pit wall stability in certain areas of the mine. The main reason for the instability is the fact that the geology comprises many joints and faults. Blasting, without impacting negatively on the stability of the pit walls, poses a major challenge. The mine has installed a technologically advanced seismic monitoring system with monitoring sensors positioned at various locations and depths throughout the pit. The electronic data recording system records all relevant information on a continuous basis with early warning signals in cases of potential danger. From the information recorded by this micro-seismic system it was established that the energy release into the high-wall is predominantly influenced by the mining rate, water content and mining tempo and to a lesser extent by the blasting operations. To limit the negative effects of blast vibrations, the use of Electronic Delay Detonators (EDDs) was introduced. The optimal delays were determined through signature trace analysis. The vibrations obtained during blasts initiated by means of electronic delay detonators were monitored and compared to those traditionally obtained when standard pyrotechnic delay detonators had been used. The measured vibration data indicated an improvement of 25% to 100% drop in vibration amplitude compared. The accuracy and programmability of EDDs presented huge potential for blast optimization in terms of limiting the vibrations without compromising fragmentation. The whole project was conducted over a twelve week period with some 4000 EDDs. The average size of a blast was in the order of 350 holes using about 40kg explosives per hole, which equates to 14,000 kg explosives over 12 different blasts. The paper deals in detail with the blast optimization process with regard to:
- determining the rock response time; - establishing the signature traces; - analyzing the wave interference patterns; - predicting the direction of constructive and destructive wave interferences; - optimizing of the inter-hole and inter-row delay periods; - measuring the ground vibrations.

The South African Institute of Mining and Metallurgy International Symposium on Stability of Rock Slopes in Open Pit Mining and Civil Engineering André de Jager and Henk Ludik
Page 510
The results obtained during electronic blasting are compared to those obtained during pyrotechnic blasting. Comparisons are being made with regard to the following:
- ground vibration measurements; - pit wall stability measurements; - blast safety.
Introduction Anglo Gold Ashanti’s Navachab Mine is burdened with extremely vulnerable high-wall conditions, particularly on the Eastern high-wall of the pit. The challenge was to improve high-wall conditions throughout the pit, including the most critical areas of the pit, by controlling blast generated vibrations through blast optimizing, using the accuracy and versatility of Electronic Delay Detonators (EDDs) in the blast design, This paper portrays the measures undertaken to improve the conditions of the unstable high-wall conditions existing at Anglo Gold Ashanti, Navachab Mine. Brief History of the Mine One of Namibia's mining enterprises, Navachab Gold Mine, situated near Karibib, was officially opened by ex-President Sam Nujoma during June 1990. The Mine is wholly owned by Anglo Gold Ashanti (Pty) Ltd. The property is located some 10km south west of the town of Karibib and 170km West North-west of the Namibian capital Windhoek. Karibib is located in the hilly grasslands on the edge of the Namib Desert. The name of the Mine was taken from the farm on which the gold deposits were discovered. Navachab is an opencast operation and was brought into production in December 1989 (only five years after discovery). The treatment plant was designed to treat 840 000 tons/year. It has been upgraded over the years and the current treatment rate is 1.3 million tons per annum. The Mine provides direct employment for about 300 people, with most employees being from the surrounding areas. The first recorded pit wall failure occurred during June 1998 and was approximately 15 m high. It happened on the eastern pit wall, approximately 15m in height during September 1999 a second failure was recorded at exactly the same position of approximately 30 m in height. The third and largest failure recorded in the same area of the high-wall occurred during March 2001 and was approximately 50 m in height. SRK Consulting conducted an extensive investigation after the third and largest failure and made various recommendations to prevent similar failures in the future, which includes the following:
- an early warning monitoring system, - survey monitoring of pit-walls directly linked to the geotechnical department at the
mine, - pit slope de-watering program, - 3-D structural geological study.

The South African Institute of Mining and Metallurgy International Symposium on Stability of Rock Slopes in Open Pit Mining and Civil Engineering André de Jager and Henk Ludik
Page 511
Blast Optimization 1. Method Thirteen EDD blasts and three Pyrotechnic (shock-tube) blasts have been performed within a twelve week period which ranged from 30 March to 05 July 2005. During the first blast, a single hole was fired prematurely of the rest of the blast, in order to provide a signature trace that could be used for timing modeling. The modeling provided a series of time delays that would provide optimal sets of inter-hole and inter-row delays for maximum destructive interference. The initial blast was fired without knowledge of the optimal delays. Following the first blast, all subsequent blasts were timed using optimal delay periods, and the timing design was carried out in such a way as to limit wave concentrations towards the pit-walls and focus them in the north south direction. A Wave Interference Model was used to design the firing sequence in each blast to achieve the necessary concentrations and dispersions in the desired directions. For monitoring of all blasts, the pit-wall that was focused on was the western wall, where blasting seismographs could be safely and easily positioned. Most of the blasting took place just below the western wall. In each case, where possible, seismographs were located on the western high-wall side of the blast (at about the centre position of the blast), and on the south or northern side of the blast. The units were positioned approximately 50 to 100 m from the blast on the north or south side and about 80 m from the blast on the western side.
Figure 1. Pit Plan - Areas of Concern are indicated in red

The South African Institute of Mining and Metallurgy International Symposium on Stability of Rock Slopes in Open Pit Mining and Civil Engineering André de Jager and Henk Ludik
Page 512
2. Determining the Rock Response Time The Rock Response was determined during a study done in 2002, whereby two drums were suspended in front of a bench consisting of 102 mm holes with a burden of 3 m and a 5 m high face. When the bench was blasted, the movement of the two drums in relation to the firing holes was measured using high speed video recordings. The velocity of the moving drums could also be calculated.
0.5
1
1.5
2
2.5
3
3.5
4
15 20 25 30 35 40
Time (ms)
Dis
tan
ce (
m)
Drum 1 Drum 2 Linear (Drum 1) Linear (Drum 2)
Drum 1
Drum 2
Figure 2. Movement of the two drums (Y-axis) plotted with time of movement (X-axis).
Table 1 contains the information recorded during the study done whereby the rock response time was established. The result of the study produced the rock response time at 4.1 ms per meter of burden. This means that any timing to be applied to benches in future should not be less than 4.1 ms per meter of burden. If shorter timing than this is applied, the possibility exists that insufficient movement will occur when successive holes detonate. This could result in the bench not moving sufficiently and therefore have a negative effect on fragmentation and dig-ability. Table 1. Information recorded during study of Rock Response time.
Face Velocity
Response time (y=0)
Drum 1 14.6 m/s 10.98 Drum 2 17.1 m/s 13.58 Average 12.28 Response time (ms) per meter of burden
4.1

The South African Institute of Mining and Metallurgy International Symposium on Stability of Rock Slopes in Open Pit Mining and Civil Engineering André de Jager and Henk Ludik
Page 513
3. Establishing Signature Traces To perform an accurate signature trace study, a single hole representative of a normal blast-hole should be detonated and the subsequent vibration levels measured and analyzed. The traces from one hole that was fired prematurely by 500 ms on the first blast done on 30 March 2005 were used to determine optimal delays for destructive interference. The traces that were used for the analysis are shown in Figure 3. These traces were the best defined of all measurements taken and were recorded by an instrument located on the western high-wall above the blast.
-10.0000
-8.0000
-6.0000
-4.0000
-2.0000
0.0000
2.0000
4.0000
6.0000
8.0000
10.0000
0.0 10.0 20.0 30.0 40.0 50.0 60.0 70.0 80.0
Time (ms)
Am
plit
ud
e (m
m/s
)
Figure 3. The signature traces recorded on three axes from the seismograph located 81
m west of the signature hole.
A computer analysis of the recorded trace produced the peak amplitudes at a number of different delays. These results are given in Figure 4. These amplitudes were used for determination of the optimal delays to apply.

The South African Institute of Mining and Metallurgy International Symposium on Stability of Rock Slopes in Open Pit Mining and Civil Engineering André de Jager and Henk Ludik
Page 514
Peak Values Analysis
0.0
5.0
10.0
15.0
20.0
1 3 5 7 9 11 13 15 17 19 21 23 25 27 29 31 33 35 37 39 41 43 45 47 49 51 53 55 57 59 61 63 65 67 69
Delay Period (ms)
PP
V (
mm
/s)
Max Radial
Max Vert
Max Trans
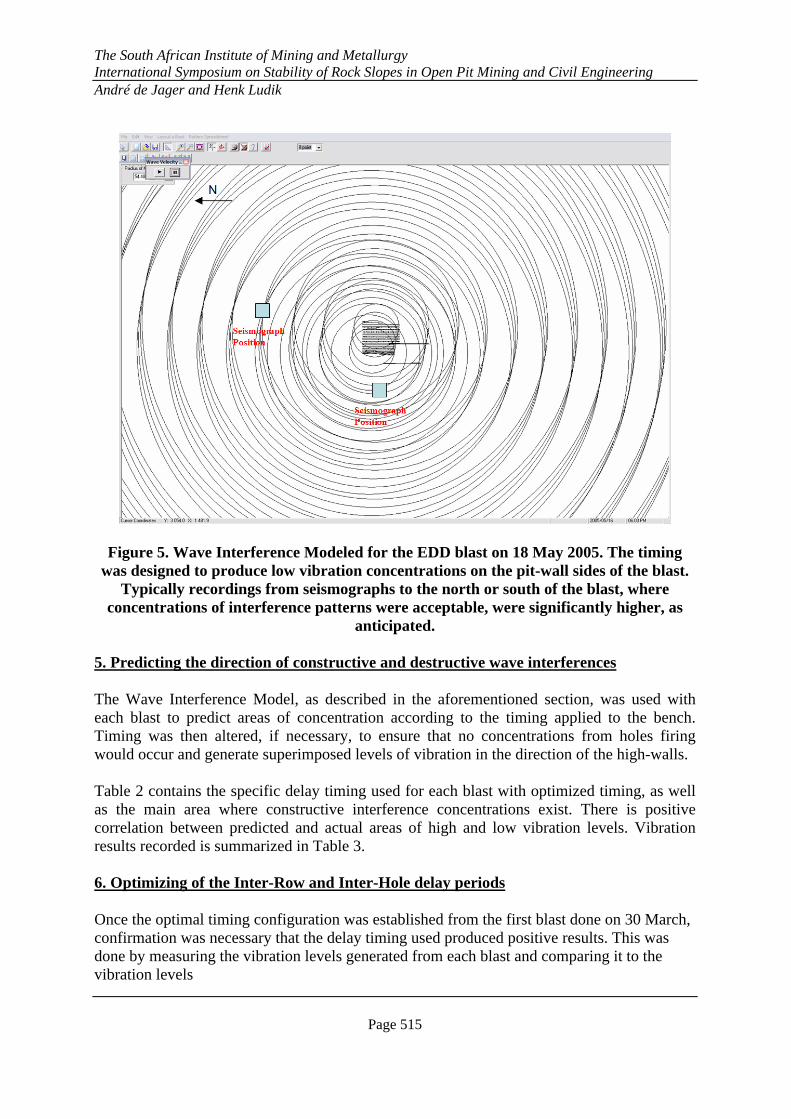
Figure 4. Summarized result of the signature trace analysis. The results show that, had the same delays been applied for EDD blasts as were being applied for shock tube blasts (17 ms and 42 ms), high vibration results would have been likely to occur. 4. Analyzing the Wave Interference Patterns For each blast, a Wave Interference Model was used to further evaluate the perceived best delay timings. This was done in order to eliminate concentrations of holes generating excessive levels of vibration toward the critical areas of the pit. The timing was altered, where necessary, and designs were done exclusively for each bench blasted, to ensure that a generic timing design was not used whereby undesirable vibration levels could be generated toward critical areas of the pit. The aim was to design each bench in such a manner that constructive interference was eliminated toward the critical pit-wall areas of the pit. In order to achieve this, there were often concentrations toward the North and South of the pit. An example is shown in Figure 5 where an EDD blast was done on 18 May with constructive wave interference being generated from North to South along the pit, with virtually no concentrations to the West and East high-walls.
The South African Institute of Mining and Metallurgy International Symposium on Stability of Rock Slopes in Open Pit Mining and Civil Engineering André de Jager and Henk Ludik
Page 515
Figure 5. Wave Interference Modeled for the EDD blast on 18 May 2005. The timing was designed to produce low vibration concentrations on the pit-wall sides of the blast.
Typically recordings from seismographs to the north or south of the blast, where concentrations of interference patterns were acceptable, were significantly higher, as
anticipated. 5. Predicting the direction of constructive and destructive wave interferences The Wave Interference Model, as described in the aforementioned section, was used with each blast to predict areas of concentration according to the timing applied to the bench. Timing was then altered, if necessary, to ensure that no concentrations from holes firing would occur and generate superimposed levels of vibration in the direction of the high-walls. Table 2 contains the specific delay timing used for each blast with optimized timing, as well as the main area where constructive interference concentrations exist. There is positive correlation between predicted and actual areas of high and low vibration levels. Vibration results recorded is summarized in Table 3. 6. Optimizing of the Inter-Row and Inter-Hole delay periods
Once the optimal timing configuration was established from the first blast done on 30 March, confirmation was necessary that the delay timing used produced positive results. This was done by measuring the vibration levels generated from each blast and comparing it to the vibration levels
The South African Institute of Mining and Metallurgy International Symposium on Stability of Rock Slopes in Open Pit Mining and Civil Engineering André de Jager and Henk Ludik
Page 516
recorded from the first blast respective to the seismograph’s position, to establish if a decrease in vibration was achieved. Initially, the delay timing applied to the EDD blasts was 23 ms between holes and 60 ms between rows, which produced a relatively small decrease in vibration recorded. To attempt to produce a greater decrease in vibration, timing delay values were altered to between 9 ms and 12 ms between holes and 63 ms between rows. Although the rock response time of 4.1 ms per meter burden (blasting a 3.4 meter burden) suggests a minimum delay of 14ms, these shorter delay values between holes (inter-hole) produced a far greater vibration reduction. Vibrations recorded were 100% less than with the initial blast done. The shorter delay values were based on figures from the signature trace analysis, a study done entirely to optimize timing values. The vibration results recorded confirmed these values to be the better values in terms of vibration control. Each blast done with EDDs from April 2005 to July 2005 was designed using the specific timing configuration as a generic model. Wave interference patterns were however simulated for each blast to ensure concentrations were away from the pit-walls. Table 2 summarizes the specific delay timing applied to the EDDs with each blast as well as the direction of the most prominent wave interference concentrations.
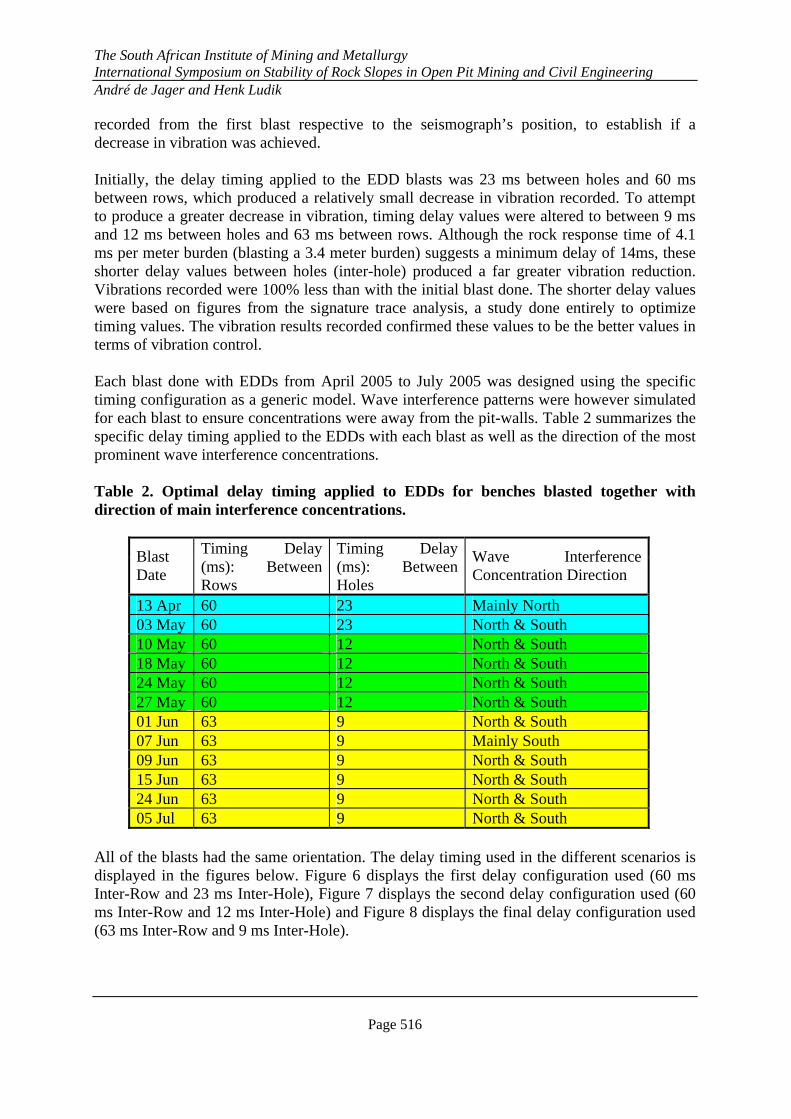
Table 2. Optimal delay timing applied to EDDs for benches blasted together with direction of main interference concentrations.
Blast Date
Timing Delay (ms): Between Rows
Timing Delay (ms): Between Holes
Wave Interference Concentration Direction
13 Apr 60 23 Mainly North 03 May 60 23 North & South 10 May 60 12 North & South 18 May 60 12 North & South 24 May 60 12 North & South 27 May 60 12 North & South 01 Jun 63 9 North & South 07 Jun 63 9 Mainly South 09 Jun 63 9 North & South 15 Jun 63 9 North & South 24 Jun 63 9 North & South 05 Jul 63 9 North & South
All of the blasts had the same orientation. The delay timing used in the different scenarios is displayed in the figures below. Figure 6 displays the first delay configuration used (60 ms Inter-Row and 23 ms Inter-Hole), Figure 7 displays the second delay configuration used (60 ms Inter-Row and 12 ms Inter-Hole) and Figure 8 displays the final delay configuration used (63 ms Inter-Row and 9 ms Inter-Hole).

The South African Institute of Mining and Metallurgy International Symposium on Stability of Rock Slopes in Open Pit Mining and Civil Engineering André de Jager and Henk Ludik
Page 517
Figure 6. This figure illustrates the timing used for the blasts done on 13 April and 03 May. (60 ms between Rows and 23 ms between Holes in a row)
Figure 7. This figure illustrates the timing used for the blasts done from 10 May to 27 May. (60 ms between Rows and 12 ms between Holes in a row)

The South African Institute of Mining and Metallurgy International Symposium on Stability of Rock Slopes in Open Pit Mining and Civil Engineering André de Jager and Henk Ludik
Page 518
Figure 8. This figure illustrates the timing used for the blasts done from 01 June to 05 July. (63 ms between Rows and 9 ms between Holes in a row)
7. Measuring the Ground Vibrations The information in Table 3 provides some important insights. For the first blast on 30 March the optimal delay periods were not known, and there was almost no discernable difference between the EDD and Pyrotechnic sections of the blast in terms of vibration amplitude. For the EDD blasts on 13 April and the 03 May, 23 ms delays were used between holes with 60 ms delays between rows (Figure 6). From 10 May 2005, the delay combination used was 63 ms between rows and between 9 ms and 12 ms between holes in a row (Figure 7 and Figure 8).

The South African Institute of Mining and Metallurgy International Symposium on Stability of Rock Slopes in Open Pit Mining and Civil Engineering André de Jager and Henk Ludik
Page 519
Table 3. Summary of Maximum PPV Amplitudes measured
Blast Date Blast Type
PPV - Pit-wall Side (mm/s)
PPV - North Side (mm/s)
PPV - South Side (mm/s)
PPV - Predicted (mm/s)
Distance (m)
30-Mar EDD 18 17.7 81 30-Mar Pyrotechnic 18 17.7 81 13-Apr EDD 40 57 56.7 40 13-Apr Pyrotechnic 52 56.7 40 03-May EDD 18 46 17.7 81 10-May EDD 11 17.7 81 18-May EDD 8 20 12.5 100 24-May EDD 11 34 17.7 81 27-May EDD 4 8 6.4 150 01-Jun EDD 13 6.4 150 07-Jun EDD 21 10.7 110 09-Jun EDD 5 3.0 240 15-Jun EDD 23 12.5 100 17-Jun Pyrotechnic 47 12.5 100 24-Jun EDD 12 10.7 110
05-Jul EDD 12 1.5 360
The data in table 3 is a summary of the PPV vector sum amplitudes measured for each blast and the locality of each instrument. A predicted value is given according to a standard scaled distance equation1. The data in Table 3 provide the following information:
- For the EDD blasts done subsequent to 30 March 2005, the vibration recorded on the pit-wall west of both blasts was lower than the predicted values. The difference between the predicted and recorded levels increased with the change-over from 23 ms between holes to 12 ms and later 9 ms between holes.
- The vibration generated toward the north-south direction was always higher than the predicted values and higher than the measured values on the west side. This confirms using the model to reduce the energy in the east-west direction and focus it in the north-south direction works.
- Apart from the blast on 30 March, the vibrations for the EDD blasts were significantly lower than the vibrations for equivalent pyrotechnic blasts. This is evident when comparing the pyrotechnic and EDD blasts on 13 April as well as the EDD blast on 18 May with the pyrotechnic blast on 17 June.
1 The scaled distance equation provides an estimate of peak particle velocity based on single hole firing in the blast. It is based on the
distance of the seismograph from the blast and the charge mass fired per delay as follows:
65.1
1143−
⎟⎟⎠
⎞⎜⎜⎝
⎛=W
RPPV
R is the distance from the blast in meters and W is the charge mass per hole in kg. In this case, W was set at an average of 40 kg. A common mistake when trying to control blast-induced vibrations is to reduce the powder factor. By reducing the powder factor holes are overburdened and this can increase vibration levels. This is why the charge mass per hole is important in the PPV equation.

The South African Institute of Mining and Metallurgy International Symposium on Stability of Rock Slopes in Open Pit Mining and Civil Engineering André de Jager and Henk Ludik
Page 520
The measured vibration data therefore indicate an improved drop of between 25 % to 100 % vibration amplitude compared to pyrotechnic blasting. Figure 9 compares the peak particle velocity values obtained from seismographs that were located to the west of the blasts (opposite the eastern pit-wall). As was previously mentioned, for the first blast on 30 March the optimal delay periods were not known, and there was almost no discernable difference between the EDD and Pyrotechnic sections of the blast in terms of vibration amplitude.
Pyro Technic vs. Electronic Dets
0
10
20
30
40
50
60
2005/03/01 2005/04/01 2005/05/01 2005/06/01
Time
PP
V (
mm
/s)
EDD PYRO
Figure 9 - PPV of Pyrotechnic Blasts compared to Electronic Delay Detonator Blasts
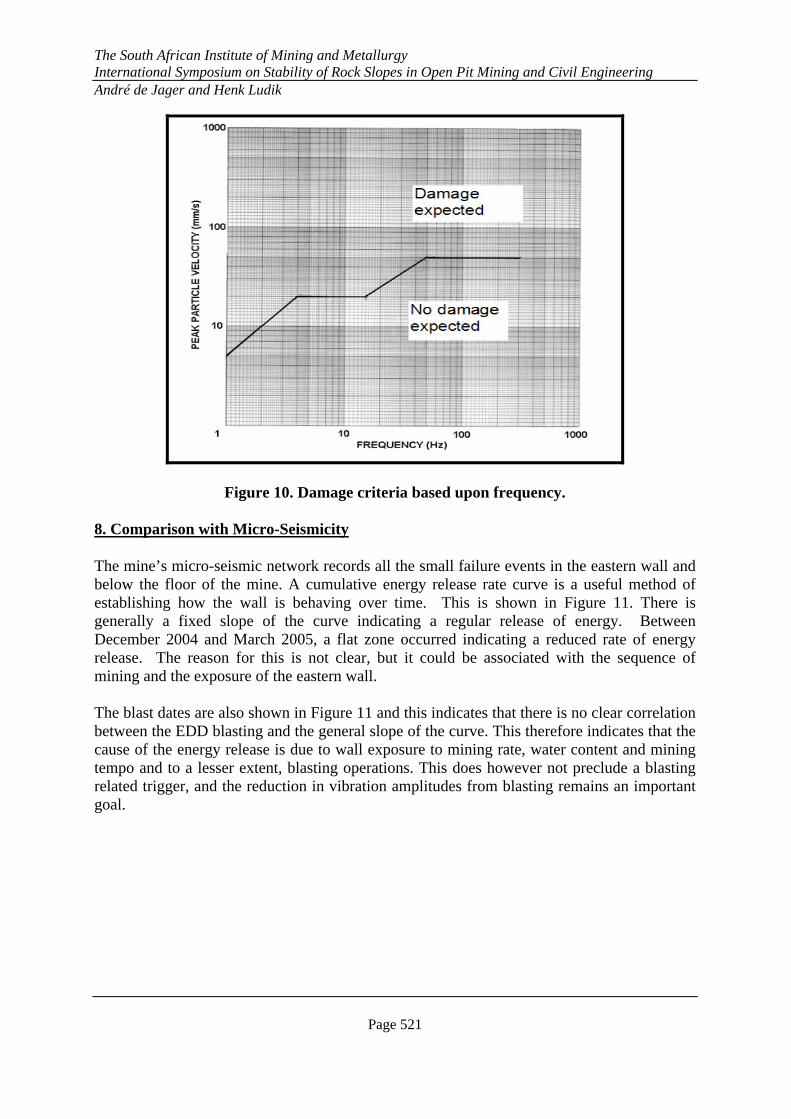
The associated frequency range recorded with the ground vibration was mostly high, with peaks occurring at 50 to 80 Hz. High frequencies are less likely to trigger a slip than lower frequencies, which contain more energy in each cycle at similar amplitudes. The frequency and peak particle velocity relationship is indicated in Figure 10.
The South African Institute of Mining and Metallurgy International Symposium on Stability of Rock Slopes in Open Pit Mining and Civil Engineering André de Jager and Henk Ludik
Page 521
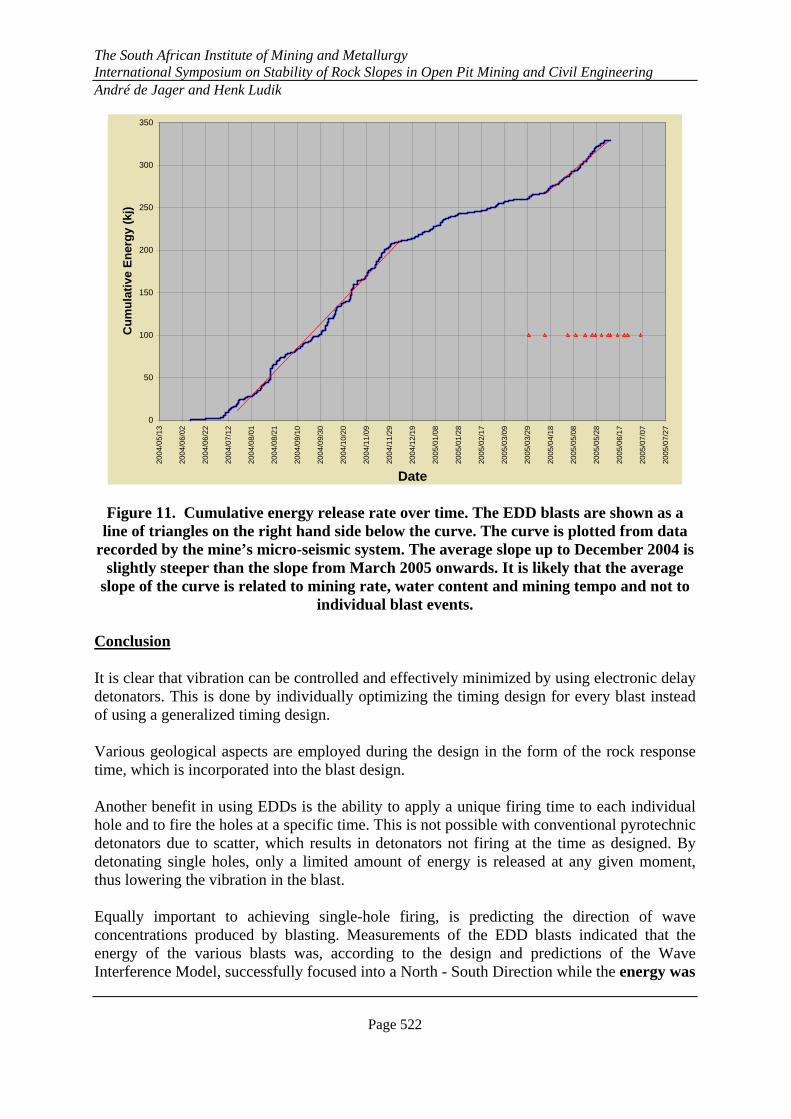
Figure 10. Damage criteria based upon frequency. 8. Comparison with Micro-Seismicity The mine’s micro-seismic network records all the small failure events in the eastern wall and below the floor of the mine. A cumulative energy release rate curve is a useful method of establishing how the wall is behaving over time. This is shown in Figure 11. There is generally a fixed slope of the curve indicating a regular release of energy. Between December 2004 and March 2005, a flat zone occurred indicating a reduced rate of energy release. The reason for this is not clear, but it could be associated with the sequence of mining and the exposure of the eastern wall. The blast dates are also shown in Figure 11 and this indicates that there is no clear correlation between the EDD blasting and the general slope of the curve. This therefore indicates that the cause of the energy release is due to wall exposure to mining rate, water content and mining tempo and to a lesser extent, blasting operations. This does however not preclude a blasting related trigger, and the reduction in vibration amplitudes from blasting remains an important goal.
The South African Institute of Mining and Metallurgy International Symposium on Stability of Rock Slopes in Open Pit Mining and Civil Engineering André de Jager and Henk Ludik
Page 522
0
50
100
150
200
250
300
350
2004
/05/
13
2004
/06/
02
2004
/06/
22
2004
/07/
12
2004
/08/
01
2004
/08/
21
2004
/09/
10
2004
/09/
30
2004
/10/
20
2004
/11/
09
2004
/11/
29
2004
/12/
19
2005
/01/
08
2005
/01/
28
2005
/02/
17
2005
/03/
09
2005
/03/
29
2005
/04/
18
2005
/05/
08
2005
/05/
28
2005
/06/
17
2005
/07/
07
2005
/07/
27
Date
Cu
mu
lati
ve E
ner
gy
(kj)
Figure 11. Cumulative energy release rate over time. The EDD blasts are shown as a line of triangles on the right hand side below the curve. The curve is plotted from data
recorded by the mine’s micro-seismic system. The average slope up to December 2004 is slightly steeper than the slope from March 2005 onwards. It is likely that the average
slope of the curve is related to mining rate, water content and mining tempo and not to individual blast events.
Conclusion It is clear that vibration can be controlled and effectively minimized by using electronic delay detonators. This is done by individually optimizing the timing design for every blast instead of using a generalized timing design. Various geological aspects are employed during the design in the form of the rock response time, which is incorporated into the blast design. Another benefit in using EDDs is the ability to apply a unique firing time to each individual hole and to fire the holes at a specific time. This is not possible with conventional pyrotechnic detonators due to scatter, which results in detonators not firing at the time as designed. By detonating single holes, only a limited amount of energy is released at any given moment, thus lowering the vibration in the blast. Equally important to achieving single-hole firing, is predicting the direction of wave concentrations produced by blasting. Measurements of the EDD blasts indicated that the energy of the various blasts was, according to the design and predictions of the Wave Interference Model, successfully focused into a North - South Direction while the energy was
The South African Institute of Mining and Metallurgy International Symposium on Stability of Rock Slopes in Open Pit Mining and Civil Engineering André de Jager and Henk Ludik
Page 523
minimized in an East - West direction. This correlates with the planned energy dispersion model. Navachab have decided to continue using electronic detonators until the bottom of the pit has been reached. This will be the safest method to employ, whilst blasting continues in close proximity of the unsafe eastern pit-wall. Acknowledgement We would like to express our appreciation to Anglo Gold, Ashanti for allowing us the opportunity to conduct the exercises and tests during the EDD blasts done at Navachab Gold Mine and permission to publish and present this paper. The data gathered and processed during the twelve week period allowed us to develop current blasting practices up the point where a vast improvement in blast generated levels was noticeable at the critical areas surrounding the current mining area. References Keyter G J, 2001, “Report on the March 2001 failure on the footwall at Navachab Gold Mine”, SRK Consulting Engineers and Scientists, Report No. 291783 by Keyter G J reviewed by Terbrugge P J. Rorke A J, 2004, “Wave interference patterns as a means of predicting vibration concentrations from blasting”, The 12th BME Annual Conference on Explosives, Drilling and Blasting Technology, 4 November 2004.

The South African Institute of Mining and Metallurgy International Symposium on Stability of Rock Slopes in Open Pit Mining and Civil Engineering André de Jager and Henk Ludik
Page 524


![Ashanti Empire - Saylor Academy · 2018-11-28 · Ashanti Empire 2- 1874 [2] est. 3000000 Density 11.6 /km2 (30 /sq mi) The Ashanti Empire or Asante Empire, also known as the Ashanti](https://static.fdocuments.us/doc/165x107/5e934e74130da90356229c1d/ashanti-empire-saylor-academy-2018-11-28-ashanti-empire-2-1874-2-est-3000000.jpg)