High Temperature Steam Oxidation Testing of Candidate ...
51
ORNL/TM-2013/540 High Temperature Steam Oxidation Testing of Candidate Accident Tolerant Fuel Cladding Materials December 23, 2013 Prepared by Bruce A. Pint and Kurt A. Terrani (ORNL) Andrew Nelson, Scott Parker and Adam Parkison (LANL)
Transcript of High Temperature Steam Oxidation Testing of Candidate ...

ORNL/TM-2013/540
High Temperature Steam Oxidation Testing of Candidate Accident Tolerant Fuel Cladding Materials
December 23, 2013 Prepared by Bruce A. Pint and Kurt A. Terrani (ORNL) Andrew Nelson, Scott Parker and Adam Parkison (LANL)

DOCUMENT AVAILABILITY Reports produced after January 1, 1996, are generally available free via the U.S. Department of Energy (DOE) Information Bridge. Web site http://www.osti.gov/bridge Reports produced before January 1, 1996, may be purchased by members of the public from the following source. National Technical Information Service 5285 Port Royal Road Springfield, VA 22161 Telephone 703-605-6000 (1-800-553-6847) TDD 703-487-4639 Fax 703-605-6900 E-mail [email protected] Web site http://www.ntis.gov/support/ordernowabout.htm Reports are available to DOE employees, DOE contractors, Energy Technology Data Exchange (ETDE) representatives, and International Nuclear Information System (INIS) representatives from the following source. Office of Scientific and Technical Information P.O. Box 62 Oak Ridge, TN 37831 Telephone 865-576-8401 Fax 865-576-5728 E-mail [email protected] Web site http://www.osti.gov/contact.html
This report was prepared as an account of work sponsored by an agency of the United States Government. Neither the United States Government nor any agency thereof, nor any of their employees, makes any warranty, express or implied, or assumes any legal liability or responsibility for the accuracy, completeness, or usefulness of any information, apparatus, product, or process disclosed, or represents that its use would not infringe privately owned rights. Reference herein to any specific commercial product, process, or service by trade name, trademark, manufacturer, or otherwise, does not necessarily constitute or imply its endorsement, recommendation, or favoring by the United States Government or any agency thereof. The views and opinions of authors expressed herein do not necessarily state or reflect those of the United States Government or any agency thereof.
ORNL/TM-2013/540
Materials Science and Technology Division
HIGH TEMPERATURE STEAM OXIDATION TESTING OF CANDIDATE ACCIDENT TOLERANT FUEL CLADDING
MATERIALS
Author Bruce A. Pint (865) 576-2897
Co-Author Kurt A. Terrani Andrew Nelson
Scott Parker Adam Parkison
Date Published: December 2013
Prepared by OAK RIDGE NATIONAL LABORATORY
Oak Ridge, Tennessee 37831-6283 managed by
UT-BATTELLE, LLC for the
U.S. DEPARTMENT OF ENERGY under contract DE-AC05-00OR22725


iii
CONTENTS
Page LIST OF FIGURES .................................................................................................................................v ACKNOWLEDGMENTS .................................................................................................................... vii ABSTRACT ............................................................................................................................................1 1. INTRODUCTION ............................................................................................................................3 2. BACKGROUND ..............................................................................................................................5 3. EXPERIMENTAL PROCEDURE ...................................................................................................9 4. RESULTS .......................................................................................................................................14
4.1 ORNL SEVERE ACCIDENT TEST STATION ..................................................................14 4.1.1 Fe-Cr Evaluations ....................................................................................................14 4.1.2 Fe-Cr-Al Evaluations ...............................................................................................15 4.1.3 SiC Evaluations ........................................................................................................17 4.1.4 General Electric Experiments ..................................................................................21
4.2 LANL RESULTS ..................................................................................................................22 4.2.1 Performance of Commercial Alloys in Steam at High Temperature .......................22 4.2.2 Oxidation of Molybdenum in Water Vapor .............................................................26 4.2.3 Determination of Hydrogen Generation using STA ...............................................28
5. SUMMARY ....................................................................................................................................35 6. FUTURE WORK ............................................................................................................................37 7. REFERENCES ...............................................................................................................................39

v
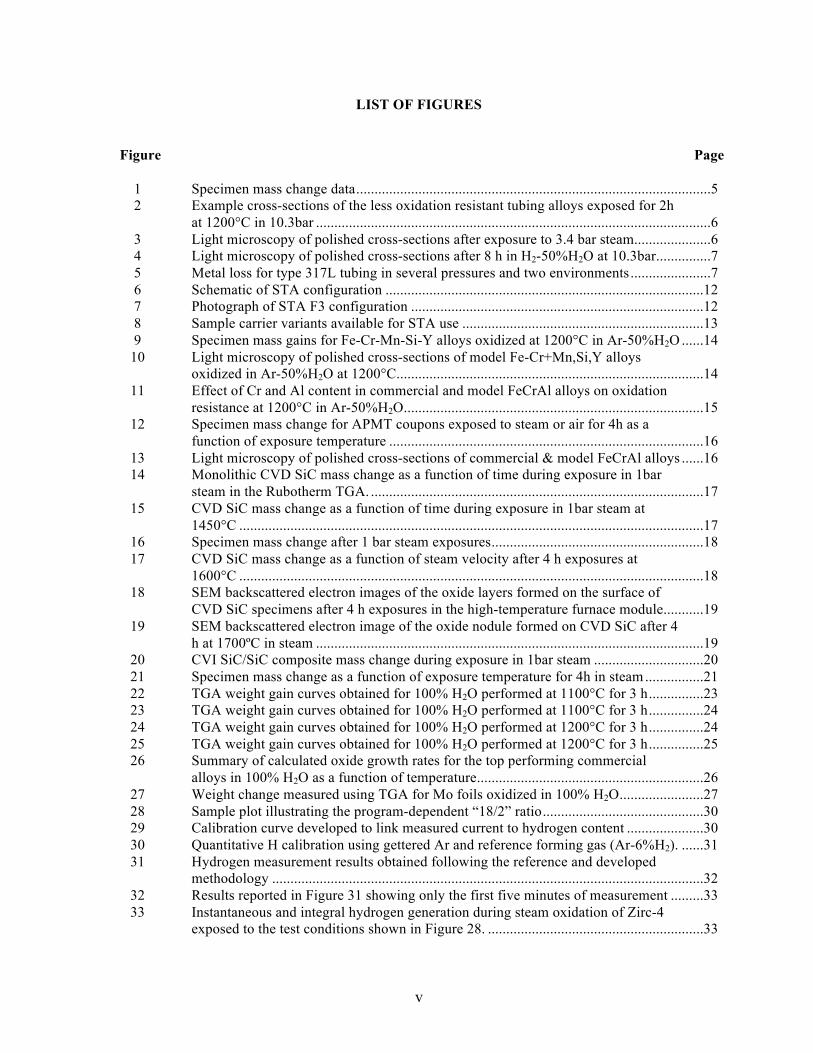
LIST OF FIGURES
Figure Page 1 Specimen mass change data .................................................................................................5 2 Example cross-sections of the less oxidation resistant tubing alloys exposed for 2h
at 1200°C in 10.3bar ............................................................................................................6 3 Light microscopy of polished cross-sections after exposure to 3.4 bar steam .....................6 4 Light microscopy of polished cross-sections after 8 h in H2-50%H2O at 10.3bar ...............7 5 Metal loss for type 317L tubing in several pressures and two environments ......................7 6 Schematic of STA configuration .......................................................................................12 7 Photograph of STA F3 configuration ................................................................................12 8 Sample carrier variants available for STA use ..................................................................13 9 Specimen mass gains for Fe-Cr-Mn-Si-Y alloys oxidized at 1200°C in Ar-50%H2O ......14 10 Light microscopy of polished cross-sections of model Fe-Cr+Mn,Si,Y alloys
oxidized in Ar-50%H2O at 1200°C ....................................................................................14 11 Effect of Cr and Al content in commercial and model FeCrAl alloys on oxidation
resistance at 1200°C in Ar-50%H2O ..................................................................................15 12 Specimen mass change for APMT coupons exposed to steam or air for 4h as a
function of exposure temperature ......................................................................................16 13 Light microscopy of polished cross-sections of commercial & model FeCrAl alloys ......16 14 Monolithic CVD SiC mass change as a function of time during exposure in 1bar
steam in the Rubotherm TGA. ...........................................................................................17 15 CVD SiC mass change as a function of time during exposure in 1bar steam at
1450°C ...............................................................................................................................17 16 Specimen mass change after 1 bar steam exposures ..........................................................18 17 CVD SiC mass change as a function of steam velocity after 4 h exposures at
1600°C ...............................................................................................................................18 18 SEM backscattered electron images of the oxide layers formed on the surface of
CVD SiC specimens after 4 h exposures in the high-temperature furnace module ...........19 19 SEM backscattered electron image of the oxide nodule formed on CVD SiC after 4
h at 1700ºC in steam ..........................................................................................................19 20 CVI SiC/SiC composite mass change during exposure in 1bar steam ..............................20 21 Specimen mass change as a function of exposure temperature for 4h in steam ................21 22 TGA weight gain curves obtained for 100% H2O performed at 1100°C for 3 h ...............23 23 TGA weight gain curves obtained for 100% H2O performed at 1100°C for 3 h ...............24 24 TGA weight gain curves obtained for 100% H2O performed at 1200°C for 3 h ...............24 25 TGA weight gain curves obtained for 100% H2O performed at 1200°C for 3 h ...............25 26 Summary of calculated oxide growth rates for the top performing commercial
alloys in 100% H2O as a function of temperature ..............................................................26 27 Weight change measured using TGA for Mo foils oxidized in 100% H2O .......................27 28 Sample plot illustrating the program-dependent “18/2” ratio ............................................30 29 Calibration curve developed to link measured current to hydrogen content .....................30 30 Quantitative H calibration using gettered Ar and reference forming gas (Ar-6%H2). ......31 31 Hydrogen measurement results obtained following the reference and developed
methodology ......................................................................................................................32 32 Results reported in Figure 31 showing only the first five minutes of measurement .........33 33 Instantaneous and integral hydrogen generation during steam oxidation of Zirc-4
exposed to the test conditions shown in Figure 28. ...........................................................33


vii
ACKNOWLEDGMENTS
The experimental work at ORNL was conducted by M. Howell, A. Willoughby, M. Stephens, T. Lowe, D. Leonard, H. Longmire, J. Mayotte and T. Jordan. S. J. Pawel and S. Dryepondt provided useful comments on the manuscript. This research was funded by the U.S. Department of Energy’s Office of Nuclear Energy, Advanced Fuel Campaign of the Fuel Cycle R&D program


1
ABSTRACT
The Fuel Cycle Research and Development (FCRD) program’s Advanced Fuels Campaign has
initiated a multifold effort aimed at facilitating development of accident tolerant fuels in order to overcome the inherent shortcomings of light water reactor (LWR) fuels when exposed to beyond design basis accident conditions. The campaign has invested in development of experimental infrastructure within the Department of Energy complex capable of chronicling the performance of a wide range of concepts under prototypic accident conditions. This report summarizes progress made at Oak Ridge National Laboratory (ORNL) and Los Alamos National Laboratory (LANL) in FY13 toward these goals. Alternative fuel cladding materials to Zircaloy for accident tolerance and a significantly extended safety margin requires oxidation resistance to steam or steam-H2 environments at ≥1200°C for short times.
At ORNL, prior work focused attention on SiC, FeCr and FeCrAl as the most promising candidates for further development. Also, it was observed that elevated pressure and H2 additions had minor effects on alloy steam oxidation resistance, thus, 1 bar steam was adequate for screening potential candidates. Commercial Fe-20Cr-5Al alloys remain protective up to 1475°C in steam and CVD SiC up to 1700°C in steam. Alloy development has focused on Fe-Cr-Mn-Si-Y and Fe-Cr-Al-Y alloys with the alumina-forming alloys showing more promise. At 1200°C, ferritic binary Fe-Cr alloys required ≥25% Cr to be protective for this application. With minor alloy additions to Fe-Cr, more than 20%Cr was still required, which makes the alloy susceptible to α’ embrittlement. Based on current results, a Fe-15Cr-5Al-Y composition was selected for initial tube fabrication and welding for irradiation experiments in FY14. Evaluations of chemical vapor deposited (CVD) SiC were conducted up to 1700°C in steam. The reaction of H2O with the alumina reaction tube at 1700°C resulted in Al(OH)3 formation, which reacted with the specimen to form a liquid reaction product. This behavior was not observed at lower temperatures where gas velocity and H2O content showed typical effects on the reaction rate.
For LANL, the capabilities for oxidation testing as well as exploration of a methodology for measurement of hydrogen production of samples during oxidation under water vapor atmospheres is discussed. Results obtained for available commercial alloys are summarized, and data highlighting the performance of molybdenum, a recently proposed cladding material, are presented. Finally, leveraging of these techniques in conjunction with current and companion FCRD programs is discussed with respect to work in FY14.

2

3
1. INTRODUCTION
Severe or beyond design basis accident (BDBA) scenarios in light water reactors (LWR), such as the station blackout events in three units at the Fukushima Daiichi power plant in March 2011 [1], require new materials solutions to provide larger safety margins and potentially avoid severe core degradation. For conventional Zr alloy (e.g. Zircaloy)/UO2 fuel rods, the increase in temperature when the rods become uncovered causes a well-known rapid oxidation behavior [2-4]. At temperatures above ~1200ºC, the self-catalytic enthalpy production from the Zr alloy cladding oxidation significantly adds to the heat production rate in the core [5] and produces significant quantities of hydrogen. A cladding material that could maintain a low oxidation rate for several hours at ≥1200°C in steam (e.g. 2 orders of magnitude lower than Zr alloys) would likely enhance safety margins during a BDBA. Of course, the steady-state performance during normal operation must be similar to the current fuel system.
Alternative material solutions include more oxidation-resistant metals or ceramic fuel claddings, such as SiC composites [6-7]. A SiC cladding could provide protection at >1700°C, however, ceramics are inherently brittle and difficult to fabricate into fuel rods. Another strategy is to reconsider Fe-base alloy claddings that were previously used in LWRs [8]. One obvious drawback is the neutronics penalty during normal operation compared to Zr-base alloys [9]. A broad-based study was begun to identify candidate alloys capable of forming protective thermally-grown oxide scales at temperatures of ≥1200°C for relatively short (<24 h) periods to simulate BDBA conditions. The results of this initial study, which identified the most promising alloy candidates and relevant experimental conditions for screening performance [10-12], are briefly described in the next section to provide the motivation for the current work.
One of the primary points of emphasis that has emerged in the recent drive to develop LWR accident tolerant fuel systems has been the development of solutions that reduce hydrogen production during accident scenarios, which was a key aspect of the accidents at both Three Mile Island and Fukushima Daiichi. It is well understood that the reaction of Zircaloy with water vapor follows the below reaction:
Zr(s) + 2H2O(g) è ZrO2 (s)+ 2H2(g) As the zirconium cladding oxidizes and loses mechanical strength, it rapidly loses its ability to
provide a hermetic seal around the fuel and radioactive elements within. However, the more immediate concern to reactor integrity is not this process, but rather the hydrogen gas that is rapidly produced by the reaction. At Three Mile Island the hydrogen gas production was not high enough to cause containment failure, but the reactors at Fukushima were not so fortunate.
The Fuel Cycle Research and Development (FCRD) program has thus initiated a multifold effort aimed at facilitating development of accident tolerant fuels, including the development of experimental infrastructure for evaluating potential solutions under simulated BDBA conditions. This report summarizes progress made at ORNL and LANL in FY13 toward these goals. Recent results from the past year include high temperature steam oxidation of wrought, cast and oxide dispersion strengthened (ODS) Fe-Cr and Fe-Cr-Al alloys as well as results for Mo and CVD SiC, the latter as a model system for a variety of composites and hybrid systems. In addition, a methodology for measurement of hydrogen production of samples during oxidation under water vapor atmospheres is discussed. Significantly more experimental work is still needed to identify, evaluate and develop a new cladding material with greater BDBA tolerance. Finally, leveraging of these experimental techniques in conjunction with current and companion FCRD programs is discussed with respect to work in FY14.

4

5
2. BACKGROUND Figure 1 summarizes many of the initial specific mass gain observations after 8 h exposures in 3.4 bar
steam as a function of exposure temperature and alloy Cr content at 1200°C. Mass gains for Zircaloy-2 are shown in Figure 1a for reference and are consistent with prior observations [2-4]. Conventional 18-8 stainless steels (i.e. types 304L, 321, 347L) all performed similarly in these experiments [12] and only 304L is shown for reference. While mass change is convenient to screen a large number of candidate specimens, it can be misleading due to scale spallation. For example, 304L showed a mass loss at 1000°C because of scale spallation, Figure 1a. (The mass gain for an adherent surface oxide is the uptake mass of oxygen while the mass loss for oxide spallation includes the heavier metal cations.) Example metal loss [10] measurements will be shown later. On the other extreme, mass changes for CVD SiC were very low but also complicated by the competing mechanisms of oxidation accelerated by the presence of H2O and volatilization of Si(OH)4 [14,15]. The behavior of conventional chromia-forming ferritic alloys are represented by Fe-25Cr and AL294C (see Table 2) and low mass gains are shown for alumina-forming Kanthal APMT® (Advanced Powder Metallurgy Tube) [16] up to 1350°C.
Figure 1a shows that many of the oxidation-resistant alloys performed similarly at 800° and 1000°C but differentiated more by 1200°C. Thus, Figure 1b focuses on the results at 1200°C for a wider range of alloys and compositions as a function of alloy Cr content. For model binary Fe-Cr alloys, 25%Cr was needed to form a protective Cr2O3 scale at this temperature. At lower Cr contents, the mass gain was greatly increased by the rapid formation of Fe-rich oxide nodules [11]. Ternary Fe-20Cr-Ni alloys illustrated the benefit of higher Ni contents on improving oxidation resistance. However, Ni is not generally desirable for fuel claddings because of its high thermal neutron absorption cross-section (almost twice that of Fe) and formation of radioactive Co (through 58N(n,p)58Co reaction with fast neutrons) in the core [5]. Other elements besides Ni can improve the oxidation resistance of austenitic steels; an example is shown with Mn, Si and a “reactive” element (RE) addition [17-19] of La. The low mass gain of APMT also is shown in Figure 1b but leaner FeCrAl compositions with 13%Cr and 3-4%Al alloys performed poorly. These alloys are of potential interest because they are easier to fabricate and join than typical Fe-20Cr-5Al alloys.
Figures 2-4 provide examples of the reaction products formed in these environments. Figure 2 provides some examples of rapidly oxidized specimens after only 2h at 1200°C in 10.3 bar steam. Only a thin strip of metal remains for a Zircaloy-2 tube specimen and a very thick oxide formed on a P91
a b Figure 1. Specimen mass change data (a) after 8h exposures in 3.4 bar steam as a function of
temperature and (b) as a function of Cr content after 8h at 1200°C in 3.4 bar steam. Additional data is included in (a) for 6.9bar H2-50%H2O for APMT (dashed line). Adapted from Ref. 11.

6
Figure 2. Example cross-sections of the less oxidation resistant tubing alloys exposed for 2h at
1200°C in 10.3bar (150psi) including (a) Zircaloy 2, (b) Grade 91 pipe (P91) and (c) type 304L stainless steel. The initial tubing wall thickness is noted.
coupon, Figures 2a and 2b. Figure 2c shows the significant section loss of the 304L tube specimen and the thick oxide retained on the inside diameter but spalled from the outer surface. The 304L reaction rate in steam was consistent with a previous study [20]. In contrast to Figure 2, Figure 3 shows higher magnification images of some of the more oxidation-resistant materials at 1200°-1350°C in 3.4 bar steam. Figure 3a and 3b illustrate the slower growth rate of α-Al2O3 (parabolic rate constant of ~3 x 10-12 g2/cm4s) compared to Cr2O3 (3 x 10⁻¹⁰ g2/cm4s) under these conditions [11]. The E-Brite alloy formed an incomplete layer of SiO2 at the metal-oxide interface (identified by EPMA), which apparently did not slow the chromia scale growth rate [11]. Figure 3c shows that APMT continued to form a relatively thin Al2O3 external scale even after 8h at 1350°C. At both temperatures, the alumina scale forms a solid-state diffusion barrier that limits the oxidation rate to ionic diffusion (mainly anions) through this oxide layer, which is relatively inert to the presence of steam [14]. The RE additions of Y and Hf in this alloy (Table 2) are essential to the good scale adhesion observed [17,18]. The thin SiO2 layer formed on CVD SiC at 1350°C is shown in Figure 3d. The remaining layer thickness is affected by the gas velocity, which influences Si(OH)4 volatilization [15]. Figure 4 gives some examples for ODS alloys ODM401 [21] and PM2000 exposed for 8h in H2-50%H2O at 10.3 bar. Figures 4a and 4b show the very thin oxides formed on chromia-forming ODM401 at 800° and 1000°C, respectively. However, at 1200°C, this material
Figure 3. Light microscopy of polished cross-sections after exposure to 3.4 bar steam
(a) E-Brite after 48h at 1200°C, (b) APMT after 48h at 1200°C, (C) APMT after 8h at 1350°C and (d) CVD SiC after 8h at 1350°C.

7
Figure 4. Light microscopy of polished cross-sections after exposure for 8 h in H2-50%H2O at
10.3bar at (a) 800°C, (b) 1000°C and (c-e) 1200°C for (a-c) alloy ODM401 (ODS Fe-14Cr), (d) PM2000 (ODS FeCrAl) and (e) 125µm thick PM2000 foil. could not maintain a protective Cr2O3 scale with only 14%Cr. In contrast, a 1.5mm thick coupon of PM2000 formed a protective Al2O3 scale at 1200°C, Figure 4d, very similar to APMT. Figure 4e demonstrates that a similar thin scale formed on a 125µm thick PM2000 foil exposed in the same conditions. One strategy to reduce the neutronics penalty for Fe-base alloys is to reduce the cladding thickness [5]. A thin-walled FeCrAl cladding should not affect the oxidation resistance.
In order to determine the effect of total pressure and H2 in the environment on oxidation behavior, several different conditions were explored. For the most oxidation resistant materials, there appeared to be little change with higher pressure and the addition of H2. For example, the dashed line for APMT in Figure 1a shows the minor effect of higher total pressure with the addition of H2. A more significant effect of pressure was observed for the lower alloyed steels. Figure 5 summarizes one data set for 317L tubing as a function of temperature and as a function of time at 1200°C [10,11]. (More highly alloyed 317L performed better than the other stainless steels tubes that were quickly consumed at 1200°C, but still cannot be considered protective at 1200°C.) While there was little effect of environment at 800° and 1000°C, the high mass gains at 1200°C suggest 317L did not form a protective scale at this temperature. Increased steam partial pressure appeared to accelerate the rate of metal loss at 1200°C. At 10.3 bar (150psi), switching from 100% H2O to H2-50%H2O decreased the maximum metal loss suggesting that the reaction rate is dominated by the steam partial pressure without any significant effect of the presence of H2 [11].
a b Figure 5. Metal loss for type 317L tubing in several pressures and two environments (a) as a function
of temperature for 8h exposures and (b) as a function of time at 1200°C. Adapted from Ref. 11.

8
Based on these results, the two most promising alloy systems for further investigations were Fe-Cr and Fe-Cr-Al. In addition, SiC continues to be an intriguing candidate. Higher alloyed Fe-base austenitic steels such as type 310 or alloy 120 are protective in steam above 1200°C, however, Ni is not a desirable alloy addition for this application. The experimental results also suggested that 1200°C was a good starting temperature for steam evaluations and that it was not necessary to screen at high pressure–the most oxidation resistant coatings were not affected by pressure or H2.

9
3. EXPERIMENTAL PROCEDURE
Table 1 provides an overview of the ORNL equipment available for this work and a summary of the equipment capabilities. The ex-cell high temperature furnace (EHTF) came on line in September 2012 with steam testing capabilities up to 1700°C test temperature with 100% steam (designated as H2O in Table 1). The Rubotherm thermal gravimetric analysis module came on line in December 2012. More information on the Severe Accident Test Station (SATS) modules is provided elsewhere [13]
Model binary and ternary alloys were cast by arc-melting in inert (Ar) gas and drop cast into water-cooled copper molds. All of the Fe-Cr and some of the Fe-Cr-Al alloys were hot rolled after casting to break up the cast structure. These alloys are referred to by their nominal composition. Representative actual compositions are given in Table 2. Coupons of Rohm & Haas chemical-vapor-deposited (CVD) SiC were evaluated as a baseline for various SiC composites.
Oxidation exposures at 1 bar pressure used (1) a Cahn model 1000 TGA microbalance and air or Ar-50%H2O at 1200°C and a quartz reaction tube or (2) a Rubotherm TGA with 100% steam at temperatures up to 1500°C and an alumina reaction tube or (3) a test rig developed for up to 1700°C exposures with air or 100% steam (~50 cm/s) with an alumina reaction tube and a single specimen that was held with an alumina pin. In test rigs #1 and #3, the gas flowed from the bottom to the top of the tube, while the gas flowed down over the specimen in #2. New alloy compositions were initially screened for 4-24h in TGA #1 with Ar-50%H2O. Specimen mass change before and after exposure was measured using a Mettler-Toledo model XP205 balance with ±0.01mg/cm2 accuracy. After exposure, specimens were metallographically sectioned and examined by light microscopy to determine section loss, oxide thickness and oxide morphology. In some cases, the specimens were Cu-plated prior to mounting to protect the surface reaction product. Additional characterization included electron microprobe analysis (EPMA).
Table 1. Summary of SATS Capabilities
Equipment Max. Temp. (°C)
Heating Rate (°C/min)
Gas Environment
Pressure (bar)
Sample Specifications
Ex-Cell High Temp. Furnace
1700°C 10; max 25 H2O/H2-H2O (flexible)
1 3mm hole needed Max. 5x20x30mm
Rubotherm TGA 1550°C 30; max 50 H2O/H2-H2O (flexible)
1 Max. 5g Max. 15x20mm
Cahn TGA 1200°C 100-125 Ar-50%H2O (not 100% H2O)
1 Max. 5g Max. 15x20mm
Keiser Rig 1500°C 10 H2O/H2-H2O (flexible)
1-30 Max. 50mm length/width
At LANL, two separate pieces of equipment are available for experimental determination of the
oxidation kinetics of candidate cladding materials in the Fuels Research Laboratory (FRL). Both combine the capability for TGA with differential scanning calorimetry (DSC) to analyze the response of materials under water vapor-containing environments at temperatures from ambient to 1250°C. The coupled techniques are referred to as simultaneous thermal analysis (STA). Differential scanning calorimetry can be used to augment the in-situ mass change TGA capability to provide energetics of the various reactions a material may experience under the provided thermochemical stimuli. For example, conventional zirconium alloys are well known to exasperate the environment of a BDBA due to the temperature increase provided initially by the enthalpy of oxidation and even more significantly due to the energy liberated during zirconium hydriding at extreme temperatures. These responses are well understood, but transition to advanced cladding materials may bring about similar or as yet unknown energetic reactions at high temperatures. The ability of STA to explore both kinetics and energetics provides an important capability for characterization of advanced cladding materials.

10
Table 2. Alloy compositions (mass %) determined by inductively coupled plasma & combustion analyses
Alloy Fe Zr Ni Cr Al Mo Mn Si C O S† Other
Zircaloy-2 0.14 98.1 0.05 0.10 - - - 0.01 0.019 0.115 < 1.42Sn
304L 70.3 - 8.27 18.8 0.01 0.27 0.73 0.42 0.028 0.006 <
317L 64.2 - 11.86 18.9 - 3.13 0.62 0.38 0.023 0.006 10
321 69.9 - 9.47 17.7 0.03 0.24 1.14 0.45 0.033 0.003 40
347 68.9 - 9.97 17.5 - 0.16 1.80 0.66 0.040 0.007 150
310SS 51.9 < 19.5 25.4 0.13 1.89 0.70 0.044 0.006 10 0.15Co,0.1Cu
AL6XN 48.2 24.1 20.4 0.01 5.98 0.50 0.05 0.012 0.003 < 0.2N,0.3Cu
Fe20Cr20Ni 60.1 < 20.1 19.7 < < < 0.01 0.001 0.042 41
Fe20Cr20Ni+ 57.9 < 19.9 20.2 0.03 < 1.61 0.22 0.001 0.003 < 0.12La
Fe20Cr25Ni 55.4 < 24.8 19.5 < < < < 0.002 0.043 45
HR120 35.0 < 37.6 24.7 0.09 0.28 0.73 0.24 0.059 0.003 < 0.61Nb,0.2Cu
T/P91 88.7 < 0.16 8.75 0.03 0.98 0.46 0.28 0.102 0.004 30 0.46Nb,0.24V
Fe-15Cr 85.1 - < 14.8 < < < < 0.003 0.004 20
Fe-20Cr 80.3 - < 19.7 < < < 0.01 0.002 0.003 15
Fe-25Cr 74.6 - - 25.3 - - - 0.02 0.004 0.037 10
Fe22CrMnSiY 76.6 < < 22.5 0.01 < 0.23 0.71 0.003 0.002 29 0.002Y
Fe10Cr5AlY 85.2 < < 10.0 4.8 < < < 0.005 0.001 13 0.038Y
Fe13Cr4Al 83.3 < < 12.9 3.8 < < < 0.003 0.002 31 <3ppmY
Fe15Cr3AlY 82.1 < < 15.0 2.9 < < < 0.005 0.001 16 0.007Y
Fe15Cr5AlY 76.6 < < 15.0 5.0 < < 0.01 0.004 0.001 12 0.033Y
ODM401 83.9 0.001 0.13 14.0 0.06 0.30 0.04 0.04 0.013 0.191 52 0.21Y,1.0Ti
14YWT 83.8 < 0.03 13.2 0.02 < 0.06 0.04 0.065 0.173 40 .24Ti,1.9W,.2Y
E-Brite 72.6 0.13 25.8 1.00 < 0.22 0.003 0.003 100 0.1Nb,0.1V
AL294C 66.1 0.19 28.6 0.07 3.70 0.21 0.27 0.017 0.002 < 0.3Nb,0.37Ti
Alloy 33* 32 31 33 1.6
PM2000 74.6 - 0.1 18.9 5.1 0.01 0.11 0.04 0.01 0.25 8 0.37Y,0.45Ti
APMT 69.0 0.10 0.12 21.6 4.93 2.77 0.10 0.53 0.030 0.049 < 0.12Y,0.16Hf
MA956 74.2 < 0.08 20.0 4.53 < 0.08 0.07 0.015 0.20 25 0.37Ti,0.4Y
Alkrothal720 81.4 0.06 0.12 13.0 4.2 < 0.44 0.30 0.034 0.002 15 0.44Ti,<3ppmY
Alkrothal 14 80.3 0.12 0.11 14.7 4.2 < 0.20 0.17 0.029 < 14 0.01Ti,<3ppmY
Alkrothal 3 82.7 0.09 < 13.4 3.3 < 0.20 0.22 0.027 < 12 0.02Ti,<3ppmY
Ohmaloy30 82.8 < 0.58 12.6 2.60 0.05 0.41 0.26 0.017 < <3 0.34Ti,0.1V
Ohmaloy40 81.7 < 0.53 12.7 3.59 0.10 0.37 0.22 0.021 < <3 0.34Ti,0.13V
CVD-SiC - - 0.01 - - - - 69.8 30.2 0.003 < -
Notes: < denotes below the detectable limit of 0.01% or 0.001% for interstitials; † in wppm * nominal values

11
Both STA instruments available at LANL were manufactured by Netzsch Instruments of Selb, Germany. The initial instrument (STA449 F1) was purchased in 2010. The equipment is authorized for characterization of depleted uranium and thorium containing samples, and has been used by the Advanced Fuels Campaign (AFC) extensively for determination of thermochemical potentials as well as investigation of the oxidation kinetics of reference uranium dioxide, surrogate mixed oxide fuels (e.g. uranium-cerium mixed oxides), and advanced fuels such as uranium nitride and uranium silicides. In addition to the temperatures accessible using the water vapor furnace as described above, silicon carbide, graphite, and tungsten furnaces provide the capability to perform STA to temperatures in oxidizing (1700°C) or inert/reducing environments (2400°C). The inability of these furnaces to handle water vapor precludes them from being directly applicable to BDBA testing, but they do offer the opportunity to study solid-state reactions of candidate cladding materials with reference (UO2) or candidate (UN, UxSiy) LWR fuels. The STA449 F1 is capable of a balance resolution of 0.010 µg, although in practice this resolution is many orders of magnitude lower than that needed to resolve oxidation kinetics.
The second STA available in the FRL is similar to the first unit, but carries the ‘F3’ designation denoting a lower balance resolution. The STA449 F3 is capable of 1 µg resolution as it features a mechanical balance opposed to the electromagnetic balance available in the F1. As stated, this offers resolution that remains insignificant compared to the typical noise of a water vapor experiment. The F3 is anticipated to serve as the primary STA to explore cladding materials’ response to representative BDBA environments.
The final addition available on both instruments is an inline mass spectrometer that can be utilized to sample the gas composition of the furnace exhaust produced during experimentation. This feature provides a unique capability: gaseous species evolved by changes to sample chemistry during STA can be observed in conjunction with mass changes and energetics. With respect to BDBA testing, the key specie that would be of extreme relevance is hydrogen. The methodology in development for determination of hydrogen production during sample oxidation in water vapor environments to high accuracy is detailed extensively in Section 4.2.3 in this document.
The key limitation of evolved gas analysis coupled with STA is the temperatures at which the reaction products can be maintained. In the case of the current configuration, all exhaust tubes and fixturing is maintained at 250°C. The capillary tube leading to the mass spectrometer itself is also kept at this temperature. This provides significant margin to avoid condensation of water vapor. However, species of interest that may volatilize under the test condition but condense between the test condition and roughly 250°C will precipitate and be absent from the mass spectrometer signal. A convenient example of this is UO3, which readily volatilizes from urania samples in even moderately oxidizing atmospheres (~100 ppm O2) at temperatures above 1400°C. While this loss can be easily observed in the STA, it will condense below 1000°C on any surface available and is thus not observed in the mass spectrometer. The same limitation will be present if volatile species are encountered during BDBA testing.
Figures 6 and 7 highlight the STA configurations used for the testing summarized in this report. Figure 6 displays a schematic of the system, with numerous features highlighted that can also be viewed in the photograph of Figure 7. The water vapor generator and secondary gas generator can be used simultaneously to deliver a test gas to the sample containing water vapor and up to three additional gases. The vapor can also be diluted using only gettered argon, which is ultra-high-purity (UHP) argon that is passed through a heated copper charge to remove the majority of the small quantity of residual oxygen. The oxygen level in the gettered argon is maintained at lower than 10-16 ppm. This allows the effect of water vapor partial pressure (PH2O) on oxidation kinetics to be investigated without concern over the possible contributions of oxygen impurities. This is an important feature of the system, as it does provide means to predict response of candidate materials to pressures considerably higher than the approximately 0.8 atm of ambient conditions at Los Alamos. A linear, quadratic, square root, or other dependence of oxidation kinetics observed at 0.4, 0.6, and 0.8 atm is strongly indicative of its performance when water

12
vapor pressures are extended to several atm. This does not eliminate the need for testing under these conditions at companion high-pressure facilities at ORNL or elsewhere in the complex, but rather provides access to an important variable governing the fundamental response of materials to oxidizing environments.
Figure 6. Schematic of STA configuration. Triangles with letters provide a reference to locations shown in
photograph of Figure 7.
Figure 7. Photograph of STA F3 configuration. Triangles in letters show position of key components of the
system identified in Figure 6: vapor generator (A), gas getter and secondary mass flow controllers (not visible)(B), transfer line (C), furnace (D), and mass spectrometer capillary snorkel (E). The sample is contained
inside the furnace.
13
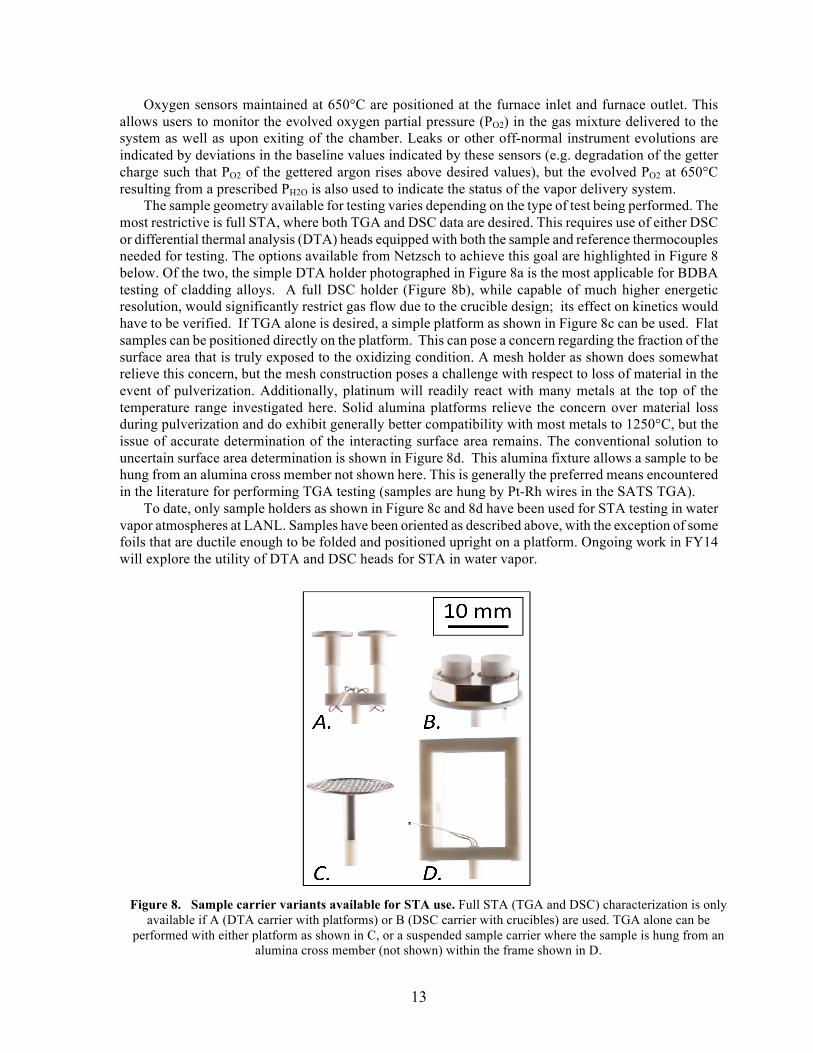
Oxygen sensors maintained at 650°C are positioned at the furnace inlet and furnace outlet. This allows users to monitor the evolved oxygen partial pressure (PO2) in the gas mixture delivered to the system as well as upon exiting of the chamber. Leaks or other off-normal instrument evolutions are indicated by deviations in the baseline values indicated by these sensors (e.g. degradation of the getter charge such that PO2 of the gettered argon rises above desired values), but the evolved PO2 at 650°C resulting from a prescribed PH2O is also used to indicate the status of the vapor delivery system. The sample geometry available for testing varies depending on the type of test being performed. The most restrictive is full STA, where both TGA and DSC data are desired. This requires use of either DSC or differential thermal analysis (DTA) heads equipped with both the sample and reference thermocouples needed for testing. The options available from Netzsch to achieve this goal are highlighted in Figure 8 below. Of the two, the simple DTA holder photographed in Figure 8a is the most applicable for BDBA testing of cladding alloys. A full DSC holder (Figure 8b), while capable of much higher energetic resolution, would significantly restrict gas flow due to the crucible design; its effect on kinetics would have to be verified. If TGA alone is desired, a simple platform as shown in Figure 8c can be used. Flat samples can be positioned directly on the platform. This can pose a concern regarding the fraction of the surface area that is truly exposed to the oxidizing condition. A mesh holder as shown does somewhat relieve this concern, but the mesh construction poses a challenge with respect to loss of material in the event of pulverization. Additionally, platinum will readily react with many metals at the top of the temperature range investigated here. Solid alumina platforms relieve the concern over material loss during pulverization and do exhibit generally better compatibility with most metals to 1250°C, but the issue of accurate determination of the interacting surface area remains. The conventional solution to uncertain surface area determination is shown in Figure 8d. This alumina fixture allows a sample to be hung from an alumina cross member not shown here. This is generally the preferred means encountered in the literature for performing TGA testing (samples are hung by Pt-Rh wires in the SATS TGA). To date, only sample holders as shown in Figure 8c and 8d have been used for STA testing in water vapor atmospheres at LANL. Samples have been oriented as described above, with the exception of some foils that are ductile enough to be folded and positioned upright on a platform. Ongoing work in FY14 will explore the utility of DTA and DSC heads for STA in water vapor.
Figure 8. Sample carrier variants available for STA use. Full STA (TGA and DSC) characterization is only available if A (DTA carrier with platforms) or B (DSC carrier with crucibles) are used. TGA alone can be
performed with either platform as shown in C, or a suspended sample carrier where the sample is hung from an alumina cross member (not shown) within the frame shown in D.

14
4. RESULTS AND DISCUSSION 4.1 ORNL SEVERE ACCIDENT TEST STATION
4.1.1 Fe-Cr Evaluations
Based on the previous results with binary Fe-Cr alloys, these compositions were revisited because the binary Fe-Cr alloys did not perform as well as commercial FeCr alloys or ODS ODM401 (14%Cr) [12]. A new set of Fe-Cr alloys was made with Mn, Si and Y additions, which are known to improve oxidation resistance [17-19]. Figure 9 shows the results from 6 alloys with increasing nominal Cr content. For Cr contents from 12.5-20%, the exposures were stopped at 2h or less because of the rapid mass gain and thick Fe-rich oxide formed. Only the alloys with 22.5 and 25%Cr formed protective Cr-rich oxides at 1200°C showing relatively low mass gains after 24h. Figure 10 shows polished cross-sections of several specimens confirming the mass change data. For the 22.5 and 25%Cr alloys, the Cr-rich oxide was protective but not adherent. Such high alloy Cr content raises concerns about α´ formation and embrittlement [22-25], especially under irradiation. These results suggest that there are limited prospects for current 9-14%Cr ODS steels, which have attracted interest for other nuclear applications [26-28].
Figure 9. Specimen mass gains for Fe-Cr-Mn-Si-Y alloys oxidized at 1200°C in Ar-50%H2O. Alloys that
exhibited accelerated oxidation were stopped after short exposures.
Figure 10. Light microscopy of polished cross-sections of model Fe-Cr+Mn,Si,Y alloys oxidized in Ar-
50%H2O at 1200°C (a) 25%Cr for 24h, (b) 22.5%Cr for 24h, (c) 20Cr for 2h and (d) 17.5Cr for 0.5h.

15
4.1.2 Fe-Cr-Al Evaluations
More effort was focused on alumina-forming FeCrAlY alloys. Based on the initial results in Figure 1b, there was a clear difference between the more highly alloyed APMT and the leaner Ohmaloy alloys with 13Cr and 3-4%Al. In Figure 11, additional commercial alloys and cast model alloys were used to establish a critical Cr/Al composition boundary for exposure at 1200°C in Ar-50%H2O. Lowering the Al and Cr contents from the typical 20Cr-5Al composition could result in an alloy more suitable for thin walled tubing with better mechanical properties and weldability. As with the Fe-Cr alloys, the 20%Cr level raises concerns about α´ formation and embrittlement [24,29]. The synergism between Cr and Al contents is the well-known “third element” effect [30], where less Al is needed in the alloy to form an external Al2O3 scale as the Cr content is increased. Without any Cr in the alloy, ~20at.%Al would be needed to form alumina [31]. Several Kanthal Alkrothal alloys (labeled Alk3, Alk14 and Alk720 in Figure 11) also were evaluated as well as other commercial alloys with similar composition to APMT (e.g. APM, ODS MA956 and PM2000). The commercial alloy performance was consistent with the model alloys, except for Alkrothal 14 (Alk14), which was not protective but model FeCrAlY alloys with similar compositions were protective, Figure 11. The protective behavior of Alkrothal 720, with less Cr than Alk14, perhaps could be related to minor element effects (note Mn, Si, Zr and Ti in Table 2) but this has not been investigated. The effect of Y in the model alloys was evaluated for several compositions shown in Figure 11 (note that the castings with and without Y often are offset due to unintentional differences in the retained Cr and Al levels). Pairs with nominal compositions of 20Cr-3Al, 15Cr-4Al and 10Cr-5Al showed similar behavior. Only for Fe-13Cr-4Al did the addition of Y appear to benefit steam oxidation resistance at 1200°C. However, Y did improve the alumina scale adhesion after exposure, as expected [17,18]. The external alumina scale flaked off the undoped (i.e. Y free) alloys after cooling.
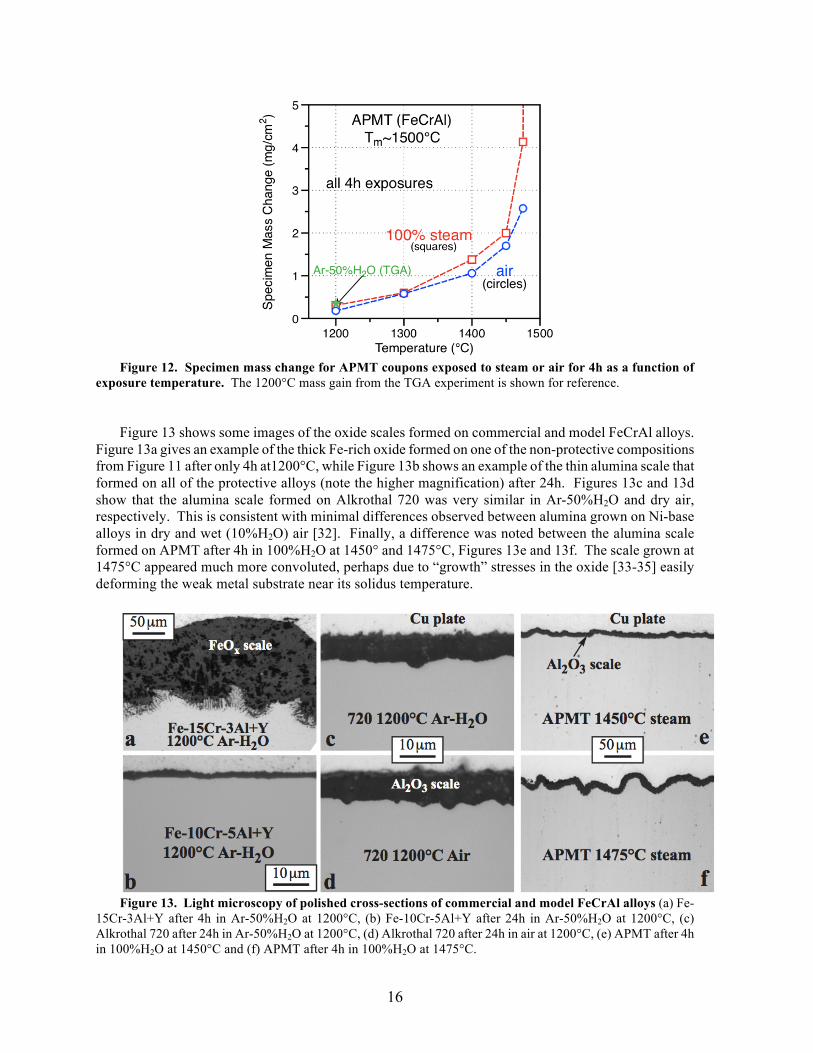
To establish the upper temperature limit for FeCrAl (APMT), oxidation tests were performed at higher temperatures in 100% H2O and air, Figure 12. Little difference was noted between the environments until 1475°C, where the mass gain in steam was much higher. At 1500°C in steam, the specimen went into breakaway oxidation. However, this temperature is very close to the ~1500°C solidus temperature for this class of ferritic alloy.
Figure 11. Effect of Cr and Al content in commercial and model FeCrAl alloys on oxidation resistance at
1200°C in Ar-50%H2O. Unlabeled points are cast, model FeCrAlY alloys except in a few cases where the Y was left out. Protective specimens were exposed for 24 h, but the non-protective specimens were stopped after 4 h.
16
Figure 12. Specimen mass change for APMT coupons exposed to steam or air for 4h as a function of
exposure temperature. The 1200°C mass gain from the TGA experiment is shown for reference. Figure 13 shows some images of the oxide scales formed on commercial and model FeCrAl alloys.
Figure 13a gives an example of the thick Fe-rich oxide formed on one of the non-protective compositions from Figure 11 after only 4h at1200°C, while Figure 13b shows an example of the thin alumina scale that formed on all of the protective alloys (note the higher magnification) after 24h. Figures 13c and 13d show that the alumina scale formed on Alkrothal 720 was very similar in Ar-50%H2O and dry air, respectively. This is consistent with minimal differences observed between alumina grown on Ni-base alloys in dry and wet (10%H2O) air [32]. Finally, a difference was noted between the alumina scale formed on APMT after 4h in 100%H2O at 1450° and 1475°C, Figures 13e and 13f. The scale grown at 1475°C appeared much more convoluted, perhaps due to “growth” stresses in the oxide [33-35] easily deforming the weak metal substrate near its solidus temperature.
Figure 13. Light microscopy of polished cross-sections of commercial and model FeCrAl alloys (a) Fe-
15Cr-3Al+Y after 4h in Ar-50%H2O at 1200°C, (b) Fe-10Cr-5Al+Y after 24h in Ar-50%H2O at 1200°C, (c) Alkrothal 720 after 24h in Ar-50%H2O at 1200°C, (d) Alkrothal 720 after 24h in air at 1200°C, (e) APMT after 4h in 100%H2O at 1450°C and (f) APMT after 4h in 100%H2O at 1475°C.

17
4.1.3 SiC Evaluations
Figure 14 shows mass change data for monolithic CVD SiC exposed inside the Rubotherm TGA system to higher temperatures. While SiC specimens experienced a net mass gain during 24 h exposures, similar-size silica specimens underwent linear mass loss due to the volatilization of Si(OH)4 in the presence of H2O at high temperature. Figure 15 provides an example of a 90h CVD SiC exposure at 1450°C where an initial mass gain turned to a linear mass loss during the latter half of the experiment.
0 2 4 6 8 10 12 14 16 18 20 22 240.0
0.1
0.2
0.3
0.4
0.5
0.6
0.7
1500°C - 1.6 cm/s 1400°C - 1.5 cm/s 1300°C - 1.4 cm/s 1200°C - 1.3 cm/s
Δw
[mg/
cm2 ]
Time [h]
100% H2O - 1 atm
Figure 14. Monolithic CVD SiC mass change as a function of time during exposure in 1bar steam in the Rubotherm TGA. The gas velocity in each experiment is noted.
0 10 20 30 40 50 60 70 80 90-0.7
-0.6
-0.5
-0.4
-0.3
-0.2
-0.1
0.0
0.1
0.2
1450°C - 1.6 cm/s
Δw [m
g/cm
2 ]
Time [h]
m=1×10⁻² 100% H2O - 1 atm
Figure 15. Monolithic CVD SiC mass change as a function of time during exposure in 1bar steam at 1450°C.

18
Figure 16 summarizes the specimen mass change data for CVD SiC and silica. The extent of specimen mass loss increased for both materials as temperature and exposure time increased. Compared to lower temperatures, a significant increase in mass loss was observed for CVD SiC specimens at 1700°C in the high temperature furnace with significant scatter in the two 4h observations. This increase was attributed to melting of the oxide layer on the CVD SiC surface and oxide spallation. The melting point of the reaction product was likely reduced by contamination of Al in the oxide due to volatilization of the alumina reaction tube and specimen holder.
1400 1500 1600 1700-0.7
-0.6
-0.5
-0.4
-0.3
-0.2
-0.1
0.0
0.1
-5.2
100% Steam Tests 2 hour test - CVD-SiC 4 hour test - CVD-SiC 4 hour test - SiO2
Spec
imen
Mas
s C
hang
e [m
g/cm
2 ]
Temperature [°C]
52 cm/s 55 cm/s 63 cm/s 66 cm/sFlow Velocity
-1.3
Figure 16. Specimen mass change after 1bar steam exposures.
The effect of steam flow velocity was investigated at 1600°C, Figure 17. As expected, higher steam velocities resulted in increased volatilization and larger mass losses for the CVD SiC specimens.
0 25 50 75 100 125 150-0.5
-0.4
-0.3
-0.2
-0.1
0.0
0.1
Spec
imen
Mas
s C
hang
e [m
g/cm
2 ]
Steam Flow Rate [cm/s]
CVD-SiC1600°C - 4 hour test100% H2O - 1 atm
Figure 17. CVD SiC mass change as a function of steam velocity after 4 h exposures at 1600°C.

19
Figure 18 shows the surface of oxidized CVD SiC after exposure in the high-temperature furnace module. The surface oxide appeared to experience more cracking as the oxidation temperature increased and the flow velocity decreased; the conditions under which formation of thicker oxides are expected. It is likely that the oxide layer cracked after cooling to room temperature due to the coefficient of thermal expansion mismatch between SiC and cristobalite-SiO2 [36-37]. Note the drastically different magnification used to image the surface of the specimen exposed at 1700ºC. This was done to capture the formation of large nodules on the surface after this exposure. Figure 19 shows a cross section of a nodule including EDS maps of O, Al, and Si. The spherical morphology suggests the nodule was liquid at temperature and the bubbles under the nodule suggest gaseous byproducts of the oxidation reaction.
Figure 18. SEM backscattered electron images of the oxide layers formed on the surface of CVD SiC
specimens after 4 h exposures in the high-temperature furnace module.
50 µm
O
SiAl
Bubbles containing gaseous byproducts
Figure 19. SEM backscattered electron image of the oxide nodule formed on CVD SiC after 4 h at 1700ºC
in steam. EDS maps of O, Al, and Si, taken from the same area are also shown.

20
Figure 20 shows the mass gain for CVI SiC/SiC composite specimens during exposure to steam in the Rubotherm TGA system. The composite specimens have an outer >100µm CVD SiC seal coat (to protect the underlying fibers) and showed similar mass gains to monolithic CVD SiC under these conditions, Figure 14. Prior work showed that if large uncoated areas of the composite are present, exposing the fiber-matrix interphases to oxidation, much more aggressive attack occurs [12]. To investigate the effect of cracking the dense SiC surface seal coat, micro-cracks were introduced into the sample by initially carrying out micron size indentations and subsequent equibiaxial ring-on-ring bending [38]. Figure 20 shows only a modest difference between the cracked and uncracked specimens. Post exposure characterization found that the crack had been filled with oxide during exposure at 1500°C in steam and no significant attack occurred.
0 2 4 6 8 10 12 14 16 18 20 22 240.0
0.1
0.2
0.3
0.4
0.5
0.6
0.7
100% H2O - 1 atm 1300°C - 1.4 cm/s 1500°C - 1.6 cm/s 1500°C - 1.6 cm/s - with µ-crack
Δw
[mg/
cm2 ]
Time [h]
µ-crack
Figure 20. CVI SiC/SiC composite mass change as a function of time during exposure in 1bar steam.

21
4.1.4 General Electric Experiments
As part of the operation of the SATS at ORNL, the equipment was available to the FCRD research community to evaluate attractive candidate materials and/or coatings. Specimens of five different alloys were sent to ORNL by General Electric (GE) for 4h exposures in the Rubotherm TGA. Initial evaluations were conducted at 1200°C in 100%H2O followed by exposures at higher and lower temperature depending on performance. The specimen mass change data are summarized in Figure 21. The alumina-forming alloys APMT and MA956 were also oxidized at higher temperatures up to 1475°C. Surprisingly, the MA956 specimens went into breakaway oxidation at 1450° and 1475°C, while the APMT specimen showed protective behavior at 1475°C. The ODS FeCr alloy showed high mass gains at 1100° and 1200°C. The mass gains for chromia-forming E-Brite and alloy 33 are distorted by scale spallation after exposure. The TGA data is being analyzed for a more accurate comparison. Both of these alloys were heavily oxidized but intact after 4 h at 1300°C. However, both experienced breakaway oxidation at 1400°C (i.e. the metal coupon was fully consumed). The specimens were returned to GE for metallographic analysis.
Figure 21. Specimen mass change as a function of exposure temperature for 4h in steam.
22
4.2 LANL RESULTS Eight different materials have been examined using STA. The focus has been TGA experiments, but
this will be expanded to include measurements of hydrogen production in the coming year using the methodology described in Section 4.2.3. A range of commercial stainless steels and other corrosion-resistant alloys were investigated at high temperatures along with a subset of ferritic-martensitic steels possessing known properties under irradiation. Selection of these materials was made in collaboration with industrial partners at General Electric, who lead one of the three industry teams working with AFC on accident tolerant systems. In addition, Zircaloy-2 was used as a benchmark for comparison to previously published data. Finally, results obtained for molybdenum are also discussed. Molybdenum has been proposed as a cladding material due to its superior high temperature mechanical properties and acceptable response to irradiation, but little recent data is available regarding its oxidation performance when exposed to water vapor at elevated temperatures.
4.2.1 Performance of Commercial Alloys in Steam at High Temperature
Oxidation testing as summarized here was performed in an atmosphere of 100% H2O. This was performed as an initial step; future testing on a subset of samples will include mixed atmospheres of water vapor and hydrogen in order to more fully simulate the conditions expected during a BDBA. All testing performed on these samples was executed for disks or sheets of material measuring approximately 10 mm in diameter by 1 mm thick. Detailed surface area measurements were made of each sample in order to translate weight gain as measured by the STA to a weight change per surface area term as required for kinetic calculations. Samples were prepared by cleaning in acetone followed by rinsing with methanol. Given the sample geometries available, the samples were tested on alumina plate TGA holders, the style shown in Figure 8c. This introduces some uncertainty with respect to the true surface area exposed to the test condition. However, metallographic examination of the oxidized samples did not reveal meaningful differences in the oxide morphology on the micrometer scale when the surfaces resting against the plate were compared to the upward facing surface of the samples. A subset of samples will be tested again in the hanging configuration to explore differences between the two to guide future work.
Testing was initially performed on seven alloys. Zircaloy-2 was chosen as the reference cladding alloy. T91, a ferritic-martensitic stainless steel used historically as fast reactor cladding and as a material used in ductwork and other core internals, was selected given its demonstrated performance under irradiation. Two other ferritic-martensitic alloys with irradiation experience were also selected, 14YWT and MA956. Both utilize dispersed yttrium oxide precipitates to enhance creep resistance and retain mechanical properties under irradiation. Two very high chromium ferritic alloys, E-Brite and APMT (also containing ~5%Al, Table 2), were selected in an attempt to explore the performance of commercial materials designed specifically for oxidation resistance at high temperatures. Finally, Alloy-33 was included due to GE’s familiarity with its demonstrated performance in other high temperature applications. Alloy compositions are shown in Table 2, although these specimens were from other batches that may have slight different compositions. It is important to note that while all of the alloys included here (except 14YWT) were produced commercially at one point in time, this may no longer be the case.
Initial testing was performed at temperatures of 900 and 1000°C for 6 h. Under these conditions, Zirc-2 and T91 were found to oxidize significantly while the remaining five samples oxidized only slightly. The results of these tests are not plotted, but are included in Table 3, which summarizes the performance of all commercial alloys tested in this work. The comparatively poor performance of these alloys resulted in their removal from the continuing test matrix, and testing continued for the remaining five alloys. The rapid oxidation kinetics of Zirc-2 under these conditions was expected and is consistent with the literature. However, the fact that T91 exhibited a nearly identical response was somewhat unexpected. The chromium content of T91 is the lowest of the commercial alloys tested, and therefore was not expected to exhibit superior performance, but the rapid degradation prompted its exclusion from the remainder of testing.

23
Testing of the remaining five alloys was performed at 1100 and 1200°C for a shortened time period of 3 h. The low temperature oxidation data is not plotted here, but is again summarized in Table 3. An overview of all five materials’ weight gain measured during testing at 1100°C is shown in Figure 22. Percentage gain is plotted as a function of time (as opposed to the square root of time as is conventionally performed for oxidation tests to better illustrate dominant mechanisms). The simple percentage of the initial sample weight (opposed to weight gain per sample area) was used, as more sophisticated analyses regarding the oxidation kinetics have not yet been performed. The most apparent feature of this plot is the drastic increase in oxidation of 14YWT compared with the other four alloys. The previous testing performed at 1000°C found that 14YWT did oxidize at a higher rate than the other high-performing alloys but, at this lower temperature, the oxidation rate remained roughly equivalent to the other alloys.
Exclusion of the 14YWT data from Figure 22 allows examination of the remaining alloys in more detail. All four performed generally well, with only minor oxidation occurring in the 3 h time interval investigated. Figure 23 shows the performance of MA956, APMT, E-Brite, and Alloy 33. Preliminary analysis executed to investigate the oxidation kinetics at this condition has found that all four of the materials below appear to exhibit parabolic oxidation. Analysis is ongoing to develop precise rate constants for the four materials.
The oxidation response of all five materials to 1200°C is shown in Figure 24. Again, the response of 14YWT dominates at this scale. Figure 25 provides more detail on the four higher-performing alloys. The ordering of the alloy performance at 1200°C remains the largely the same as that observed at 1100°C; E-Brite exhibited the highest weight gain, followed by Alloy-33. The exception is found in APMT and MA956. APMT was found to exhibit the slowest oxidation at 1100°C, while MA956 held this position in the 1200°C test.
Figure 22. TGA weight gain curves obtained for 100% H2O performed at 1100°C for 3 h highlighting
oxidation of all alloys except Zirc-2 and T91. 14YWT is the only alloy with visible weight gain due to oxidation when viewed at this scale.

24
Figure 23. TGA weight gain curves obtained for 100% H2O vapor performed at 1100°C for 3 h; 14YWT
is excluded from this plot to emphasize oxidation of remaining alloys.
Cross sectional microscopy was also performed to facilitate investigation of the specific oxide chemistry and morphology produced for each material using scanning electron microscopy and energy-dispersive spectroscopy. Samples were sectioned and polished. Line profiles were performed to identify the approximate composition of the oxide phases present as well as to qualitatively identify oxygen diffusion profiles into the metal substrate. These results are currently being augmented by transmission electron microscopy (TEM) studies currently ongoing at the University of California-Berkeley.
Figure 24. TGA weight gain curves obtained for 100% H2O vapor performed at 1200°C for 3 h
highlighting oxidation of all alloys except Zirc-2 and T91. 14YWT is again the only material that displays visible weight gain at this scale.

25
Figure 25. TGA weight gain curves obtained for 100% H2O vapor performed at 1200°C for 3 h; 14YWT
is excluded from this plot to emphasize oxidation of remaining alloys.
The micrographs of each sample investigated are not detailed here for brevity, but a summary of the
resulting oxide thickness observed is provided in Table 3. The growth rates of the four best performing commercial alloys are summarized graphically in Figure 26. It is important to note that in this simple summary only the primary oxide is reported. The more corrosion resistant materials exhibited more complex oxide structures dominated by alumina and chromia. (Also note that the differences between APMT and MA956 were not observed in the GE study at 1200°C, Figure 21.) Resolving these stretched the limit of the techniques used, motivating investigation of the samples using TEM. The results of that investigation will be summarized in conjunction with the data provided here in a planned journal submission in FY14.
Figure 26. Summary of calculated oxide growth rates for the top performing commercial alloys in 100%
H2O as a function of temperature.

26
Table 3. Summary of oxide thicknesses measured via cross sectional microscopy following isothermal oxidation testing under an atmosphere of 100% H2O.
Sample Temperature
(⁰C) Oxide Thickness
(µm) Time at
Isotherm (h) Oxide Growth Rate
(µm/h) Zirc-2 900 23 3 7.7
1000 370 6 61.7 T91 900 124 3 41.3
1000 557 6 92.8 MA956 900 2 3 0.7
1000 4 6 0.7 1100 2.4 3 0.8 1200 2.6 3 0.9
14YWT 900 2 3 0.7 1000 4.8 6 0.8 1100 56 3 18.7 1200 1050 3 350
APMT 1000 1.3 6 0.2 1100 4.2 3 1.4 1200 4.4 3 1.5
E Brite 900 4 3 1.3 1000 8.2 6 1.4 1100 12 3 4 1200 12.5 3 4.2
Alloy 33 900 2 3 0.7 1000 3.5 6 0.6 1100 4.5 3 1.5 1200 8.8 3 2.9
4.2.2 Oxidation of Molybdenum in Water Vapor Molybdenum is a recently proposed candidate for a next-generation cladding material that could offer
benefits across multiple areas relevant to LWR performance to high burnup. Foremost, it exhibits superior creep resistance and retains significant mechanical strength at temperatures above 1500°C owing to its high melt point (2600°C). More importantly, it retains acceptable properties under neutron irradiation, although the majority of existing data has been collected under irradiation conditions relevant to fast reactor and fusion applications. Embrittlement following low temperature irradiation and the resulting increase in the ductile-to-brittle transition temperature has been a historic concern for the use of molybdenum in irradiation environments, but recent studies have identified means of restricting this degradation through refinement of grain size or use of nanostructure oxide inclusions. The thermal neutron cross section of molybdenum is higher than that of zirconium, but the penalty to neutron economy could be partially overcome through a reduction in the cladding thickness facilitated by its enhanced mechanical properties. Demonstration of thin walled molybdenum tubing capable of a maintaining fully hermetic seal around the fuel would require development and qualification of suitable fabrication and joining techniques, and is presently under investigation.
Many of the above benefits can be directly related to hypothesized performance at high burnup, predominantly with respect to wear resistance relevant to grid-to-rod fretting and retention of strength and resistance to deformation following prolonged exposure to elevated temperatures. However, the oxidation resistance of molybdenum is unknown under the thermochemical stimuli expected during steady state and
27
possible transient reactor operations. Successful service as reactor cladding requires prolonged exposure to pressurized water at temperatures below 400°C. Evaluation of the potential offered by molybdenum when judged by accident tolerance metrics requires consideration of its response to water vapor and hydrogen at temperatures in excess of 1000°C. Performance when subjected to oxygen rich atmospheres is also relevant when considering a possible core breach, off-normal condition during transportation, or eventual used fuel storage.
This study was undertaken to explore the performance of molybdenum under conditions prototypic of those expected during a BDBA and station blackout. Molybdenum has long been anecdotally known to suffer aggressive material loss during exposure to oxygen at high temperatures, but few studies have investigated its performance in derivative oxidizing environments. The primary goal of this work was thus to explore the degree to which historic observations made in oxygen-rich atmospheres translate to water vapor environments, and interpret these findings with respect to the potential of molybdenum or its alloys as an LWR cladding material.
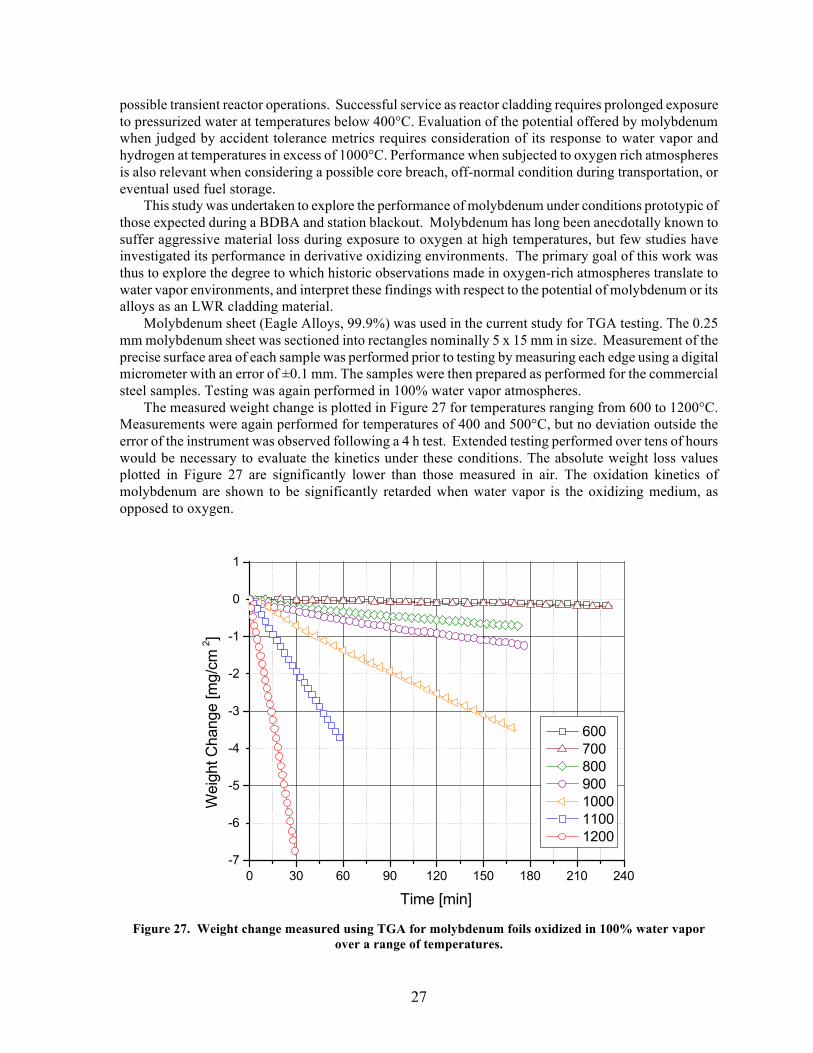
Molybdenum sheet (Eagle Alloys, 99.9%) was used in the current study for TGA testing. The 0.25 mm molybdenum sheet was sectioned into rectangles nominally 5 x 15 mm in size. Measurement of the precise surface area of each sample was performed prior to testing by measuring each edge using a digital micrometer with an error of ±0.1 mm. The samples were then prepared as performed for the commercial steel samples. Testing was again performed in 100% water vapor atmospheres.
The measured weight change is plotted in Figure 27 for temperatures ranging from 600 to 1200°C. Measurements were again performed for temperatures of 400 and 500°C, but no deviation outside the error of the instrument was observed following a 4 h test. Extended testing performed over tens of hours would be necessary to evaluate the kinetics under these conditions. The absolute weight loss values plotted in Figure 27 are significantly lower than those measured in air. The oxidation kinetics of molybdenum are shown to be significantly retarded when water vapor is the oxidizing medium, as opposed to oxygen.
Figure 27. Weight change measured using TGA for molybdenum foils oxidized in 100% water vapor
over a range of temperatures.

28
Oxidation of molybdenum in air at 1000°C would result in near total consumption of a hypothetical LWR cladding geometry in a matter of hours. Examination of the rates observed for water vapor reveal that temperatures of over 1200°C are needed to begin to degrade the cladding thickness at rates that are significant, even to thin-walled tubing variants. A 0.4 mm thick cladding could withstand nearly 4 h at 1200°C before 10% of its initial cladding thickness is lost. In comparison, even the highest performing optimized zirconium cladding variants (e.g. M5, ZIRLO, E110) are nearly fully converted to ZrO2 under these conditions and would provide no mechanical integrity or barrier between the fuel and the reactor pressure vessel.
The results highlighted above have been summarized in a publication recently accepted to the Journal of Nuclear Materials. Continuing work will emphasize two critical areas relevant to the performance of molybdenum or molybdenum alloy coatings. First, the transition region of 700-800°C where para-linear oxidation begins to dominate kinetics will be investigated through focused STA studies in order to fully capture behavior in this region critical to initial stages of a BDBA. Second, exploration of alternative molybdenum alloys and compounds will be undertaken to identify potential derivative alloys or potential coatings that could enhance resistance to oxidation and subsequent volatilization.
4.2.3 Determination of Hydrogen Generation using STA
Exploration of the oxidation kinetics exhibited by candidate cladding materials or coatings using
TGA is the most straightforward means of evaluation of their potential to improve upon the performance of reference zirconium cladding alloys during a BDBA. As described above using the range of examples, this can be a simple but powerful means to investigate candidate materials. However, TGA alone may not be able to fully capture the more subtle thermochemical aspects of cladding that are important to understand to predict the response of reactor materials to any off-normal condition.
Hydrogen plays a critical role in the response of not only LWR cladding and structural materials, but also the fuel itself. Oxygen is readily accommodated by uranium dioxide (UO2). If the UO2 fuel pellets are exposed to water coolant at even normal operating conditions (e.g. those expected of a ‘leaker’), in the absence of other stimuli they will oxidize on a time scale of tens-of hours. Excess oxygen in the fluorite phase will degrade thermal conductivity and enhance fission product diffusion. Full conversion to U3O8 will bring with it a loss of mechanical integrity and pulverization of the pellet. However, this does not happen in an LWR during a breach of cladding under normal operating conditions, and oxidation of the fuel is not usually a concern until the late stages of a BDBA. This is due to the excess of hydrogen provided by oxidation of the zirconium cladding by water vapor.
The rate of hydrogen generation is generally straightforward to estimate if the reaction rate of a simple alloy with water is known. This can be calculated from the base TGA data. However, the secondary reactions (e.g. hydriding) or the response of complex composites materials (e.g. coated claddings) can complicate analysis as some hydrogen generated following oxidation in water vapor is either retained or undergoes secondary chemical reactions. This results in significant difficulties in estimating the effect that such candidate systems might have on the thermochemistry of the fuel-cladding system. A method to measure the hydrogen production of cladding materials and coated systems during oxidation in water vapor would therefore be clearly advantageous to exploration of BDBA response of candidate fuel-cladding systems.
Utility of Hydrogen Measurement of Cladding Materials using STA
The method currently under development at LANL allows quantitative hydrogen measurement using Quadrupole Mass Spectrometry (QMS) during steam oxidation reactions at temperatures up to 1250°C. This hydrogen generation data was developed for direct coupling to the TGA techniques described above. This provides qualitative data useful for a range of analyses that will facilitate more sophisticated investigation of the response of candidate cladding materials and fuel-cladding composite samples to BDBA conditions.
29
Foremost, this technique will provide an experimental means of providing the thermochemical conditions evolved by a test sample and test condition. Even fairly simple materials and conditions can evolve chemically such that the hydrogen generation rate cannot be simply calculated according to the weight gain observed during TGA measurement alone. The simplest example comes when the cladding alloy absorbs hydrogen or hydrides if provided hydrogen following its initial oxidation in water vapor. Zirconium cladding is well understood to exhibit this behavior at temperatures expected of a BDBA. More complicated alloys containing a wide range of elemental constituents will also complicate attempts at direct correlation of weight gain during oxidation to hydrogen production. Additionally, the thermochemical stimuli of interest to study of BDBA response may quickly extend beyond a single material tested in a homogeneous atmosphere. The response of cladding to combinations of water vapor, hydrogen, nitrogen, and oxygen are critical in order to judge coping time under a range of accident scenarios. Hydrogen production resulting from the sample would be significantly complicated as a number of gas-gas and gas-solid reactions compete and evolve during testing. Introduction of sample fuel materials could add additional complication. Finally, the ability to gain insight into the in situ stoichiometry of oxide formation is more of a fundamental advantage to this technique but remains relevant to some materials of interest. As discussed in Section 3.2, molybdenum’s terminal oxide of MoO3 experiences rapid volatilization and appears to govern service of a molybdenum-based cladding under BDBA conditions. However, little is known about the relative stabilities of Mo(IV)O2 versus Mo(VI)O3 at intermediate temperatures and oxygen activities. While it is possible to measure the weight change of molybdenum during steam oxidation using TGA, more information is needed if one desires knowledge of the kinetics of formation between Mo(IV)O2 and Mo(VI)O3. Resolution of hydrogen production in conjunction with sample weight change will provide more concrete information to the researcher seeking to quantify the oxidation state of the base metal during chemical reactions.
The method under development is far superior to the quantitative method offered by analysis of the mass spectrometer data using commercial Aëolos software. The Aëolos software presents the “quantitative” signal as a percentage, which is inherently a derived quantity dependent on a normalized average. Conversely, the method being developed retains all information in absolute terms, which provides the researcher greater power and understanding when interpreting the data.
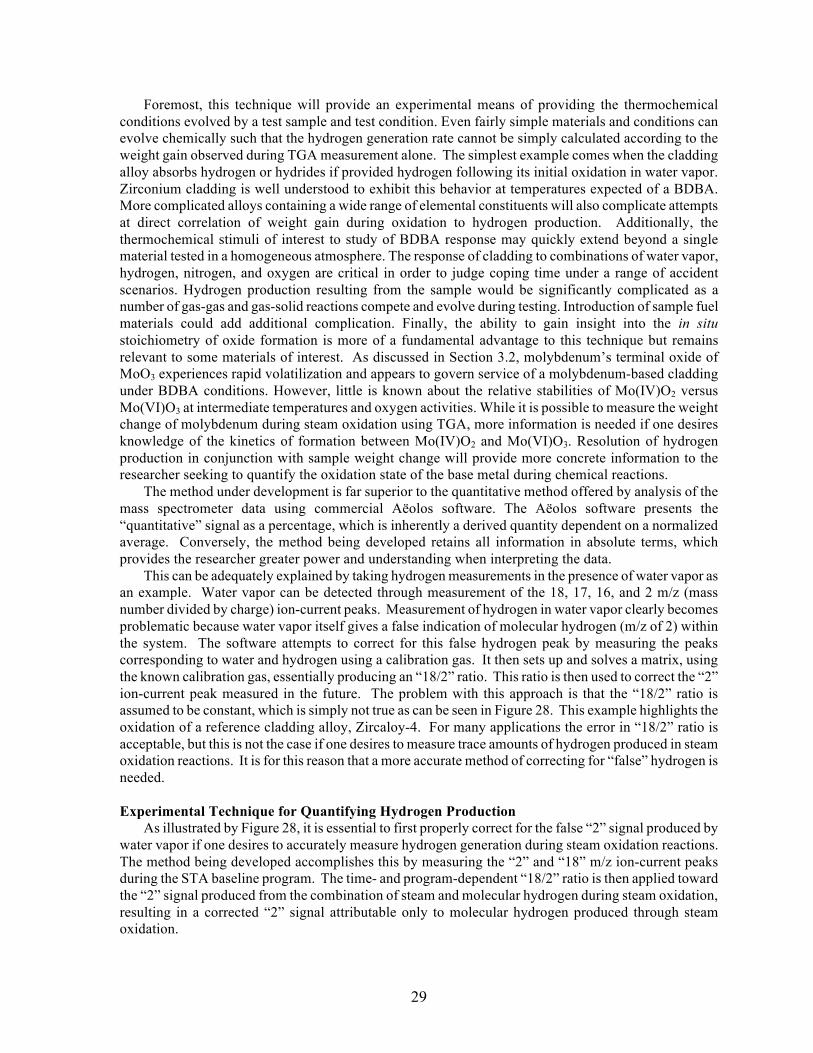
This can be adequately explained by taking hydrogen measurements in the presence of water vapor as an example. Water vapor can be detected through measurement of the 18, 17, 16, and 2 m/z (mass number divided by charge) ion-current peaks. Measurement of hydrogen in water vapor clearly becomes problematic because water vapor itself gives a false indication of molecular hydrogen (m/z of 2) within the system. The software attempts to correct for this false hydrogen peak by measuring the peaks corresponding to water and hydrogen using a calibration gas. It then sets up and solves a matrix, using the known calibration gas, essentially producing an “18/2” ratio. This ratio is then used to correct the “2” ion-current peak measured in the future. The problem with this approach is that the “18/2” ratio is assumed to be constant, which is simply not true as can be seen in Figure 28. This example highlights the oxidation of a reference cladding alloy, Zircaloy-4. For many applications the error in “18/2” ratio is acceptable, but this is not the case if one desires to measure trace amounts of hydrogen produced in steam oxidation reactions. It is for this reason that a more accurate method of correcting for “false” hydrogen is needed.
Experimental Technique for Quantifying Hydrogen Production
As illustrated by Figure 28, it is essential to first properly correct for the false “2” signal produced by water vapor if one desires to accurately measure hydrogen generation during steam oxidation reactions. The method being developed accomplishes this by measuring the “2” and “18” m/z ion-current peaks during the STA baseline program. The time- and program-dependent “18/2” ratio is then applied toward the “2” signal produced from the combination of steam and molecular hydrogen during steam oxidation, resulting in a corrected “2” signal attributable only to molecular hydrogen produced through steam oxidation.

30
Figure 28. Sample plot illustrating the program-dependent “18/2” ratio.
Following the application of properly measured “18/2” ratios, the corrected “2” ion-current must then
be correlated to known hydrogen concentrations so that a truly quantitative hydrogen pressure can be calculated. It was found that the recorded ion-current is almost perfectly linear as a function of hydrogen pressure, Figure 29. This result suggests that two data points – a zero and a span - are sufficient to
Figure 29. Calibration curve developed to link measured current to hydrogen content. The linear
correlation was developed through use of five different calibrated Ar-H2 gas mixtures.

31
produce a calibration curve for hydrogen pressure, thus saving the researcher significant time and materials. The curve can be produced by filling the chamber with, and then flowing, a “zero-gas” at a flow rate identical to the process of interest. This procedure may then be repeated with a “span-gas,” resulting in an accurate calibration. It is important to note it is possible that this calibration must be performed prior to every experiment due to the tendency of signals to shift over time. Ongoing work is determining the true limits of this calibration technique with respect to both the specific gasses needed to build the curve, sensitivity to flow rate, and the daily and weekly drift of the calibration.
One important aspect of the calibration curve construction that must still be investigated is the effect of gas velocity on the measured ion current and calibration curve. Currently the calibrations are performed using zero gas and span gas at flows matched to those desired for a particular experiment (i.e. water vapor and secondary gasses). However, this value may vary significantly during an experiment if a range of thermochemical conditions is used (e.g. varying hydrogen content carried in water vapor). The limits of calibration curve applicability must be understood before analyzing hydrogen generation across significantly differing flow rates.
In the current approach, the measurement begins by first acquiring currents associated with the zero gas (gettered argon containing less than 10-16 ppm oxygen) and the span gas (Ar-6%H2). In the example illustrated here, these values were found to be 9.623E-13±8.968E-15 and 1.425E-10±2.437E-13, respectively. The resulting calibration curve is shown in Figure 30.
Figure 30. Quantitative hydrogen calibration using gettered Ar and reference forming gas (Ar-
6%H2). Following this initial calibration, a standard baseline correction program was setup and run using the
STA while ion currents for “2” and “18” were simultaneously recorded. The “18/2” ratio was calculated as a function of the baseline program so that it can then be used in the steam oxidation experiment. The result of this baseline run is shown in Figure 28. The steam oxidation experiment was then performed after loading the STA with a 22.49 mg sheet sample of Zircaloy-4 using the previous baseline file for mass correction. The final mass change, or oxygen pickup, was found to be 5.32 mg, corresponding to a 67.4% conversion to ZrO2.

32
It can be seen in Figures 31 and 32 that obtaining an accurate measurement of hydrogen is neither as straightforward as simply measuring the “2” ion-current, nor can accurate data be obtained simply by subtracting the baseline “2” ion-current from that obtained during the steam oxidation experiment. Instead, the “2” contribution from the water vapor must be found by first dividing the time-dependent “18” steam oxidation signal by the time-dependent “18/2” baseline. This value is then subtracted from the “2” signal obtained during the steam oxidation, resulting in a “2” signal which directly corresponds to hydrogen produced during steam oxidation.
Figure 31. Hydrogen measurement results obtained following the reference and developed
methodology. The baseline denotes the “2” signal measured during the baseline STA run. “SteamOx” corresponds to the “2” signal during the experiment. “18/2 corrected” is the signal after correcting for false hydrogen signal caused by water vapor, and “SteamOx Baseline” is the incorrect result obtained by only a
simple subtraction of the baseline’s H2O signal. In this test, water vapor flow began at 0 and ends at 60 min. The corrected hydrogen signal can be correlated to a time-dependent hydrogen partial pressure using
the calibration shown in Figure 30. Development of a hydrogen production curve as a function of time is then straightforward, because the system overall flow rate is a known constant of 297 ml/min. Again, varying flow rates during the test would slightly complicate analysis, Figure 33.
The first check on the technique’s progress is comparing the measured hydrogen to observed oxidation. The data collected during this test predicts a mass gain of 7.63 mg due to steam oxidation in the Zircaloy sample. The measured value using STA was 5.32 mg, corresponding to a 43.5% error. This initial result is encouraging given the novel approach described here. Furthermore, a number of approximations are inherent in the 7.63 mg calculation. It is assumed that all oxidation is induced by water and yields stoichiometric ZrO2. Deviations from this assumption would perturb the result. The STA internals were also not optimized for this measurement. Both the alumina protective tube and other fixturing were visibly discolored from the residue of other volatile species, most prevalently

33
molybdenum. Oxidation of this material in water vapor will yield hydrogen, increasing the detected values. This will be remedied before testing continues. The technique itself will be more rigorously benchmarked with pure zirconium foil in order to eliminate other alloy related uncertainties.
Figure 32. Results reported in Figure 31 showing only the first five minutes of measurement.
° Figure 33. Instantaneous and integral hydrogen generation during steam oxidation of Zircaloy-4 exposed
to the test conditions shown in Figure 28.

34
Path forward for technique refinement There is a clear and simple path forward toward improving this technique aside from the two
comparatively minor experimental refinements identified above. For example, it can be seen in Figures 31 and 32 that the corrected “2” signal is non-zero even under gettered argon. This is most likely a result of signal drift commonly seen using this equipment. A correction to this effect would result in a lower value for total hydrogen produced, thus, a potentially more accurate oxygen prediction. This all reinforces the need to perform calibrations prior to each experiment, but again the limits of this must be established to balance the practical realities demanded of a large experimental matrix with optimal precision. As a note, the calibrations outlined here were performed ~20 h before the experiment. This may have also contributed to the error, if significant drift occurs in even this comparatively brief window. Continued optimization may also be possible through increasing the integration times.
Work in FY14 will first emphasize optimization of this technique through use of simple materials (e.g. pure zirconium, molybdenum, iron, chromium). A considerable amount of effort was expended optimizing the system configuration such that determination of the hydrogen content as described above was even tenable. The ‘stock’ configuration of both the F1 and F3 STAs resulted in water vapor signals that were far too non-uniform for the approach developed above. Initial examination of the water vapor signal on the mass spectrometer found currents that deviated by more than 20% during steady state, baseline testing of an empty sample chamber. This was remedied through modification of the vapor generator hardware and associated backing heaters to increase the preheating of the steam before it enters the sample chamber. Significant modifications were also necessary to the system in order to retain the oxygen partial pressure of gettered argon. Gas lines and fittings configured with a leak rate of roughly 1 part-per-million are not noticeable if ultra-high purity gasses are used. However, these readily show up if better than 10-16 ppm oxygen gasses are delivered to the system as utilized here. This issue is critical to understanding the oxidation of materials in water vapor at high temperatures. The presence of even part-per-million levels of oxygen can significantly affect oxidation, even in oxidation resistant materials such as FeCrAl and associated variants. Deployment of advanced techniques to explore hydrogen generation requires a high degree of control over the applied thermochemical conditions in order to be successful, and eliminating extraneous sources of oxidation such as contaminant oxygen is key. Having satisfied these challenges for a new system that was not delivered until June of 2013, rapid and significant progress in FY14 is envisioned.

35
5. SUMMARY
At ORNL, prior work focused attention on Fe-Cr and Fe-Cr-Al alloys and SiC as potential candidate replacement materials for Zr-based fuel cladding in light water reactors. These experiments also identified 1200°C as a condition that clearly differentiated the steam oxidation resistance of a wide range of materials. Initial screening of cast model Fe-Cr and FeCrAl alloys was conducted at 1200°C in 1 bar Ar-50%H2O. Results under these conditions indicated that >20%Cr was needed for oxidation resistance in Fe-Cr alloys and a Cr/Al composition boundary was established for protective alumina scale formation on FeCrAl alloys at 1200°C. Model FeCrAl alloy results were consistent with commercial FeCrAl alloys. Further testing of APMT showed that it retained its oxidation resistance in 100% steam up to 1475°C.
At LANL, a world-class capability for examination of the oxidation kinetics of candidate cladding materials has been established for use within the FCRD AFC core campaign as well as affiliated industry and university partners. Work will continue within the core campaign to investigate candidate cladding materials and oxidation mitigation techniques. Ongoing work will continue to support GE-led research on accident tolerant fuels, and in particular will provide details on hydrogen production exhibited by the various cladding alloys they propose. This work will be augmented by steam oxidation testing executed at temperatures above 1200°C at ORNL.

36

37
6. FUTURE WORK
Significantly more experimental work is still needed to identify, evaluate and develop a new cladding
material with greater BDBA tolerance. In addition to high temperature oxidation resistance, the corrosion resistance and mechanical behavior in pressurized and boiling water at ~320°C needs to be determined as well as the effects of irradiation on candidate alloys for this application.
Alloy development is continuing on the FeCrAl alloys to investigate the effect of composition on mechanical properties and ~320°C water corrosion. Based on the information in Figure 8, a composition of Fe-15Cr-5Al+Y has been selected for initial irradiation testing and a small amount of tube material has been extruded and machined for the first evaluation.
Exploration of the fundamental actors governing the response of molybdenum and its alloys to water vapor environments will continue. No indication of hydriding has been observed in experiments executed to date, but this must be qualified in that the test times and temperatures of this study were limited. Investigations similar to those performed historically for zirconium cladding alloys are necessary to further quantify this behavior. In addition, the response of molybdenum to high partial pressures of nitrogen must also be explored.
Finally, the capability to investigate the response of composite cladding-fuel samples to the oxidizing environments of interest will be explored. The capability to execute combined oxidation tests of cladding and actinide samples is unique to LANL within the national complex, and presents a key attribute of accident performance that will govern the response of any BDBA scenario that results in large scale degradation to the cladding. As new and novel LWR fuels are proposed within the campaign and by industry or university partners, the effect of these systems when exchanged with reference UO2 must be evaluated.

38

39
7. REFERENCES
1. R. Gauntt, et al., Sandia National Laboratory Report, SAND2012-6173, Albuquerque, NM,
(2012). 2. V. F. Urbanic and T. R. Heidrick, J. Nucl. Mater. 75 (1978) 251. 3. R. E. Pawel, J. V. Cathcart and R. A. McKee, J. Electrochem. Soc. 126 (1979) 1105. 4. M. Moalem and D.R. Olander, J. Nucl. Mater. 182 (1991) 170. 5. K. A. Terrani, S. J. Zinkle and L. L. Snead, J. Nucl. Mater. (2013) http://dx.doi.org/10.1016/ j.jnucmat.2013.06.041. 6. P. Yvon and F. Carré, J. Nucl. Mater. 385 (2009) 217. 7. Y. Katoh, L.L. Snead, I. Szlufarska, W.J. Weber, Current Opinion in Solid State and
Materials Science 16 (2012) 143. 8. A. Strasser et al., EPRI Report # NP-2642, Palo Alto, CA (1982). 9. N. M. George, K. A. Terrani, and J. J. Powers, ORNL/TM-2013/121, Oak Ridge, TN (2013). 10. T. Cheng, J. R. Keiser, M. P. Brady, K. A. Terrani, B. A. Pint, J. Nucl. Mater. 427 (2012)
396-400. 11. B. A. Pint, K. A. Terrani, M. P. Brady, T. Cheng, J. R. Keiser, J. Nucl. Mater. 440 (2013)
420-427. 12. B. A. Pint, ORNL Report TM-2012/254, Oak Ridge, TN, July 2012. 13. B. A. Pint, “Proposed FY13 ORNL Integrated Test Plan for Severe Accident Test Station,”
Oak Ridge, TN, January 2013. 14. E. J. Opila, Mater. Sci. Forum 461-464 (2004) 765. 15. E. J. Opila and R. E. Hann Jr., J. Am. Ceram. Soc. 80 (1997) 197. 16. B. Jönsson, R. Berglund, J. Magnusson, P. Henning and M. Hättestrand, Mater. Sci. Forum,
461-464 (2004) 455. 17. B. A. Pint, Oxid. Met. 45 (1996) 1. 18. J. Quadakkers and L. Singheiser, Mater. Sci. Forum, 369-372 (2001) 77. 19. B. A. Pint, R. Peraldi and P. J. Maziasz, Mater. Sci. Forum 461-464 (2004) 815. 20. T. Ishida, Y. Harayama and S. Yaguchi, J. Nucl. Mater. 140 (1986) 74. 21. H. Hadraba, B. Kazimierzak, L. Stratil and I. Dlouhy, J. Nucl. Mater. 417 (2011) 241. 22. T. Denys and P. M. Gielen, Met. Trans. 2 (1971) 1423. 23. P. J. Grobner, Met. Trans. 4 (1973) 251. 24. S. Kobayashia and T. Takasugi, Scripta Mater. 63 (2010) 1104–1107. 25. M. Mathon, Y. De Carlan, G. Geoffroy, X. Averty, A. Alamo, C. De Novion, J. Nucl.
Mater. 312 (2003) 236. 26. S. Ukai, M. Harada, H. Okada, M. Inoue, S. Nomura, S. Shikakura, K. Asabe, T. Nishida and
M. Fujiwara, J. Nucl. Mater. 204 (1993) 65-73. 27. G. R. Romanowski, L. L. Snead, R. L. Klueh, D. T. Hoelzer, J. Nucl. Mater. 283-287 (2000)
642. 28. R. L. Klueh, J. P Shingledecker, R. W. Swindeman, D. T. Hoelzer, J. Nucl. Mater. 341 (2005)
103. 29. C. Capdevila, M.K. Miller, K.F. Russell, J. Chao, J.L. González-Carrasco, Mater. Sci. Eng. A
490 (2008) 277. 30. F. H. Stott, G. C. Wood and J. Stringer, Oxid. Met. 44 (1995) 113. 31. B. A. Pint, J. Leibowitz and J. H. DeVan, Oxid. Met. 51 (1999) 181. 32. K. A. Unocic and B. A. Pint, Surf. Coat. Technol. 215 (2013) 30. 33. J. Stringer, Werk. Korr., 9 (1972) 747. 34. D. R. Clarke, Acta Mater. 51 (2003) 1393.

40
35. P. F. Tortorelli, K. L. More, E. D. Specht, B.A. Pint, P. Zscack, Mater. High Temp., 20 (2003) 303.
36. I. Swainson and M. Dove, Phys. Chem. Minerals 22 (1995) 61-65. 37. L. L. Snead, T. Nozawa, Y. Katoh, T. S. Byun, S. Kondo, and D. A. Petti, J. Nucl. Mater. 371
(2007) 329-377. 38. C. Shih, Y. Katoh, and T. Takashi, "Effects of Size and Geometry on the Equibiaxial Flexural
Test of Fine Grained Nuclear Graphite," presented at the ICACC 2013, Daytona Beach, FL, 2013.