High temperature phases from kaolinite and halloysite
20
STATE OF ILLINOIS WILLL\M G. STRATTON, Governor DEPARTMENT OF REGISTRATION AND EDUCATION VERA M. BINKS, Director DIVISION OF THE STATE GEOLOGICAL SURVEY M. M. LEIGHTON, Chief URBANA REPORT OF INVESTIGATIONS—NO. 173 HIGH TEMPERATURE PHASES FROM KAOLINITE AND HALLOYSITE BY H. D. GLASS Reprinted from The American Mineralogist Vol. 39, pp. 193-207, 1954 I'KINTED BV AUTHORITY OF THE STATE OF URBANA, ILLINOIS 1954
Transcript of High temperature phases from kaolinite and halloysite

STATE OF ILLINOIS
WILLL\M G. STRATTON, Governor
DEPARTMENT OF REGISTRATION AND EDUCATIONVERA M. BINKS, Director
DIVISION OF THE
STATE GEOLOGICAL SURVEYM. M. LEIGHTON, Chief
URBANA
REPORT OF INVESTIGATIONS—NO. 173
HIGH TEMPERATURE PHASES FROMKAOLINITE AND HALLOYSITE
BY
H. D. GLASS
Reprinted from The American Mineralogist
Vol. 39, pp. 193-207, 1954
I'KINTED BV AUTHORITY OF THE STATE OF
URBANA, ILLINOIS
1954
ORGANIZATION
STATE OF ILLINOIS
HON. WILLIAM G. STRATTON, Governor
DEPARTMENT OF REGISTRATION AND EDUCATIONHON. VERA M. BINKS, Director
BOARD OF NATURAL RESOURCES AND CONSERVATIONHON. VERA M. BINKS, Chairman
W. H. NEWHOUSE, Ph.D., Geology
ROGER ADAMS, Ph.D., D.Sc, Chemistry
R. H. ANDERSON, B.S., Engineering
A. E. EMERSON, Ph.D., Biology
LEWIS H. TIFFANY, Ph.D., Pd.D., Forestry
W. L. EVERITT, E.E., Ph.D.,Representing the President of the University of Illinois
DELYTE W. MORRIS, Ph.D.President of Southern Illinois Universitv
GEOLOGICAL SURVEY DIVISION
M. M. LEIGHTON, Ph.D., Chief
HIGH-TEMPERATURE PHASES FROM KAOLINITEAND HALLOYSITE*
Herbert D. Glass!
Abstract
A selected group of kaolinite and halloysite clays of varying structure and impurities
are examined by differential thermal and x-ray diffraction methods to establish the sig-
nificance of the various observed thermal effects. The heating range for the thermal curves
extends to 1350° C. and the study of specimens is supplemented by the firing of materials
to intermediate temperatures.
Interpretations are given for the cause of the various thermal peaks, and the reasons
for lack of agreement in the literature are discussed. The complete firing sequence for
kaolinite and halloysite is described.
Introduction
Kaolinite-type clays are so widely used in the manufacture of ceramics
that many investigators have studied the sequence of phase changes in
kaolinite during its firing. The investigators have differed, however,
regarding the phase changes observed and also their interpretations as
to cause of the thermal reactions. The author therefore examined phase
changes in kaolinite and halloysite under controlled firing conditions.
The results of this study show that the disagreements in previous re-
ports may be accounted for by the fact that materials of different degrees
of crystallinity, morphology, and purity show different sequences of
phase changes at high temperatures.
Differential thermal analysis is a laboratory method which is espe-
cially useful in studying high-temperature reactions in clays because the
deflections in the curve graphically represent changes in phase within
the material. This method analyzes substances under nonequilibrium
conditions, and corroborating a:-ray data must therefore be obtained
under similar conditions, by air-quenching samples at the desired tem-
peratures. If samples are ''soaked" thermally, equilibrium conditions are
approached; differences are then observed in phases and temperatures
of formation between soaked samples and air-quenched samples.
All thermal curves for kaolinite and halloysite show two significant
features below 1000° C.: (1) a prominen endothermic reaction between
500° and 600° C. which can be correlated with the absorption of energy
that results from loss of hydroxyl groups; (2) an intense exothermic
* Published with permission of the Chief, Illinois State Geological Survey,
t Associate Geologist, Division of Clay Resources and Clay Mineral Technology,
Illinois State Geological Survey, Urbana, Illinois,
193
194 HERBERT D. GLASS
reaction just below 1000° C. which has been attributed to the crystalliza-
tion of either mullite or what has been called 7-AI2O3.
The firing product at temperatures between the two prominent ther-
mal peaks is referred to as "metakaolin" and ''pro-mullite." The theory
(Insley and Ewell (1)) which correlates the exothermic peak with 7-AI2O3
implies that an intimate mixture of amorphous alumina and amorphous
silica is formed after the lattice is dehydrated, and that 7-AI2O3 is an
intermediate step in the formation of mullite.
The mullite hypothesis (Comeforo, Fischer, and Bradley (2)) postulates
that when hydroxyl groups are expelled, the noncrystalline compoundwhich is formed possesses some residual structure. On further heating,
the noncrystalline compound collapses into crystalline mullite nuclei
which are then free to grow normally. 7-AI2O3 is considered incidental
and not a step in the major reactions of the firing process.
Selection of Kaolinite Samples
Kaolinite is known to vary in degree of crystallinity because of ran-
dom displacement of structural layers by multiples of 6o/3; transitional
types range from well crystallized to poorly crystallized. The diffraction
diagrams of poorly crystallized kaolinite (similar to Brindley's (3)
fireclay material) contain fewer reflections than those for well crystal-
lized material. The degree of crystallinity should be known before kao-
linite samples are fired, because the results of firing may vary at certain
temperatures according to variation in crystallinity.
Different sequences of phase changes during firing may also develop
depending upon the type of impurity in the clay. For this reason, the
impurities associated with the clay, both kind and quantity, are even
more important than crystallinity. Coarse particles can be removed by
fractionation, and the finer impurities can usually be detected by x-ray
methods. Cations which cause fluxing may be detected by chemical analy-
sis.
A micaceous impurity, apparently intergrown with kaolinite, is often
observed; it is probably related genetically or diagenetically to the
kaolinite. (Kaolinites which contain mica that can be observed in dif-
fraction patterns are not discussed here.) Particularly important are
poorly crystallized kaolinites in which the micaceous material is not
detected in powder diffraction patterns but in which it appears as an
anhydride after the kaolinite is dehydrated.
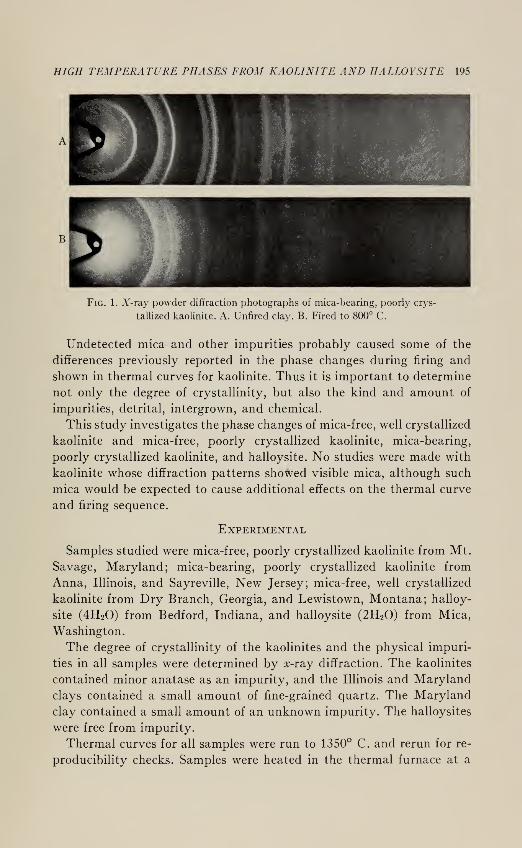
Powder diffraction patterns of unfired kaolinite and kaolinite fired to
800° C. are shown in Fig. 1. The unfired clay shows no effects of mica,
but at 800° C. the anhydride shows clearly. A few anatase lines are also
present.
HIGH TEMPERATURE PHASES FROM KAOLINITE AND HALLOYSITE 195
Fig. 1. X-ray powder diffraction photographs of mica-bearing, poorly crys-
taUized kaoKnite. A. Unfired clay. B. Fired to 800° C.
Undetected mica and other impurities probably caused some of the
differences previously reported in the phase changes during firing and
shown in thermal curves for kaolinite. Thus it is important to determine
not only the degree of crystallinity, but also the kind and amount of
impurities, detrital, intergrown, and chemical.
This study investigates the phase changes of mica-free, well crystallized
kaolinite and mica-free, poorly crystallized kaolinite, mica-bearing,
poorly crystallized kaolinite, and halloysite. No studies were made with
kaolinite whose diffraction patterns showed visible mica, although such
mica would be expected to cause additional effects on the thermal curve
and firing sequence.
Experimental
Samples studied were mica-free, poorly crystallized kaolinite from Mt.
Savage, Maryland; mica-bearing, poorly crystallized kaolinite from
Anna, Illinois, and Sayreville, New Jersey; mica-free, well crystallized
kaolinite from Dry Branch, Georgia, and Lewistown, Montana; halloy-
site (4H2O) from Bedford, Indiana, and halloysite (2H2O) from Mica,
Washington.
The degree of crystallinity of the kaolinites and the physical impuri-
ties in all samples were determined by x-ray diffraction. The kaolinites
contained minor anatase as an impurity, and the Illinois and Maryland
clays contained a small amount of fine-grained quartz. The Maryland
clay contained a small amount of an unknown impurity. The halloysites
were free from impurity.
Thermal curves for all samples were run to 1350° C. and rerun for re-
producibility checks. Samples were heated in the thermal furnace at a
196 HERBERT D. GLASS
O'C 100* 200* »0" «00* SOO* too* TOO" tOO* JOO* tOOO* 1100* 1200* ISOO
HIGH TEMPERATURE PHASES FROM KAOLINITE AND HALLOYSITE 197
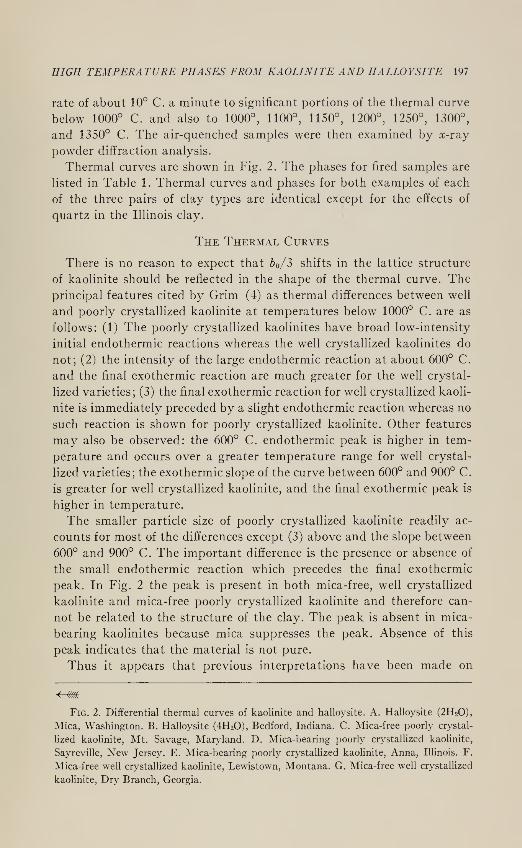
rate of about 10° C. a minute to significant portions of the thermal curve
below 1000° C. and also to 1000°, 1100°, 1150°, 1200°, 1250°, 1300°,
and 1350° C. The air-quenched samples were then examined by x-T3.y
powder diffraction analysis.
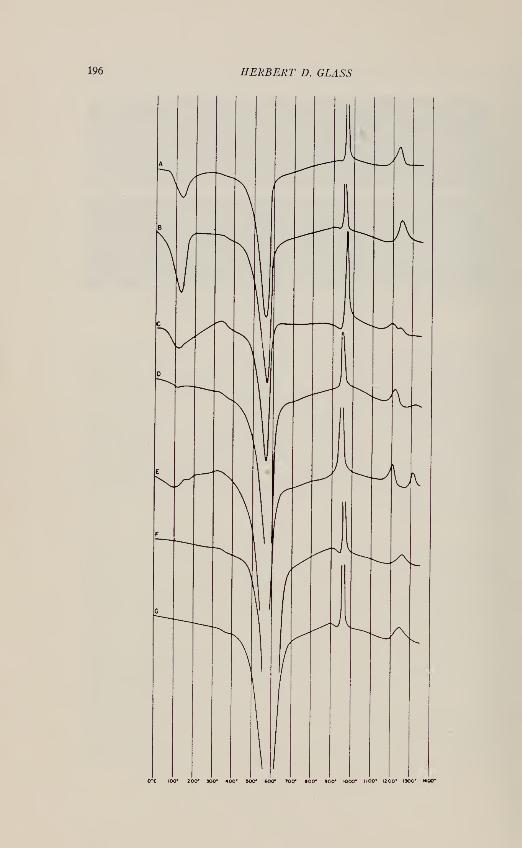
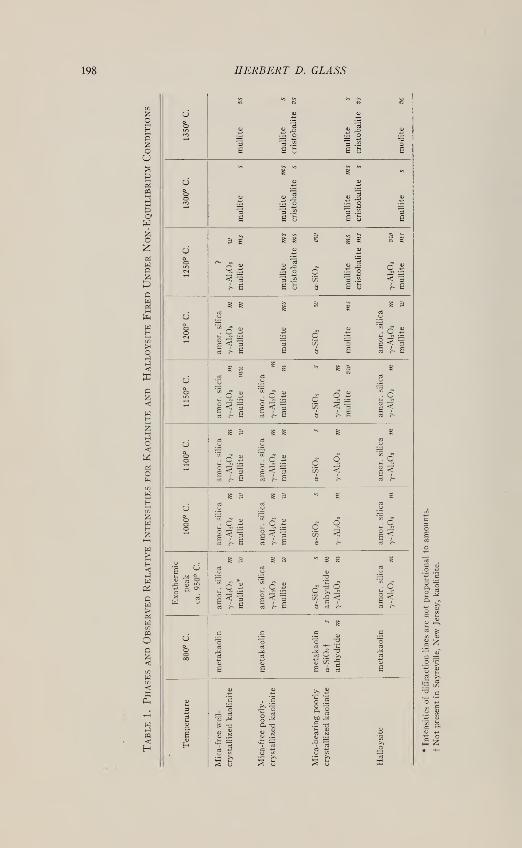
Thermal curves are shown in Fig. 2. The phases for fired samples are
listed in Table 1. Thermal curves and phases for both examples of each
of the three pairs of clay types are identical except for the effects of
quartz in the Illinois clay.
The Thermal Curves
There is no reason to expect that bo/S shifts in the lattice structure
of kaolinite should be reflected in the shape of the thermal curve. The
principal features cited by Grim (4) as thermal differences between well
and poorly crystallized kaolinite at temperatures below 1000° C. are as
follows: (1) The poorly crystallized kaolinites have broad low-intensity
initial endothermic reactions whereas the well crystallized kaolinites do
not; (2) the intensity of the large endothermic reaction at about 600° C.
and the final exothermic reaction are much greater for the well crystal-
lized varieties; (3) the final exothermic reaction for well crystallized kaoli-
nite is immediately preceded by a slight endothermic reaction whereas no
such reaction is shown for poorly crystallized kaolinite. Other features
may also be observed: the 600° C. endothermic peak is higher in tem-
perature and occurs over a greater temperature range for well crystal-
lized varieties; the exothermic slope of the curve between 600° and 900° C.
is greater for well crystallized kaolinite, and the final exothermic peak is
higher in temperature.
The smaller particle size of poorly crystallized kaolinite readily ac-
counts for most of the differences except (3) above and the slope between
600° and 900° C. The important difference is the presence or absence of
the small endothermic reaction which precedes the final exothermic
peak. In Fig. 2 the peak is present in both mica-free, well crystallized
kaolinite and mica-free poorly crystallized kaolinite and therefore can-
not be related to the structure of the clay. The peak is absent in mica-
bearing kaolinites because mica suppresses the peak. Absence of this
peak indicates that the material is not pure.
Thus it appears that previous interpretations have been made on
V /////
Fig. 2. Differential thermal curves of kaolinite and halloysite. A. Halloysite (2H2O),
Mica, Washington. B. Halloysite (4H2O), Bedford, Indiana. C. Mica-free poorly crystal-
lized kaolinite, Mt. Savage, Maryland. D. Mica-bearing poorly crystallized kaolinite,
Sayreville, New Jersey. E. Mica-bearing poorly crystallized kaolinite, Anna, Illinois, F.
Mica-free well crystallized kaolinite, Lewistown, Montana. G. Mica-free well crystallized
kaolinite, Dry Branch, Georgia.
198 HERBERT D. GLASS
cWo:^
wo
<o <o^ 1
R R »
o aj i
OJ -1 o
S —] *->
3 3 .!£ 3 .22
s s s £ b E
^ Co CO <o <-5
s s '^
d W (U
1 ii .^1 i! -2 y
s3 3 .22 "5 .^ "3
s E S E t; E
^ s i i 1 ii 1 i
cJ u 4J
1 "q.^ -
1
v5 3 .22
d .^'^
< 3=2 *i3 ." ^ "p
?- 6 £ b i E S ?~ £
i ^ iu u
1itl
4J
3d 1
^.6 ^
i .- £E 8 E
^ S ^ s 1 §rt ca
uo '" d S ^d ii
« ^ £
'^q
N'l i^^l £ ^^ ^- E g ^ s rt ^•
S s s s g Srt rt rt
l3 o u
1 "dii '^ q ^ d q ^d1-. ^ -'
^1 ?- E
C < "3
S ^- E^ <: E^a A- ca f-
s a S s S SKl cj ca
cJ _u _o
1 -ql d g c q2 <
rt ^ E rt ^- E <3 ?- ca ?~
s s s a "^ s s S
1 ^ a <n CO
0)t ^ o_ -o
Exothe
pea
ca.
95C
'I q ;^
E^lrt ^ Em§ ^- E
qlSc^ -g <8 rt ?-
"d
ca A-
•" S
c .S ^ c
^ "o 11 1 Pi ca00
E E E « § 1
D 4J ^ ii
4)
^11
s o is
-1s 13 MH. ^ "S !'S ijE <u .J2 ^ :S
c3 N
HI- ^
''T' "cS •?!1capS S % b s s w
ti
O *J
1) 4)
HIGH TEMPERATURE PHASES FROM KAOLINITE AND HALLOYSITE 199
impure materials, and there is no significant difference in the thermal
curves for poorly crystallized and well crystallized kaolinite except for the
effects caused by particle size.
Additional evidence for the presence of mica is indicated by the small
endothermic reaction at about 700° C. which is present only in mica-
bearing, poorly crystallized kaolinite. The reaction is caused by the
dehydration of the micaceous intergrowth, and the peak indicates the
presence of the anhydride. The peak is 150° C. higher than that observed
for illite (5) ; dehydration at higher temperatures is evidence that there
are muscovite-crystallization clay-micas intimately associated with
kaolinite whose physical properties and composition differ from those
of the original illite materials.
Above 1000° C, well crystallized kaolinite and halloysite show one
exothermic peak at about 1250° C; the poorly crystallized kaolinites
show two distinct peaks. Mica-bearing varieties have peaks at about
1200° and 1300° C, and the mica-free clay has peak temperatures at
about 1200° and 1240° C. The significance of the peaks is discussed below.
Characteristics of the halloysite thermal curve are: (1) there is a large
initial endothermic peak at about 100° C; (2) the large endothermic
peak near 600° C. occurs at approximately the same temperature as the
similar peak for poorly crystallized kaolinite but is reduced in intensity;
(3) the peak for halloysite returns to base line faster than it departs,
whereas well crystallized kaolinites show about equal rates of speed; (4)
the exothermic slope above 600° C. is similar to the slope for mica-bear-
ing, poorly crystallized kaolinite; (5) the small endothermic reaction at
about 950° C. is less intense than it is for well crystallized kaolinite; (6)
the exothermic reaction below 1000° C. is less intense than it is for well
crystallized kaolinite; (7) the curve above 1000° C. is similar to that of
well crystallized kaolinite, and the peak at 1250° C. is greater in in-
tensity.
Sequences of Phase Change
For kaolinite and halloysite, the development of high-temperature
phases depends on the type and amount of impurities as well as the
crystallinity and morphology of the clay.
(1) Mica-free kaolinite.—Diffraction patterns of well and poorly crys-
tallized kaolinites are identical up to 1000° C, which indicates that
neither structure nor impurities exerts influence below this temperature.
Diffraction patterns made after loss of hydroxyl groups are characterized
by a broad diffuse asymmetrical reflection at about 4.3 a.u. as well as
at least two weaker bands at higher diffraction angles which could not
be measured. These reflections are attributed to the noncrystalline com-
200 HERBERT D. GLASS
pound of metakaolin (2). As the samples were mica-free, there was noanhydride structure. The 960° C. exothermic peak coincides with the
formation of mullite, 7-AI2O3 and amorphous silica; the amount of
7-AI2O3 formed is less than that of mullite. The amount of mullite ob-
served in diffraction patterns depends upon the crystallinity of the clay;
diffraction intensities are greater in well crystallized varieties. The low-
temperature mullite nuclei are greatly elongated along the c-axis andgrow slowly, mostly in lateral directions, with increase of temperature
(2). The 960° C. exothermic peak also coincides with a decrease in in-
tensity of the 4.3 a.u. band.
Above 1000° C. the temperatures at which phases form apparently
depend on impurities. The 1200° C. exothermic peak for poorly crystal-
lized kaolinite and the 1250° C. peak for well crystallized kaolinite are
correlated with a second generation of mullite from 7-AI2O3 and amor-
phous silica. 7-AI2O3 diffraction lines and the reduced 4.3 a.u. band re-
tain their intensities until the start of the thermal peak; their disap-
pearance at the peak is accompanied by a sharp increase in intensity
of mullite diffraction lines. The higher-temperature mullite crystals do
not exhibit the pronounced elongation of the low-temperature nuclei.
After mullite has formed from 7-AI2O3 and amorphous silica, the re-
maining silica crystallizes to form cristobalite. The process is indicated
by the small exothermic peak at temperatures higher than the upper
mullite thermal peak. For well crystallized varieties cristobalite does not
form within the temperature range studied and therefore no exothermic
peak was observed. The reaction evidently occurs at temperatures above
1350° C. (6). On the other hand, poorly crystallized kaolinite formed
cristobalite at about 1240° C. and the thermal peak is therefore present.
(2) Mica-bearing kaolinite.—The sequence of high-temperature phases
is greatly affected by mica. Diffraction patterns made after loss of hy-
droxyl groups indicate the presence of a crystalline three-layer anhydride.
No micaceous impurity could be detected in powder diffraction dia-
grams or by petrographic analysis of unfired samples, but diffraction ef-
fects from well-oriented aggregates revealed a small amount of micaceous
material. For powder diagrams, the anhydride is apparent only after
the kaolinite structure is destroyed by firing. Analytical data indicate
0.53 and 0.60 per cent K2O for the Illinois and New Jersey clays respec-
tively, not unreasonable figures for small amounts of mica.
As powder x-ray and petrographic methods may not detect small
amounts of mica, they may not necessarily be accurate methods for
establishing purity of kaolinite.
The anhydride structure persists to the 950° C. exothermic peak, and
only 7-AI2O3 and amorphous silica is observed in diffraction patterns at
this temperature. The destruction temperature is about 100° C. higher
HIGH TEMPERATURE PHASES FROM KAOLINITE AND HALLOYSITE 201
than those observed by Grim and Bradley (5) for the original illite ma-
terials and is probably related to the different mode of origin of the two
micaceous materials. No mullite phase was observed at the 950° C.
peak.
The 1200° C. thermal peak is related to second generation mullite
formation from 7-AI2O3 and amorphous silica. The typical sequence
again occurs, mullite diffraction lines appear at the peak where 7-AI2O3
lines and 4.3 a.u. band disappear. The excess silica, converted to cristo-
balite at about 1300° C, is represented by a small thermal peak. Cristo-
balite does not form until all 7-AI2O3 has been used up in mullite forma-
tion. The mullite peak at 1200° C. is about 50° C. lower in impure
kaolinites. There is evidently a relationship between the peak tempera-
tures for mullite and cristobalite. Whenever the mullite peak is formed
at about 1200° C. the cristobalite peak occurs within the temperature
range studied (1240°-1320° C). But for pure clays the mullite peak
occurs at about 1250° C. and no cristobalite peak is present up to 1350° C.
(3) Halloysite.—The firing sequence for halloysite is identical with
that of pure kaolinite up to the 960° C. exothermic peak. For halloysite,
7-AI2O3 and amorphous silica are observed in diffraction patterns at this
temperature, similar to mica-bearing, poorly crystallized kaolinite.
7-AI2O3 and the 4.3 a.u. band disappear as mullite is formed at the
1250° C. exothermic peak. The larger size of the upper halloysite mullite
peak as compared to that for well crystallized kaolinite is evidently
caused by the crystallization of a greater amount of mullite at 1250° C.
Thus the observed firing sequence for halloysite and poorly crystallized
micaceous kaolinite is similar, the second mullite peak for halloysite
being about 50° C. higher. As with well crystallized kaolinite, no cris-
tobalite is formed up to 1350° C, and the excess silica remains amor-
phous.
The Dehydrated State
There are two possibilities for the structure of kaolin-type minerals
after loss of hydroxyl groups: (1) an intimate mixture of amorphous
alumina and amorphous silica; (2) an amorphous compound of alumina
and silica (metakaolin). The evidence of the 4.3 a.u. and related bands
in diffraction patterns implies that a noncrystalline compound is formed
because these bands are more prominent than those observed from
truly amorphous solids (2). It has been demonstrated by Brindley (7)
that single crystal photographs of dehydrated nacrite show a coordi-
nated structure and not an amorphous mixture. The metakaolin struc-
ture has been interpreted by Comeforo, Fischer and Bradley (2) as
"coordinated strings of alumina octahedra, with only some buckling of
the silica layer to provide the additional oxygen necessary to complete
the arrangement."
202 HERBERT D. GLASS
The diffraction effects of such a structure would be identical with
those to be expected from amorphous silica (8). In metakaolin the
silica is confined to the structure, but at temperatures following the
major exothermic peak, the compound has been destroyed and amor-
phous silica exists with 7-AI2O3. The decreased intensity 4.3 a.u. bandhere indicates that amorphous silica is present.
The Major Exothermic Peak
The phases at the major exothermic peak for pure kaolinite show that
although 7-AI2O3 and amorphous silica are always present, mullite is the
dominant phase. Experiments which have shown only 7-AI2O3 at the
prominent peak have evidently used mica-bearing kaolinite. As shown
in Table 1, only 7-AI2O3 is present in diffraction patterns at this temper-
ature for mica-bearing varieties.
The formation of a hard dense phase such as mullite more readily ex-
plains the large evolution of energy than does a subcrystalline compound
such as 7-AI2O3. The early mullite crystals are asymmetrical and strongly
suggest that "long strings of alumina coordination octahedra are carried
over directly from the one structure to the other" (2). As the earlier
mullite formation is determined by the structure of the original kaolinite,
any possibility of an intermediate phase such as 7-AI2O3 is eliminated.
The formation of mullite from the collapse of the metakaolin struc-
ture cannot use up all alumina, as shown by the formation of 7-AI2O3 at
the peak. An excess of silica is also indicated by the decreased intensity
4.3 a.u. band. Thus the formation of mullite directly from the meta-
kaolin phase leaves the remaining silica and alumina as separate oxides
in the form of amorphous silica and 7-AI2O3. The phases at the exothermic
peak for clean kaolinites should always show the three phases: mullite,
7-AI2O3, and amorphous silica. There is no amorphous alumina phase
which forms 7-AI2O3, so that the 7-AI2O3 for the first formation of mullite
is an accompanying phase and not an intermediate phase.
The growth of mullite nuclei is predisposed by the structure of the
clay mineral fired. Two factors must be taken into consideration: (1)
the degree of order in the stacking of the layers; (2) the morphology of
the crystal lattice. The amount of mullite detected at the exothermic
peak decreases as the structure becomes more random, and the thermal
peak decreases in intensity. The ^o/3 shifts in kaolinite evidently cause
the development of smaller mullite nuclei with resultant decrease in
thermal intensity.
For halloysite, the effect of morphology is pronounced. In the dehy-
drated kaolinite structure, coordinated alumina and silica layers are of
much greater lateral extent than in the halloysite metakaolin phase.
Breakdown of the kaolinite structure affords little opportunity for the
HIGH TEMPERATURE PHASES FROM KAOLINITE AND HALLOYSITE 203
alumina from one sheet to combine with alumina from other sheets to
form 7-AI2O3 except at the edges of the layers. In halloysite, the smaller
dimensions of the layers permit much greater interaction of alternate
alumina layers resulting in a decreased particle size of the primary mul-
lite nuclei. Mullite nucleation could hardly be expected to pass any grain
boundary and thus might well consist of too few units to afford recogniz-
able x-TSiy diffraction effects. The mullite nuclei are too small to be regis-
tered by a:-ray diffraction, and 7-AI2O3 is the only crystalline phase
actually observed. This results in a decreased intensity of the thermal
peak although the formation of mullite may well be the cause for the
effect.
For mica-bearing kaolinite, the effect of the intergrown micaceous
anhydride may also inhibit the size of early mullite crystals, ^o that only
7-AI2O3 is revealed in diffraction patterns and in reduced intensity of
the thermal peak.
Primary mullite forms directly from the metakaolin structure at the
major exothermic peak and is observed in diffraction patterns of mica-
free kaolinite but not in mica-bearing kaolinite or halloysite. Thus it
appears that morphology and impurities determine whether or not
mullite will be detected in diffraction patterns at the major exothermic
peak.
Although the alumina phase at the major exothermic peak is called
7-AI2O3 in this study, there are differences between it and 7-AI2O3
formed in the firing of aluminum hydrates. The diffraction lines of
alumina from kaolin-type minerals are symmetrical reflections, whereas
those of aluminum compounds are asymmetrical. The kaolin-type alu-
mina phase more nearly resembles a spinel structure than does pure
7-AI2O3. Furthermore, the size of the unit cell is slightly larger than that
of pure 7-AI2O3.
Secondary Mullite and Cristobalite
As has been shown, formation of primary mullite coincides with the
formation of 7-AI2O3 and amorphous silica. The latter phases persist
until the second exothermic reaction, at temperatures between 1200° and
1250° C, depending on the type of clay fired. The disappearance of the
diffraction lines of the silica and alumina phases at this point and the
accompanying increase in amount and sharpness of symmetrical mullite
lines indicates that a second generation of mullite has been accompanied
by growth of the primary mullite nuclei. The higher temperature mullite
forms from 7-AI2O3 and amorphous silica, and the alumina is now an
intermediate phase in mullite formation. In halloysite and mica-bearing
kaolinite, the early crystallites do not develop until the reaction between
7-AI-2O3 and amorphous silica takes place. The 1250° C. mullite thermal
204 HERBERT D. GLASS
peak for halloysite is more intense than the similar peak for well crystal-
lized kaolinite, and the 1200° C. mullite peak for mica-bearing kaolinites
is more intense than the similar peak for mica-free, poorly crystallized
kaolinite. This indicates a sudden growth of primary crystallites as well
as crystallization from 7-AI2O3 and amorphous silica for those clays
which show no mullite in diffraction diagrams at the major exothermic
peak.
The amorphous silica which remains after formation of secondary
mullite forms cristobalite at the exothermic peak above the second
mullite peak. Within the temperature range used, cristobalite peaks were
observed only in impure specimens. The upper mullite peak is 50° C.
lower in the impure poorly crystallized kaolinites, and the cristobalite
peak is wel^below 1350° C.
The presence or absence of mullite in diffraction patterns at the major
exothermic peak is not related to formation of secondary mullite at
1200° or 1250° C. Primary mullite is observed only for mica-free kaolin-
ites, but the poorly crystallized variety forms secondary mullite at
1200° C. and the well-crystallized clays at 1250° C.
The organization of the unfired clay does not explain the difference
in temperature for the second mullite peak. The clay with the highest
degree of order in the stacking of structural units (well-crystallized
kaolinite) and that with the lowest degree of order (halloysite) both
have upper mullite peaks at 1250 ° C.
The variation in temperature may therefore be caused by impurities.
Physical impurities such as quartz will not cause any lowering in tem-
perature of peaks. It is thus possible that potassium and other fluxing
elements present in mica and other impurities may be the cause for the
variation.
In general, presence of fluxing impurities lowers the temperature of
formation of secondary mullite and cristobalite, and it is possible that
increase in mica could cause further changes limited by the fluxing action
of potassium.
When the secondary mullite peak occurs at about 1200° C. and the
cristobalite peak below 1350° C. the inversion of small amounts of
quartz to cristobalite is always accompanied by the crystallization of
cristobalite from amorphous silica. If large amounts of quartz impurity
are present (amount unknown), no inversion occurs within the tempera-
ture range studied, nor does crystallization from amorphous silica take
place. The thermal curve then shows only one peak at about 1200° C.
For clays where the mullite peak occurs at about 1250° C, no cristo-
balite peak is formed regardless of how much quartz impurity is present.
Although the formation of cristobalite from the crystallization of
amorphous silica and the inversion of quartz occur at the same tempera-
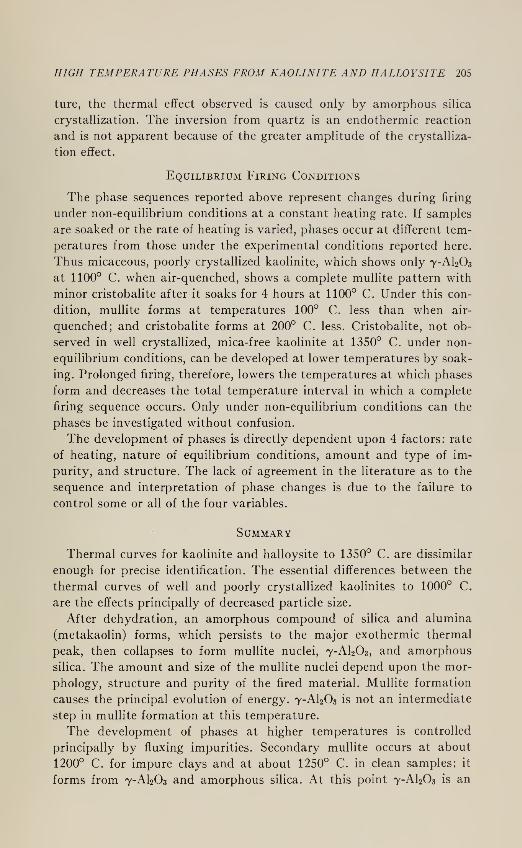
HIGH TEMPERATURE PHASES FROM KAOLINITE AND HALLOVSITE 205
ture, the thermal effect observed is caused only by amorphous silica
crystallization. The inversion from quartz is an endothermic reaction
and is not apparent because of the greater amplitude of the crystalliza-
tion effect.
Equilibrium Firing Conditions
The phase sequences reported above represent changes during firing
under non-equilibrium conditions at a constant heating rate. If samples
are soaked or the rate of heating is varied, phases occur at different tem-
peratures from those under the experimental conditions reported here.
Thus micaceous, poorly crystallized kaolinite, which shows only 7-AI2O3
at 1100° C. when air-quenched, shows a complete mullite pattern with
minor cristobalite after it soaks for 4 hours at 1100° C. Under this con-
dition, mullite forms at temperatures 100° C. less than when air-
quenched; and cristobalite forms at 200° C. less. Cristobalite, not ob-
served in well crystallized, mica-free kaolinite at 1350° C. under non-
equilibrium conditions, can be developed at lower temperatures by soak-
ing. Prolonged firing, therefore, lowers the temperatures at which phases
form and decreases the total temperature interval in which a complete
firing sequence occurs. Only under non-equilibrium conditions can the
phases be investigated without confusion.
The development of phases is directly dependent upon 4 factors: rate
of heating, nature of equilibrium conditions, amount and type of im-
purity, and structure. The lack of agreement in the literature as to the
sequence and interpretation of phase changes is due to the failure to
control some or all of the four variables.
Summary
Thermal curves for kaolinite and halloysite to 1350° C. are dissimilar
enough for precise identification. The essential differences between the
thermal curves of well and poorly crystallized kaolinites to 1000° C.
are the effects principally of decreased particle size.
After dehydration, an amorphous compound of silica and alumina
(metakaolin) forms, which persists to the major exothermic thermal
peak, then collapses to form mullite nuclei, 7-AI2O3, and amorphous
silica. The amount and size of the mullite nuclei depend upon the mor-
phology, structure and purity of the fired material. Mullite formation
causes the principal evolution of energy. 7-AI2O3 is not an intermediate
step in mullite formation at this temperature.
The development of phases at higher temperatures is controlled
principally by fluxing impurities. Secondary mullite occurs at about
1200° C. for impure clays and at about 1250° C. in clean samples; it
forms from 7-AI2O3 and amorphous silica. At this point 7-AI2O3 is an
206 HERBERT D. GLASS
intermediate step in mullite formation. The silica which remains forms
cristobalite between 1240° and 1320° C. in impure clays and probably
above 1350° C. in pure clays. Fluxing impurities tend to lower the
temperature of thermal peaks for mullite and cristobalite.
Variation in amount and type of impurities, rate of heating, degree of
equilibrium reached during firing, and structure of the clay all affect the
sequence and temperature of phase formation. Failure to standardize
firing conditions is a primary cause of lack of agreement in the literature
as to the firing sequence of kaolinite and halloysite.
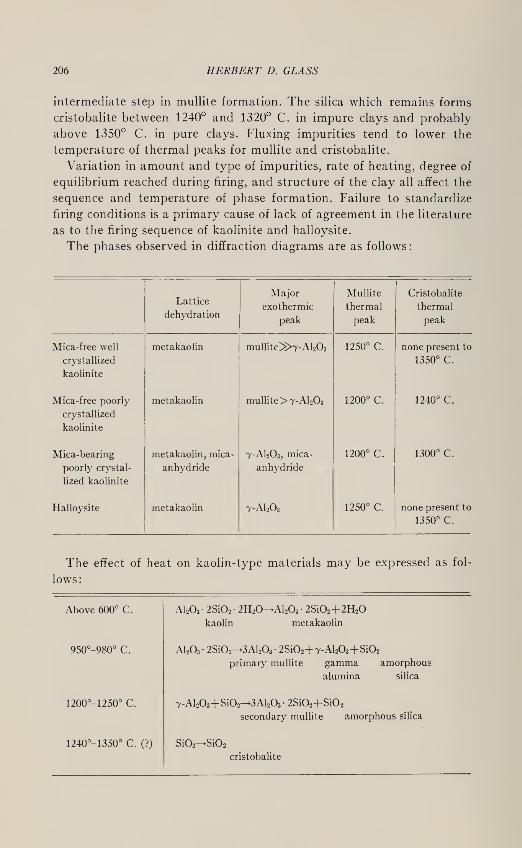
The phases observed in diffraction diagrams are as follows
:
Lattice
dehydration
Major
exothermic
peak
MulHte
thermal
peak
Cristobalite
thermal
peak
Mica-free well
crystallized
kaolinite
metakaolin mullite»T-Al203 1250° C. none present to
1350° C.
Mica-free poorly
crystallized
kaolinite
metakaolin mullite> 7-AI2O3 1200° C. 1240° C.
Mica-bearing
poorly crystal-
lized kaolinite
metakaoHn, mica-
anhydride
T-AI2O3, mica-
anhydride
1200° C. 1300° C.
Halloysite metakaolin T-AI2O3 1250° C. none present to
1350° C.
The effect of heat on kaolin-type materials may be expressed as fol-
lows:
Above 600° C. AI2O3 • 2Si02 • 2H20^Al203 • 2Si02+2H20
kaolin metakaolin
950°-980° C. A1203- 2Si02-^3A]203- 2Si02+7-Al203+Si02
primary mullite gamma amorphous
alumina silica
1200°-1250° C. 7-Al203+Si02^3Al203- 2Si024-Si02
secondary muUite amorphous silica
1240°-1350° C. (?) Si02-^Si02
cristobalite
HIGH TEMPERATURE PHASES FROM KAOLINITE AND HALLOYSITE 207
References
1. Insley, Herbert, and Ewelx, R. H., Thermal behavior of the kaoHn minerals: /. Res-
Nat. Bur. Standards, 14 (5) 615H527 (1935); i?P 792; Ceram. Abstracts, August 1935, p-
201.
2. CoMEFORO, J. E., Fischer, R. B., and Br.\dley, W. F., Mullitization of kaolinite:
Am. Ceram. Soc, 31, No. 9, 254^259 (September 1948).
3. Brindley, G. W., and Robinson, K., Randomness in the structures of kaoHnitic clay
minerals: Trans. Farad. Soc, 42B (1946).
4. Grim, Ralph E., Differential thermal curves of prepared mixtures of clay minerals:
Am. Mineral., 32, Nos. 9 and 10, 493-501 (1947).
5. Grim, R. E., and Bradley, W. F., Investigation of the effect of heat on the clay minerals
iUite and montmorillonite: /. Am. Ceram. Soc, 23, No. 8, 242-248 (1940).
6. ZvANUT, F. J., AND VVooD, L. J., X-ray investigation of the pyrochemical changes in
Missouri halloysite: /. Am. Ceram. Soc, 20, 251-257 (1937).
7. Brindley, G. VV., personal communication.
8. EiTEL, W., Elektronen-Mikroskopie und Beugung silikatischer Metaphosen: Preus-
sischen Akademie der Wissenschaften, Nr. 5 (1943).
Manuscript received Feb. 23, 1953.


![Halloysite - Texas Rho Chapter of Pi Mu Epsilonpmetxstate.weebly.com/.../slidesreyes110912.pdf · Halloysite Introduction Halloysite [Al 2 (OH) 4 Si 2 O 5 •2H 2 O] is an inorganic](https://static.fdocuments.us/doc/165x107/60a0dac439717f0b810b4694/halloysite-texas-rho-chapter-of-pi-mu-halloysite-introduction-halloysite-al-2.jpg)