High temperature equation of state for aluminum TEMPERATURE EQUATION OF STATE FOR ALUMINUM ' BY R....
21
NASA TECHNICAL NOTE z c HIGH TEMPERATURE EQUATION OF STATE FOR ALUMINUM by R. J. Naumanpz George C. Marshall Space Flight Center Marshall Space Flight Cepzter, Ala. 35812 TN D- -- 5892 RJi” 23. NM ‘WLQL) NATIONAL AERONAUTICS AND SPACE ADMINISTRATION WASHINGTON, D. C. AUGUST 1970 https://ntrs.nasa.gov/search.jsp?R=19700024615 2018-07-13T01:12:21+00:00Z
Transcript of High temperature equation of state for aluminum TEMPERATURE EQUATION OF STATE FOR ALUMINUM ' BY R....

NASA TECHNICAL NOTE
z c
HIGH TEMPERATURE EQUATION OF STATE FOR ALUMINUM
by R. J. Naumanpz
George C. Marshall Space Flight Center Marshall Space Flight Cepzter, Ala. 35812
TN D- - - 5 8 9 2
RJi”
23 . N M ‘WLQL)
N A T I O N A L AERONAUTICS A N D SPACE A D M I N I S T R A T I O N W A S H I N G T O N , D. C. A U G U S T 1970
https://ntrs.nasa.gov/search.jsp?R=19700024615 2018-07-13T01:12:21+00:00Z

TECH LIBRARY KAFB, NM
~ TECHNICA 1. REPORT NO. 2. G O V E R N m N T ACCESSION NO.
- .
. -
NASA TN D-5892 ___ -- - 4. T I T L E AND SUBTITLE
High Temperature Equation of State for Aluminum
R. J. Naumann 9. 'PERFORMING ORGANIZATION NAME AND ADDRESS
~ - . ~ _ _ 7. AUTHOR(S)
_ _ . .
George C. Marshall Space Flight Center 35812 2
- ____. _ _ _ _ _ ,
15. SUPPLEMENTARY NOTES
Prepared by Space Sciences Laboratory, Science and Engineering Directorate.
. - ___ - - - L . _ _ 16. ABSTRACT
, - RE, 033262b 3. RECIPIENT'S CATALOG NO.
5. REPORT DATE
6. P E R F O R G N G ORGANIZATION CODE
August 1970
8. PERFORMING ORGANIZATION REPOR+
IO. WORK U N I T NO.
-. 11. CONTRACT OR GRANT NO.
IJI'TYPE OF REPOR-; 8 PERIOD COVEREI
Technical Note I ~ ~ S P O N S O R I N G AGENCY CODE
An equation of state. is developed for metallic elements that describes both the solid and liquid phase at very high temperatures and pressures. Computations are carried out for aluminum which are compared with experimental results obtained from shocking PORUS samples.
. - _ - . ~ ~ - - ~
18. DISTRIBUTION STATEMENT
Distribution Categories
7.. KEY WORDS
-- - 9. SECURiTY CLASSIF. (d this report)
. . Unclassified
*For sale by the Clearinghouse for Federal Scientific and Technical Information Springfield, Virginia 22151


.
TABLE OF CONTENTS
Page
SUMMARY . . . . . . . . . . . . . . . . . . . . . . . . . . . . . . . . . . . . . . . . . i
INTRODUCTION ...................................... 1
FORMULATION . . . . . . . . . . . . . . . . . . . . . . . . . . . . . . . . . . . . . 2
Lattice Terms ................................... 2 Vibrational Terms ................................ 2 The Liquid Potential Function ......................... 3 The Liquid Vibrational Component ...................... 4 Electronic Contributions ............................ 6
COMPUTATIONAL RESULTS ............................ 7
Specification of Constants ........................... 7 9 9
The Fusion Curve and Equation of State Surfaces . . . . . . . . . . . . Comparison with Experimental Results . . . . . . . . . . . . . . . . . . .
CONCLUSIONS . . . . . . . . . . . . . . . . . . . . . . . . . . . . . . . . . . . . . . 14
REFERENCES . . . . . . . . . . . . . . . . . . . . . . . . . . . . . . . . . . . . . . 15
iii

L I S T OF TABLES
Table Title Page
I . Summary of Hugoniot Data for Aluminum. . . . . . . . . . . . . . . . 13
L I S T OF ILLUSTRATIONS
Figure Title Page
Comparison of solid and liquid potentials. . . . . . . . . . . . . . . . 5 I.
2. Behavior of heat capacity for solids and liquids in the high temperature regime. . . . . . . . . . . . . . . . . . . . . . 7
3. Transition of heat capacity from liquid to gaseous behavior . . . ;8
4. Gibbs energy isotherms. . . . . . . . . . . . . . . . . . . . . . . . . . . 9
5. Melting curve deduced from Gibbs energy plot . . . . . . . . . . . . 9
6 . Pressure isotherms . . . . . . , . . . . . . . . . . . . . . . . . . . . . . 10
7. Energyisotherms. . . . , . . . . . . . . . , . . . . . . . . . . . . . . . . 11
8. Isotherms on S-V plot. . . . . . . . . . . . . . . . . . . . . . . . . . . . . 11
9. Isoenergyl ines . . . . . . . . , . . . . . , . . . . . . . . . . . . . . . . . . 11
10. D-u plots comparing computed results with experimental data points. . . . . . . . . . . . . . . . . . . . . . . . . . . 12
11. P-u plots comparing computed results with experimental data points. . . . . . . . . . . . . . . . . . . . . . . . . , . 12
12. T-up lo t s . . . . . . . . . . . . . . . . . . . . . . . . . . . . . . . . . . . . . 14
14 13. S - u p l o t s . . . . . . . . . . . . . . . . . . . . . . . . . . . . . . . . . . . . .
iv
I
HIGH TEMPERATURE EQUATION OF STATE FOR ALUMINUM ' BY
R. J. Naumann
SUMMARY
An equation of state is developed that is capable of describing metallic elements in both solid and liquid phase from ambient temperature and pressures to states of extreme temperature and pressure. A novel technique for treating the atomic vibrational contributions is introduced by assuming each atom vibrates independently in a tan' potential. The Schroedinger equation can be solved exactly for this potential function, and the quantum mechanical parti- tion function is computed directly. a continuous, thermodynamically consistent descrip- tion of metals i s obtained which reduces to an Einstein solid at moderate temperatures and to an ideal gas in the limits of high temperatures and/or large volumes.
In this manner
Detailed numerical computations a r e carried out for aluminum. All the constants required to configure the model a r e obtainable from elementary thermodynamic data at ambient conditions. Excellent agreement i s obtained with experimental shock compression data on solid and porous samples at pressures to 5 Mb and temperatures to 25 000°K.
INTRODUCTION
Substantial progress has been made in recent years in understanding the behavior of metals at extreme temperatures and pressures. Shock com- pression techniques have achieved pressure measure- ments to approximately 10 Mb and temperatures of tens of thousands degrees [ I ] . At the lower pres- sures, the Debye or Einstein model for energy and the Mie-Gruneisen equation for pressure is adequate and zero-degree isotherms were extracted from shock measurements by using these relations to subtract out
the thermal contributions. It was found that a Morse potential predicted the zero-degree isotherms to a fair degree of accuracy [2] , which confirmed an earlier suggestion by Slater [3].
A s experimental pressures and temperatures increased, various inadequacies in the theory became evident. Electronic contributions were introduced. For compressible metals, anharmonic terms became significant. These were treated by Al'tshuler et al. using the free volume theory of Lennard-Jones and Devonshire [ 41 . Pastine [ 51 usetl the perturbation method of Liebfried and Ludwig [ 61 to correct for anharmonic effects.
For the high-temperature states reached by shocking porous samples, it was found that the behavior became more ideal gas-like. Kormer 171 proposes a set of empirical interpolation equations to transform solid-like behavior of energy, pressure, and heat capacity to the ideal gas relations. Urlin [ 81 proposed an empirical free energy function to account for phase transitions. All of these empirical relations require adjustable constants which a re evaluated from experimental high-pressure data. Furthermore, there is no guarantee of thermody- namic consistency between them'.
An equation of state for metals is developed in this work th@t i s capable of describing the liquid-dense vapor phase 'as well as the solid phase from ambient conditions to temperatures and pressures exceeding the present experimental range. Rather than use in- terpolation equations to transform the behavior of a solid to that of a gas a t high temperatures o r at low densities, the approach will be $0 start with empirical# interatomic potential functions and develop the entire equation of state using quantum statistical mechanics. The only empirical constants required are obtainable from elementary thermodynamic quantities such as
I. This report was based on work submitted in partial fulfillment of the requirements for the degree of Doctor of Philosophy in the Department of Physics in the Graduate School of the University of Alabama.
2. Kormer's pressure, energy, and heat capacity were chosen in such a manner to be consistent among themselves.
L

heat of vaporization, compressibility, entropy, etc. In this manner the behavior of a metal thoughout the entire high-pressure, high-temperature regime can be predicted from its properties a t ambient conditions. Since all the thermodynamic properties a r e derived from the partial function, thermodynamic consistency is guaranteed. This allows a complete thermodynamic description , so that phase transitions a re described naturally from Gibbs energy considerations.
FORMULATION
It will be assumed that the Helmholtz energy can be expressed as the sum of three independent contributions: the lattice term, F the ionic
vibration term, F , and the free electronic term, F
Since all thermodynamic functions a r e derivable from the Helmholtz energy, it immediately follows that they all can be expressed a s sums of these three contributions. The fact that there a r e interactions between the free electrons and the lattice will be accounted for by introducing an effective electron mass.
k’
V e ’
Lattice Terms
Since the Morse potential has been found to be a reasonable empirical representation for the lattice energy of a metallic solid, the Helmholtz energy for the zero-degree lattice is written
where L i s the zero-degree heat of vaporization,
o r total Gnding energy, 5 = (V/V )
empirical constant determined from the compres- sibility. From the relation F = E - TS, the internal energy, Ek, of the zero-degree lattice i s identical to
Fk. The zero-degree isotherm is found from the
and b i s an
relation
and is
Vibrat ional Terms
At moderate temperatures, the ionic vibrational contributions may be computed from the assumption that the ions behave as harmonic oscillators. This assumption leads to the Einstein model, in which i t is assumed that all atoms vibrate independently at the same frequency, o r to the Debye model which considers a distribution of normal mode frequencies. At very high temperatures, the vibrational amplitudes a re such that nonlinear restoring forces must be con- sidered. This i s accounted for by assuming each atom vibrates independently3 in a potential well given by
( 3 )
When the displacement x is small compared to the atomic spacing a, the potential reduces to
d e r e WE is the Einstein frequency.
oscillator, w2 = K/m, therefore, equation (4) has the form 1/2 & where K is the spring constant corresponding to the Einstein frequency.
For a harmonic
At larger displacements, xe*a , the potential approaches infinity which describes a hard sphere collision between point masses. This roughly cor- responds to nuclear collisions between neighboring atoms whose position expectation values a re +a.
The choice of the tan’ functional representation was made because i t behaves as desired in the limits
.~ - 3. The assumption of independent vibration i s justified because even at moderate temperatures the Einstein
and Debye models give almost identical results.
2

and also because it allows a closed-form-eigenvalue solution to the Schroedinger equation. The energy eigenvalues are‘
where y is the Gruneisen ratio, -(a In w/a In V) . Formulation of y for solids has received extensive treatment in the literature.
H ~ W ; + E z 0 ) 1 / 2 ,
( 5)
n
n = 0,1,2,. . . where E is the degeneracy energy ?,lf2 / (8 m a’) .
The vibrational partition function Z for N atoms, each with three degrees of freedom, is
(D - E,/ kT In Z = 3N In e ( 6 )
n=O
where k i s the Boltzmann constant.
The various thermodynamic functions a re obtained from the partition function in the usual manner.
The brackets ( ) denote the ensemble average; eg. ,
n=O
At solid densities, Xw >> E and the Boltzmann
factor reduces to exp [-(nZEo + sw)/kT] . Unless
kT >> Mw, the BoltZmaM factor will become negligibly small at low enough values of n to prevent the n2E
term from contributing significantly. In this case, che Helmholtz energy reduces to
F = -3NkT’ In f e-dLd/ltT
n=O m ( 14)
n=O
-En/kT = 3NkT In (1-e -,kfw/kT ) F = -kT In Z = -3NkT In 7 e 2 (7) V
which is the well-known result from the Einstein
The Liquid Potential Function aE
The zero-degree potential energy in the liquid cw ( +)v = s [<e:> - (en)‘] 2
(9 ) phase is represented by and
Differentiating equation (5), the P contribution becomes where L1, B, Em, and El a r e empirical constants
peculiar to the liquid phase, and L and b a r e the
same a s in the solid potential, equation ( I ) . This ’ ( 12) particular form was chosen for the following reasons.
4. See problem 12 in D. ter Haar, Problems in Quantum Mechanics, Academic Press, New York, 1960. Actually, there should be a 1/2 added to n i n both terms corresponding to the ground state. However, the ground state energy is included in the zero-degree lattice terms; therefore, -it is suppressed in the vibrational terms.
3

For 5 ti the repulsive term is the same as in the Morse potential, but the attractive term is the form resulting from van der Waals forces. This potential function cannot be extended to small 5 because eventually the attractive term will override the repulsive term. To avoid this, the form given for 5 5 ti was chosen. This is identical to the Morse curve for the solid except that E and 51 have
been introduced to account for the heat of fusion and different compressibility of the liquid phase.
m
The pressure is again given by P = - (8F /8V) k k T and is
'k
Of the four additional constants introduced in this potential, two are required to match the F and P
at the observed energy and pressure at the melting point5. Figure I compares the liquid potential with the Morse potential for aluminum.
k 5 = ti. The remaining two are chosen to produce
k
The Liquid Vibrat ional Component
The LennardJones Devonshire model of liquid and dense vapors treats each atom as though it were moving in a cage of i ts nearest neighbors which a re considered fixed. Since the number of nearest neighbors i s usually 12, a high degree of symmetry exists, and a spherically symmetric potential may be assumed. Following these concepts, the same form of potential function as assumed for the solid, equation ( 3 ) , is used to describe the behavior of an atom in such a cage.
The partition function will be somewhat different from equation (6), however, because of particle
indistinguishability. In the solid phase, particles a re , in a sense, distinguishable because of their
definite position in the lattice. In a liquid, particles can exchange positions and thereby lose their distinguishability. The partition function must be adjusted accordingly for "proper Boltzmann counting. " Since each atom occupies a cell with volume (2a) [ 3 J ,
N a volume containing N atoms spaced a t average distance, a, can have N/8 cells. There a r e (N/8) ways of arranging N particles among N/8 cells, of which N! a r e redundant because of particle indistin- guishability. The partition function becomes
- E /kT z= - 3N r, e n
n= 0 N!
The Helmholtz energy becomes, using Stirling's approximation,
* -fn/kT Fv = NkT (In 8 - I) -3NkT In 7, e
n=O
The energy eigenvalues, E a r e given by n' equation (5) ; the internal energy and heat capacity a r e given by equations (8) and (9 ) , respectively, and the pressure i s given by equations ( 10) and ( 12), except that the Einstein frequency and the Gruneisen ratio will have different values for the liquid.
It is interesting to examine the behavior of the liquid in the limit of large volumes where Hw-0. In this limit, the atom moves freely within i ts "cage." Encounters with the wall correspond to eIastic point collisions characteristic to an ideal gas. Since 1T >> E the summations may be replaced with
integrations and 0'
( 19) n=O
The Helmholtz energy becomes r
2 V 3 F = -NkT -- NkT In
5. The parameter, t i , i s the value of 5 corresponding to minimum potential in the liquid phase. It will generally be more than unity because the distribution of the atoms in liquid metals is random instead of the more efficient close packing usually associated with crystal lattices. This choice of functional dependence was made to assure P (ti) = 0 and to make the F and P approach the same values as the solid phase a t small 5. k k k
4

i. 0
0.8
0 . 6
0.4
0 . 2
, 3 W" ' 0
-0.2
-0.4
-0.6
-0.8
-1.c
I ---- LIQUID (MODIFIED MORSE + VAN DER WAArS) . I
I
I 0.5 0.7 0.9 1.1 1.3 1.5 4.7 1.9 2.1 2.3
5 = (V/Vn)'/3
Figure 1. Comparison of solid and liquid potentials. (The liquid potential approaches the solid at high compressions, differs by approximately the heat of fusion at V = V and exhibits a van de r Waals
0'
behavior a t large volumes. )
Similarly, the other equations reduce to the ideal gas
relations, E =- McT, P = =, and
cW - ~ c . Using the result of equation ( 2 0 ) ~ the
relations S = (E-F)/T, and the fact that E = F
the entropy in this limit becomes
which is the well-known Sakur-Tetrode equation for the entropy of an ideal gas. 2
v 3 v v - -
At liquid densities, )iw >> E and the treatment
of the vibrational component of liquids at moderate temperature reduces to the Einstein model. However, the Einstein frequency and the Gruneisen ratio will be
k k'
s = - 5 Nk+ 3 Nk In [s (JL)'/~I, (21) different in the case of a liquid. 2
5

A crude estimate of the vibrational frequency can be made by considering an atom at the origin with an atom at i a . The change in potential resulting from a displacement x is
grand partition function, one obtains [ 91
and m
e312de E = g O e o / I C T ’ Using only the repulsive term in the Morse Potential,
Q(r) = Qoe 2b( i-r/ao)
where
The chemical potential p must be found for a given volume and temperature by a numerical iterative solution of equation (27) , then equation (28) may be integrated to find E . The pressure is obtained from
the identity, P V = - E, which holds for Fermi
a s well as Bose gases. Since, by definition, the chemical potential i s the Gibbs energy per atom, G = Np. Using the identity G = F + PV, the electronic contribution to the Helmholtz energy may be found.
For temperatures that a r e small compared to
2 3
the Fermi temperature, the integral in equation (27) may be approximated I
L
For small displacements,
2b( 1-6) 4b2x2 T- +(x) = 2 Q e
This has the form of a harmonic oscillator potential with a frequency
(25)
1 3 from which y = - b 6. The w as a function of
volume can be found from equation (25) and the value of w at 6 = I. This can be obtained from entropy
measurements. In the limit of the Einstein model, the entropy becomes
0 7?k2T2 + . . . . , ! J = e - - F 12 EF
and equation (28) becomes
1 ’* -3Nkln (1-e -Kw/kT
‘= 3m( e w kT- l ) (30) (26)
-Nk (In 8 - I) . where the Fermi energy cF i s
Given S and T, the above expression can be solved for w.
Figures 2 and 3 show how the vibrational com- ponent of heat capacity approaches ideal gas-like behavior in the limit of high temperatures or low densities.
The f i rs t terms in equations (29) and (30) a r e the zero-degree degeneracy energy. This is already contained in the lattice terms and will therefore be suppressed. The electronic contribution to the Helmholtz energy is
2 Nek2 T2 F = -
e €F
Electron ic Contr ibut ions
The electronic terms are obtained by treating the free electrons a s an ideal Fermi gas. From the
6
L

6
5
4
- m Y
u - % 3 1 -
> U
2
1
0 100
IDEAL GAS
-
ELECTRONIC CWTRIBUTION -
I 1wO 10,m
T ( ' K )
Figure 2 . Behavior of heat capacity for solids and liquids in the high temperature regime. (Breaks in the curves represent phase changes.)
The Fermi energy is computed from the observed
The Cve is obtained electronic heat capacity coefficient which can be measured at low temperatures.
by differentiating equation (30) , giving
7? Nk2T
F 've ( 3 2 )
At very low temperatures, the electronic terms dominate the heat capacity, which is experimentally observed to depend linearly on T . The value of cF obtained in this manner will be somewhat different
from the value obtained from equation ( 3 I) if the f ree electron mass is used for m. This difference arises from the interaction of the electrons with the lattice. The effective electron mass is defined a s that mass which makes equation (31) agree with the Fermi energy obtained from the experimental heat capacity.
COM PUTAT I ONAL RES ULTS
S pec i f icat ion of Con s ta n t s
The equation of state developed in the preceding section was applied to aluminum. The various constants required a r e obtained in the following manner.
The zero-degree heat of vaporization L is
found from tables [ I O ] to be 86 400 kcallmole. The volume a t 0°K is obtained by extrapolation of thermal expansion data and is taken to be 2.736 gm/cm3. From compressibility data, b is found to be 3.241.
The Slater relation [ ii] , 2 i VP;L/P;Z, where primes denote Y = - - - -
7
6
5
- 4 - D
-u m 1 - U > 3 -
2 -
1. _- 0 . I 1
r- DULONG-PETIT
- -
IDEAL GAS
I 10 100
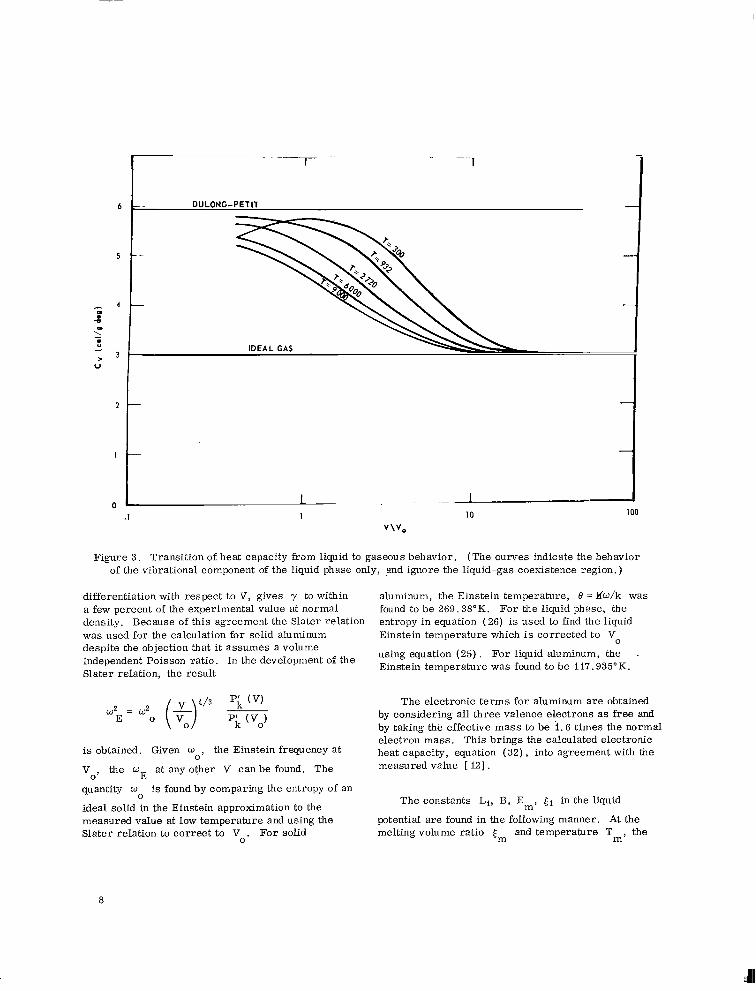
Figure 3 . Transition of heat capacity from liquid to gaseous behavior. (The curves indicate the behavior of the vibrational component of the liquid phase only, and ignore the liquid-gas coexistence region. )
differentiation with respect to V, gives y to within a few percent of the experimental value at normal density. Because of this agreement the Slater relation was used for the calculation for solid aluminum despite the objection that i t assumes a volume independent Poisson ratio. In the development of the Slater relation, the result
4/3 p;, (V)
P;, (V0) w2 E = w20 (e) is obtained. Given w the Einstein frequency a t
Vo, the w
quantity w is found by comparing the entropy of an
ideal solid in the Einstein approximation to the measured value at low temperature and using the Slater relation to correct to V . For solid
0'
at any other V can be found. The E
0
aluminum, the Einstein temperature, 0 = Kw/k was found to be 269.38"K. entropy in equation (26) is used to find the liquid Einstein temperature which is corrected to V
using equation (25) . For liquid aluminum, the -
Einstein temperature was found to be 117.935"K.
For the liquid phase, the
The electronic terms for aluminum a re obtained by considering all three valence electrons a s f ree and by taking the effective mass to be I . 6 t imes the normal electron mass. This brings the calculated electronic heat capacity, equation ( 3 2 ) , into agreement with the measured value [ 121.
The constants Li, B, Em, in the liquid
potential a r e found in the following manner. At the melting volume ratio ( and temperature T , the m m
8

energy is Ek( E,) + E, (t,, Tm) + Ee ( C ~ , T,)
which must equal to the energy of the zero-degree crystal L plus the heat to meit, which i s known
experimentally. All quantities required to compute Ev( 6,. T,) and Ee(Em, Tm) have been specified;
thus, Ek(tm) i s known. Similarly,
Pk(tm) + Pv(Em, Tm) + Pe(Cm* Tm) = P a h ;
therefore, P (5 ) i s known. Using equations (15)
and ( 16) for 5 2 El, simultaneous equations containing L, and B are obtained. Their solution for aluminum yields ti = 72 53 1 cal/mole, and B = 146 397 cal/mole. The quantity El i s found by requiring the two expressions for P equation ( 16),
k' to be equal at For aluminum, it was found that ti = 1.0265. Finally, the requirement that both expressions for Ek,
5 = E l is used to obtain E
IC m
E = E l .
equation ( I S ) , agree at
= 2654 cal/mole m
The Fusion Curve and Equation of State Surfaces
Having specified the various constants for aluminum, computations were carried out for both the solid and liquid phase for various values of 5 and T. Isotherms of a Gibbs energy versus pressure plot are shown in Figure 1. Since the phase that produces the lowest Gibbs energy at a given temper- ature and pressure is the stable phase, the inter- sections of the solid-liquid isotherms represent points on the fusion curve (Fig. 5 ) . curve, isotherms are constructed on a P-V surface (Fig. 6 ) , an E-V surface (Fig. 7) , and an S-V surface (Fig. 8) . Isoenergy lines on a P-V surface a r e shown in Figure 9.
Using the fusion
Comparison with Experimental Resul ts
To compare the equation of state developed in this paper with data obtained from shock com- pression experiments, the Hugoniot requirement,
(33) 1 E - E = - P ( V - V ) ,
0 2 00
is solved simultaneously with the equation of state. In experiments with porous samples, the volume
PRESSURE (mrgnbnrs)
Figure 4. Gibbs energy isotherms. ( Circles represent the intersection of the liquid and solid
isotherms and determine the melting pressure for that particular temperature. )
MELTING CURVE
I ''--'--I
TEMPERATURE ( iOf.K)
Figure 5. Melting curve deduced from Gibbs energy plot.
Voo represents the actual specific volume of the
sample, whjch may be several times the volume of a
9
I I I I I 111111111llIIIl I1 I llllllllIlI
. . .~ m1+, . , I I I I I I I I 1 1 I I
ISOTtlERMS(oIO
lklb
W a
3 W a a
50,ooo
- 30,000
20,000
4000 I 2 i20
l m K b 1 I
. I .-__I-- 10 Kb :- 1 .46 .Q .50 f i .a -76
I 1 --Li 1. ,x1 & A 8 .94 1.0 1.06 1.12 1.18 1 2 4
v/v,
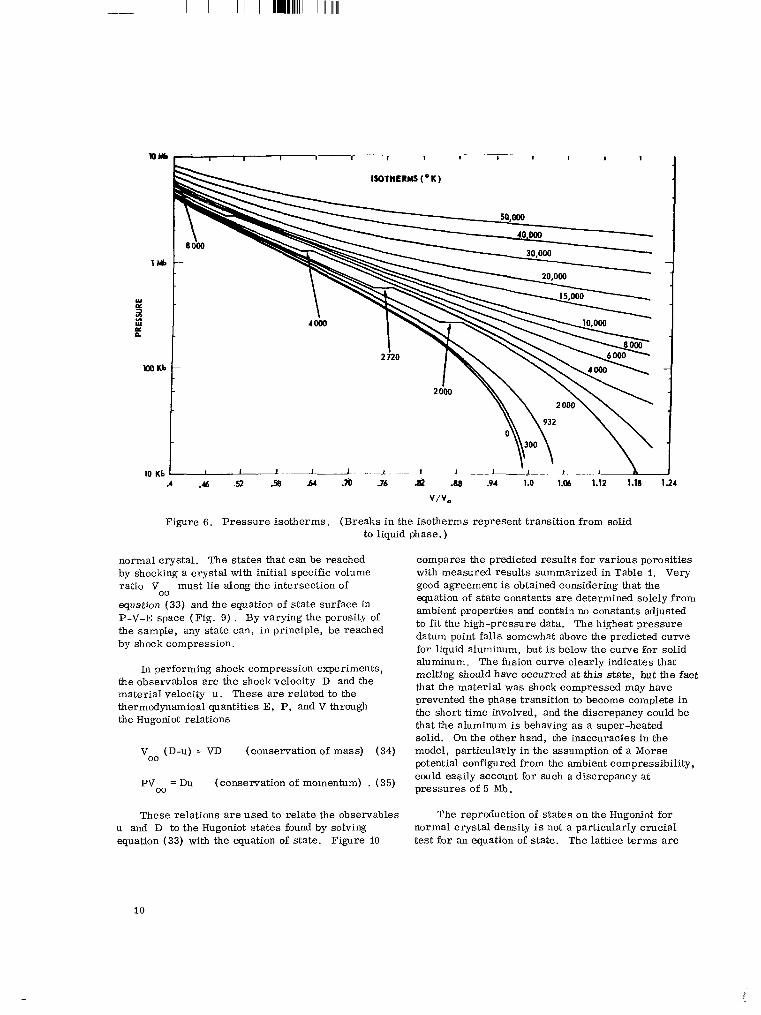
Figure 6 . Pressure isotherms. (Breaks in the isotherms represent transition from solid to liquid phase.)
normal crystal. The states that can be reached by shocking a crystal with initial specific volume ratio V must lie along the intersection of
equation ( 3 3 ) and the equation of s ta te surface in P-V-E space (Fig. 9) . By varying the porosity of the sample, any state can, in principle, be reached by shock compression.
00
In performing shock compression experiments, the observables are the shock velocity D and the material velocity u. These a r e related to the thermodynamical quantities E, P , and V through the Hugoniot relations
Voo (D-u) = VD (conservation of mass) (34)
PVoo = Du (conservation of momentum) . (35)
These relations a r e used to relate the observables u and D to the Hugoniot states found by solving equation (33) with the equation of state. Figure 10
compares the predicted results for various porosities with measured results summarized in Table i. Very good agreement is obtained considering that the equation of state constants are determined solely from ambient properties and contain no constants adjusted to fit the high-pressure data. The highest pressure datum point falls somewhat above the predicted curve for liquid aluminum, but is below the curve for solid aluminum. The fusion curve clearly indicates that melting should have occurred at this state, but the fact that the material was shock compressed may have prevented the phase transition to become complete in the short time involved, and the discrepancy could be that the aluminum is behaving a s a super-heated solid. On the other hand, the inaccuracies in the model, particularly in the assumption of a Morse potential configured from the anibient compressibility, could easily account for such a discrepancy a t pressures of 5 Mb.
The reproduction of states on the Hugoniot for normal crystal density is not a particularly crucial test for an equation of state. The lattice terms a r e
10

I
WERGY ISOTHERMS
' I
0 3 I 03 1 I I 1 ~ 1 1 I I 3 W I 01 OS 01 0.7 01 0.9 1.0 1.1 1.2
v n .
Figure 7. Energy isotherms. (Breaks in the isotherms represent transitions from solid to
liquid phase. )
I I
I L 0 .2 0.3
Figure 8. Isotherms on S-V plot. (Breaks in the isotherms represent transitions from solid to
liquid phase. )
'I 0. K ISOTHERM- I -\ \ \
Figure 9. Isoenergy lines. (When lines of constant internal energy a r e plotted rather than lines of constant temperature, the phase transitions are not apparent. )
I I I l111l11ll11111111lllIl I
2 3 , , , , , _ _ . , , ___?-I--,
22 . 21 .
M -
19 . 10 . 17 . 16 -
I5 . 14 -
- 5 12
0 "
. 2 -
10 -
9 -
8 -
7 -
6 -
5 -
4 -
I 2 3 4 5 6 7 I 9 10 1 1 12 13 14 IS 16 17 11 r ( h / . . r I
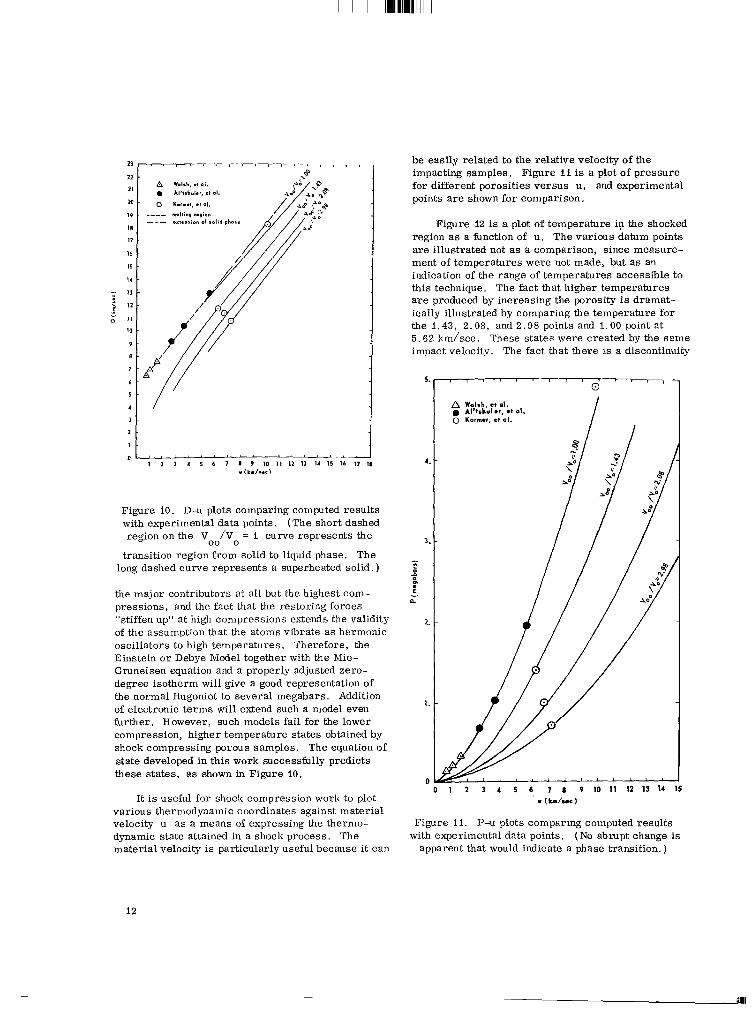
Figure 10. D-u plots comparing computed results with experimental data points. (The short dashed region on the v /v0 = I curve represents the
transition region from solid to liquid phase. The long dashed curve represents a superheated solid. )
the major contributors at all but the highest com- pressions, and the fact that the restoring forces "stiffen up" at high compressions extends the validity of the assumption that the atoms vibrate as harmonic oscillators to high temperatures. Therefore, the Einstein o r Debye Model together with the Mie- Gruneisen equation and a properly adjusted zero- degree isotherm will give a good representation of the normal Hugoniot to several megabars. Addition of electronic terms will extend such a model even further. However, such models fail for the lower compression, higher temperature states obtained by shock compressing porous samples. The equation of state developed in this work successfully predicts these states, as shown in Figure 10.
00
It i s useful for shock compression work to plot various thermodynamic coordinates against material velocity u as a means of expressing the thernio- dynamic state attained in a shock process. The material velocity i s particularly useful because it can
be easily related to the relative velocity of the impacting samples. for different porosities versus u, and experimental points a r e shown for comparison.
Figure I1 is a plot of pressure
Figure 12 is a plot of temperature in the shocked region a s a function of u. The various datum points a re illustrated not as a comparison, since measure- ment of temperatures were not made, but as an indication of the range of temperatures accessible to this technique. The fact that higher temperatures a r e produced by increasing the porosity is dramat- ically illustrated by comparing the temperature for the 1.43, 2.08, and 2 .98 points and 1.00 point at 5.62 km/sec. These states were created by the same impact velocity. The fact that there i s a discontinuity
5.
4
3
I
4
c- E
n. -
2.
1.
0 1 2 3 4 5 6, 7 I 9 10 11 12 13 14 15
Y (lu/uc)
Figure 11. P-u plots comparing computed results with experimental data points. (No abrupt change i s
apparent that would indicate a phase transition. )
12

TABLE I. SUMMARY O F HUGONIOT DATA FOR ALUMINUM
2.319
I. 700
D (km/sec)
7.531
6.927
6.500
D (km/sec)
9. 13
10.39
12.94
222.7
153.5
v00/v300
1. 00
1.43
2.08
2.98
693
1042
1971
GROUP Ia
1.442
I. 553
1.767
uf (km/sec)
3.230
2. 185
I. 498
1. 176
1.015
335.8
9. 93
6.25
6.74
7.18
u ( k d s e c )
2.80
3.70
5.62
D ( k i d s e c )
18.31 -t . 16
11.74 -I- . 10
11.42 -t .09
10.75 t .08
v/vo
0.7874
0.8333
0.8696
P(kb) I Vo/V
GROUP 111'
P(Mb)
4.93
1 .391
I. 003
0.702 ~
aThese a r e reprcsentative points of those listed by J. M. Walsh, M . H . Rice, R. G. McQueen, and F. L . Parger, Phys. Rev.; 108, 196 ( 1957) The Material velocity u i s taken to be 1/2 the measured free surface velocity, u
f '
bL. V. Al'tshuler, S. B . Kormer, A . A. Bakanova, and R. F. Trunin; Soviet Physics - JETP, fi, 573 (1962)
'S. B. Kormer, A. I. Funtikov, V. D. Urlin, and A. N. Kiksnikova, Soviet Physics - JETP, 5 477 ( 1962)
dThe quantity u was not stated in the paper. I t was recovered by the relation u = [ 1 - (V/Vo) ( V3oo/VoO) I D.
L
13

413
44
40
36
32
- 28
F.)
0 - 24 I-
20
16
12
8
4
I I I I
A Walsh, e t 01. 0 Al'tshuler, et al.
0 Kormer, et al.
0 2 4 6 I 10. 12 14 u ( km/s*c )
Figure 12. T-u plots. (The data points a re shown only to indicate range of temperatures reached by
present experimental techniques. The break in the curves indicates that temperature measurement
could serve as a method of detecting phase transitions. )
in the temperature curve at the melting region gives a possibility of experimentally detecting the melting point at very high pressures, although such temper- ature measurement would be extremely difficult to make in solids.
Figure 13 is a plot of entropy as a function of u . , A s before, the indicated data points a re intended only to indicate range of experimental states, not measure- ments. For comparison, the temperature and phase of aluminum at ambient pressure for various values of entropy i s indicated. Assuming the release is adiabatic and isentropic, an estimate of the release temperature can be made. Attempts have been made to measure the release temperature of shock compressed solids. Taylor [ 131 reports a favorable
48
44
40
36
32 - u -
28 L
Z 24 0 2
20
16
12
8
4 1
A Walsh, e t 01. 0 Al'tshuler, et al.
o Kormer, e t 01.
_ _ - - _ _ _ Complete Melting
- -
0 1 2 3 4 5 6 7 8 9 1 0 1 1 1 2 1 3 u(km/sec)
Figure 13. S-u plots. (The data points indicate measurement range rather than actual
measurements. The dashed lines indicate entropy values corresponding to the stated temperatures at ambient pressure. If the release i s assumed to be isentropic, these can be used to indicate release
temperature.
comparison between calculated and measured release temperatures for Cu up to the melting point.
CONCLUSIONS
A complete equation of state for metals that describes both the solid and liquid-dense vapor phase has been developed. All empirical constants required can be obtained from elementary thermodynamic data at ambient conditions. Since all thermodynamic functions a r e derived from the partition function, thermodynamic consistency is guaranteed. Phase transitions between the solid and liquid come about
14

naturally by using the Gibbs energy to determine the stable phase for a given state. Detailed computations were carried out fo r aluminum and the ability for the model to predict the behavior of aluminum for pressures of 5 Mb and temperatures of 20 000°K was demonstrated. Since only elementary thermodynamic data at ambient conditions a r e required to configure the model, extension to other metals is straight- forward by insertion of their appropriate constants.
The model can be extended to higher temperatures with some additional computational effort to obtain the electron contributions for temperatures com- parable to the Fermi temperature. The model can also be extended to lower densities, provided the temperatures a r e low enough to completely neglect electronic contributions.
REFERENCES
I.
2.
3.
4 .
5.
6.
7 .
8.
9.
I O .
11.
12.
13.
Al'tshuler, L. V.; Bakanova, A. A.; and Trunin, R. F.: JETP, vol. 15, no. 477, 1962.
Pastine, D. J.: J. Appl. Phys., vol. 35, no. 3407, 1964.
Slater, J. C.: Introduction to Chemical Physics. Chapter XlyII, McGraw Hill, New York, 1939.
Lennard-Jones, J , E.; and Devonshire, A. F.: Proc. Roy. SOC., London, vol. Ai63, no. 53, 1937
Pastine, D. J . : Phys. Rev., vol. 166, no. 703, 1968.
Liebfried, G. ; and Ludwig, W.: Solid State Physics. Vol. 12, Academic Press , New York, 1961.
Kormer, S. B.; Urlin, V . D.; and Popova, L. T . : Soviet Physics - Solid State, vol. 3, no. 1547, 1962.
Urlin, V. D.: Soviet Physics - JETP, vol. 22, no. 341, 1966.
Huang, K.: Statistical Mechanics. Chapter 9, Wiley and Sons, New York, 1963.
Stull, D. R.; and Sinke, G. C.: Thermodynamic Properties of the Elements. American Chemical Society, Washington, D. C . , 1956.
Slater, J. C.: Introduction to Chemical Physics. Chapter XIV, McGraw Hill, New York, 1939.
Kittel, C.: Solid State Physics. Chapter il, Wiley and Sons, New York, 1956.
Taylor, J . W.: J . Appl. Phys., vol. 34, no. 2727, 1963.
George C. Marshall Space Flight Center National Aeronautics and Space Administration
Marshall Space Flight Center, Alabama 35812 124-09-02-00
.. .
15

NATIONAL AERONAUTICS AND SPACE ADMINISTRATION WASHINGTON, D. C. 20546
OFFICIAL BUSINESS FIRST CLASS MAIL
POSTAGE AND FEES PAID NATIONAL AERONAUTICS AND
SPACE ADMINISTRATION
01U 001 42 5 1 305 70195 00903 A I R FORCE WEAPONS L A B O R A T O R Y / W L O L / K E R T L A N D A F B I NEW M E X I C O 87117
A T T E. LOU BOWMAN* C H I E F , T E C H - L I B R A R Y POSTMASTER: If Undeliverable (Section 158
Postal Manual) Do Nor Return
"The aeroiinittical and spnce activities of ihe United States shall be c o ~ x h c t e d so as t o contribnte . . . t o the expaizsioTz of hzmaia knotol- edge of pheiiomena ia the atmosphere diad space. T h e Administration shnll provide fo r the widest practicable arid appropriate dissenzimtion of infornintion coiiceriaing i ts nctitjities and the resd t s thereof."
-NATIONAL AERONAUTICS AND SPACE ACT OF 1958
NASA SCIENTIFIC AND TECHNICAL PUBLICATIONS
TECHNICAL REPORTS: Scientific and technical information considered important, complete, and a lasting contribution to existing knowledge.
TECHNICAL NOTES: Information less broad in scope but nevertheless of importance as a contribution to existing knowledge.
TECHNICAL MEMORANDUMS: Information receiving limited distribution because of preliminary data, seciir i ty classi fica - tion, or other reasons.
CONTRACTOR REPORTS: Scientific and technical information generated under a NASA contract or grant and considered an important contribution to existing knowledge.
TECHNICAL TRANSLATIONS: Information published in a foreign language considered to merit NASA distribution in English.
SPECIAL PUBLICATIONS: Information derived from or of value to NASA activities. Publications include conference proceedings, monographs, data compilations, handbooks, sourcebooks, and special bibliographies.
TECHNOLOGY UTILIZATION PUBLICATIONS: Information on technology used by NASA that may be of particular interest i n commercial and other non-aerospace npplicatioiu. Publications include Tech Briefs, Technology Utilization Reports and Notes, and Technology Surveys.
/
Details on the availability of these publications may be obtained from:
SCIENTIFIC AND TECHNICAL INFORMATION DIVISION
NATI 0 NA L AERO N AUTlCS AND SPACE ADMINISTRATION Washington, D.C. 20546