High Surface Area Mesoporous Activated Carbon from Hemp ...
22
1 High Surface Area Mesoporous Activated Carbon from Hemp Bast Fibre Using Hydrothermal Processing Md Zakir Hossain, Wei Wu, William Z. Xu, Muhammad B.I. Chowdhury, Anil Kumar Jhawar, Devin Machin, Paul A Charpentier * Department of Chemical and Biochemical Engineering, The University of Western Ontario, London, Ontario, Canada N6A 5B9 * Corresponding author E-mail: [email protected] Western University London, Ontario, Canada N6A 5B9 Phone: 1 (519) 661-3466 Fax: 1 (519) 661-3498 Preprints (www.preprints.org) | NOT PEER-REVIEWED | Posted: 28 April 2018 doi:10.20944/preprints201804.0372.v1 © 2018 by the author(s). Distributed under a Creative Commons CC BY license. Peer-reviewed version available at C 2018, 4, 38; doi:10.3390/c4030038
Transcript of High Surface Area Mesoporous Activated Carbon from Hemp ...
1
High Surface Area Mesoporous Activated Carbon from Hemp
Bast Fibre Using Hydrothermal Processing
Md Zakir Hossain, Wei Wu, William Z. Xu, Muhammad B.I. Chowdhury, Anil Kumar
Jhawar, Devin Machin, Paul A Charpentier*
Department of Chemical and Biochemical Engineering, The University of Western Ontario, London,
Ontario, Canada N6A 5B9
* Corresponding author
E-mail: [email protected]
Western University
London, Ontario, Canada
N6A 5B9
Phone: 1 (519) 661-3466
Fax: 1 (519) 661-3498
Preprints (www.preprints.org) | NOT PEER-REVIEWED | Posted: 28 April 2018 doi:10.20944/preprints201804.0372.v1
© 2018 by the author(s). Distributed under a Creative Commons CC BY license.
Peer-reviewed version available at C 2018, 4, 38; doi:10.3390/c4030038

2
Abstract
Synthesis of activated carbon from waste biomass is of current interest towards sustainability.
The properties of biomass derived activated carbon largely depends on the carbonization
process. This study reports preparing extremel high surface area mesoporous activated carbon
from hemp bast fibre using hydrothermal processing. Processing in hot water (390-500oC),
then activation using KOH and NaOH was investigated at different loading ratios. The
described approach was found to enhance the mesoporosity (centered at 3.0 to 4.5 nm) of the
hemp derived activated carbon (HAC) from activation (confirmed by BJH pore size
distribution and TEM imaging). BET results showed that the product has an extremely high
surface area (2425 m2/g) while the surface functional groups (-OH, COOH, C=C/C-C) were
confirmed and quantified by XPS and FTIR results. Increasing KOH concentration was found
to enhance the surface area with an optimum biochar to KOH ratio of 1:3. The crystallite
domain size of HAC was determined using Raman spectroscopy of different wavelengths. The
procedure described in this study is an environmentally friendly scalable route for the mass
production of activated carbon using hemp fiber.
Keywords
Hemp bast fibre, hydrothermal processing, KOH activation, activated carbon.
Preprints (www.preprints.org) | NOT PEER-REVIEWED | Posted: 28 April 2018 doi:10.20944/preprints201804.0372.v1
Peer-reviewed version available at C 2018, 4, 38; doi:10.3390/c4030038
3
1. Introduction
Activated carbon is a wll-known porous material with large surface area and pore volume,
being extensively used for gas separation, solvent recovery, contaminant removal from water,
wastewater treatment and as a catalyst/catalyst support for different energy storage and
conversion processes [1]. Recently, activated carbon is being extensively investigated for
making carbon foams [2] and ultracapacitors/supercapacitors [3, 4], due to its porous structure.
As the pore properties of activated carbon largely depend on the precursor materials and the
synthesis method, different types of materials (natural and synthetic) have been examined as
precursors. The most commonly used precursors for activated carbon production are coal,
coconut shell, wood, agricultural wastes or industrial wastes [1]. Among them, biomass as a
precursor is attracting significant attention as it is renewable, abundant, low cost, and eco-
friendly.
Two basic activation processes, i.e., physical and chemical, are used to prepare activated
carbonaceous materials from biomass [5]. Prior to either the physical or chemical activation
process, the carbon precursor needs to be carbonized to produce char. If the formed char is
activated using carbon dioxide or steam as the activating agent, the process is called physical
activation [6]. If the char is activated in the presence of chemical agents, the process is termed
chemical activation [7]. The step for char production can occasionally be skipped if chemical
activation is employed. To obtain a well-developed pore structure in the final carbon product
using physical activation, a significant amount of internal carbon mass removal is necessary.
Activating agents used for chemical activation are dehydrating agents that enhance pyrolytic
decomposition and prevent tar formation, thus enhancing the yield of carbon [5]. The most
commonly used agents for chemical activation are acidic reagents such as ZnCl2, H3PO4, HCl
and H2SO4 or the basic reagents KOH, K2CO3, NaOH and Na2CO3. There is a growing interest
in using alkali hydroxides as the activation agent, with KOH being one of the most promising
Preprints (www.preprints.org) | NOT PEER-REVIEWED | Posted: 28 April 2018 doi:10.20944/preprints201804.0372.v1
Peer-reviewed version available at C 2018, 4, 38; doi:10.3390/c4030038

4
activating agents [8, 9]. In this work, KOH and NaOH are compared as activating agents while
hemp bast fibre was chosen as the carbon precursor because of its unique fibrous structure to
make carbonaceous materials [10]. Detailed structural and surface properties are very
important for the application of the resultant product which was characterized in this work by
various physio-chemical techniques including BET surface area and BJH pore size distribution,
XRD, SEM, TEM, Raman, TGA, FTIR and XPS analysis.
2. Experimental
2.1 Materials
Hemp bast fibre was purchased from American Hemp, Winston Salem, NC, USA. KOH,
NaOH and 36 to 40% HCl was obtained from Caledon Laboratories Ltd., Canada. Silica-
alumina pellet was obtained from Micromeritics Instrument Corporation, Norcross, GA, USA.
Powdered activated carbon (DARCO G-60, 100−325 mesh particle size) and Basolite® C300
were obtained from Sigma Aldrich Canada Co., Oakville, ON, Canada. Activated carbon, Norit
Row 0.8mm pellets, steam activated were obtained from Alfa Aesar, Tewksbury, MA, USA.
De-ionized (DI) water (18.2 MΩ) was taken from a compact ultrapure water system (EASY
pure LF, Mandel Scientific Co., model BDI-D7381).
2.2 Preparation of HAC
Two hundred ml of DI water along with 12.0 g of pre-cut hemp bast fibre were sealed in a 600
ml Hastelloy C-276 reactor (Autoclave Engineers, Erie, Penn, U.S.A), and heated to the desired
temperature (390, 450 or 500 oC, respectively) and kept for 2 h. The resultant biochar was
recovered by vacuum filtration and washed with DI water multiple times, then dried overnight
at 120oC in a vacuum oven. The dried biochar was thoroughly mixed with a desired amount of
Preprints (www.preprints.org) | NOT PEER-REVIEWED | Posted: 28 April 2018 doi:10.20944/preprints201804.0372.v1
Peer-reviewed version available at C 2018, 4, 38; doi:10.3390/c4030038

5
KOH or NaOH using a mortar and pestle, then heated to 750 oC (0.5oC/min) and kept at 750°C
for 1 h under Argon flow in a tubular furnace. The resulting product was thoroughly washed
with dilute HCl followed by DI water until pH 7.0 was reached. Finally the products were dried
overnight at 120 oC in a vacuum oven. Activation of biochar using KOH to produce the final
product was repeated at least three times.
2.3 Instrumentation
The Brunauer-Emmett-Teller (BET) surface area, pore diameter and pore volume of hemp
derived activated carbon (HAC) and biochar were determined from nitrogen adsorption and
desorption isotherm data obtained at −193 °C in a constant-volume adsorption apparatus
(Tristar II 3020, Micromeritics Instrument Corporation) using 99.995% pure N2 gas obtained
from Praxair (Oakville, Canada). The prepared samples were degassed at 130 °C for 12 h to
remove any moisture and other adsorbed gases from the surface. The pore size distributions
were calculated using the BJH method from the desorption branch of the isotherms. The
instrument calibration was examined by using the standard (silica-alumina pellets) obtained
from the supplier (Micromeritics Instrument Corporation, Norcross, GA, USA). Calibration
was also checked by using commercial activated carbons and Basolite where their specific
surface areas are known. Details about the calibration results are provided in the supporting
information.
X-ray diffraction (XRD) measurements were performed using a Bruker D2 PHASER desktop
diffractometer using Cu Kα radiation (1.54 Å). The instrument was operated at 30 kV and 10
mA, using scan rate of 0.1 per second in the 2θ range from 10 to 70. The morphology of the
HAC was obtained using Scanning Electron Microscopy (Hitachi FlexSEM) (model SU 1000)
with secondary electron detector and Transmission Electron Microscopy (TEM) (model JEOL
2010F). The X-ray photoelectron spectroscopy (XPS) analysis was carried out with a Kratos
Preprints (www.preprints.org) | NOT PEER-REVIEWED | Posted: 28 April 2018 doi:10.20944/preprints201804.0372.v1
Peer-reviewed version available at C 2018, 4, 38; doi:10.3390/c4030038
6
Axis Ultra spectrometer using a monochromatic AlK (alpha) source (15 mA, 14 kV). FTIR
analysis of the hemp derived samples were examined using an ATR-FTIR spectroscope
(Nicolet 6700 FTIR). Raman spectroscopy measurements were performed using a Kaiser
Optical Systems RXNI-785 with an excitation wavelength of 785 nm. Crystallite domain size
of the AC catalysts were measured using a Renishaw InVia Reflex Raman spectrometer with
two additional wavelength lasers (633 nm and 514 nm). Thermogravimetric analysis (TGA)
was conducted on a TA Q600 system with a heating rate of 10 oC/min from ambient
temperature to 900 oC, in N2 with a flow rate of 50 ml/min.
3. Results and discussion
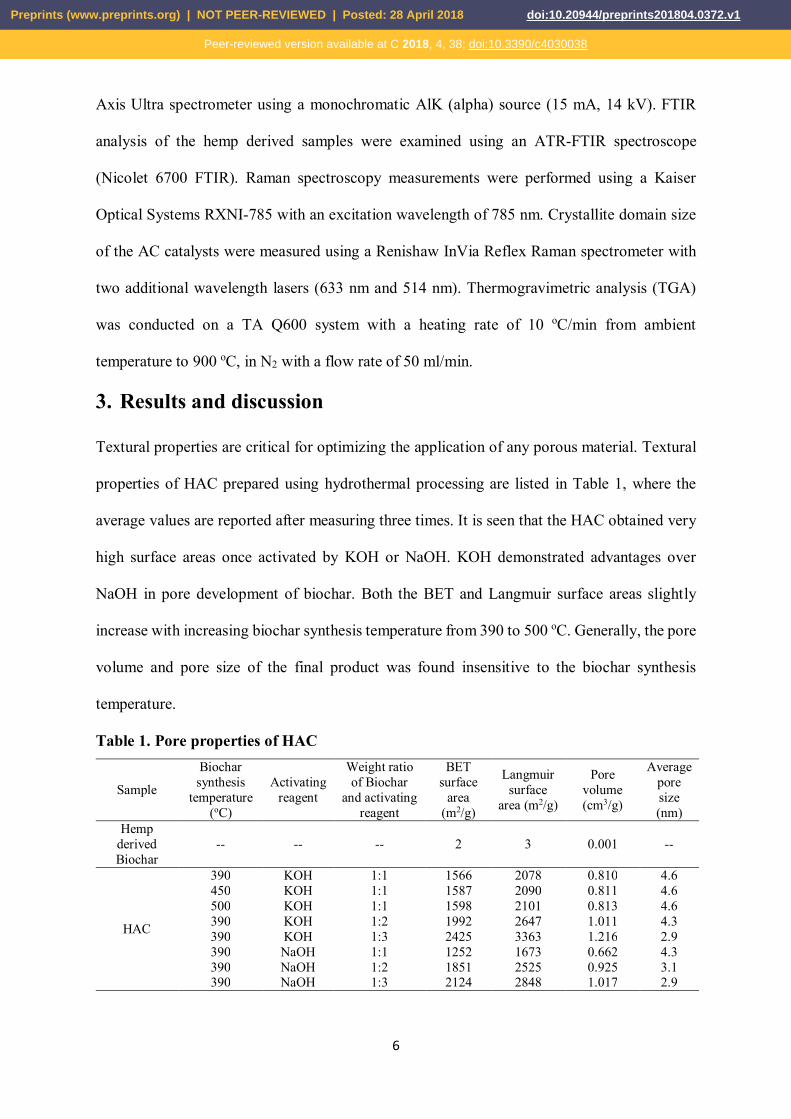
Textural properties are critical for optimizing the application of any porous material. Textural
properties of HAC prepared using hydrothermal processing are listed in Table 1, where the
average values are reported after measuring three times. It is seen that the HAC obtained very
high surface areas once activated by KOH or NaOH. KOH demonstrated advantages over
NaOH in pore development of biochar. Both the BET and Langmuir surface areas slightly
increase with increasing biochar synthesis temperature from 390 to 500 oC. Generally, the pore
volume and pore size of the final product was found insensitive to the biochar synthesis
temperature.
Table 1. Pore properties of HAC
Sample
Biochar synthesis
temperature (oC)
Activating reagent
Weight ratio of Biochar
and activating reagent
BET surface
area (m2/g)
Langmuir surface
area (m2/g)
Pore volume (cm3/g)
Average pore size (nm)
Hemp derived Biochar
-- -- -- 2 3 0.001 --
HAC
390 KOH 1:1 1566 2078 0.810 4.6 450 KOH 1:1 1587 2090 0.811 4.6 500 KOH 1:1 1598 2101 0.813 4.6 390 KOH 1:2 1992 2647 1.011 4.3 390 KOH 1:3 2425 3363 1.216 2.9 390 NaOH 1:1 1252 1673 0.662 4.3 390 NaOH 1:2 1851 2525 0.925 3.1 390 NaOH 1:3 2124 2848 1.017 2.9
Preprints (www.preprints.org) | NOT PEER-REVIEWED | Posted: 28 April 2018 doi:10.20944/preprints201804.0372.v1
Peer-reviewed version available at C 2018, 4, 38; doi:10.3390/c4030038
7
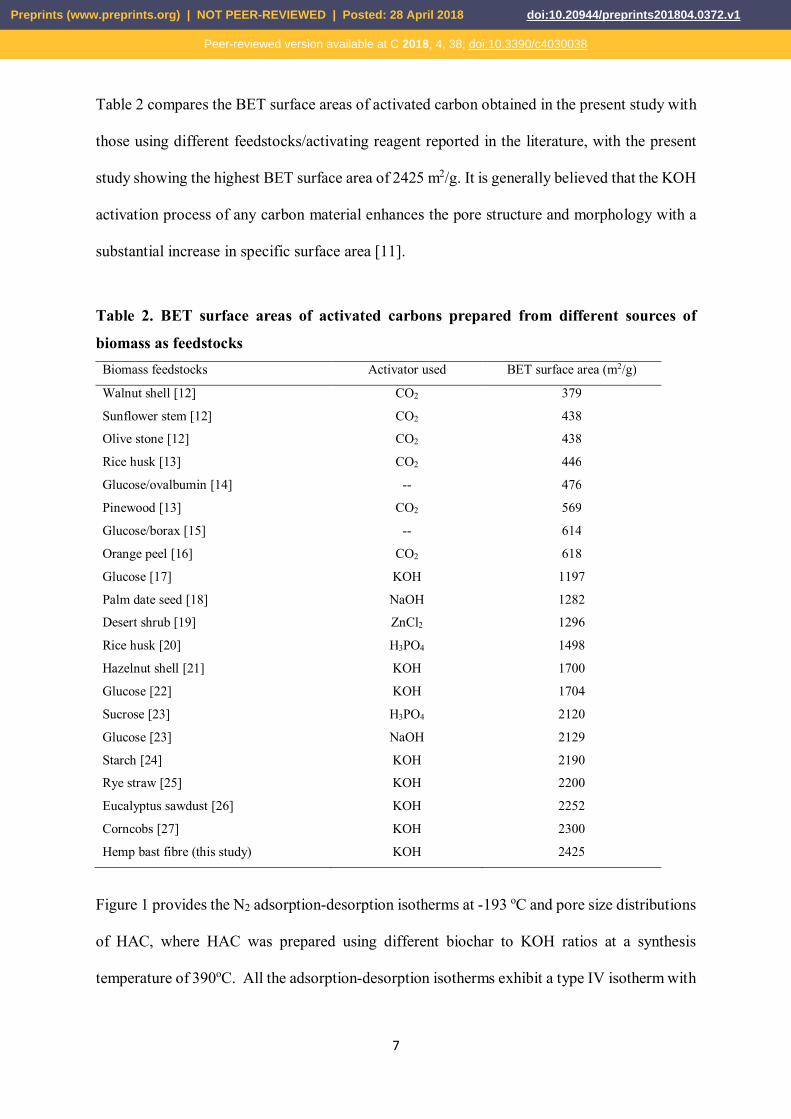
Table 2 compares the BET surface areas of activated carbon obtained in the present study with
those using different feedstocks/activating reagent reported in the literature, with the present
study showing the highest BET surface area of 2425 m2/g. It is generally believed that the KOH
activation process of any carbon material enhances the pore structure and morphology with a
substantial increase in specific surface area [11].
Table 2. BET surface areas of activated carbons prepared from different sources of
biomass as feedstocks Biomass feedstocks Activator used BET surface area (m2/g)
Walnut shell [12] CO2 379
Sunflower stem [12] CO2 438
Olive stone [12] CO2 438
Rice husk [13] CO2 446
Glucose/ovalbumin [14] -- 476
Pinewood [13] CO2 569
Glucose/borax [15] -- 614
Orange peel [16] CO2 618
Glucose [17] KOH 1197
Palm date seed [18] NaOH 1282
Desert shrub [19] ZnCl2 1296
Rice husk [20] H3PO4 1498
Hazelnut shell [21] KOH 1700
Glucose [22] KOH 1704
Sucrose [23] H3PO4 2120
Glucose [23] NaOH 2129
Starch [24] KOH 2190
Rye straw [25] KOH 2200
Eucalyptus sawdust [26] KOH 2252
Corncobs [27] KOH 2300
Hemp bast fibre (this study) KOH 2425
Figure 1 provides the N2 adsorption-desorption isotherms at -193 oC and pore size distributions
of HAC, where HAC was prepared using different biochar to KOH ratios at a synthesis
temperature of 390oC. All the adsorption-desorption isotherms exhibit a type IV isotherm with
Preprints (www.preprints.org) | NOT PEER-REVIEWED | Posted: 28 April 2018 doi:10.20944/preprints201804.0372.v1
Peer-reviewed version available at C 2018, 4, 38; doi:10.3390/c4030038
8
a type IV hysteresis loop (according to IUPAC classification) in the relative pressure range
from 0.4 to 1.0. Type IV isotherms are an indication for the existence of well-developed
mesopores in the structure, whereas a type IV hysteresis loop indicates the formation of
asymmetric, slit shaped mesopores, attributable to rapid gas evolution and open channels [28].
It has been observed that increasing the ratio of activating agent to biochar increases the textural
properties (surface area and pore volume) significantly, attributed to increasing the etching
effect of the activating reagent on the biochar surface, thus creating mesopores from
micropores [29]. The unique mesoporous structure of hemp based HAC contributes to the high
specific surface area and uniform pore size distribution. The activation temperature also plays
an important factor for improving the specific surface area and pore volume. High temperature
activation was previously shown to enhance porosity as previously confirmed by Wang et al.
[30], while low temperatures were not favourable to increase porosity due to the low reaction
rate between the activator and carbonaceous material. Wang et al. [30] obtained the highest
BET surface area (2287 m2/g) for making interconnected carbon nanosheets at 750 oC during
the activation of biochar with KOH.
Preprints (www.preprints.org) | NOT PEER-REVIEWED | Posted: 28 April 2018 doi:10.20944/preprints201804.0372.v1
Peer-reviewed version available at C 2018, 4, 38; doi:10.3390/c4030038

9
Figure 1. Nitrogen adsorption-desorption isotherms and BJH pore size distributions of HAC (inset).
Pore size distributions (PSD) of HAC prepared using different biochar to KOH ratios show that
all the samples have a very narrow pore size distribution, mainly centred at 3.0 to 4.5 nm. This
result is intriguing and indicates highly mesoporous carbon formation. Foo and Hameed [31]
reported the average pore size of 21.44 nm of activated carbon produced from pistachio nut
shells via microwave-induced chemical (KOH) activation. The same authors [32] also reported
an average pore size of 34.14 and 26.89 nm for activated carbon from rice husk as a feedstock
using KOH and K2CO3 activation. Tay et al. [7] synthesized different types of activated carbon
from soybean oil cake and reported the average pore diameter of 5.23 nm of one of the product.
Morphology of a material is a crucial factor for its application. The morphology of HAC was
investigated and is presented in Figure 2 and Figure 3. Figure 2 shows the SEM images of the
obtained hemp biochar (a) and HAC using different ratios of biochar to KOH at 1:1 (b), 1:2 (c)
Preprints (www.preprints.org) | NOT PEER-REVIEWED | Posted: 28 April 2018 doi:10.20944/preprints201804.0372.v1
Peer-reviewed version available at C 2018, 4, 38; doi:10.3390/c4030038

10
and 1:3 (d). The observed HAC surface morphologies are very different than those from
biochar. The biochar surface is rough with irregular sizes of particles and many large defect
holes whereas the HAC surface shows the amorphous nature of carbon with a large mesopore
content. The differences in morphologies among Figure 2(b), (c) and (d) suggest that KOH
plays an important role for pore development of the resultant samples during activation. Figure
3(a) shows the TEM image of biochar whereas Figure 3(b), (c) and (d) shows the resulting
HAC using different KOH ratios. Biochar does not have any pores whereas the activated carbon
obtained using different biochar : KOH has a regular porous structure. This porous structure is
advantageous for adsorption or catalysis, by providing more active sites. The TEM and SEM
images corroborate the BET results. Lu et al. [33] found a similar mesoporous structure
(adsorption average pore width = 3.23 nm) of activated carbon synthesized from corn straw.
Figure 2. SEM images of (a) obtained biochar and HAC obtained using different ratios of biochar to KOH (b) 1:1 (c) 1:2 (d) 1:3.
Preprints (www.preprints.org) | NOT PEER-REVIEWED | Posted: 28 April 2018 doi:10.20944/preprints201804.0372.v1
Peer-reviewed version available at C 2018, 4, 38; doi:10.3390/c4030038

11
Figure 3. TEM images of (a) biochar and HAC obtained using different ratios of biochar to KOH (b) 1:1 (c) 1:2 (d) 1:3.
X-ray diffraction (XRD) was used to determine the crystalline structure of HAC. Figure 4
shows the small and large angle XRD patterns for the HAC samples. The small angle XRD
pattern for all three samples indicates the formation of ordered hexagonal mesoporous structure
[34]. This type of small angle XRD peak, is completely absent in commercial activated carbon,
indicating the lack of long range porous structure [35]. The large peak at 23.4o 2θ [C(002) in
Figure 4 corresponds to the amorphous carbon structure. The weak and broad C(100) peak at
2θ = 40-50o is attributed to the a axis of the graphite structure [36]. No significant differences
were observed in the XRD patterns for all three investigated samples. This suggests that the
different ratios of activating agent and biochar do not have a noticeable effect on the structural
changes of HAC. Similar large angle XRD patterns were reported by Lu et al. [33] for the
synthesis of mesoporous activated carbon from waste biomass material such as corn straw.
Preprints (www.preprints.org) | NOT PEER-REVIEWED | Posted: 28 April 2018 doi:10.20944/preprints201804.0372.v1
Peer-reviewed version available at C 2018, 4, 38; doi:10.3390/c4030038

12
Figure 4. Large angle and small angle (inset) XRD patterns of the HAC.
The HAC samples were characterized by FTIR, with the spectra shown in Figure 5. The peak
at 3288 cm-1 is attributed to O-H stretching while the peaks at 2977, 2941, 2914, and 2830 cm-
1 are ascribed to asymmetric CH3, asymmetric CH2, symmetric CH3, symmetric CH2 stretching
modes. The peak at 1447 cm-1 is attributable to CH2 scissoring and CH3 asymmetric bending
modes. The peak at 1402 cm-1 can be assigned to O-H in-plane bending and CH3 umbrella
modes. The peak at 1109 cm-1 is attributable to CH3 rocking or CH2 wagging modes. The peak
at 1016 cm-1 is mainly attributed to alcoholic C-O stretching mode. No significant difference
is observed among the spectra of these samples, suggesting similar surface functional groups
regardless of the biochar to KOH ratio. The presence of such functional groups was also
reported by Barkauskas et al. [37] for commercial granulated activated carbon.
Preprints (www.preprints.org) | NOT PEER-REVIEWED | Posted: 28 April 2018 doi:10.20944/preprints201804.0372.v1
Peer-reviewed version available at C 2018, 4, 38; doi:10.3390/c4030038

13
Graphene 2014-09-18.esp
3600 3400 3200 3000 2800 2600 2400 2200 2000 1800 1600 1400 1200 1000 800
Abs
orba
nce
0
0.5
1.0
1.53288328832883288328832883288328832883288328832883288328832883288328832883288328832883288
297729772977297729772977297729772977297729772977297729772977297729772977297729772977297729412941294129412941294129412941294129412941294129412941294129412941294129412941294129412914291429142914291429142914291429142914291429142914291429142914291429142914291429142914
28302830283028302830283028302830283028302830283028302830283028302830283028302830283028301447144714471447144714471447144714471447144714471447144714471447144714471447144714471447 1402140214021402140214021402140214021402140214021402140214021402140214021402140214021402
1109110911091109110911091109110911091109110911091109110911091109110911091109110911091109
1016101610161016101610161016101610161016101610161016101610161016101610161016101610161016
a
b
c
Abso
rban
ce (a
.u.)
Wavenumber (cm-1)
Figure 5. ATR-FTIR spectra of hemp derived activated carbon at different biochar and KOH ratio (a) 1:1 (b) 1:2 and (c) 1:3.
Raman spectroscopy was used to examine the ordered and disordered crystal structures of the
hemp HAC. Figure 6 compares the Raman spectra of hemp derived activated carbon samples
collected using a 785 nm laser. In these spectra, the G band at 1588 cm-1 corresponds to the
first order scattering of E2g mode and is related to the vibration of sp2-bonded carbon atoms.
The D band at 1315 cm-1 arises from a breathing mode of ĸ-point phonons of A1g symmetry
[38]. The D band corresponds to the amount of disorder and its intensity shows a degree of
edge chirality [39]. By deconvoluting these peaks, the intensity ratios of D/G (ID/IG) were
calculated and are listed in Table 3. The samples from the ratios of biochar to KOH at 1:1 and
1:2 demonstrated the same intensity ratio (ID/IG) of 1.37, which is lower than that (1.44)
obtained from the ratio of biochar to KOH at 1:3. High ID/IG ratios suggest a high level of
Preprints (www.preprints.org) | NOT PEER-REVIEWED | Posted: 28 April 2018 doi:10.20944/preprints201804.0372.v1
Peer-reviewed version available at C 2018, 4, 38; doi:10.3390/c4030038

14
disorder such as defects, ripples and edges [40]. Besides, the full width at half maximum
(FWHM) of G band (ΓG) increased from 92.8 to 111.7 cm-1 when the ratio of biochar to KOH
decreased from 1:1 to 1:3. As reviewed by Maslova et al. [41], higher ΓG represents a larger
amount of defects for carbonaceous materials.
HAC_1to1R.esp
2000 1900 1800 1700 1600 1500 1400 1300 1200 1100 1000 900 800 700 600
Cou
nts
0
500
1000
1500
2000
2500
3000
35001588158815881588158815881588158815881588158815881588158815881588158815881588158815881588
1315131513151315131513151315131513151315131513151315131513151315131513151315131513151315
Wavenumber (cm-1)
Cou
nts
(a.u
.)
a
b
c
GD
Figure 6. Raman spectra of hemp derived activated carbon at different biochar and KOH ratios (a) 1:1 (b) 1:2 and (c) 1:3.
It has been reported that the crystallite domain size (La) of carbonaceous materials can be
calculated using the equation La=C(λL)/(ID/IG) where a linear relationship C(λL) ≈ C0 + λLC1 is
valid in the excitation wavelength range of 400 nm < λL < 700 nm where C0 = -12.6 nm and
C1=0.033 [42]. In order to study the domain size of the hemp HAC samples, the Raman spectra
of these samples were also collected using two other laser sources with wavelengths of 633 nm
and 514 nm, respectively. The ID/IG and La values were calculated and are listed in Table 3.
According to these results, the domain sizes of the samples obtained from biochar to KOH
Preprints (www.preprints.org) | NOT PEER-REVIEWED | Posted: 28 April 2018 doi:10.20944/preprints201804.0372.v1
Peer-reviewed version available at C 2018, 4, 38; doi:10.3390/c4030038

15
ratios of 1:1 and 1:2 are similar, but larger than those obtained using a biochar to KOH ratio of
1:3. These results are in good agreement with the Raman results measured using the 785 nm
laser, i.e., the crystallite domain size did not change much when the ratio of biochar to KOH
changed from 1:1 to 1:2, but decreased when the ratio of biochar to KOH changed to 1:3.
Table 3. Raman results of the HAC samples obtained from different biochar to KOH ratios.
Ratios λ=785 nm λ=633 nm λ=514 nm
ID/IG ΓG (cm-1) ID/IG La (nm) ID/IG La (nm) 1:1 1.37 92.8 1.112±0.007 7.46±0.05 1.008±0.043 4.33±0.18 1:2 1.37 102.2 1.105±0.035 7.50±0.24 1.028±0.017 4.24±0.07 1:3 1.44 111.7 1.191±0.016 6.96±0.09 1.071±0.020 4.07±0.08
The surface chemistry of HAC was characterized using X-ray photoelectron spectroscopy
(XPS). XPS survey spectra of HAC’s is summarized in Figure 7(a) and Table 4. Figure 7a and
Table 4 show that increasing the biochar to KOH ratio increases the atomic percentages of O
(from 16.6 to 24.2%) and decreases the atomic percentages of C (80 to 70.7%). Similar trends
were confirmed by Tai et al. [43] for synthesizing activated carbon from graphite using
different KOH ratios. The atomic percentage of Si also slightly increased (from 2.3 to 4.2%)
with increasing ratios. Si is the second most abundant element in soils which is found in
substantial amount in many plants [44]. Higher amounts of KOH helped to precipitate higher
Si on the surface of HAC.
Preprints (www.preprints.org) | NOT PEER-REVIEWED | Posted: 28 April 2018 doi:10.20944/preprints201804.0372.v1
Peer-reviewed version available at C 2018, 4, 38; doi:10.3390/c4030038

16
Figure 7. (a) XPS Survey spectra of HAC obtained using different ratios of biochar to KOH (i) 1:1 (ii) 1:2 (iii) 1:3; High resolution C(1s) XPS spectra of resultant HAC obtained using different ratios of biochar to KOH (a) 1:1 (b) 1:2 (c) 1:3. Table 4. Atomic percentages of the elements present in the surfaces of carbonaceous materials with different biochar to KOH ratios. Ratios Atomic percentages C O N Si 1:1 80.0 16.6 1.1 2.3 1:2 73.1 22.4 1.1 3.4 1:3 70.7 24.2 0.9 4.2
Table 5. Relative contents of carbon species present in the carbonaceous materials based on XPS survey spectra. Ratios Percentages of relative content C-C/C=C C-O C=O O-C=O 1:1 78.3 10.3 5.4 6.0 1:2 76.1 11.2 5.9 6.8 1:3 75.1 12.2 6.5 6.2
Preprints (www.preprints.org) | NOT PEER-REVIEWED | Posted: 28 April 2018 doi:10.20944/preprints201804.0372.v1
Peer-reviewed version available at C 2018, 4, 38; doi:10.3390/c4030038

17
The C(1s) XPS spectra of the resultant HAC is shown in Figure 7(b), (c) and (d) with the four
most prominent deconvoluted components of the C(1s) envelope shown in each panel. Relative
contents of carbon species present in HAC’s based on the XPS survey spectra are presented in
Table 5 The binding energy of 284.5 eV is attributed to the C–C, C=C and C–H bonds.
Moreover, the binding energies of 286.4, 287.8 and 289.1 eV are typically assigned to the C–
OH, C=O, and O=C–OH functional groups, respectively [45]. Deconvolution of all the C(1s)
spectra resulted in a main peak located at 284.4 eV, corresponding to the C–C, C=C and C–H
bonds. In Figure 7(b), (c) and (d), deconvolution of the C(1s) peak of the HAC resulted in
three peaks located at binding energies of 286.4, 287.8 and 289.1 eV, which are attributed to
the C–OH, C=O and O=C–OH functional groups, respectively. Usually, the C(1s) XPS
spectrum of commercial activated carbon shows four similar components that correspond to
carbon atoms in different functional groups: the non-oxygenated C at 284.5 eV for C=C/C-C
in aromatic rings, the C in C–O bonds at 286.4 eV for epoxy and alkoxy, the carbonyl C at
287.8 eV for C=O, and the carboxylate carbon at 289.1 eV for O–C=O [46]. Relative
percentages of oxygenated functional groups increase with increasing biochar to KOH ratios,
whereas the non-oxygenated functional group slightly decreases (Table 5).
TG-DTA of HAC under nitrogen atmosphere was investigated for thermal stability, which is
shown in Figure 8. No significant mass loss was detected when the material was heated up to
1000oC, except a slight mass loss below 100oC which was attributed to the loss of water.
Preprints (www.preprints.org) | NOT PEER-REVIEWED | Posted: 28 April 2018 doi:10.20944/preprints201804.0372.v1
Peer-reviewed version available at C 2018, 4, 38; doi:10.3390/c4030038

18
Figure 8. TG-DTA curves for hemp derived activated carbon obtained using different ratios of biochar to KOH (a) 1:1 (b) 1:2 and (c) 1:3.
As shown above, both KOH and NaOH provide high surface area activated carbon from hemp
fiber biochar. Either KOH or NaOH are believed to act as dehydrating agents which influence
the pyrolytic decomposition and inhibit the formation of tar, thus enhancing the yield of carbon.
Impregnation of KOH into the biochar first results in degradation of the cellulosic material and
then carbonization, leading to dehydration that results in charring and aromatization of the
carbon skeleton and creation of the porous structure [47]. Pore structure with resultant high
surface area is formed by rigorous evolution of gaseous by-products during KOH activation.
According to the chemical activation mechanism [48, 49], it is suggested that during activation,
the chemical reaction between KOH and carbon proceeds as 6KOH + 2C = 2K + 3H2 +
2K2CO3, followed by either decomposition of K2CO3 or reaction of K/K2CO3/CO2 with carbon,
the production of H2 will potentially open up the pores. More importantly, according to Viculis
Preprints (www.preprints.org) | NOT PEER-REVIEWED | Posted: 28 April 2018 doi:10.20944/preprints201804.0372.v1
Peer-reviewed version available at C 2018, 4, 38; doi:10.3390/c4030038

19
et al. [50], potassium might play an important role in greatly increasing the surface area. The
produced potassium atoms form an intercalation compound, KC8. Upon treatment with water
after activation, the reaction between potassium intercalated compounds and aqueous solvent
opens up the pores [50]. As shown in Table 1, it was found that with increased KOH loading
in the activation reaction, the surface area of the resulting product increased, being consistent
with this mechanism.
4. Conclusion
Hemp fiber derived highly mesoporous activated carbon (HAC) with large surface area and
pore volume was synthesized.
Synthesis temperature of intermediate product (biochar) was found insensitive to final
product.
Surface morphologies of HAC was confirmed using several physico-chemical techniques
such as BET, SEM, TEM, XRD, FTIR, Raman and XPS analysis.
Acknowledgements
This work is supported by Natural Sciences & Engineering Research Councils (NSERC) of
Canada & BioFuelNet Canada.
References
[1] A. Jain, R. Balasubramanian, M. Srinivasan, Hydrothermal conversion of biomass waste to activated carbon with high porosity: A review, Chemical Engineering Journal 283 (2016) 789-805. [2] X. Li, S. Liu, Y. Huang, Y. Zheng, D.P. Harper, Z. Zheng, Preparation and Foaming Mechanism of Pyrocarbon Foams Controlled by Activated Carbon as the Transplantation Core, ACS Sustainable Chemistry & Engineering (2018).
Preprints (www.preprints.org) | NOT PEER-REVIEWED | Posted: 28 April 2018 doi:10.20944/preprints201804.0372.v1
Peer-reviewed version available at C 2018, 4, 38; doi:10.3390/c4030038

20
[3] M.-H. Kim, K.-B. Kim, S.-M. Park, K.C. Roh, Hierarchically structured activated carbon for ultracapacitors, Scientific reports 6 (2016) 21182. [4] H. Ba, W. Wang, S. Pronkin, T. Romero, W. Baaziz, L. Nguyen‐Dinh, W. Chu, O. Ersen, C. Pham‐Huu, Biosourced Foam‐Like Activated Carbon Materials as High‐Performance Supercapacitors, Advanced Sustainable Systems (2018). [5] R. Bansal, J. Donnet, STOECKLI,“Active Carbon”, Marcell Dekker, New York and Bansel, 1988. [6] R. Bardestani, S. Kaliaguine, Steam activation and mild air oxidation of vacuum pyrolysis biochar, Biomass and Bioenergy 108 (2018) 101-112. [7] T. Tay, S. Ucar, S. Karagöz, Preparation and characterization of activated carbon from waste biomass, J. Hazard. Mater. 165(1-3) (2009) 481-485. [8] S. Li, K. Han, J. Li, M. Li, C. Lu, Preparation and characterization of super activated carbon produced from gulfweed by KOH activation, Microporous and Mesoporous Materials 243 (2017) 291-300. [9] M. Afdhol, R. Amiliana, A. Hanafi, Preparation of Activated Carbon from Palm Shells Using KOH and ZnCl2 as the Activating Agent, IOP Conference Series: Earth and Environmental Science, IOP Publishing, 2017, p. 012009. [10] R. Sui, A.S. Rizkalla, P.A. Charpentier, Synthesis and Formation of Silica Aerogel Particles By a Novel Sol- Gel Route in Supercritical Carbon Dioxide, J. Phys. Chem. B 108(32) (2004) 11886-11892. [11] V. Subramanian, C. Luo, A. Stephan, K. Nahm, S. Thomas, B. Wei, Supercapacitors from activated carbon derived from banana fibers, The Journal of Physical Chemistry C 111(20) (2007) 7527-7531. [12] S. Roman, J.V. Nabais, B. Ledesma, J. González, C. Laginhas, M. Titirici, Production of low-cost adsorbents with tunable surface chemistry by conjunction of hydrothermal carbonization and activation processes, Microporous and Mesoporous Materials 165 (2013) 127-133. [13] Z. Liu, F.-S. Zhang, Removal of copper (II) and phenol from aqueous solution using porous carbons derived from hydrothermal chars, Desalination 267(1) (2011) 101-106. [14] R.J. White, N. Yoshizawa, M. Antonietti, M.-M. Titirici, A sustainable synthesis of nitrogen-doped carbon aerogels, Green chemistry 13(9) (2011) 2428-2434. [15] T.P. Fellinger, R.J. White, M.M. Titirici, M. Antonietti, Borax‐Mediated Formation of Carbon Aerogels from Glucose, Advanced Functional Materials 22(15) (2012) 3254-3260. [16] M. Fernandez, B. Ledesma, S. Román, P. Bonelli, A. Cukierman, Development and characterization of activated hydrochars from orange peels as potential adsorbents for emerging organic contaminants, Bioresource technology 183 (2015) 221-228. [17] F. Gao, G. Shao, J. Qu, S. Lv, Y. Li, M. Wu, Tailoring of porous and nitrogen-rich carbons derived from hydrochar for high-performance supercapacitor electrodes, Electrochimica Acta 155 (2015) 201-208. [18] M.A. Islam, I. Tan, A. Benhouria, M. Asif, B. Hameed, Mesoporous and adsorptive properties of palm date seed activated carbon prepared via sequential hydrothermal carbonization and sodium hydroxide activation, Chemical Engineering Journal 270 (2015) 187-195. [19] X. Zhu, Y. Liu, F. Qian, C. Zhou, S. Zhang, J. Chen, Role of hydrochar properties on the porosity of hydrochar-based porous carbon for their sustainable application, ACS Sustainable Chemistry & Engineering 3(5) (2015) 833-840. [20] L. Ding, B. Zou, Y. Li, H. Liu, Z. Wang, C. Zhao, Y. Su, Y. Guo, The production of hydrochar-based hierarchical porous carbons for use as electrochemical supercapacitor electrode materials, Colloids and Surfaces A: Physicochemical and Engineering Aspects 423 (2013) 104-111.
Preprints (www.preprints.org) | NOT PEER-REVIEWED | Posted: 28 April 2018 doi:10.20944/preprints201804.0372.v1
Peer-reviewed version available at C 2018, 4, 38; doi:10.3390/c4030038

21
[21] E. Unur, S. Brutti, S. Panero, B. Scrosati, Nanoporous carbons from hydrothermally treated biomass as anode materials for lithium ion batteries, Microporous and Mesoporous Materials 174 (2013) 25-33. [22] Y. Gong, H. Wang, Z. Wei, L. Xie, Y. Wang, An efficient way to introduce hierarchical structure into biomass-based hydrothermal carbonaceous materials, ACS Sustainable Chemistry & Engineering 2(10) (2014) 2435-2441. [23] A.J. Romero-Anaya, M. Ouzzine, M. Lillo-Ródenas, A. Linares-Solano, Spherical carbons: synthesis, characterization and activation processes, Carbon 68 (2014) 296-307. [24] M. Sevilla, A.B. Fuertes, Sustainable porous carbons with a superior performance for CO 2 capture, Energy & Environmental Science 4(5) (2011) 1765-1771. [25] C. Falco, J.P. Marco-Lozar, D. Salinas-Torres, E. Morallon, D. Cazorla-Amorós, M.-M. Titirici, D. Lozano-Castelló, Tailoring the porosity of chemically activated hydrothermal carbons: influence of the precursor and hydrothermal carbonization temperature, Carbon 62 (2013) 346-355. [26] M. Sevilla, A. Fuertes, R. Mokaya, High density hydrogen storage in superactivated carbons from hydrothermally carbonized renewable organic materials, Energy & Environmental Science 4(4) (2011) 1400-1410. [27] C. Falco, J.M. Sieben, N. Brun, M. Sevilla, T. Van der Mauelen, E. Morallón, D. Cazorla‐Amorós, M.M. Titirici, Hydrothermal Carbons from Hemicellulose‐Derived Aqueous Hydrolysis Products as Electrode Materials for Supercapacitors, ChemSusChem 6(2) (2013) 374-382. [28] S.-Y. Yang, K.-H. Chang, Y.-L. Huang, Y.-F. Lee, H.-W. Tien, S.-M. Li, Y.-H. Lee, C.-H. Liu, C.-C.M. Ma, C.-C. Hu, A powerful approach to fabricate nitrogen-doped graphene sheets with high specific surface area, Electrochemistry Communications 14(1) (2012) 39-42. [29] M.A. Islam, M. Ahmed, W. Khanday, M. Asif, B. Hameed, Mesoporous activated carbon prepared from NaOH activation of rattan (Lacosperma secundiflorum) hydrochar for methylene blue removal, Ecotoxicology and environmental safety 138 (2017) 279-285. [30] H. Wang, Z. Xu, A. Kohandehghan, Z. Li, K. Cui, X. Tan, T. Stephenson, C.K. King’ondu, C.M.B. Holt, B.C. Olsen, J.K. Tak, D. Harfield, P. Ajayan, D. Mitlin, Interconnected Carbon Nanosheets Derived from Hemp for Ultrafast Supercapacitors with High Energy, ACS Nano 7(6) (2013) 5131-5141. [31] K. Foo, B. Hameed, Preparation and characterization of activated carbon from pistachio nut shells via microwave-induced chemical activation, Biomass and Bioenergy 35(7) (2011) 3257-3261. [32] K. Foo, B. Hameed, Utilization of rice husks as a feedstock for preparation of activated carbon by microwave induced KOH and K2CO3 activation, Bioresour. Technol. 102(20) (2011) 9814-9817. [33] Y. Lu, S. Zhang, J. Yin, C. Bai, J. Zhang, Y. Li, Y. Yang, Z. Ge, M. Zhang, L. Wei, Mesoporous activated carbon materials with ultrahigh mesopore volume and effective specific surface area for high performance supercapacitors, Carbon 124 (2017) 64-71. [34] D. Zhao, J. Feng, Q. Huo, N. Melosh, G.H. Fredrickson, B.F. Chmelka, G.D. Stucky, Triblock copolymer syntheses of mesoporous silica with periodic 50 to 300 angstrom pores, science 279(5350) (1998) 548-552. [35] L. Zou, L. Li, H. Song, G. Morris, Using mesoporous carbon electrodes for brackish water desalination, Water research 42(8) (2008) 2340-2348. [36] S. Suganuma, K. Nakajima, M. Kitano, D. Yamaguchi, H. Kato, S. Hayashi, M. Hara, Hydrolysis of cellulose by amorphous carbon bearing SO3H, COOH, and OH groups, Journal of the American Chemical Society 130(38) (2008) 12787-12793. [37] J. Barkauskas, M. Dervinyte, Investigation of the functional groups on the surface of activated carbons, Journal of the Serbian Chemical Society 69(5) (2004) 363-375.
Preprints (www.preprints.org) | NOT PEER-REVIEWED | Posted: 28 April 2018 doi:10.20944/preprints201804.0372.v1
Peer-reviewed version available at C 2018, 4, 38; doi:10.3390/c4030038

22
[38] A. Reina, X. Jia, J. Ho, D. Nezich, H. Son, V. Bulovic, M.S. Dresselhaus, J. Kong, Large area, few-layer graphene films on arbitrary substrates by chemical vapor deposition, Nano letters 9(1) (2008) 30-35. [39] Y. Liu, Y. Zhao, K. Li, Z. Wang, P. Tian, D. Liu, T. Yang, J. Wang, Activated carbon derived from chitosan as air cathode catalyst for high performance in microbial fuel cells, Journal of Power Sources 378 (2018) 1-9. [40] S. Xu, L. Yong, P. Wu, One-pot, green, rapid synthesis of flowerlike gold nanoparticles/reduced graphene oxide composite with regenerated silk fibroin as efficient oxygen reduction electrocatalysts, ACS applied materials & interfaces 5(3) (2013) 654-662. [41] O. Maslova, M. Ammar, G. Guimbretière, J.-N. Rouzaud, P. Simon, Determination of crystallite size in polished graphitized carbon by Raman spectroscopy, Physical Review B 86(13) (2012) 134205. [42] M. Matthews, M. Pimenta, G. Dresselhaus, M. Dresselhaus, M. Endo, Origin of dispersive effects of the Raman D band in carbon materials, Physical Review B 59(10) (1999) R6585. [43] Z. Tai, Q. Zhang, Y. Liu, H. Liu, S. Dou, Activated carbon from the graphite with increased rate capability for the potassium ion battery, Carbon 123 (2017) 54-61. [44] M. Keeping, O. Reynolds, Silicon in agriculture: new insights, new significance and growing application, Annals of Applied Biology 155(2) (2009) 153. [45] D. Yang, A. Velamakanni, G. Bozoklu, S. Park, M. Stoller, R.D. Piner, S. Stankovich, I. Jung, D.A. Field, C.A. Ventrice, Chemical analysis of graphene oxide films after heat and chemical treatments by X-ray photoelectron and Micro-Raman spectroscopy, Carbon 47(1) (2009) 145-152. [46] M. Seah, The quantitative analysis of surfaces by XPS: a review, Surface and Interface Analysis 2(6) (1980) 222-239. [47] M. Smíšek, S. Černý, Active carbon: manufacture, properties and applications, Elsevier Publishing Company1970. [48] M. Lillo-Ródenas, D. Cazorla-Amorós, A. Linares-Solano, Understanding chemical reactions between carbons and NaOH and KOH: an insight into the chemical activation mechanism, Carbon 41(2) (2003) 267-275. [49] M. Lillo-Ródenas, J. Juan-Juan, D. Cazorla-Amorós, A. Linares-Solano, About reactions occurring during chemical activation with hydroxides, Carbon 42(7) (2004) 1371-1375. [50] L.M. Viculis, J.J. Mack, R.B. Kaner, A chemical route to carbon nanoscrolls, Science 299(5611) (2003) 1361-1361.
Preprints (www.preprints.org) | NOT PEER-REVIEWED | Posted: 28 April 2018 doi:10.20944/preprints201804.0372.v1
Peer-reviewed version available at C 2018, 4, 38; doi:10.3390/c4030038