High Speed Wind Tunnel and Test Systems Design Handbook
72
PUBLICATION NUMBER AER-EIR-13552-E High Speed Wind Tunnel and Test Systems Design Handbook
Transcript of High Speed Wind Tunnel and Test Systems Design Handbook

PUBLICATION NUMBER AER-EIR-13552-E
High Speed Wind Tunnel andTest Systems Design Handbook

05/06/02-DPC-817605
High Speed Wind Tunnel and Test Systems Design Handbook
LOCKHEED MARTIN MISILES AND FIRE CONTROL Post Office Box 650003, MS LJS-05 Dallas, Texas 75265-0003
PUBLICATION NUMBER AER-EIR-13552-E

i
Table of Contents
Section Title Page 1.0 INTRODUCTION.............................................................................................1 2.0 HIGH SPEED WIND TUNNEL FACILITY OVERVIEW..........................3 2.1 Facility Description.................................................................................5 2.1.1 Occupancy Charge Policy .......................................................9 2.1.2 Security ...................................................................................9 2.2 Additional Facilities and Services.........................................................10 2.3 Wind Tunnel Operating Capabilities.....................................................10 3.0 WIND TUNNEL CIRCUIT CAPABILITIES..............................................11 3.1 Compression and Storage......................................................................11 3.2 Flow Control .........................................................................................11 3.3 Variable Contour Nozzle.......................................................................13 3.4 Test Sections and Diffusers...................................................................15 3.4.1 Supersonic Test Section ........................................................15 3.4.2 Transonic Test Section ..........................................................15 3.5 Performance and Operational Characteristics .......................................17 3.5.1 Performance Parameters........................................................17 3.5.2 Calibration Data ....................................................................25 3.5.3 Operational Characteristics ...................................................25 4.0 DATA ACQUISITION AND PROCESSING CAPABILITIES.................29 4.1 Data Acquisition and Processing System..............................................29 4.2 Dynamic Data Recording Equipment ...................................................30 4.3 Steady-State Force Instrumentation ......................................................31 4.4 Steady-State Pressure Instrumentation..................................................33 4.5 Data Processing and Reporting .............................................................35 5.0 MODEL SUPPORT SYSTEM ......................................................................37 5.1 Model Cart ............................................................................................37 5.2 Remote Roll Sting .................................................................................37 5.3 Support Stings and Adapters .................................................................40 6.0 SPECIAL TEST SYSTEMS AND TECHNIQUES .....................................43 6.1 Inlet and Propulsion Tests .....................................................................43 6.2 Flight Dynamics Simulator ...................................................................45 6.3 Dynamic Stability..................................................................................47 6.4 Spin and Magnus Testing......................................................................47 6.5 Instrumented Stores Testing..................................................................49

ii
Table of Contents (Continued)
Section Title Page 6.6 Flow Visualization ................................................................................50 6.7 Bench Test Facility................................................................................52 6.8 High-Pressure Nitrogen Gas Facility ....................................................52 6.9 Additional Test Support Equipment......................................................53 7.0 MODEL DESIGN CONSIDERATIONS......................................................54 7.1 General Design Considerations .............................................................54 7.2 Model Size.............................................................................................54 7.3 Model Placement...................................................................................54 7.4 Pressure and Internal Flow Models .......................................................57 7.5 Static Stability Force Model Design Considerations.............................57 7.6 Starting Loads and Factors of Safety ....................................................58 8.0 TEST PLANNING AND SCHEDULING.....................................................59 8.1 Test Scheduling .....................................................................................59 8.2 Model Delivery Information .................................................................60 APPENDIX A Visitor Information.................................................................................61 APPENDIX B Technical References...............................................................................64

iii
List of Illustrations
Figure Title Page 2-1 High Speed Wind Tunnel General Arrangement.....................................................3 2-2 High Speed Wind Tunnel Circuit Layout ................................................................4 2-3 Model Setup Room and Calibration Stand ..............................................................5 2-4 Model Setup Room Machine Shop Tools for Model Repairs and Modifications....6 2-5 Control Room and Data Signal Conditioning and Acquisition System...................6 2-6 Data Acquisition and Processing Equipment...........................................................7 2-7 High-Bay Area with Transonic Test Section in Place .............................................8 2-8 Compressor Room ...................................................................................................8 3-1 Variable Contour Nozzle and Flexible Nozzle System
With Side Wall Removed ......................................................................................13 3-2 Supersonic Test Section With Diffuser in Place....................................................14 3-3 Transonic Test Section and Ejector .......................................................................16 3-4 Maximum Run Time as a Function of Mach Number ...........................................18 3-5 Variation of Reynolds Number With Mach Number for To=100ºF.......................19 3-6 Static Pressure as a Function of Mach Number .....................................................20 3-7 Dynamic Pressure Variation as a Function of Mach Number................................21 3-8 Test Section Density Variation as a Function of Mach Number ...........................22 3-9 Pressure Altitude Versus Equivalent Airspeed ......................................................23 3-10 Density Ratio Versus Equivalent Airspeed and Dynamic Pressure.......................24 4-1 Typical One-Piece, Six-Component Strain Gauge Balance...................................31 4-2 Typical Balance Adapter........................................................................................33 4-3 Electronically Scanned Pressure Modules and Range Specifications....................34 5-1 Model Cart Kinematics..........................................................................................38 5-2 Roll Support System Geometrical Relationships...................................................39 6-1 Inlet Support Assembly and Installation Photo......................................................44 6-2 Inlet Support Attachment Flange ...........................................................................44 6-3 Servo Control Flow Diagram.................................................................................45 6-4 Flight Dynamics Simulator Components...............................................................46 6-5 Photoelectric Tachometer System..........................................................................48

iv
List of Illustrations (Continued)
Figure Title Page 6-6 Typical Model and Roll Mechanism Assembly .................................................... 48 6-7 Typical Metric Stores Installation ......................................................................... 49 6-8 Typical Shadowgraphs .......................................................................................... 50 6-9 Dual-Color Pigmented Oil Flow – Typical Results............................................... 51 6-10 High Pressure Nitrogen Gas Facility..................................................................... 52 7-1 Allowable Model Frontal Area as a Function of Mach Number and Drag Coefficient ............................................................................................................. 55 7-2 Modified Normal-Shock Method of Evaluating Maximum Starting Loads.......... 56 A-1 Area Map Showing the Location of Local Hotels and Motels .............................. 62 A-2 Map Showing the Location of Lockheed Martin High Speed Wind Tunnel......... 63

v
List of Tables
Table Title Page 3-I High Speed Wind Tunnel Operating Parameters and Descriptive Details ............12 3-II High Speed Wind Tunnel Transonic Mach Numbers and Mach Functions ..........26 3-III High Speed Wind Tunnel Supersonic Mach Numbers and Mach Functions.........27 4-I High Speed Wind Tunnel Data Processing Equipment .........................................30 4-II Internal Force Balance Load and Dimensional Information..................................32 5-I Roll Support System Performance Parameters ......................................................39 5-II Available Model Support Sting Configuration ......................................................40 5-III Available Model Sting Extension and Adapter Configurations.............................42

vi
List of Terms, Acronyms and Abbreviations
M Mach Number, VT/a µ Mach line inclination, degrees q Dynamic pressure, PSF unless noted otherwise PO Isentropic stagnation pressure, psia a Angle of Attack, degrees s Density ratio, test section density/sea level density VEAS Equivalent airspeed, VEAS = VTvs , knots or feet/second PS Static test section pressure, psia T Static test section temperature, °R unless noted otherwise TO Stagnation temperature, °R unless noted otherwise
P? Stagnation pressure behind normal shock, psia N Normal force, pounds PM Pitching moment, inch-pounds Y Side force, pounds YM Yawing moment, inch-pounds RM Rolling moment, inch pounds AF Axial force, pounds VT Actual test section air velocity, feet/second a Test section speed of sound, 49.04 vT, feet/second °F Degrees Fahrenheit °R Degrees Rankine AM Model frontal area, square inches CD Drag coefficient, Drag/qAM (q in psi) ? Angle of yaw, degrees F Roll angle, degrees ? Weight flow, lb/sec P Average plenum total pressure, psia AFP Air flow parameter, (? ,P), T
1
1.0 INTRODUCTION
The purpose of this handbook is to provide customers of the Lockheed Martin Missiles and Fire Control (LMMFC) High Speed Wind Tunnel (HSWT) and related services with information necessary for planning and scheduling model design or testing. Our HSWT facility can accommodate a wide variety of high-speed tests including aerodynamic force measurements, flutter, store drop trajectories, inlet performance evaluation, jet engine base-flow simulation and dynamic stability. Detailed descriptions of the wind tunnel circuit capabilities, data acquisition and processing capabilities, model support system, special test systems and techniques, and model design considerations are provided in this handbook. Information for planning and scheduling testing is also included.
The services of the high-speed wind tunnel are available to the commercial aircraft industry, educational institutions, military and other government agencies requiring controlled high speed (nominally M = 0.3 to 4.8) wind tunnel testing conditions. The facility is physically located at 9301 Skyline Road in Dallas, Texas. The facility is within a 30-minute drive of the Dallas/Fort Worth International Airport and is serviced by rail, air and motor freight. Additional information concerning the facility’s location and surrounding accommodations for visitors conducting tests is provided in Appendix A of this handbook.
As a military contractor, government-approved policies and procedures are in place for protecting proprietary and classified information. Wind tunnel customer data is handled with the utmost security. Tunnel access during a test is controlled in accordance with the customer’s instructions. A well-equipped model setup room is provided to the customer for pretest and post-test use. Experienced personnel are available for model assembly and checkout.
A fixed-price rental rate is charged for tunnel occupancy time. The rental rate includes all labor, indirect costs and data processing. Preparation of a test data report is included for programs of 30 occupancy hours or more. The occupancy charge policy is presented in more detail in Section 2.0
An on-site Test Systems Design Group is available for support during testing and can be separately contracted for any of the following services:
• Calibrations of Balances and Transducers • Strain Gage Installation • Force Measurement Consulting • Design and Fabricate Six-Component Internal Strain Gage Force Balances, with or without
Flow-through Capability • Design and Fabricate Special Purpose Balances • Calibration Equipment • Design and Fabricate Complete Models, Components, and Modifications • Design and Fabricate Stings and Support Equipment • Design and Fabricate Thrust and Test Stands
2
Aerodynamic Support Services
The Aerodynamics Group can provide any combination of the following services for your test program:
• Design Definition Preliminary Through Final Configuration Surface Sizing Analysis Drag Predictions Trade Studies Airload Predictions
• Model Design Support Model Requirements Design Oversight
• Aero Prediction Empirical Analytical CFD
• Test Support Planning Predictions Conduct
• Post Test Data Analysis Results Presentation Aerodynamic Database Creation
Support 3-DOF Simulation Support 6-DOF Simulation
The services of all groups are available, and information concerning capabilities may be obtained by contacting the manager of the Wind Tunnel Laboratories.
We invite potential customers to visit our HSWT facility. Further information related to visits, testing, scheduling or rental rates is available through either of the following:
Manager, Wind Tunnel Laboratories (972) 946-2751
Test Systems Design (972) 946-8208
Lockheed Martin Missiles and Fire Control P. O. Box 650003, MS LJS-05 Dallas, Texas 75265-0003
3
2.0 HIGH SPEED WIND TUNNEL FACILITY OVERVIEW
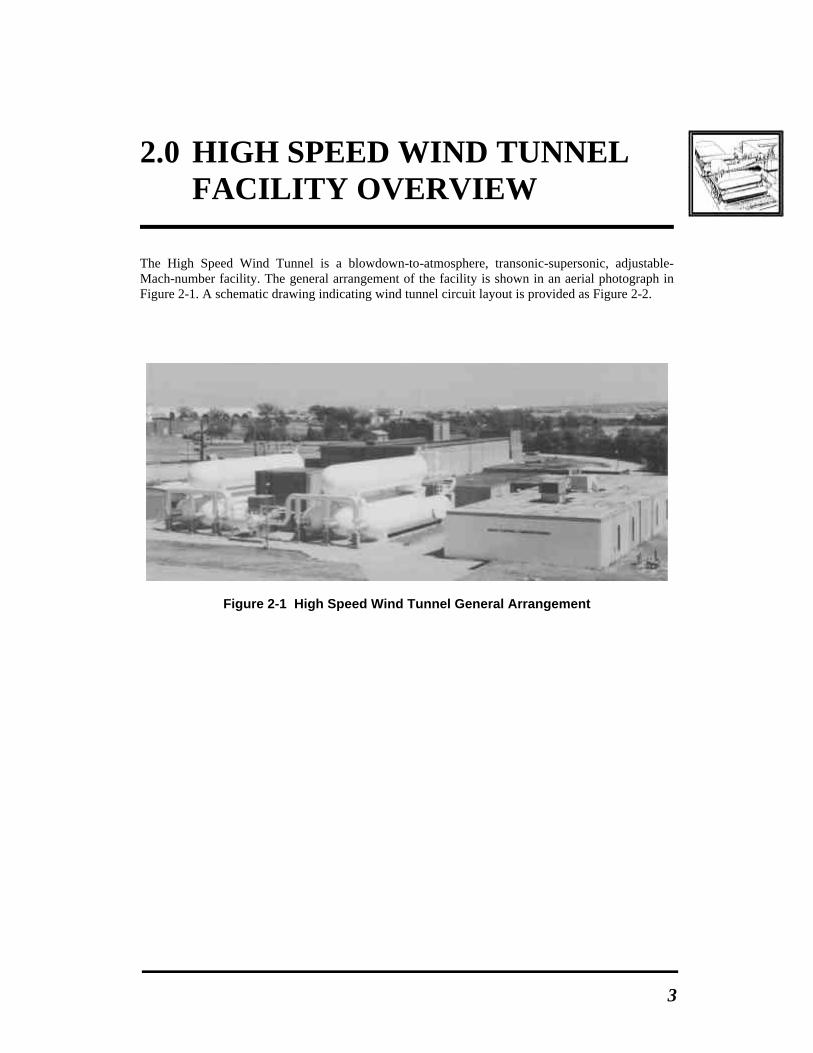
The High Speed Wind Tunnel is a blowdown-to-atmosphere, transonic-supersonic, adjustable-Mach-number facility. The general arrangement of the facility is shown in an aerial photograph in Figure 2-1. A schematic drawing indicating wind tunnel circuit layout is provided as Figure 2-2.
Figure 2-1 High Speed Wind Tunnel General Arrangement

4
Figure 2-2 High Speed Wind Tunnel Circuit Layout
5
2.1 FACILITY DESCRIPTION
The wind tunnel building is divided into eight areas:
• Offices • Model setup room • Control room • Data acquisition and processing system • Instrumentation assembly and repair room • Instrumentation calibration area • High-bay area • Compressor room.
Office space for wind tunnel customers is located adjacent to the wind tunnel circuit and is equipped with personal computer connections and a laser printer. Customers may bring laptop or personal computers provided arrangements are made in advance. Separate office areas are maintained for data reduction/computer operations and test operations. Reproduction facilities, classified storage files, and secretarial services are also conveniently located within the facility. All offices, shops and the high-bay area are air-conditioned.
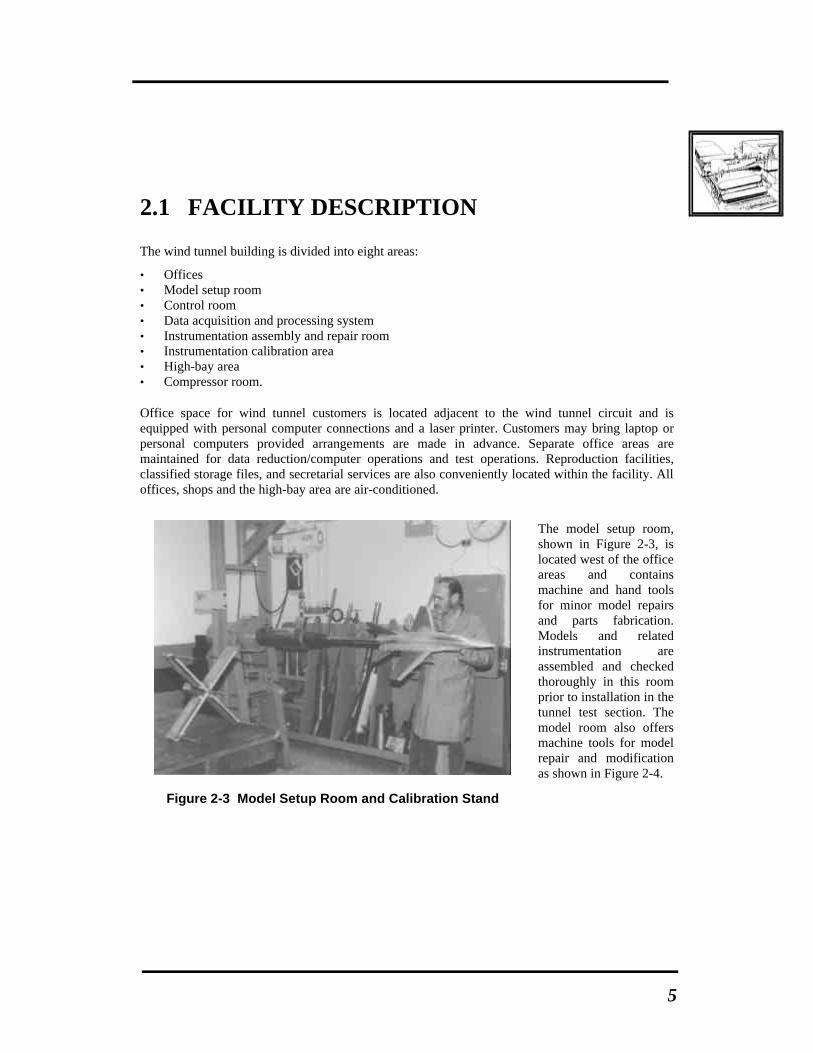
Figure 2-3 Model Setup Room and Calibration Stand
The model setup room, shown in Figure 2-3, is located west of the office areas and contains machine and hand tools for minor model repairs and parts fabrication. Models and related instrumentation are assembled and checked thoroughly in this room prior to installation in the tunnel test section. The model room also offers machine tools for model repair and modification as shown in Figure 2-4.

6
Figure 2-4 Model Setup Room Machine Shop Tools for Model Repairs and Modifications
Figure 2-5 shows the control room, which provides instrumentation and controls for operation of the wind tunnel and certain remotely controlled model parameters. Data signal amplifiers, electronic pressure scanner, and a 16-channel high speed digital data recorder are also located in the control room.
Figure 2-5 Control Room and Data Signal Conditioning and Acquisition System
7
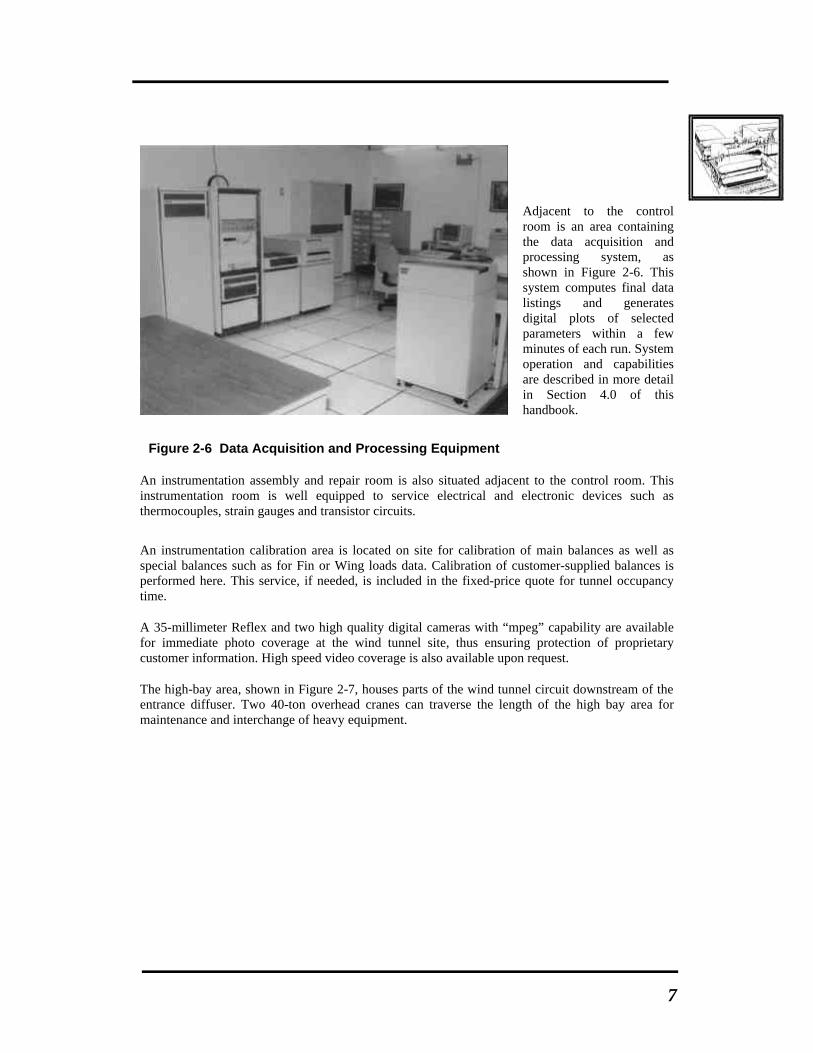
Adjacent to the control room is an area containing the data acquisition and processing system, as shown in Figure 2-6. This system computes final data listings and generates digital plots of selected parameters within a few minutes of each run. System operation and capabilities are described in more detail in Section 4.0 of this handbook.
Figure 2-6 Data Acquisition and Processing Equipment
An instrumentation assembly and repair room is also situated adjacent to the control room. This instrumentation room is well equipped to service electrical and electronic devices such as thermocouples, strain gauges and transistor circuits.
An instrumentation calibration area is located on site for calibration of main balances as well as special balances such as for Fin or Wing loads data. Calibration of customer-supplied balances is performed here. This service, if needed, is included in the fixed-price quote for tunnel occupancy time.
A 35-millimeter Reflex and two high quality digital cameras with “mpeg” capability are available for immediate photo coverage at the wind tunnel site, thus ensuring protection of proprietary customer information. High speed video coverage is also available upon request.
The high-bay area, shown in Figure 2-7, houses parts of the wind tunnel circuit downstream of the entrance diffuser. Two 40-ton overhead cranes can traverse the length of the high bay area for maintenance and interchange of heavy equipment.

8
Figure 2-7 High-Bay Area with Transonic Test Section in Place
The compressor room, shown in Figure 2-8, is located north of the high bay area behind sound-absorbing concrete walls. Compressor, tunnel and building foundations are mutually independent to minimize transmission of vibration among the three units.
Figure 2-8 Compressor Room

9
2.1.1 Occupancy Charge Policy
Tunnel occupancy time is charged for model installation, tank recharging after a valid run, test section changes, Mach number changes, model and/or instrumentation changes during the test, data acquisition changes, and model removal. However, most changes can be accomplished during the tank recharging time, thus avoiding additional charges. Occupancy time charge limits are normally imposed for model installation, test section changes, and model removals. Installation charges are based on system complexity and may range from 4 to 12 occupancy hours. The installation charges are agreed to by the customer and the assigned HSWT representative prior to the test. A maximum of 1 hour is charged for a test section change.
Occupancy charges for the HSWT are calculated based on actual tunnel time used. Testing times are determined based on the occupancy log sheet which is maintained by the assigned test operations engineer. The engineer is responsible for recording testing operations on a daily basis for each individual testing period. The customer representative reviews the log and verifies the entries with his signature. Daily occupancy charges begin at the start of the first valid run. In the event of a void run due to company equipment failure or personnel error, time charges cease until the next valid run. An estimated pump-up time is charged after the final run of the day based on known pump rates.
Occupancy is not charged when the tunnel is unavailable for customer testing due to maintenance of company equipment, lunch periods (except when the tanks are being filled), or due to delays and check runs requested by HSWT personnel. Repeat runs requested by the customer or model repair time is chargeable. Uncharged time is itemized and the reason is entered in an occupancy time log.
2.1.2 Security
Lockheed Martin Missiles and Fire Control has a Top Secret facility clearance granted by the Defense Investigative Service, St. Louis, Missouri, on 30 September 1992. The HSWT facility is completely enclosed within perimeter fencing to fully control access. During classified and customer proprietary testing, access is granted by means of written lists prepared by customer and assigned HSWT representatives and administered by LMMFC Security. All wind tunnel personnel have Secret clearances from the Department of Defense. In addition, the facility proper, including the computer, has been cleared by the Department of Defense for the storage of models and data of the same classification.

10
2.2 ADDITIONAL FACILITIES AND SERVICES
Wind tunnel customers can use any and all onsite capabilities in support of model and testing activities. Our machine shop, consisting of lathes, mills, drill presses, and grinders, is available to repair or modify models. The customer is invited to use this equipment with qualified operators or the facility can provide a machine operator for immediate repairs or model changes at no additional charge. In addition, the Test Systems Design group is available for any model design changes that may be desired.
Design and fabrication of both wind tunnel models and test support equipment can be provided on a suitable contractual basis either in conjunction with testing at the HSWT or in support of testing at other facilities. Nominal costs combined with short schedules and availability make these services quite attractive for support of wind tunnel testing contracts or proposal work.
2.3 WIND TUNNEL OPERATING CAPABILITIES In order to properly prepare for testing activities, the remaining sections of this handbook provide technical information addressing key wind tunnel operating capabilities. These capabilities and discussions include:
• Wind tunnel circuit • Data acquisition and processing • Model support system • Special test systems and techniques.
Subsequent sections address specific considerations associated with model design and preparation and actual test planning and scheduling.
11
3.0 WIND TUNNEL CIRCUIT CAPABILITIES
A description of the High Speed Wind Tunnel circuit is provided to introduce potential customers to its capabilities and operating parameters. A summary of the wind tunnel’s operating parameters and descriptive details is included in Table 3-I.
3.1 COMPRESSION AND STORAGE An 8,000-horsepower electric motor drives three series-connected, multistage, centrifugal compressors with an exit pressure of 600 pounds per square inch absolute (psia). Intake volumetric flow rate is constant at 18,000 cubic feet per minute (ft3/min). Moisture is removed from the compressed air by refrigeration and desiccant dryers to achieve dew-point temperatures of approximately –60 degrees Fahrenheit (°F). The air is then reheated to 350°F before delivery to the storage tanks.
Eight tanks with a total of 40,000 cubic feet of air storage capacity receive the reheated air until a maximum storage pressure of 520 psia is reached. The compressor discharge is then vented to atmosphere until the tank pressure is reduced to below 400 psia. An alumina pebble bed in each tank absorbs heat during pump-up and dissipates heat during air discharge to maintain a near-constant supply temperature.
The time required to recharge the air storage tanks following a run varies from 15 to 75 minutes, depending on the final tank pressure. A nominal tank pressure increase rate is 5 pounds per square inch (psi) per minute.
3.2 FLOW CONTROL Airflow through the wind tunnel is controlled by three valves between the storage tanks and test section. A squib-fired safety valve located in the mixer header is preset to close automatically if the stilling chamber pressure exceeds a preset level. A pneumatic gate valve, located upstream of the control valve, is normally closed and is opened only during a run.
Flow is controlled by a hydraulically operated, servo-controlled, rotating plug valve located just upstream of the entrance diffuser. This control valve maintains a stagnation pressure in the stilling chamber that matches a set point pressure selected in the control room. The set point pressure can be either constant or a time variable, depending on the type of test run desired.
Downstream of the control valve are the entrance diffuser and stilling chamber. The entrance diffuser reduces the air velocity from supersonic at the control valve exit to low subsonic at the stilling chamber entrance. Flow control devices inside the entrance diffuser are designed to produce uniform flow at the stilling chamber entrance and reduce valve noise.
Turbulence screens and a honeycomb sound attenuation structure are located in the stilling chamber. Large vortices are broken down by these devices into uniform, low-intensity, isotropic turbulent eddies. Stagnation pressure and temperature are measured downstream of these devices.
12
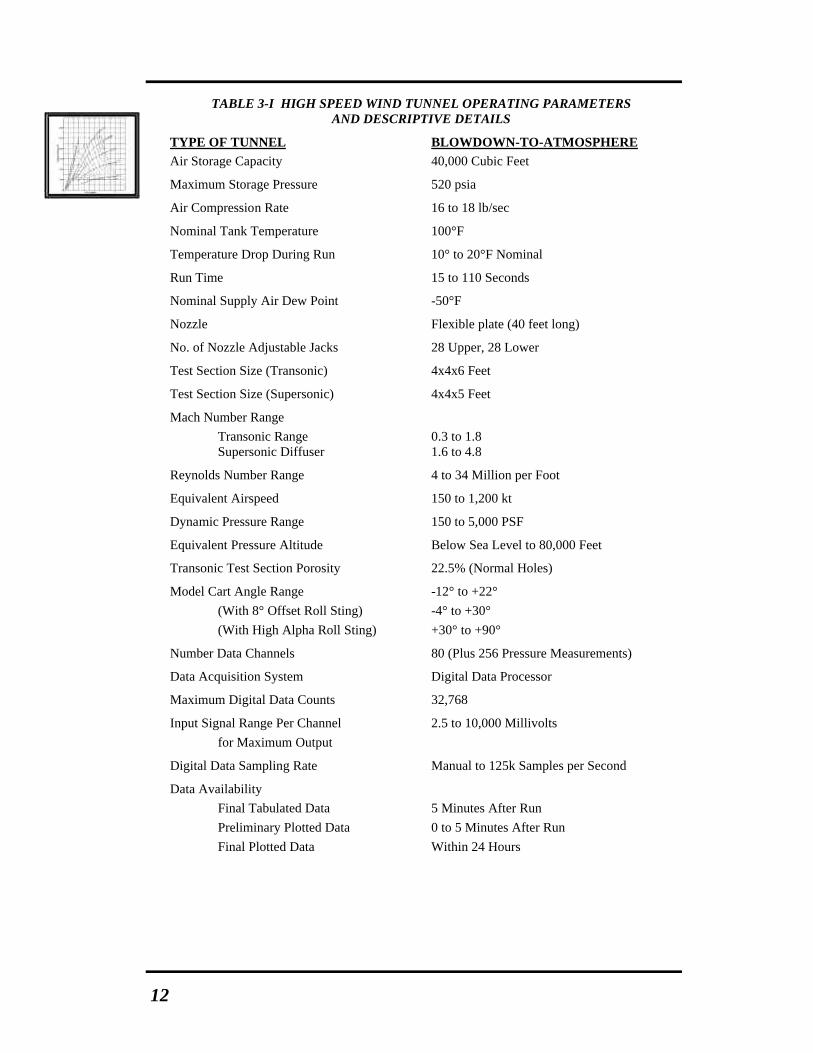
TABLE 3-I HIGH SPEED WIND TUNNEL OPERATING PARAMETERS AND DESCRIPTIVE DETAILS
TYPE OF TUNNEL BLOWDOWN-TO-ATMOSPHERE Air Storage Capacity 40,000 Cubic Feet
Maximum Storage Pressure 520 psia
Air Compression Rate 16 to 18 lb/sec
Nominal Tank Temperature 100°F
Temperature Drop During Run 10° to 20°F Nominal
Run Time 15 to 110 Seconds
Nominal Supply Air Dew Point -50°F
Nozzle Flexible plate (40 feet long)
No. of Nozzle Adjustable Jacks 28 Upper, 28 Lower
Test Section Size (Transonic) 4x4x6 Feet
Test Section Size (Supersonic) 4x4x5 Feet
Mach Number Range Transonic Range Supersonic Diffuser
0.3 to 1.8 1.6 to 4.8
Reynolds Number Range 4 to 34 Million per Foot
Equivalent Airspeed 150 to 1,200 kt
Dynamic Pressure Range 150 to 5,000 PSF
Equivalent Pressure Altitude Below Sea Level to 80,000 Feet
Transonic Test Section Porosity 22.5% (Normal Holes)
Model Cart Angle Range (With 8° Offset Roll Sting) (With High Alpha Roll Sting)
-12° to +22° -4° to +30° +30° to +90°
Number Data Channels 80 (Plus 256 Pressure Measurements)
Data Acquisition System Digital Data Processor
Maximum Digital Data Counts 32,768
Input Signal Range Per Channel for Maximum Output
2.5 to 10,000 Millivolts
Digital Data Sampling Rate Manual to 125k Samples per Second
Data Availability Final Tabulated Data Preliminary Plotted Data Final Plotted Data
5 Minutes After Run 0 to 5 Minutes After Run Within 24 Hours

13
3.3 VARIABLE CONTOUR NOZZLE
0.75-inch thick, 48 inches wide and 453 inches long, are contoured to produce a uniform test section flow using 28 nozzle jacks on each plate spaced at 10- to 18-inch intervals. During nozzle changes the plates are hydraulically extended to permit positioning of the threaded nozzle jacks. After the nozzle jacks are properly set, the plates are retracted against the nozzle jack stops. Microswitches on the stops indicate plate contact. Strain indicators at each jack position protect the nozzle plate from excessive stresses.
Figure 3-1 Variable Contour Nozzle and Flexible Nozzle System With Side Wall Removed

14
Figure 3-2 Supersonic Test Section With Diffuser in Place

15
During each run, the hydraulic cylinders are charged with high pressure to hold each plate support rigidly against the nozzle jack stops. Nominal Mach number changes can be completed in approximately 15 minutes.
3.4 TEST SECTIONS AND DIFFUSERS Because of the different operational requirements for transonic and supersonic testing, two test sections are available. The Mach number ranges for each test section overlap somewhat, although the supersonic test section is recommended for Mach numbers of 1.8 and higher.
3.4.1 Supersonic Test Section
The 4- by 4-foot supersonic test section is located in the last 5 feet of the flexible nozzle. Two optical-quality glass windows, 20 inches in diameter and 31-inches between centers, are located on each side of the test section for photographic flow visualization studies. Downstream of the supersonic test section is a single-peak, variable-geometry diffuser, which permits operation at lower stagnation pressures than is possible with a fixed-geometry diffuser. Diffuser geometry is varied within preset mechanical limits with hydraulically positioned walls. Cross-sectional diffuser area at the single peak is varied from that required for starting to the minimum required for sustained operations. Figure 3-2 provides cross-sectional diagrams of the supersonic test section and diffuser.
3.4.2 Transonic Test Section
For transonic operation, the supersonic diffuser is removed and the transonic test section and ejector section are set in place. Conversion time from supersonic to transonic configuration is nominally one hour.
Figure 3-3 provides cross-sectional diagrams of the transonic test section and ejector. The transonic test section has normal hole-perforated walls with 22.5-percent porosity. Test section size is nominally 4 by 4 by 6 feet, with each side wall converged 25 minutes. Subsonic Mach number control is accomplished with hydraulic, servo-actuated choking flaps downstream of the test section, as illustrated in Diagram A in Figure 3-3.
A control system maintains the preset ratio of static to total pressure during each run by causing small changes in choking area. Above Mach number 0.9, the choking flaps are fully open and Mach control is switched to a set of plenum-chamber bleed-control flaps. These hydraulically actuated, servo-controlled “Mach flaps” remove test-section air through the porous walls by ejection-pumping of the plenum chamber. A maximum Mach number of 1.15 can be attained with a sonic nozzle. To obtain Mach numbers greater than 1.15, nozzle plates are contoured in addition to using plenum pumping. A maximum Mach number of 1.8 is possible in the transonic test section.
As Diagram B in Figure 3-3 illustrates, the model cart is relocated downstream approximately 11 feet into the transonic test section. Test section window locations relative to the model cart are the same for either section.

16
Figure 3-3 Transonic Test Section and Ejector

17
3.5 PERFORMANCE AND OPERATIONAL CHARACTERISTICS
The High Speed Wind Tunnel covers a Mach number range of 0.3 to 4.8 using two test sections, as described in the preceding paragraphs. The perforated-wall transonic test section operates over the range of Mach 0.3 to Mach 1.8. The supersonic test section and diffuser operates between Mach 1.4 and Mach 4.8.
To provide potential customers with sufficient data for determining the applicability of the HSWT to test requirements and for preliminary test planning, the following are presented:
• Performance parameters
• Mach number and flow angularity calibration data
• Operational characteristics.
3.5.1 Performance Parameters
One-dimensional, isentropic, compressible-flow relations for air such as those tabulated in the company report entitled, “Tables of Mach Functions” (Technical Reference 2, Appendix B) were used to develop the performance charts presented in Figures 3-4 through 3-10. These charts present wind tunnel parameters for:
• Maximum run time as a function of Mach number (Figure 3-4)
• Variation of Reynolds Number with Mach number for TO = 100°F (Figure 3-5)
• Static pressure as a function of Mach number (Figure 3-6)
• Dynamic pressure variation as a function of Mach number (Figure 3-7)
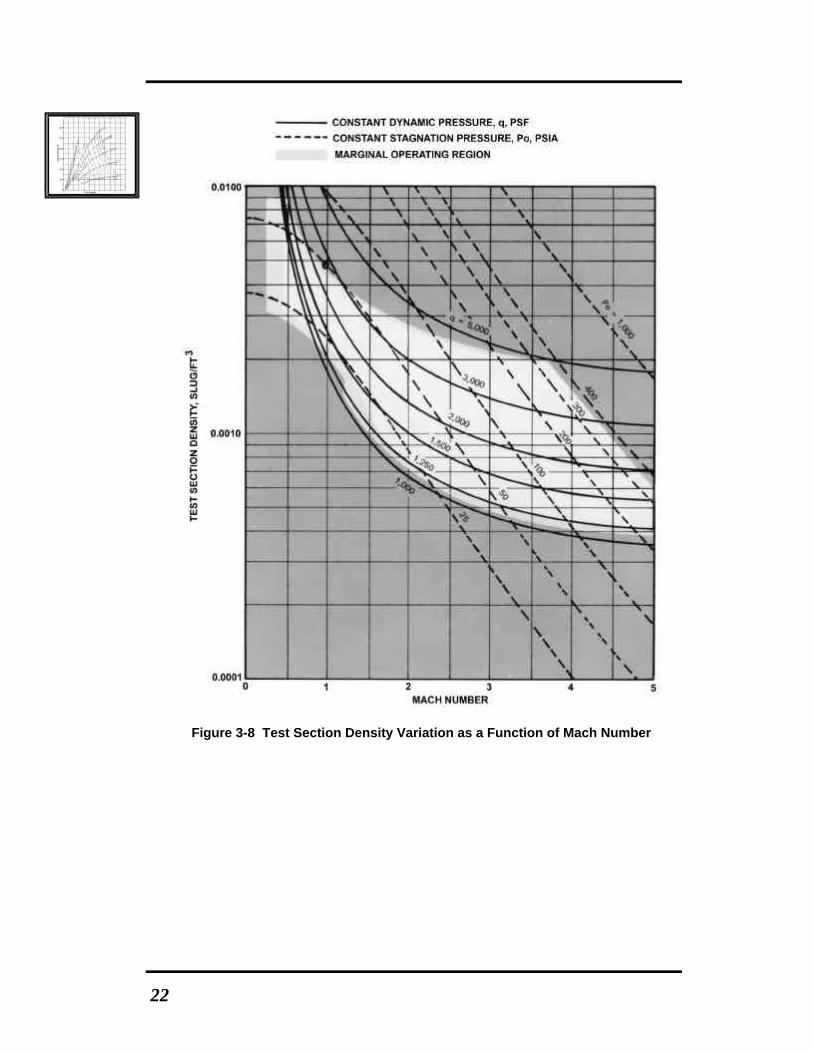
• Test section density variation as a function of Mach number (Figure 3-8)
• Pressure altitude versus equivalent airspeed (Figure 3-9)
• Density ratio versus equivalent airspeed and dynamic pressure (Figure 3-10).

18
Figure 3-4 Maximum Run Time as a Function of Mach Number

19
Figure 3-5 Variation of Reynolds Number With Mach Number for TO = 100°F

20
Figure 3-6 Static Pressure as a Function of Mach Number

21
Figure 3-7 Dynamic Pressure Variation as a Function of Mach Number
22
Figure 3-8 Test Section Density Variation as a Function of Mach Number

23
Figure 3-9 Pressure Altitude Versus Equivalent Airspeed
24
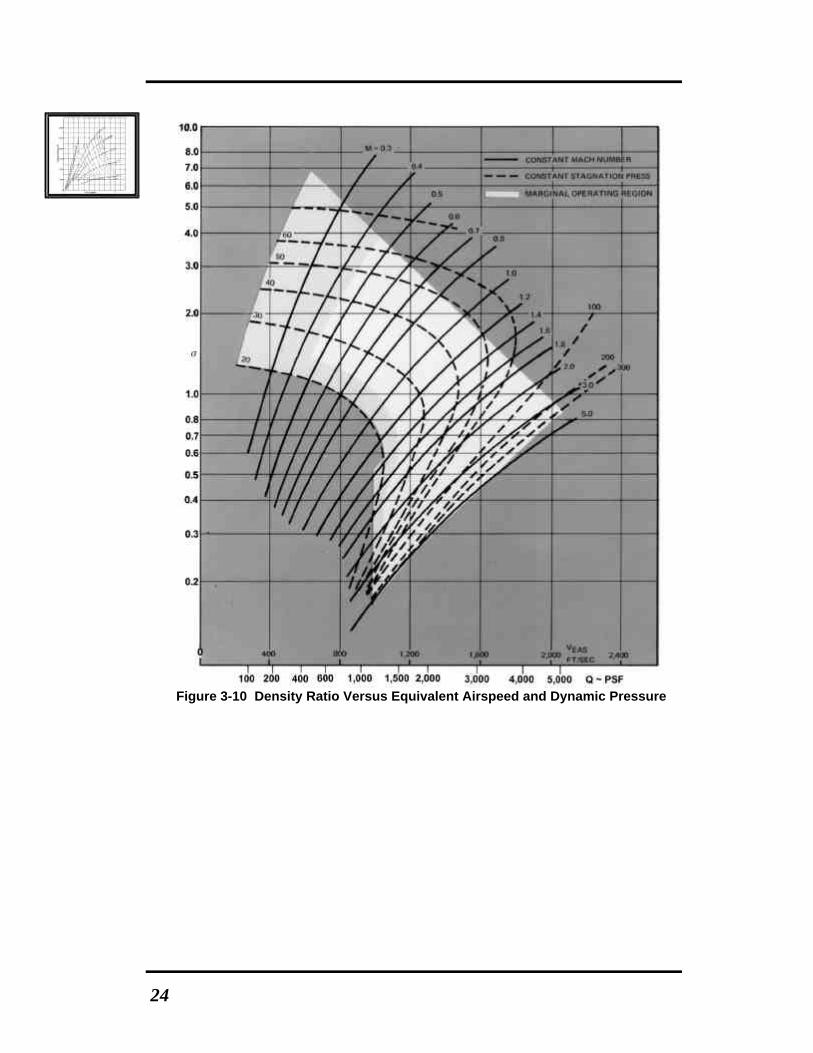
Figure 3-10 Density Ratio Versus Equivalent Airspeed and Dynamic Pressure

25
The calculations are based on the assumption of a nominal stagnation temperature of 100°F. Operational limits shown on each chart are based on theoretical mass-flow maximums, stagnation pressure limits, and model size considerations.
Figure 3-4 shows calculated run time as a function of Mach number and stagnation pressure. The maximum run time is based on an initial tank pressure of 520 psia and calculated pressure losses during stabilization. This chart can be used as a guide during test planning to match the time required to obtain the desired data within the maximum available run time. Run output can vary significantly (from 1.2 to 5 per hour) as a function of tunnel operating conditions and pitch or roll range and rate. Estimates of occupancy time for a particular program may be obtained by contacting the manager of the High Speed Wind Tunnel.
Figure 3-9 presents pressure altitude versus equivalent airspeed with lines of constant Mach number and stagnation pressure. Operating limits of the wind tunnel are noted above an equivalent altitude of –10,000 feet. A stagnation temperature of 100°F was assumed and an ARDC model atmosphere was used to obtain pressure altitude equivalence. For convenience, equivalent airspeed is presented in both feet/second and knots. Density ratio versus dynamic pressure and equivalent airspeed is shown in Figure 3-10.
3.5.2 Calibration Data
Mach number and flow angularity calibrations for the High Speed Wind Tunnel are repeated from time to time as a check on tunnel flow quality. Table 3-II presents nominal transonic Mach numbers and appropriate pressure ratios. Transonic Mach numbers are determined from static pressure measurements on the tunnel wall upstream of the model location and stagnation pressure measurements in the stilling chamber. Calibrated supersonic Mach numbers, presented in Table 3-III, were determined from an averaged pressure distribution in the test section.
3.5.3 Operational Characteristics
During a test run, the stagnation pressure and Mach number are normally held constant. Unit Reynolds number increases slightly due to a 20°F (approximate) drop in stagnation temperature. The primary variable during a run is model attitude or some remotely controlled model geometric variable.

26
TABLE 3-II HIGH SPEED WIND TUNNEL TRANSONIC MACH NUMBERS AND MACH FUNCTIONS
NOMINAL* MACH NO. PS/PO q/PS q/PO T/TO PS/P? P?/PO
0.20 0.97250 0.02800 0.02723 0.99206 0.97250 1.00000
0.30 0.93947 0.06300 0.05919 0.98232 0.93947 1.00000
0.40 0.89561 0.11200 0.10031 0.96899 0.89561 1.00000
0.50 0.84302 0.17500 0.14753 0.95238 0.84302 1.00000
0.60 0.78400 0.25200 0.19757 0.93284 0.78400 1.00000
0.70 0.72093 0.34300 0.24728 0.91075 0.72093 1.00000
0.80 0.65602 0.44800 0.29390 0.88652 0.65602 1.00000
0.90 0.59126 0.56700 0.33524 0.86059 0.59126 1.00000
1.00 0.52828 0.70000 0.36980 0.83333 0.52828 1.00000
1.10 0.46835 0.84700 0.39670 0.80515 0.46886 0.99893
1.20 0.41238 1.00800 0.41568 0.77640 0.41537 0.99280
1.30 0.36091 1.18300 0.42696 0.74738 0.36852 0.97937
1.40 0.31424 1.37200 0.43114 0.71839 0.32795 0.95819
1.50 0.27240 1.57500 0.42903 0.68966 0.29297 0.92979
1.60 0.23527 1.79200 0.42161 0.66138 0.26281 0.89520
1.70 0.20259 2.02300 0.40985 0.63371 0.23675 0.85572
1.80 0.17404 2.26800 0.39472 0.60680 0.21416 0.81268
* ACTUAL MACH NUMBERS ARE COMPUTED FROM MEASURED STATIC AND STAGNATION PRESSURES

27
TABLE 3-III HIGH SPEED WIND TUNNEL SUPERSONIC MACH NUMBERS AND MACH FUNCTIONS
CALIBRATED MACH NO. PS/PO q/PS q/PO T/TO PS/P? P?/PO
1.23 0.39645 1.05903 0.41985 0.76771 0.40062 0.98958
1.42 0.30549 1.41148 0.43119 0.71262 0.32053 0.95306
1.61 0.23181 1.81447 0.42061 0.65858 0.26003 0.89145
1.81 0.17140 2.29327 0.39306 0.60415 0.21206 0.80823
2.01 0.12583 2.82807 0.35586 0.55309 0.17569 0.71620
2.21 0.90207 3.41887 0.31477 0.50586 0.14764 0.62359
2.41 0.06734 4.06567 0.27378 0.46262 0.12565 0.53594
2.61 0.04935 4.76847 0.23530 0.42330 0.10813 0.45636
2.80 0.03685 5.48800 0.20222 0.38941 0.09461 0.38946
2.99 0.02764 6.25807 0.17294 0.35868 0.08345 0.33118
3.19 0.02053 7.12327 0.14622 0.32947 0.07367 0.27863
3.39 0.01534 8.04447 0.12343 0.30318 0.06550 0.23435
3.59 0.01155 9.02167 0.10416 0.27952 0.05861 0.19531
3.78 0.00887 10.00188 0.08870 0.25922 0.05301 0.16731
3.98 0.00676 11.08828 0.07500 0.23992 0.04793 0.14112
4.16 0.00533 12.11392 0.06460 0.22416 0.04396 0.12030
4.39 0.00397 13.49047 0.05352 0.20600 0.03956 0.10030
4.59 0.00309 14.74767 0.04558 0.19181 0.03624 0.08527
4.75 0.00254 15.79375 0.04016 0.18141 0.03388 0.07505
4.97 0.00196 17.29063 0.03385 0.16835 0.03099 0.06317

28
For special requirements, certain tunnel or model parameters can be controlled with an analog or digital computer program. Examples of operational capabilities involving computer-controlled variables during a run include:
• Mach number variation from 0.6 to 1.15, with stagnation pressure, lift coefficient, or Reynolds number constant
• Reynolds number variation, with Mach number constant
• Stagnation pressure variation (to compensate for temperature drop), with Reynolds number constant
• Pitch angle variation during Mach number or Reynolds number ramp to maintain a constant lift coefficient
Additional capabilities can sometimes be added for a specific requirement if a sufficient lead-time is available to develop a computer routine before the test.
29
4.0 DATA ACQUISITION AND PROCESSING CAPABILITIES
LMMFC HSWT offers comprehensive data acquisition and processing capabilities to meet a wide variety of testing requirements. Capabilities include:
• State-of-the-art data acquisition and processing system
• A wide assortment of dynamic data recording equipment
• Steady-state force instrumentation
• Steady-state pressure instrumentation
• Data processing and reporting.
4.1 DATA ACQUISITION AND PROCESSING SYSTEM
The data acquisition and processing system is the heart of the HSWT data gathering and computation capability. Operated from the tunnel’s control room, the system accommodates up to 80 analog voltage signals from the model and tunnel transducer components. Signals are amplified through Preston 8300 XWB instrumentation amplifiers to a ±10-volt maximum. Signals can be conditioned through selected low-pass filters to minimize high-frequency “noise” generated by model vibrations or random pressure pulses.
Amplifier outputs may be used in any or all of three recording modes:
• Filtered outputs digitized and stored for use in final data processing
• Unfiltered outputs recorded on an oscillograph, oscilloscope, tape recorder or high-response digital recording device
• Filtered or unfiltered outputs used in analog computations and displayed on strip charts during each run.
The data processing equipment, shown in Figure 2-6 of this handbook, is listed in Table 4-I.

30
TABLE 4-I HIGH SPEED WIND TUNNEL DATA PROCESSING EQUIPMENT
EQUIPMENT ITEM QUANTITY
16-BIT CENTRAL PROCESSING UNIT (CPU) WITH 6-MEGABYTE (MB) MEMORY 1
404-MB MOVING HEAD DISK 1
650 MB CDROM WRITER 1
STANDARD CATHODE RAY TUBE (CRT) DISPLAY DEVICES 3
GRAPHIC CRT DISPLAY DEVICES 2
LASER PRINTER (HEWLETT-PACKARD) LASERJET FOR PLOTTING REDUCED DATA 2
ANALOG-TO-DIGITAL CONVERTER WITH 15-BIT, 64-CHANNEL MULTIPLEXER 1
DIGITAL-TO-ANALOG CONVERTER WITH 4 CHANNELS 2
UNIVERSAL COUNTER 1
During each wind tunnel test run, the system’s computer multiplexer terminal receives filtered analog outputs from the instrumentation amplifiers. All inputs are sampled at a commutation rate of 125,000 (variables) per second at intervals of 5, 10 or 20 times per second. The maximum voltage output of ±10 volts is converted to ±32,768 counts. After analog-to-digital conversion, the data are stored on a disk file.
After each test run, complete and final coefficient data are tabulated and printed out on 8½ x 11 paper in customer-specified format. Digital coefficient data plots of selected parameters are produced using the LaserJet printers. Requested plots are immediately available following each run for quick appraisal of model performance.
4.2 DYNAMIC DATA RECORDING EQUIPMENT The HSWT is equipped with a wide assortment of high-frequency-response instrumentation for recording dynamic data from various sources. Available equipment includes:
• 8 channels of wide-band direct current (dc) amplifiers
• 16-channel Astro-Med MT9500 chart recorder
• 8-channel Astro-Med DASH 8 portable chart recorder
• 16-channel Iotech high speed digital data acquisition system
• Spin physics and high-speed film (up to 3,000 frames per second).
The full complement of dynamic data recording equipment or any combination of selected instrumentation may be employed in dynamic tests such as flutter evaluation, dynamic stability, roll damping, buffet, store ejection and transient or impulse phenomenon studies. Techniques for such dynamic tests are described in Section 6.0 of this handbook in paragraphs 6.2 and 6.3.

31
4.3 STEADY-STATE FORCE INSTRUMENTATION
Over 30 internal strain gauge balances are available for customer use in measuring model forces and moments. These balances were designed, fabricated and calibrated by the Test Systems Design group and are furnished as a standard customer service. A typical, one-piece six-component internal strain gauge balance is shown in Figure 4-1.
Figure 4.1 Typical One-Piece, Six-Component Strain Gauge Balance

32
Balances are available in a number of sizes, as described in Table 4-II. For best results, the balance maximum-rated load should approximately equal the maximum expected model loads. However, full-scale data system output can be obtained for much smaller loads by using higher signal amplifier gain. Special force balances or other instrumentation can be designed and fabricated by the Test Systems Design group. Custom instrumentation design and fabrication are available for customer purchase under contract.
TABLE 4-II INTERNAL FORCE BALANCE LOAD AND DIMENSIONAL INFORMATION

33
A sketch of a typical balance adapter with an integral insulated taper for a model fouling indicator is shown in Figure 4-2.
Figure 4-2 Typical Balance Adapter
4.4 STEADY-STATE PRESSURE INSTRUMENTATION
The wind tunnel is equipped with two different systems for taking pressure measurements on a model. They include:
• Individual pressure transducers
• Electronically scanned pressure modules
Pressure calibration instrumentation is also available to verify pressure system data accuracy.
The electronic system is manufactured under the trade name, Scanivalve.

34
We maintain an inventory of individual pressure transducers with a wide range of measurement capabilities from ±5 to ±50 pounds per square inch differential (psid) and 0-5 to 0-5,000 pounds per square inch absolute (psia) are available. Most individual transducers are 0.25 and 0.5-inch flush-diaphragm, strain-gauge pressure transducers.
Pressure requirements above approximately 25 pressures are measured using the electronically scanned pressure modules. Two types of modules are available, as shown in Figure 4-3. The ZOC 14 and ZOC 22 modules have 32 ports. One model ZOC 12 module has 16 ports. These modules are used for pressures up to 50 psid. The maximum reference pressure for the ZOC 12 and 22 is 50 pounds per square inch gauge (psig). The ZOC 14 modules are used for pressures up to 100 psid. The maximum reference pressure for the ZOC 14 is 100 psig.
Figure 4-3 Electronically Scanned Pressure Modules and Range Specifications

35
Pressure calibration instrumentation available includes two dead-weight calibration systems as well as a precision NIST traceable digital pressure gauge. The digital pressure gauge is capable of setting pressures from 0 to 100 psia to an accuracy of 0.001 psia.
4.5 DATA PROCESSING AND REPORTING The HSWT strives to provide customers with real-time test results to minimize wind tunnel time and maximize substantive test data. HSWT personnel are dedicated to meeting specific customer data requirements. We can accommodate virtually any data requirement or reporting need if notified ahead of time. Complete data reduction information should be included in the customer’s test plan or pretest report. Reference areas, reference lengths, moment reference points, base drag correction areas, desired coefficient data, and other pertinent parameters used in data reduction (input or output) should be included for each configuration in the test plan provided prior to scheduled wind tunnel testing dates. Further information concerning information and scheduling notification required for wind tunnel testing at the HSWT is provided in Section 8.0 of this plan.
Final tabulated data are available within 5 minutes following a run. A copy of the data is provided for customer use. The tabulated data format can be arranged to suit the customer if such requirements are provided no later than one week prior to the test. Special data reduction equations, techniques and methods can be programmed if sufficient lead-time is allowed.
Preliminary plotted digital data are usually available within 5 minutes following a run. A laser printer is used to plot desired coefficients using inputs from the data acquisition and processing system computer. If desired, coefficient data on floppy disks or CDs can also be furnished.
Final data reports are prepared by the HSWT personnel for tests in excess of 30 occupancy hours when requested by customers. All the information pertinent to the test, methods of data reduction, model sketches, tabulated data and plotted data are included in the data report. Data analysis will not be included unless this requirement is stipulated prior to testing and it will incur an additional charge.
36
If a formal data report is requested for tests resulting from less than 30 occupancy hours, the customer incurs an additional charge. The final data report is provided to the customer within 90 days of test completion. One copy of the final data report will be retained in the HSWT files.
37
5.0 MODEL SUPPORT SYSTEM
The HSWT model support system includes a specially designed model cart, remotely-controlled roll stings and a wide variety of support stings and adapters.
5.1 MODEL CART The model cart is mounted on rails and can be rolled some distance away from either test section to facilitate test section or major model changes. During a test run, the model cart is secured with hydraulically operated locks. The model cart position relative to the test section window is the same for either the supersonic or transonic section.
Sting-supported models are usually mounted on the model cart. The servo-controlled, hydraulically actuated cart can sweep through an angle range of -12 to +22 degrees while the center of rotation remains on the tunnel centerline. Figure 5-1 illustrates model cart kinematics. Sweep rates up to 6 degrees per second are possible. The cart can be used to pitch the model and can be mechanically rolled for yaw sweeps. Knuckle stings can provide fixed offset model pitch, yaw angles or can extend the cart angle range. A remotely controlled roll sting can be added to provide multiple pitch, roll and yaw sweeps, as described in paragraph 5.2 below.
5.2 REMOTE ROLL STING Three remotely controlled roll stings are available to cover an angle-of-attack range of -12 to +22 degrees (A9), -4 to +30 degrees (A10) and +30 to +90 degrees High Alpha Roll Sting. Roll rates up to 100 degrees per second are possible. These remote roll stings serve as roll support systems and were designed primarily for missile testing to increase run output by allowing pitch sweeps at several roll angles or roll sweeps at several pitch angles during a run. A special software routine allows computer control of a roll sting to achieve either a pitch sweep at a constant yaw angle or a yaw sweep at a constant pitch angle. Figure 5-2 illustrates the geometrical relationships offered by the roll support systems.
System performance for all three remotely controlled stings is summarized in Table 5-I.

38
Figure 5-1 Model Cart Kinematics

39
Figure 5-2 Roll Support System Geometrical Relationships
TABLE 5-I ROLL SUPPORT SYSTEM PERFORMANCE PARAMETERS
Roll angle range, A9 and A10 270 degrees
High Alpha Roll Sting 360 degrees
Maximum Stall Torque 2500 inch-pounds
Maximum roll rate, 100 inch-pounds torque 200 degree/second
Normal force and side force 4000 pounds – 42 inches forward of front face of roll pod
Roll positioning accuracy ±0.10 degree
40
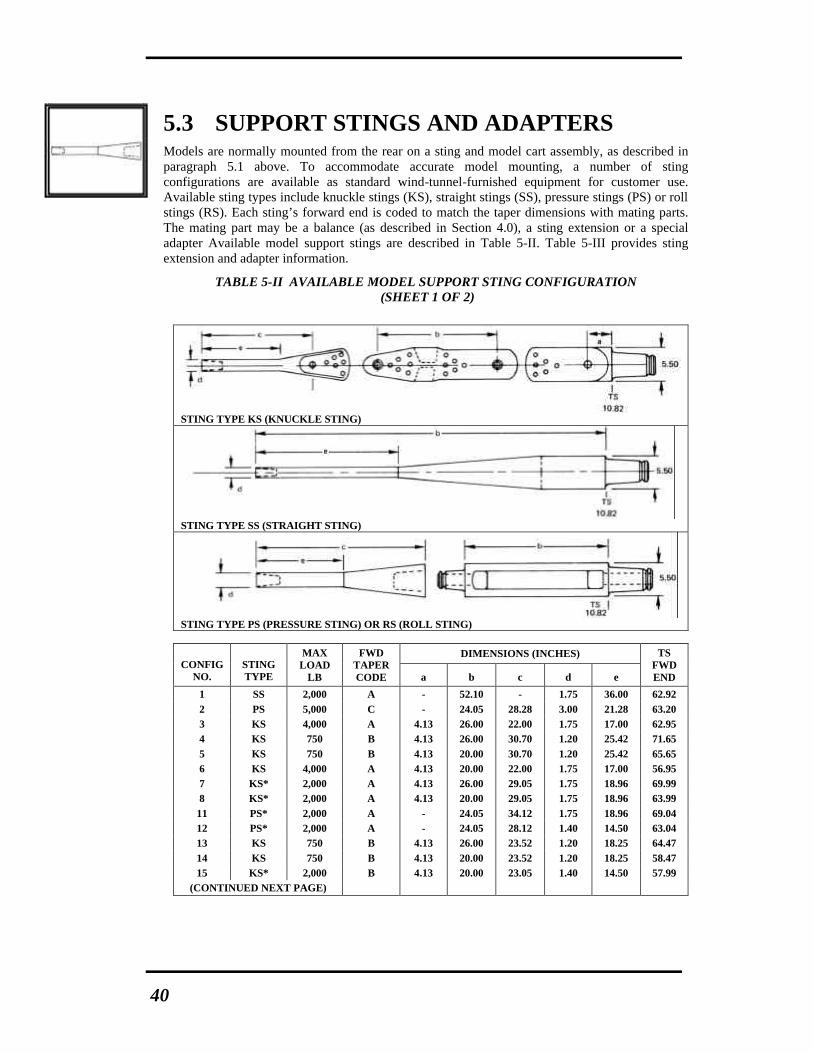
5.3 SUPPORT STINGS AND ADAPTERS Models are normally mounted from the rear on a sting and model cart assembly, as described in paragraph 5.1 above. To accommodate accurate model mounting, a number of sting configurations are available as standard wind-tunnel-furnished equipment for customer use. Available sting types include knuckle stings (KS), straight stings (SS), pressure stings (PS) or roll stings (RS). Each sting’s forward end is coded to match the taper dimensions with mating parts. The mating part may be a balance (as described in Section 4.0), a sting extension or a special adapter Available model support stings are described in Table 5-II. Table 5-III provides sting extension and adapter information.
TABLE 5-II AVAILABLE MODEL SUPPORT STING CONFIGURATION (SHEET 1 OF 2)
STING TYPE KS (KNUCKLE STING)
STING TYPE SS (STRAIGHT STING)
STING TYPE PS (PRESSURE STING) OR RS (ROLL STING)
DIMENSIONS (INCHES) CONFIG
NO. STING TYPE
MAX LOAD
LB
FWD TAPER CODE a b c d e
TS FWD END
1 SS 2,000 A - 52.10 - 1.75 36.00 62.92 2 PS 5,000 C - 24.05 28.28 3.00 21.28 63.20 3 KS 4,000 A 4.13 26.00 22.00 1.75 17.00 62.95 4 KS 750 B 4.13 26.00 30.70 1.20 25.42 71.65 5 KS 750 B 4.13 20.00 30.70 1.20 25.42 65.65 6 KS 4,000 A 4.13 20.00 22.00 1.75 17.00 56.95 7 KS* 2,000 A 4.13 26.00 29.05 1.75 18.96 69.99 8 KS* 2,000 A 4.13 20.00 29.05 1.75 18.96 63.99
11 PS* 2,000 A - 24.05 34.12 1.75 18.96 69.04 12 PS* 2,000 A - 24.05 28.12 1.40 14.50 63.04 13 KS 750 B 4.13 26.00 23.52 1.20 18.25 64.47 14 KS 750 B 4.13 20.00 23.52 1.20 18.25 58.47 15 KS* 2,000 B 4.13 20.00 23.05 1.40 14.50 57.99
(CONTINUED NEXT PAGE)

41
TABLE 5-II AVAILABLE MODEL SUPPORT STING CONFIGURATION (SHEET 2 OF 2)
DIMENSIONS (INCHES) CONFIG
NO. STING TYPE
MAX LOAD
LB
FWD TAPER CODE a b c d e
TS FWD END
16 KS* 2,000 B 4.13 26.00 23.05 1.40 14.50 63.99
17 PS 2,000 A - 24.05 31.88 1.60 21.75 66.80
18 PS* 1,500 A - 24.05 34.12 1.50 18.00 69.04
19 KS* 1,500 A 4.13 26.00 29.05 1.50 18.00 69.99
20 KS* 1,500 A 4.13 20.00 29.05 1.50 18.00 63.99
21 KS 3,380 A 4.13 26.00 29.83 1.50 23.67 70.77
22 KS 3,380 A 4.13 20.00 29.83 1.50 23.67 64.77
23 SS 1,000 THREADED - 32.14 - 3.00 4.41 43.06
24 SS 2,000 THREADED - 20.76 - 3.92 0 31.58
25 SS 1,000 A - 67.26 - 2.00 3.75 78.08
26 SS 1,700 B - 55.60 - 1.20 10.50 66.42
27 SS 3,100 THREADED - 52.68 - 2.50 25.50 63.50
28 PS 1,200 B - 24.05 36.30 1.40 18.00 71.22
29 KS 1,200 B 4.13 26.00 31.77 1.40 18.00 72.05
30 KS 1,200 B 4.13 20.00 31.77 1.40 18.00 66.05
31-35 SPECIAL SWEPT-BACK SIDE SUPPORT STINGS
36 PS 300 D - 24.05 35.00 0.96 18.96 69.92
37 KS 300 D 4.13 26.00 29.71 0.96 18.96 71.10
38 KS 300 D 4.13 20.00 29.71 0.96 18.96 65.10
39 KS 1,500 B 4.13 26.00 25.06 1.28 18.05 66.00
40 KS 1,500 B 4.13 20.00 25.06 1.28 18.05 60.00
41 KS 2,500 A 4.13 26.00 30.46 1.60 20.40 71.40
42 KS 2,500 A 4.13 20.00 30.46 1.60 20.40 65.40
43 KS 2,000 SPECIAL 4.13 26.00 33.83 - 19.00 74.77
44 KS 2,000 SPECIAL 4.13 20.00 33.83 - 19.00 68.77
45 KS 3,000 A 4.13 26.00 33.10 1.85 22.15 74.05
46 KS 3,000 A 4.13 20.00 33.10 1.85 22.15 68.05
47 PS 3,000 A - 24.05 38.17 1.85 22.15 73.04
49 KS 2,500 A 4.13 26.00 30.46 1.50 19.00 71.40
50 KS 2,500 A 4.13 20.00 30.46 1.50 19.00 65.40
53 RS 2,500 A - 22.40 32.00 1.50 19.50 65.30
54 RS 2,500 A - 22.40 34.70 1.50 25.50 68.06
55 RS 1,500 B - 22.40 33.10 1.20 23.90 66.50
NOTES: (1) Details of aft sting configurations are in reference “1”. (2) Stings noted by (*) can be manually rolled at a sting junction. (3) FWD end taper code match codes in Tables IV and VI. (4) All PS designations also apply to the remotely rolled sting but dimension “b” is decreased by 1.80 inches. (5) Sting inventory is continuously increasing; check with laboratory for additional configurations.
42
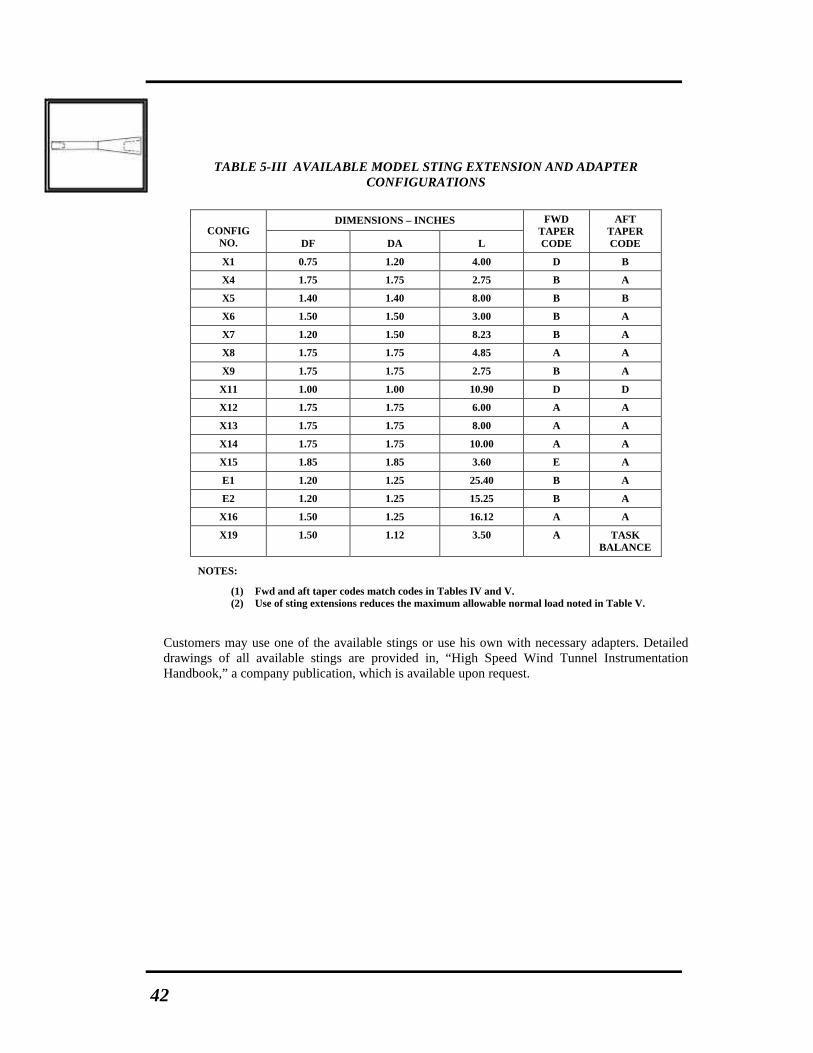
TABLE 5-III AVAILABLE MODEL STING EXTENSION AND ADAPTER CONFIGURATIONS
DIMENSIONS – INCHES CONFIG
NO. DF DA L
FWD TAPER CODE
AFT TAPER CODE
X1 0.75 1.20 4.00 D B
X4 1.75 1.75 2.75 B A
X5 1.40 1.40 8.00 B B
X6 1.50 1.50 3.00 B A
X7 1.20 1.50 8.23 B A
X8 1.75 1.75 4.85 A A
X9 1.75 1.75 2.75 B A
X11 1.00 1.00 10.90 D D
X12 1.75 1.75 6.00 A A
X13 1.75 1.75 8.00 A A
X14 1.75 1.75 10.00 A A
X15 1.85 1.85 3.60 E A
E1 1.20 1.25 25.40 B A
E2 1.20 1.25 15.25 B A
X16 1.50 1.25 16.12 A A
X19 1.50 1.12 3.50 A TASK BALANCE
NOTES:
(1) Fwd and aft taper codes match codes in Tables IV and V. (2) Use of sting extensions reduces the maximum allowable normal load noted in Table V.
Customers may use one of the available stings or use his own with necessary adapters. Detailed
drawings of all available stings are provided in, “High Speed Wind Tunnel Instrumentation Handbook,” a company publication, which is available upon request.
43
6.0 SPECIAL TEST SYSTEMS AND TECHNIQUES
In addition to basic force and pressure test capabilities, the High Speed Wind Tunnel group has accumulated considerable experience in a number of testing specialties. Descriptions of the special hardware and techniques offered are provided in the paragraphs which follow.
6.1 INLET AND PROPULSION TESTS Inlet and propulsion tests can be conducted using a computer-controlled inlet test system which is capable of controlling the mass flow throttle plug position and angle-of-attack sequencing. The system can also record up to 256 channels of individual pressure transducers, temperatures, or other instrumentation devices.
Up to 99 combinations of throttle plug position and angle of attack can be programmed for any run. A typical run may use all or only a portion of this capability. An example of setup combinations might be 15 discrete throttle plug settings at each of five angles of attack for a total of 75 data points. A manually initiated abort procedure can be used in the event of buzz or other occurrence for which data is not required. The plug sequence can subsequently be reset to move the model’s pitch to the next angle of attack or returned to zero to terminate the run.
In addition to computer control of throttle plug position and angle of attack, one additional servo-controlled function, two on-off controls, a camera and Scanivalve controls are available in the computer program. Time on point, data sampling rate, number of data points, and throttle plug and angle-of-attack rates of change are all selectable as desired for each test.
Several inlet and throttle plug-mounting systems are available. The customer may adapt his configuration to these or may furnish a complete system adaptable to the tunnel pitch cart. Each system has been calibrated using ASME sharp-edge orifice meters in the wind tunnel high-pressure test facility.
The primary system used is the 9.2-inch throttle plug-inlet support assembly, shown in Figures 6-
1 and 6-2. The Air Flow Parameter
=
•
Tpw
AFP range using the basic flow plug is from
0.3 to 7.8, or from 7.9 to 22 using an alternate plug. The pitch range of the assembly is from -10 to +15 degrees. Customer-supplied adapters may be added to increase the pitch range or to provide fixed yaw angle.

44
Figure 6-1 Inlet Support Assembly and Installation Photo
Figure 6-2 Inlet Support Attachment Flange

45
6.2 FLIGHT DYNAMICS SIMULATOR The flight dynamics simulator, shown in Figure 6-4, has been developed to provide solutions to problems involving aerodynamic interactions between a parent vehicle and separating stores.
Aerodynamic forces and moments measured by the store balance are processed by the digital computer. The computer commands the model support to move the store in response to these forces and moments. Dynamic stability derivatives, ejection forces, variable model mass, static and variable moments of inertia, altitude, and gravity terms are included in the equations of motion. Special simulation parameters requested by a customer can be included if sufficient lead-time for programming is permitted.
Components of the system form a closed loop starting with store-model balance signals, as shown in Figure 6-3. The signals are digitized and processed to obtain non-dimensional aerodynamic coefficients to be used in the complete equations of motion. Solutions of the equations of motion result in body axes linear and angular accelerations from which linear and angular positions may be obtained by double integration and axes transformation. Sting positions are then converted from digital to analog voltages and sent as command signals to each servo linkage of the model support.
Figure 6-3. Servo Control Flow Diagram

46
New command signals are generated 25 times each second, resulting in a smooth, continuous, time-scaled store separation. Time scales can be selected depending on the speed of separation. A 30-second run, for example, will yield a complete time history of all the angular and linear velocities and displacements equivalent to 1 second of real time.
The two-part model support system comprises six independent hydraulic servos, shown in Figure 6-4. The parent model actuator attaches to the ceiling of the tunnel and provides an axial displacement of 36 inches. The remaining five actuators are located in the store support mechanism. All six motions are controlled simultaneously, and any degree of freedom may be changed independently of the others. Translation boundary limits, which are programmed in the computer, protect the store against movement into the tunnel sidewalls.
Figure 6-4 Flight Dynamics Simulator Components

47
Positioning errors under no-load and maximum driving rates will not exceed ±0.02 inch on linear displacements and ±0.05° on angular displacements. Linear and angular driving rate and load limits are as follows:
Store Model Rate Load Range Pitch and yaw 10 deg/sec 500 lb ±22-1/2°* Roll 20 deg/sec 84 in.-lb ±170° Axial 600 lb Vertical 0.22 ft/sec 1500 lb 14 in. Lateral 0.22 ft/sec 500 lb ±14 in.
*Range can be changed up to 0-45° by clevis change
Parent Model Axial 0.33 ft/sec 1000 lb 36 in. Pitch angle – Fixed Increments Nom ±10°
6.3 DYNAMIC STABILITY A free-oscillation dynamic-stability rig has been developed using a ball-bearing support and a torsion flexure. Hydraulically operated deflect and pinlock mechanisms permit release from deflect angles of 0° to 10°. Interchangeable torsion spring elements vary the mechanical restoring moment from almost 0 to over 60 ft-lb/rad.
Dynamic and static stability derivatives about the center of rotation can be obtained as a function of oscillation amplitude. Nonlinear tare damping effects can also be obtained using a free-oscillation data reduction program.
6.4 SPIN AND MAGNUS TESTING The steady rolling velocity which an aerodynamic body will attain in free flight may be determined by static force and free-spin testing. The rolling moment produced by various deflections of the roll control surfaces of an aerodynamic model restrained in roll can be obtained in static force tests. By allowing the model to spin freely about its longitudinal axis, the rolling moment due to roll velocity (roll damping) may be obtained. Side force increments due to roll velocities (magnus effect) may be determined by forcing the model spin rate above the steady-state value and measuring these effects as the model coasts back to steady-state roll conditions. A six component internal balance is usually used to support the model. The support system consists of a bearing mount to allow free rotation of the model about the longitudinal axis. A motorized unlocking device may be used to permit tunnel flow establishment before the model is released to spin. The angular velocity of the model can be precisely measured by a digital frequency counter which counts directly the impulses from a tachometer system (Figure 6-5) mounted in the model. An air turbine built into the model can provide spin rates higher than steady-state rates. Figure 6-6 shows a typical spin model roll mechanism assembly. Three bearing mount systems are available. Wind tunnel personnel can determine which system best suits a customer’s requirements.

48
Figure 6-5 Photoelectric Tachometer System
Figure 6-6 Typical Model and Roll Mechanism Assembly

49
6.5 INSTRUMENTED STORES TESTING The relatively small scale of models tested in the High Speed Wind Tunnel results in minimal space available for store force-measuring systems. Specialized instruments have been developed to measure the aerodynamic forces on aircraft individual stores or groups of stores. Miniature five-component balances with quick-disconnect features are available for individual store loads testing. The balances are interchangeable, and the store/balance assemblies can be readily added to or removed from multiple stores carriage systems. Pylon balances to measure total loads on groups of stores have been designed and tested on particular aircraft models. Multiple fouling indicator circuits are available to monitor each store or pylon balance for model-to-model or model-to-balance grounding.
Improved design, calibration and operational techniques have been developed through experience gained while testing aircraft multiple-carriage stores systems. Figure 6-7 shows a typical installation in which as many as 6 store balances (30 components) and 3 pylon balances (13 components) were tested simultaneously.
Figure 6-7 Typical Metric Stores Installation

50
6.6 FLOW VISUALIZATION Techniques that use visual aids to obtain a qualitative understanding of flow phenomena have been used extensively. Among the more commonly used visual aids are shadowgraph, fluorescent oil, pigmented oil and sublimation techniques.
Shadowgraphs are normally recorded live on a VHS Videotape recorder for the entire run. A high-intensity mercury Xenon light source is directed through the test section’s optical-quality glass windows onto an opaque Mylar sheet. Shadowgraphs in the transonic section are taken through solid Plexiglas windows, which replace the perforated windows normally used. A high quality digital camera can also be used simultaneously to obtain still shots of the shadowgraph. Typical shadowgraphs are shown in Figure 6-8.
Figure 6-8 Typical Shadowgraphs
51
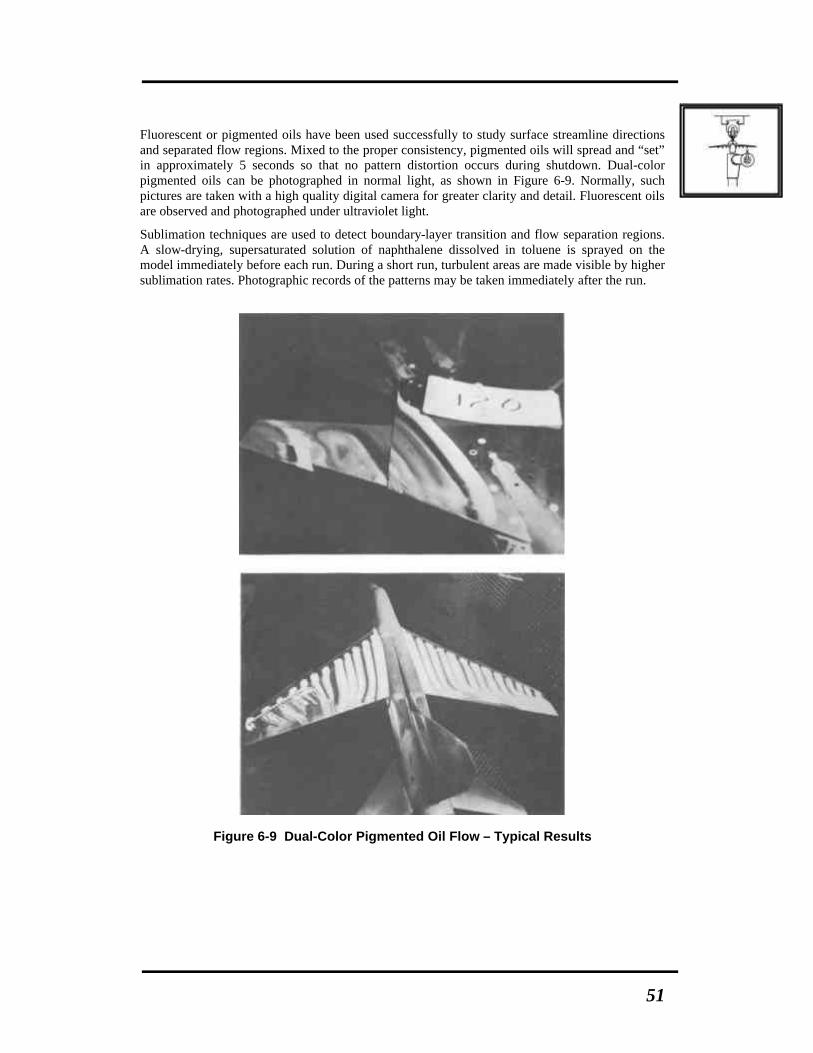
Fluorescent or pigmented oils have been used successfully to study surface streamline directions and separated flow regions. Mixed to the proper consistency, pigmented oils will spread and “set” in approximately 5 seconds so that no pattern distortion occurs during shutdown. Dual-color pigmented oils can be photographed in normal light, as shown in Figure 6-9. Normally, such pictures are taken with a high quality digital camera for greater clarity and detail. Fluorescent oils are observed and photographed under ultraviolet light.
Sublimation techniques are used to detect boundary-layer transition and flow separation regions. A slow-drying, supersaturated solution of naphthalene dissolved in toluene is sprayed on the model immediately before each run. During a short run, turbulent areas are made visible by higher sublimation rates. Photographic records of the patterns may be taken immediately after the run.
Figure 6-9 Dual-Color Pigmented Oil Flow – Typical Results

52
6.7 BENCH TEST FACILITY A compressed-air static test facility is available as a supply source for a variety of tests in the tunnel and for inlet, duct, and cascade bench tests outside the tunnel. Compressed air can be provided from either the compressor discharge or from the main storage tanks. Automatic temperature control from 70°F to 200°F can be obtained using hot and cold mixing from the compressor discharge. Flow meters and control valves regulate air supply at the air line exits. Supply-line and orifice-meter sizes can be selected to obtain flow rates up to 60 pounds per second with 500 psia supply pressure.
6.8 HIGH-PRESSURE NITROGEN GAS FACILITY
A high-pressure nitrogen gas supply system has been added to the HSWT. The system is able to provide nitrogen gas at a pressure up to 5000 psi at a flow rate of 15 pounds per second. Currently, the gas can be supplied to a wind tunnel model via a flow-through balance mounted on a sting with remote roll capability. The present system configuration allows for up to four pressure settings per run while the model is remotely pitched or rolled.
Advanced technology missiles are utilizing transverse flow jet thrusters as a primary control system or to augment the missiles aerodynamic surface control system. Even though a significant amount of data concerning the effectiveness of transverse jets has been published, highly nonlinear force and moment variations due to transverse jet flow interactions require the investigator to rely on experimentally obtained data.
Figure 6-10 High Pressure Nitrogen Gas Facility

53
6.9 ADDITIONAL TEST SUPPORT EQUIPMENT
The following is a partial list of test support equipment available at the High Speed Wind Tunnel. Equipment described in detail elsewhere may not be included here.
• Spin Physics high-speed video recorder system – full screen to 2,000 frames/sec; up to 1,000 frames/sec with split screen; 2 cameras available.
• IOtech 16-channel high speed digital data system
• Hewlett Packard 3852-A Spectrum Analyzer
• Austron 8152 timecode generator-recorder IR16 A, B
• Astro Med MT 95000, 16 channel chart recorder
• Astro Med DASH 8, 8 channel portable chart recorder
• Hyscan electronic pressure scanner
• Cameras, still – 35 mm single-lens reflex and a high quality digital camera
• VHS Recorder and Camera (Panasonic #3250)
• Pressure standard – Ruska 6200 Pressure Gage
• Clinometer – Hilger-Watts 360° (±0.5’), ±90° (±0.5’)
• Electronic equipment – oscilloscopes (3); oscillographs (6-inch and 12-inch); digital voltmeters (2); signal generators (3); electronic counter; RMS voltmeter, sensitive research AC-DC Polyranger
• Power supplies – 0 to 250 volts dc 3 amp; 0 to 43 volts dc 4 amp (4); 0 to 20 volts 1.5 amp Dual complimentary (2); 0 to 48 volts dc 8 amp (3); 12 volts dc; 0 to 40 volts 300 amp; 115 volts 400 cycle
• Power machine tools – engine lathes (14-inch and 11-inch); band saw; drill press; surface grinder; universal mill; sander; Digital 3-axis LAGUN milling machine
• Surface table – 3 by 6 feet
• Vacuum pumps – Four available
• Reproduction machines – copier that accommodates originals up to 11 by 17 inches
• Fluid flow meters – orifice type (5)
• Thermocouple reference junction (2) – 1500; iron, Chromel, copper, Constantan, and Alumel connections
• Static Flow Facility data acquisition system

54
7.0 MODEL DESIGN CONSIDERATIONS
The following guides may be used in the design of models to be tested in the High Speed Wind Tunnel. Since testing of a model is normally at the risk of the customer, exceptions may be made at the customer’s discretion. The wind tunnel staff is available for consultation involving any phase of the wind tunnel program.
7.1 GENERAL DESIGN CONSIDERATIONS • Model weight should be kept low to minimize dynamic effects.
• Aluminum models should be anodized to obtain a hard surface for abrasion resistance.
• All models should incorporate some means for alignment in roll and pitch.
• Complex model designs should be avoided to minimize lost time during model changes.
• Pressure and electrical leads should be routed to provide convenient accessibility when the model is mounted in the tunnel.
7.2 MODEL SIZE In general, model cross-sectional area at any station should be limited to approximately 23 square inches (1% of test section area). This limit is imposed by transonic testing considerations and may be relaxed for supersonic testing. Figure 7-1 presents maximum allowable blockage areas as a function of supersonic Mach number. In addition to frontal area limits during transonic tests, model span and length limits of 30 and 50 inches, respectively, are needed to minimize wall interference effects.
7.3 MODEL PLACEMENT Under certain conditions of transonic operation, the centerline Mach number can vary downstream of station 51 (aft window centerline). For this reason it is recommended that the model base be positioned no farther downstream than station 56 for any transonic test. (See Figure 3-3 for identification of station number). It is also recommended that the model nose extend no further forward than tunnel station 102 (102) to keep the model in acceptable flow conditions in both the transonic and supersonic test sections.

55
Figure 7-1 Allowable Model Frontal Area as a Function of Mach Number
and Drag Coefficient

56
Figure 7-2 Modified Normal-Shock Method of Evaluating Maximum Starting Loads

57
7.4 PRESSURE AND INTERNAL
FLOW MODELS
Model pressures are normally measured using individual pressure transducers or a modular pressure scanning system (Scanivalve ZOC) located in the model or mounted downstream on the model support sting. Details of the Scanivalve system were presented in a previous section.
All pressure orifices should be flush with the surface, without burrs, and not less than 0.040 inch in diameter. Pressure tubing should be 1/16 or 1/24 inch o.d. quarter hard stainless steel, and long enough to reach the transducer or Scanivalve. Connections are usually made with short lengths of plastic tubing.
7.5 STATIC STABILITY FORCE MODEL DESIGN CONSIDERATIONS
Static stability models will normally be mounted on a wind-tunnel-furnished sting/balance combination. Model installation hardware will be selected based on the maximum forces and moments expected, space limitations of the model balance cavity, and model placement considerations in the test section.
A model-to-balance adapter is normally supplied by the customer to adapt the model to a wind tunnel balance. Construction of an adapter may be accomplished by the High Speed Wind Tunnel on a time-and-materials basis, if desired. Ring and plug gages are available from the wind tunnel for use in fabricating such an adapter.
If possible, the adapter should be constructed so that the balance center is approximately at the same location as the midpoint of the center-of-pressure range.
Base pressure corrections are normally made from pressure measurements taken inside the balance cavity and/or from a pressure manifold located at the model base. Pressure measurements on the model are possible during a force test for a limited number of pressures if pressure tubing is installed without interference with force measurements.
Measurement of model control surface hinge moments, wing root bending etc., during a force test can normally be done if the gages or lead wires are accessible for instrumentation hookup. When necessary, a fouling circuit can be provided to indicate when contact is made between model and sting.

58
7.6 STARTING LOADS AND FACTORS OF SAFETY
Tunnel starting and stopping loads during supersonic operation may be the highest loads to which wind tunnel models are subjected. Figure 7-2 presents the modified normal-shock method of determining maximum starting load coefficients at various Mach numbers. This method assumes that supersonic flow could be established on one side of a model and subsonic flow behind a normal shock could exist on the other side, resulting in a large normal load. The normal-shock method, which assumes an infinite-aspect-ratio, thin-flat-plate model, is inconsistent with the flow field about a body of revolution during a tunnel start. Cross flow would reduce the pressure difference, resulting in reduced starting loads. The modified normal-shock method predicts more reasonable loads at lower Mach numbers and takes into account the ratio of the lifting surface area to the total planform area.
A model design safety factor of 5, based on nominal starting or maximum running loads, is recommended wherever possible. Under no circumstance should the safety factor be less than 1.5 based on yield strength.

59
8.0 TEST PLANNING AND SCHEDULING
8.1 TEST SCHEDULING Telephone contact should be made with the Manager of the High Speed Wind Tunnel early in the design phase of the program to insure compatibility of model size, balances, and support hardware. When the anticipated test date is known, the High Speed Wind Tunnel manager can tentatively schedule a test. Test dates are confirmed by the issuance of a Purchase Order.
A Request for Quote (RFQ) or Request for Proposal (RFP) should be sent to the Contracts Representative as soon as definite program requirements are known. Prior to sending an RFQ, contact should be made with the wind tunnel subcontracts coordinator at (972) 946-3234 to obtain the name, mailing address and telephone number of the current Contracts Representative, and to alert the wind tunnel that an RFQ will be forthcoming.
The Request for Quote or Request for Proposal document should contain as much of the following information as is available:
a. Names and phone numbers of contractual and technical representatives b. Anticipated test date c. Purpose, scope, and classification of test program d. Description of model including dimensional details, installation sketches, and configuration
nomenclature e. Balance requirements f. Test requirements (a run matrix or schedule) g. Test conditions required (Mach numbers, angle-of-attack ranges, angle of yaw ranges,
dynamic pressure, etc.) h. Tunnel mounting hardware requirements. What will be customer furnished and what should
be furnished by the wind tunnel i. Special equipment requirements (photographic coverage, model fouling indicators, pressure
instrumentation, auxiliary air, auxiliary electrical power, auxiliary hydraulic power, etc.) j. Data to be recorded during test (force, lift, drag, pitching moment, pressure, tunnel operating
conditions, etc.). Plot requirements while test is in progress (components most desired for “quick look” situation, sample plotting scales).
k. Data presentation requirements (components to be tabulated and order of tabulation desired, data report plots, components desired showing sample scale and axes arrangements, model reference areas and lengths, moment reference positions, definition of aerodynamic coefficients i.e. CN = N/qS body axes, and others)
l. Shipping instructions for return of the model and other equipment m. Specific contractual requirements and information.

60
A Letter Quote or Proposal will be provided. (Dates for testing cannot be guaranteed until a purchase order is in place).
After contract award and not less than two weeks prior to test date, a Pre-test document should be provided to the Manager of the High Speed Wind Tunnel containing an up-to-date Statement of Work detailing the information listed in paragraph 3 above.
8.2 MODEL DELIVERY INFORMATION Models should be received by the wind tunnel at least 2 weeks prior to the scheduled starting test date. When special instrumentation or calibration is necessary, additional lead-time should be allowed.
The following instructions are presented for shipment of models, test support equipment, materials, etc., to the facility.
1. Address models and other bulk materials to:
High Speed Wind Tunnel Lockheed Martin Missiles and Fire Control 1701 W. Marshall Grand Prairie, Texas 75051 Attn: Manager, HSWT, (972) 946-2751, PDQ
2. Two copies of a packing list containing a detailed description of each item should be enclosed with the shipment. Classified models are to be shipped in accordance with proper security directives.
3. The Manager, High Speed Wind Tunnel, or Test Operations Engineer should be notified via fax (972/946-5466) of the date and time of shipment, waybill number, mode of transportation and carrier, and the estimated time of arrival. This notification is mandatory if the shipment is classified.
4. Postal correspondence should be addressed to:
High Speed Wind Tunnel P. O. Box 531046 Grand Prairie, Texas 75053-1046
5. Freight charges are to be prepaid when shipping on a commercial bill of lading.
6. Instructions for the return of all materials should accompany the shipment. The following information should be provided:
a. Mode of transportation
b. Return address
c. Ship to whose attention
d. Amount of insurance required.
7. All return shipments will be collect unless prior funding arrangements are made.
61
APPENDIX A Visitor Information
An area map showing the location of the HSWT and some local hotels and motels is presented in Figure A-1.
A Park Inn Suites 700 Ave H East Arlington, TX 76011 Reservations: 1-800 670-7275 PH: 817-640-0440
D Hilton Arlington 2401 E. Lamar Blvd. Arlington, TX 76006 Reservations: 1-800-445-8667 PH: 817-640-3322
B Hawthorn Suites Hotel - Arlington 2401 Brookhollow Plaza Dr. Arlington, TX 76006 PH: 817-640-1188
E Candlewood Suites 2221 Brookhollow Plaza Dr. Arlington, TX 76006 PH: 817-647-3336
C Residence Inn by Marriott - Arlington 1059 Brookhollow Plaza Dr. Arlington, TX 76006 Reservations: 1-800-445-8667 PH: 817-649-7300
F La Quinta Inn 1410 NW 19th St. Grand Prairie, TX 75050 Reservations: 1-800-687-6667 PH: 972-641-3021
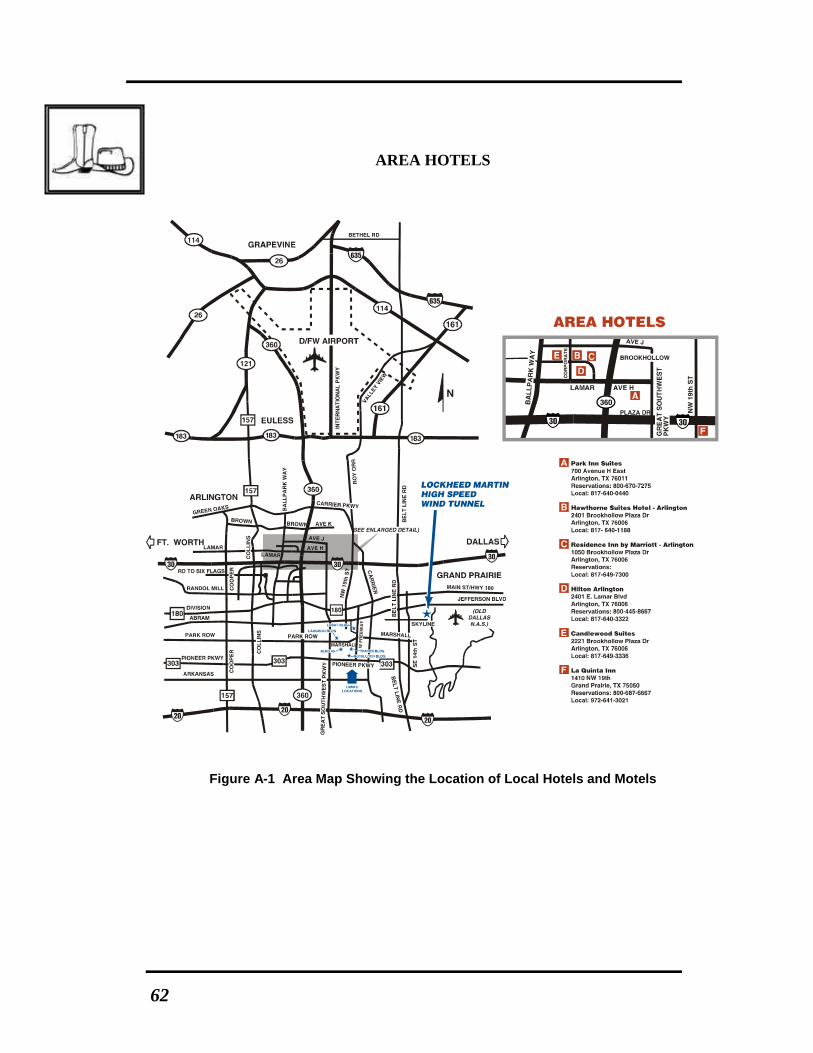
62
AREA HOTELS
Figure A-1 Area Map Showing the Location of Local Hotels and Motels

63
Figure A-2 Map Showing the Location of Lockheed Martin High Speed Wind Tunnel
64
APPENDIX B Technical References
1. Ziegler, C.E., “High Speed Wind Tunnel Instrumentation Handbook,” LTV Report
2-59710/3R-50929, Nov. 1973, Revised September 1976.
2. Baker, T.M., “Tables of Mach Functions,” LTV Report 2-59710/4R-50225, December 1964.
3. Simon, E.H., “Mach Number Calibration Tests of the CVC High Speed Wind Tunnel,” LTV Report AER-E1R-13493, June 1961.
4. Fletchtner, J.A., “Mach Number Calibration Tests of the LTV High Speed Wind Tunnel Transonic Test Section,” HSWT TEST C-63-3, May 1964.
5. Baker, T.M., “Data Acquisition, Reduction, and Presentation for Typical Force Tests at the LTV High Speed Wind Tunnel,” LTV Report 2-59710/OR-50732, July 1970.
6. Czysz, P.A., “Correlation of Wind Tunnel Blockage Data,” ASD-TDR-63333333230, April 1963.
7. Maydew, R.C., “Compilation and Correlation of Model Starting Loads from Several Supersonic Wind Tunnels,” SC-4691 (RR), June 1962.