High-Speed Reclosing, Switching Surges, and Bus...
13
High-Speed Reclosing, Switching Surges, and Bus Differential Protection Security – A Case Study Jeff Iler, American Electric Power Ryan McDaniel, Schweitzer Engineering Laboratories, Inc. Abstract—During an ice storm with high winds, a dual-circuit 345 kV transmission line owned and operated by American Electric Power (AEP) tripped correctly for galloping conductors. On the subsequent high-speed reclose, a high-impedance bus differential relay located over 50 miles from the reclosing breaker operated. Analysis of time-aligned and high-resolution event data from multiple locations on the system helped determine that the reason for the differential operation was a transformer surge arrester operation. In this case, there was a trapped charge on the line that operated and the high-speed reclose occurred at just the right moment to lead to a large transient overvoltage on the system. In this paper, we use high-resolution event data to discuss switching surges caused by high-speed reclosing on high-voltage lines and their impact on bus differential relays. We show that without high-resolution data, the root cause of this event would have been very difficult to determine. In fact, higher sampling rates would have aided in the analysis of the event and helped show the propagation of the switching surge in the adjacent line. We discuss enhancements to maintain security during a surge arrester operation for both low-impedance and high-impedance differential relays. Some of the enhancements discussed are internal to the relay designs, while others require the relay user to implement custom logic. An overview of line capacitance and its effects on switching surges is covered. AEP is a pioneer in detailing switching surges in high-voltage systems and has published a wealth of information on the topic. This paper provides a brief history of AEP’s work in this field and applies previous research to this event. I. INTRODUCTION From January 25–30, 2009, a major ice storm affected part of the Central Plains and Midwestern United States. Days of freezing rain led to heavy ice accumulation of 1 to 2” in areas of Arkansas and Kentucky. At the height of the storm, 1.3 million residents were left without power in multiple states, with Kentucky setting a state record for outages at nearly 700,000 [1]. While heavy ice accumulated along the Ohio River Valley, heavy snowfall occurred farther north. Cities in northern Ohio, including Toledo and Cleveland, saw over 10” of snow [2]. A significant portion of American Electric Power (AEP) Ohio’s service territory was affected, including a 345 kV double-circuit line between Muskingum River and West Millersport substations, located in eastern Ohio. These two substations were wedged between heavy snowfall to the north and significant ice accumulation to the south. Ice accumulation from the storm led to an interesting sequence of events that ultimately triggered a surge arrester operation, which in turn led to a high-impedance bus differential operation that undesirably cleared a bus at West Millersport. Analysis of event reports and simulation data helped determine root cause of the surge arrester operation and the high-impedance differential operation. II. SYSTEM OVERVIEW AEP is an investor-owned utility with approximately 40,000 transmission circuit miles in portions of 11 states and a service territory of approximately 200,000 square miles. AEP’s transmission network includes more than 2,100 miles of 765 kV transmission lines; 8,300 miles of 345 kV lines; 18,000 miles of 138 kV lines; and tens of thousands of miles of lines that transmit less than 138 kV. Within Ohio, AEP has approximately 1,300 circuit miles of 345 kV lines and twenty-seven 345 kV substations. The first 345 kV line in Ohio was built in 1953. More than 600 miles of 345 kV lines were built in the 1950s, with an additional 300 miles of the same added in the 1960s and another 300 miles added in the 1970s. Muskingum River and West Millersport are 345 kV substations in Ohio that are connected by a 54-mile long double-circuit line. The West Millersport substation was constructed in 1972 and cut into the Muskingum River- East Lima line built in 1956. Both substations have a breaker-and-a-half configuration. At the time of the event, the Muskingum River substation had six 345 kV line exits, a 345/138 kV transformer, and 1,280 MW of generation. The 345 kV circuit breakers at Muskingum River are SF6-type breakers. The West Millersport substation has four 345 kV line exits and two 345/138 kV transformers. Transformer 1 is connected to 345 kV Bus 1. In 2009, Muskingum River Line 2 at West Millersport substation was terminated by one SF6 circuit breaker and one air blast circuit breaker. The air blast breaker was installed in 1972 when the station was built. This air blast breaker has since been replaced. Muskingum River-West Millersport 345 kV Line 2 is protected by dual intelligent electronic devices (IEDs) that use
Transcript of High-Speed Reclosing, Switching Surges, and Bus...

High-Speed Reclosing, Switching Surges, and Bus Differential Protection Security – A Case Study
Jeff Iler, American Electric Power Ryan McDaniel, Schweitzer Engineering Laboratories, Inc.
Abstract—During an ice storm with high winds, a dual-circuit 345 kV transmission line owned and operated by American Electric Power (AEP) tripped correctly for galloping conductors. On the subsequent high-speed reclose, a high-impedance bus differential relay located over 50 miles from the reclosing breaker operated. Analysis of time-aligned and high-resolution event data from multiple locations on the system helped determine that the reason for the differential operation was a transformer surge arrester operation. In this case, there was a trapped charge on the line that operated and the high-speed reclose occurred at just the right moment to lead to a large transient overvoltage on the system.
In this paper, we use high-resolution event data to discuss switching surges caused by high-speed reclosing on high-voltage lines and their impact on bus differential relays. We show that without high-resolution data, the root cause of this event would have been very difficult to determine. In fact, higher sampling rates would have aided in the analysis of the event and helped show the propagation of the switching surge in the adjacent line.
We discuss enhancements to maintain security during a surge arrester operation for both low-impedance and high-impedance differential relays. Some of the enhancements discussed are internal to the relay designs, while others require the relay user to implement custom logic.
An overview of line capacitance and its effects on switching surges is covered. AEP is a pioneer in detailing switching surges in high-voltage systems and has published a wealth of information on the topic. This paper provides a brief history of AEP’s work in this field and applies previous research to this event.
I. INTRODUCTION From January 25–30, 2009, a major ice storm affected part
of the Central Plains and Midwestern United States. Days of freezing rain led to heavy ice accumulation of 1 to 2” in areas of Arkansas and Kentucky. At the height of the storm, 1.3 million residents were left without power in multiple states, with Kentucky setting a state record for outages at nearly 700,000 [1]. While heavy ice accumulated along the Ohio River Valley, heavy snowfall occurred farther north. Cities in northern Ohio, including Toledo and Cleveland, saw over 10” of snow [2]. A significant portion of American Electric Power (AEP) Ohio’s service territory was affected, including a 345 kV double-circuit line between Muskingum River and West Millersport substations, located in eastern Ohio. These two substations were wedged between heavy
snowfall to the north and significant ice accumulation to the south. Ice accumulation from the storm led to an interesting sequence of events that ultimately triggered a surge arrester operation, which in turn led to a high-impedance bus differential operation that undesirably cleared a bus at West Millersport. Analysis of event reports and simulation data helped determine root cause of the surge arrester operation and the high-impedance differential operation.
II. SYSTEM OVERVIEW AEP is an investor-owned utility with approximately
40,000 transmission circuit miles in portions of 11 states and a service territory of approximately 200,000 square miles. AEP’s transmission network includes more than 2,100 miles of 765 kV transmission lines; 8,300 miles of 345 kV lines; 18,000 miles of 138 kV lines; and tens of thousands of miles of lines that transmit less than 138 kV.
Within Ohio, AEP has approximately 1,300 circuit miles of 345 kV lines and twenty-seven 345 kV substations. The first 345 kV line in Ohio was built in 1953. More than 600 miles of 345 kV lines were built in the 1950s, with an additional 300 miles of the same added in the 1960s and another 300 miles added in the 1970s.
Muskingum River and West Millersport are 345 kV substations in Ohio that are connected by a 54-mile long double-circuit line. The West Millersport substation was constructed in 1972 and cut into the Muskingum River-East Lima line built in 1956. Both substations have a breaker-and-a-half configuration.
At the time of the event, the Muskingum River substation had six 345 kV line exits, a 345/138 kV transformer, and 1,280 MW of generation. The 345 kV circuit breakers at Muskingum River are SF6-type breakers.
The West Millersport substation has four 345 kV line exits and two 345/138 kV transformers. Transformer 1 is connected to 345 kV Bus 1. In 2009, Muskingum River Line 2 at West Millersport substation was terminated by one SF6 circuit breaker and one air blast circuit breaker. The air blast breaker was installed in 1972 when the station was built. This air blast breaker has since been replaced.
Muskingum River-West Millersport 345 kV Line 2 is protected by dual intelligent electronic devices (IEDs) that use
a directional comparison blocking (DCB) scheme with step distance backup. There are three forward-looking phase-distance zones set in the relays. The zones are set at 85, 150, and 200 percent of the line impedance. The longest reaching zone is used in the DCB scheme. The DCB scheme uses negative-sequence voltage-polarized residual overcurrent elements for ground protection.
The 345 kV Bus 1 at West Millersport is protected by a modern high-impedance digital relay. Additionally, there is an overall transformer differential relay that protects Bus 1 and Transformer 1.
III. THE EVENT At 6:15 p.m. on January 28, 2009, near the end of the storm
in eastern Ohio, a Phase-A-to-Phase-B fault occurred on Muskingum River–West Millersport Line 2 about 6.75 miles from the West Millersport substation. This fault was likely created by a combination of ice on the power line and relatively high winds as the low-pressure system moved through the area. Under these conditions, conductors can begin to gallop.
Galloping conductors occur when the conductors are unevenly iced along the line and steady winds hit the altered conductor shape. The new shape of the conductor creates an aerodynamically unstable object, and it typically moves vertically at a frequency of 0.15 Hz to 1 Hz [3]. Under galloping conductor conditions, repetitive phase-to-phase faults are possible.
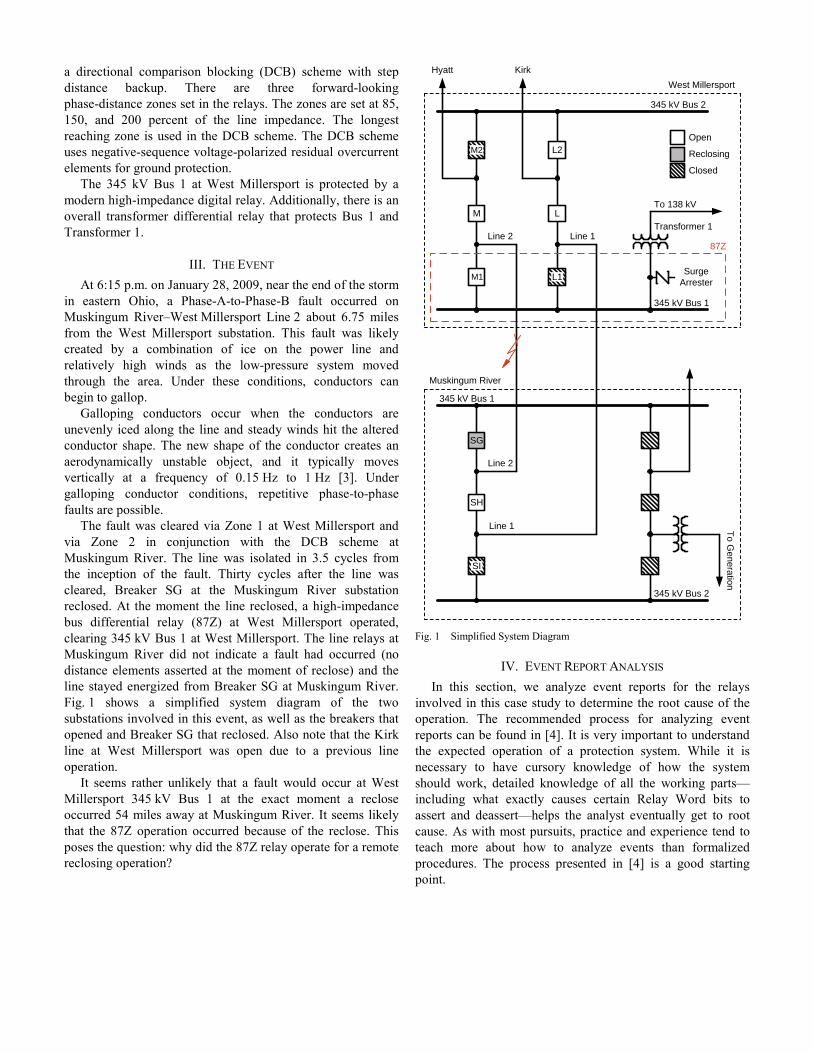
The fault was cleared via Zone 1 at West Millersport and via Zone 2 in conjunction with the DCB scheme at Muskingum River. The line was isolated in 3.5 cycles from the inception of the fault. Thirty cycles after the line was cleared, Breaker SG at the Muskingum River substation reclosed. At the moment the line reclosed, a high-impedance bus differential relay (87Z) at West Millersport operated, clearing 345 kV Bus 1 at West Millersport. The line relays at Muskingum River did not indicate a fault had occurred (no distance elements asserted at the moment of reclose) and the line stayed energized from Breaker SG at Muskingum River. Fig. 1 shows a simplified system diagram of the two substations involved in this event, as well as the breakers that opened and Breaker SG that reclosed. Also note that the Kirk line at West Millersport was open due to a previous line operation.
It seems rather unlikely that a fault would occur at West Millersport 345 kV Bus 1 at the exact moment a reclose occurred 54 miles away at Muskingum River. It seems likely that the 87Z operation occurred because of the reclose. This poses the question: why did the 87Z relay operate for a remote reclosing operation?
L2
M L
M1
SG
SH
Surge Arrester
Transformer 1
To Generation
345 kV Bus 2
345 kV Bus 1
Line 2 Line 1
Muskingum River
345 kV Bus 1
Line 2
Line 1
87Z
To 138 kV
345 kV Bus 2
Hyatt KirkWest Millersport
SI
L1
M2Open
Reclosing
Closed
Fig. 1 Simplified System Diagram
IV. EVENT REPORT ANALYSIS In this section, we analyze event reports for the relays
involved in this case study to determine the root cause of the operation. The recommended process for analyzing event reports can be found in [4]. It is very important to understand the expected operation of a protection system. While it is necessary to have cursory knowledge of how the system should work, detailed knowledge of all the working parts— including what exactly causes certain Relay Word bits to assert and deassert—helps the analyst eventually get to root cause. As with most pursuits, practice and experience tend to teach more about how to analyze events than formalized procedures. The process presented in [4] is a good starting point.

A. West Millersport 345 kV Bus 1 87Z Differential Relay We begin our analysis by looking into the 87Z relay that
operated. Reference [5] provides an overview of the high-impedance bus differential principle. Under normal conditions, we expect the relay to measure no voltage across a large resistor placed at the summation point of all the CTs in the differential zone. If a fault occurs, we expect a very large voltage to develop across this resistor—so large that a Metal Oxide Varistor (MOV) is used to clamp down the voltage so the CT wiring and relay are not damaged. In the midst of these two extremes, we consider the case of an external fault in which a CT saturates because it serves as a boundary condition for setting the relay. An external fault causes voltage to develop across the resistor, but it is generally much lower than the voltage that develops for an internal fault. This is very beneficial for protection engineers because relays must be set above a certain value for proper restraint (external fault with saturation) and below a certain value for proper operation (internal fault). The first value is much lower than the second. With properly sized CTs, the 87Z relay can be set for high security and high sensitivity without compromising dependability.
Fig. 2 shows the waveforms captured from the unfiltered 16-sample-per-cycle 87Z waveforms (first trace), the filtered 4-sample-per-cycle 87Z waveforms from Phase A (second trace), the magnitude of the Phase A filtered differential voltage relay compared with the relay set point (third trace), and the Relay Word bit (87A1) that led to the trip (fourth trace). Note that the red dotted vertical line, which represents the moment the event was triggered, occurs at 6:15:42.287 p.m.
Unfiltered
42.205 42.255 42.305 42.355 42.405 42.455
200
100
0
42.205 42.255 42.305 42.355 42.405 42.455
200
100
0
–100
–200
600400200
0–200–400
42.205 42.255 42.305 42.355 42.405 42.455
1:87A1
1:TRIP1
Vol
tage
(V s
econ
dary
)
Time (s)
50
150
–600
800
42.205 42.255 42.305 42.355 42.405 42.455
Filtered250
150
50
–50
–150
87A Magnitude and Set Point
Legend87A.MagSETPOINT
–50
20 ms
Legend87A
Legend87A
Fig. 2 87Z Event Report
The relay is set to trip if the magnitude of the filtered voltage on any phase goes above 154 V. Trace 3 shows that—for a very brief amount of time (about 2 ms)—the magnitude of Phase A voltage exceeds the set point and trips 345 kV Bus 1 at West Millersport.
Typically, 87Z input is shorted by a lockout relay contact after the relay calls for a trip to conserve the MOV, which limits voltage in the circuit. It takes about 5 ms for the relay output contact to close. The operation time of a lockout relay is generally in the 16 ms time range. Therefore, it should take at least 20 ms after the Relay Word bit asserts until voltages are removed from the high-impedance input. Careful examination of Fig. 2 shows that the fault was removed before the operation of a lockout relay. This indicates that a fault was cleared before the relay issued a trip to the breakers.
Returning to Fig. 1, note that there is a surge arrester protecting the 345 kV/138 kV autotransformer at West Millersport, and it sits within the 87Z zone of protection. Surge arresters operate very rapidly to alleviate transient overvoltage conditions on systems by creating a low-impedance path to ground. From the perspective of a differential relay, surge arrester operations look like very short phase-to-ground faults (typically just a few milliseconds).
Because the event report likely showed a surge arrester operation, the crew on site was asked to check the counter on the surge arrester. The Phase A surge arrester in question is connected to the H1 bushing of 345 kV-to-138 kV Transformer 1 at West Millersport. The surge arrester operations counter had incremented since the last time the counter was checked, indicating a recent surge arrester operation. Fig. 3 shows the count record for the H1 surge arrester connected to the West Millersport autotransformer.
Fig. 3 Surge Arrester Count Record at West Millersport Autotransformer
Note that the surge arrester is sized at 1.3 per unit (pu) voltage (258 kV) for the 200 kV phase-to-ground system (345 kV phase-to-phase).
Because of this count record, we can conclude that a surge arrester operated in the zone of protection of the 87Z relay. The 87Z relay was set without the time delay recommendation in [6], which led to the undesired operation of the 87Z relay when the surge arrester operated. A short pickup delay of 0.25 cycles would have prevented the 87Z relay from operating in this case.
Why did the surge arrester operate? To answer this, we look at the line relays, which monitor line voltage.

B. Muskingum River–West Millersport Line 2 Events The event reports from all of the line relays are sampled at
2 kHz and last for 1 second. Also, all relays have line-connected coupling capacitor voltage transformers (CCVTs) for voltage measurement. Fig. 4 shows the event report from Muskingum River, which illustrates a Phase-A-to-Phase-B fault that lasts 3.5 cycles. Note that because the fault was 47.25 miles (88 percent of the total line length) from the Muskingum River substation, the fault is just outside the reach of Zone 1. The relay asserts the Zone 2 phase element (M2P), and the relay calls for a trip after 1 cycle passes without a block signal being received. Notice that the current increases slightly for the last cycle of the Phase-A-to-Phase-B fault, indicating that the remote end opened first and the current flow redistributed to feed the fault from only the Muskingum River end of the line. It is also notable that the voltages from Phase A (VA) and Phase B (VB) are approximately 0.77 pu at the time the current is interrupted.
400
200
0
–200
–400
–60041.736 41.836 41.936 42.036 42.136 42.236 42.336
4,000
2,000
0
–2,000
–4,000
–6,00041.736 41.836 41.936 42.036 42.136 42.236 42.336
–640 A
0.77 pu
–461 kV P-G at 6:15:42.285
2:M2P2:TRIP
41.736 41.836 41.936 42.036 42.136 42.236 42.336
Cur
rent
(A p
rimar
y)V
olta
ge (V
sec
onda
ry)
Time (s)
LegendVAVBVC
LegendIAIBIC
Fig. 4 Muskingum River Line 2 Event Report
Next, we see a 0.498-second open interval that shows a small voltage induced from the adjacent Line 1. The top phase, which is Phase C, has the highest induced peak steady-state voltage of 19 kV during the open interval.
At the end of the open interval, Breaker SG at Muskingum River recloses. At this moment, Muskingum River Line 2 sees a peak transient voltage on Phase A of –461 kV, which is 1.64 pu of the standard 282 kV phase-to-ground peak voltage. This happens to coincide with nearly the exact time the 87Z relay operates some 54 miles away at West Millersport. The Phase A voltage transient exceeds 1 pu voltage of nominal system voltage for three consecutive samples (one of these three samples is the –461 kV sample). At a sampling rate of
2 kHz, this equates to 0.0015 seconds. We can also see that there is a voltage transient on Phase B voltage, although it is smaller in magnitude and shorter in duration.
In addition to the voltage transient, the line energization current has a peak value of –640 A before settling into a root-mean-square (RMS) value of about 60 A peak per phase, which is the expected line charging current for this 54-mile line.
Clearly, there was a transient overvoltage at Muskingum River during the reclose. What did the other end of the line see?
Fig. 5 shows the event report from West Millersport Line 2, the line terminal closest to the fault. Again, we see a Phase-A-to-Phase-B fault. As expected, the fault is cleared at the West Millersport end by the Zone 1 phase element (M1P), which does not need to wait for a block signal to operate. The result is that this end of the line clears 1 cycle faster (2.5 cycles) than the Muskingum River end of the line. This agrees with our analysis of the Muskingum River event. However, close inspection of the current waveforms in Fig. 5 shows a very small amount of current present on the faulted phases for a brief amount of time after the current sharply decreases.
600400
0–200–400–600
41.736 41.836 41.936 42.036 42.136 42.236 42.336
15,000
0–5,000
–10,000–15,000
41.736 41.836 41.936 42.036 42.136 42.236 42.336
.77PU
1:M1P1:TRIP
41.736 41.836 41.936 42.036 42.136 42.236 42.336
Cur
rent
(A p
rimar
y)V
olta
ge (V
sec
onda
ry)
Time (s)
10,0005,000
–20,000
–708 kV P-G at 6:15:42.285
200
–800–1,000
LegendIAIBIC
LegendVAVBVC
Fig. 5 West Millersport Line 2 Event Report
Breaker M at West Millersport is an air blast breaker with a 400 Ω opening resistor. The opening resistor runs parallel to the main interrupting contacts and is provided to dampen voltage oscillations across the breaker contacts upon breaker opening. Closer inspection of Fig. 5 at the time the breaker opens shows this resistor. Fig. 6 shows the moment the main contacts open and only the opening resistor remains in the circuit.

41.736 41.746 41.756 41.766 41.776 41.786 41.796
800
400
–400
41.736 41.746 41.756 41.766 41.776 41.786 41.796
Cur
rent
(A p
rimar
y)V
olta
ge (V
sec
onda
ry)
0
–800
300
100
–100
–300
Time (s)
0.77 pu
Opening Resistor in Circuitand Main Contacts Open
Current Chop
LegendVAVBVC
LegendICIAIB
Voltage Drop From Resistor
Fig. 6 West Millersport Line 2 Event Report: Close-up on Opening Resistor
Fig. 6 shows that the opening resistor has four key effects on the waveforms from West Millersport, as follows:
• Current reduces significantly in the faulted phases before the remote end clears the fault.
• Current in Phase B is interrupted prior to a zero crossing, often called a current chop.
• Phase-to-phase voltage (VAB) goes to zero. This makes sense because the 400 Ω resistor is located behind the line potential. The 400 Ω resistor can be thought of as dramatically increasing system impedance behind the relay.
• At the moment the Phase B current (IB) is interrupted, VA and VB voltages increase to about 0.77 pu voltage.
After the open interval of 0.498 seconds, the remote end at Muskingum River recloses. At this moment, one sample from the event record shows a 2.5 pu phase-to-ground peak voltage of –708 kV. This again coincides with the time the 87Z relay operates at West Millersport. However, because Breakers M and M1 are open at West Millersport, this transient voltage condition of –708 kV is not directly exposed to 345 kV Bus 1 at West Millersport. Yet there is an apparent correlation between this transient and the surge arrester operation.
We are left with some questions after reviewing these two events. Why was there such a large voltage transient on reclose? Why was there such a large transient current inrush upon line energization? Before we delve into answering these questions, we review the event reports from unfaulted Line 1 to gather more information.
C. Muskingum River-West Millersport Line 1 Events The Line 1 relay properly restrained for the phase-to-phase
fault on Line 2, so we simply focus on the voltages and currents seen at the time Muskingum River Line 2 reclosed via Breaker SG at 6:15:42.285 p.m. Fig. 7 shows the event report from Muskingum River Line 1.
400
–400
42.283 42.293 42.303 42.313
Cur
rent
(A p
rimar
y)V
olta
ge (V
sec
onda
ry)
0
Time (s)
LegendVAVBVC
42.273
–800
42.283 42.293 42.303 42.31342.273
400
–200
0
–400
200
LegendIAIBIC
Adjacent Line Reclose
Adjacent Line Reclose
Fig. 7 Muskingum River Line 1 Event Report at Time of Reclosing
Clearly, the transient condition visible on Line 2 also influenced the voltage and currents on Line 1. It appears the voltage on Phase A has a notch removed from the sinusoidal waveform at the time of reclose. Also, the currents have elevated magnitudes and oscillations that last for more than 1 cycle.
Finally, we look at the event report from West Millersport Line 1 at the same time Breaker SG reclosed at Muskingum River Line 2, as shown in Fig. 8. Note that the relay at West Millersport Line 1 is connected to 345 kV Bus 1, making this the closest relay, physically, to the surge arrester that operated.
800
0
42.286 42.296
Cur
rent
(A p
rimar
y)V
olta
ge (V
sec
onda
ry)
400
Time (s)
LegendVAVBVC
42.276
–400
400
–200
0
–400
200
LegendIAIBIC
Adjacent Line Reclose
42.286 42.29642.276Adjacent Line Reclose
42.306
42.306
42.316
42.316
Fig. 8 West Millersport Line 1 Event Report at Time of Reclosing
There is a very sharp increase in the Phase A current that coincides with a notch removed from the Phase A voltage. The voltage notch removed at West Millersport Line 1 appears to be more substantial than the one removed at Muskingum River Line 1. This notch is an indication of a surge arrester operation, which was to be expected based on our findings with the 345 kV Bus 1 surge arrester operation at West Millersport.

V. LINE SWITCHING OVERVIEW
A. AEP History In 1963, AEP published three separate papers regarding
switching surges on their 345 kV system [7] [8] [9]. The data were obtained from testing the in-service 345 kV system, and a statistical approach was used. Lines were reclosed many times to find the peak and average overvoltages that could be expected. This was contrary to other studies done at the time that used miniature systems while attempting to find the highest theoretical overvoltage [10].
In fact, Muskingum River—one of the terminals involved in this event—was used to test the magnitude of switching surges. At that time, the West Millersport substation did not exist, and in its place, Muskingum River had a single-circuit 156-mile line that terminated into the East Lima substation. AEP found that when reclosing Muskingum River with East Lima open, they could expect one of the phases to produce, on average, a voltage of 2.5 pu at East Lima. On very rare occasions, East Lima could experience a 3 pu voltage when reclosed from Muskingum River.
B. Simulated Single-Phase Switching Transients To better understand where these overvoltages originate, it
is useful to consider a single-phase system. Fig. 9 shows an example of a single-phase system that contains the basic components required to analyze ac switching surges: a sinusoidal voltage source (Vm), a switch, an inductor (L) that is measured in henries, and a capacitor (C) that is measured in farads. The voltage drop across the inductor is defined as L • di/dt, the voltage drop across the capacitor is Vc, and the total circuit current is I(t).
I(t)
L
diLdt
Vc CVm cos ω(t)+
–
+ –
+
–
Fig. 9 Single-Phase Switching Surge Model
This is an accurate electrical representation of a single inductive conductor over the earth, assuming earth itself is a conductor with no measurable impedance. The capacitance exists because there is an insulator (air) between two conductors (the single inductive conductor and ground). When a circuit is opened, the point on wave voltage at that moment defines an initial trapped dc voltage across the capacitance to ground. Assuming there is no shunt resistance in the circuit, this dc voltage remains indefinitely, and it is there the next time the switch is closed. As can be imagined, the worst case for transient problems occurs when the trapped charge in the capacitor is out of phase with the point-on-wave voltage at the time the switch is closed.
Fig. 9 is explained in detail in [11]. Equation (1) solves for I(t), the current at the time the switch closes, and Equation (2) defines Vc, which is further simplified in (3). The frequency
of this current and voltage is defined by (4), which is the system’s resonant frequency in radians.
( ) ( )( ) ( )oCI t Vm Vc 0 sin tL
ω= − (1)
( ) ( ) ( )t
o1 CVc Vc 0 Vm Vc 0 sin t dtC L
ω°
= + − ∫ (2)
( ) ( )( ) ( )( )oVc Vc 0 Vm Vc 0 1 cos tω= + − − (3)
o1
L • Cω = (4)
From (1), it can be seen that the maximum magnitude of the current is equal to the total voltage across the switch— (Vm – Vc(0)) multiplied by C / L —assuming the time in question allows the sin ωo(t) portion of the equation to evaluate to 1. An equivalent way to look at this is that the total voltage across the switch—(Vm – Vc(0)) divided by L / C —is equal to the magnitude of the current in the circuit. L / C is known as the surge impedance of the system. The surge impedance is equal to the ratio of voltage and current waves traveling on a system. We discuss traveling waves in Subsection C, but for now, it is interesting to note that the peak magnitude of the resonant frequency response of the system is related to the surge impedance.
From (3), it can be seen that if Vm is at 1 pu and the stored charge on Vc(0) is at –1 pu just after the switch closes, Vc magnitude can evaluate to 3 pu voltage. This voltage then oscillates at the resonate frequency of the system. The voltage—Vc, in this example—can be thought of as the voltage at the end of a re-energized line.
To illustrate a simple example of transient overvoltage, we turn to ATP-EMTP, a free transient analysis program, to model a simple single-phase circuit. Fig. 10 shows the sample system, which is very similar to Fig. 9, with the exception that a resistor has been added to the circuit to provide some dampening.
+
–
LI(t)
SW1+
VVcCSW2
Vm
R
+– V
Fig. 10 ATP-EMTP Single-Phase Switching Surge Model
In Fig. 10, we have two switches: one switch (SW1) to open Vm at a negative voltage peak to trap a –1 V trapped charge; and a second switch (SW2) to close Vm at a +1 V charge. The following parameters are used for this example:
L = 100 mH R = 10 Ω C = 1µF Vm = 1 cos ω(t)
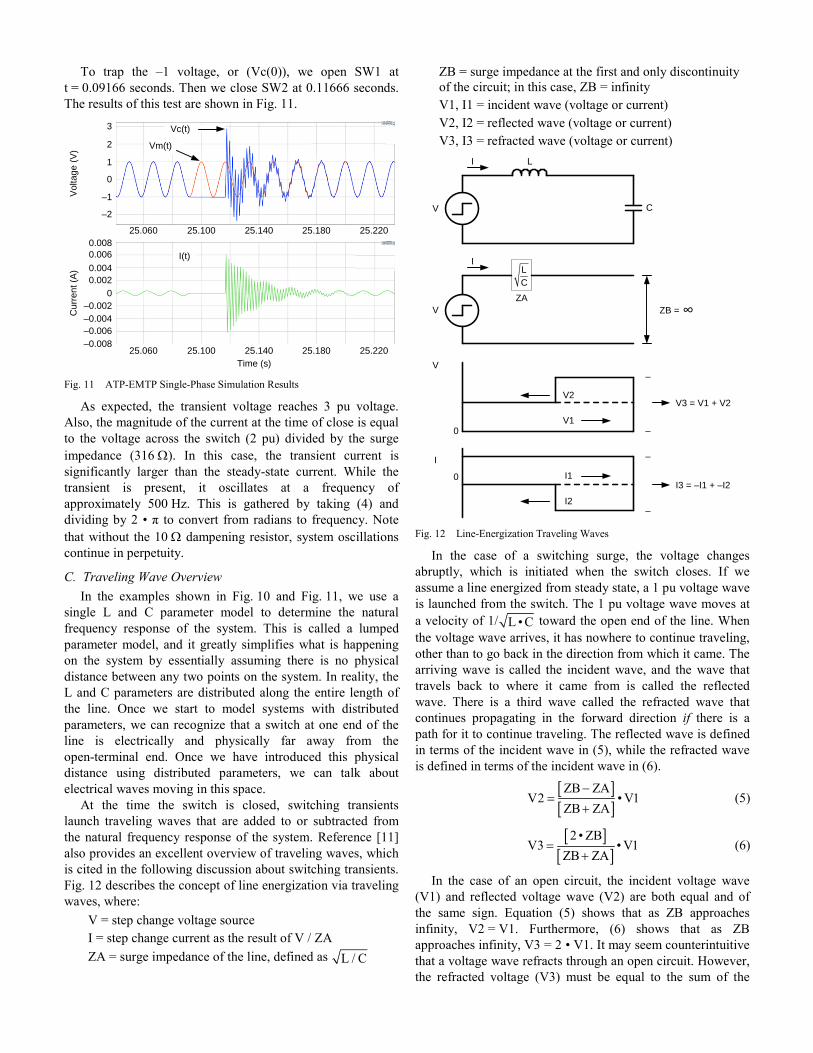
To trap the –1 voltage, or (Vc(0)), we open SW1 at t = 0.09166 seconds. Then we close SW2 at 0.11666 seconds. The results of this test are shown in Fig. 11.
25.100 25.140 25.180 25.22025.060
3
2
–2
0
–1
1
25.100 25.140 25.180 25.22025.060
0.0080.006
–0.002
0.0020
0.004
–0.004–0.006–0.008
Vc(t)
Vm(t)
Vol
tage
(V)
Cur
rent
(A)
Time (s)
Vc(t)
Vm(t)
I(t)
Fig. 11 ATP-EMTP Single-Phase Simulation Results
As expected, the transient voltage reaches 3 pu voltage. Also, the magnitude of the current at the time of close is equal to the voltage across the switch (2 pu) divided by the surge impedance (316 Ω). In this case, the transient current is significantly larger than the steady-state current. While the transient is present, it oscillates at a frequency of approximately 500 Hz. This is gathered by taking (4) and dividing by 2 • π to convert from radians to frequency. Note that without the 10 Ω dampening resistor, system oscillations continue in perpetuity.
C. Traveling Wave Overview In the examples shown in Fig. 10 and Fig. 11, we use a
single L and C parameter model to determine the natural frequency response of the system. This is called a lumped parameter model, and it greatly simplifies what is happening on the system by essentially assuming there is no physical distance between any two points on the system. In reality, the L and C parameters are distributed along the entire length of the line. Once we start to model systems with distributed parameters, we can recognize that a switch at one end of the line is electrically and physically far away from the open-terminal end. Once we have introduced this physical distance using distributed parameters, we can talk about electrical waves moving in this space.
At the time the switch is closed, switching transients launch traveling waves that are added to or subtracted from the natural frequency response of the system. Reference [11] also provides an excellent overview of traveling waves, which is cited in the following discussion about switching transients. Fig. 12 describes the concept of line energization via traveling waves, where:
V = step change voltage source I = step change current as the result of V / ZA ZA = surge impedance of the line, defined as L / C
ZB = surge impedance at the first and only discontinuity of the circuit; in this case, ZB = infinity V1, I1 = incident wave (voltage or current) V2, I2 = reflected wave (voltage or current) V3, I3 = refracted wave (voltage or current)
LC
ZA
I
I L
CV
V
V
ZB = ∞
V2
V1
–
–
V3 = V1 + V2
I2
I1
–
–
I3 = –I1 + –I2
I
0
0
Fig. 12 Line-Energization Traveling Waves
In the case of a switching surge, the voltage changes abruptly, which is initiated when the switch closes. If we assume a line energized from steady state, a 1 pu voltage wave is launched from the switch. The 1 pu voltage wave moves at a velocity of 1/ L • C toward the open end of the line. When the voltage wave arrives, it has nowhere to continue traveling, other than to go back in the direction from which it came. The arriving wave is called the incident wave, and the wave that travels back to where it came from is called the reflected wave. There is a third wave called the refracted wave that continues propagating in the forward direction if there is a path for it to continue traveling. The reflected wave is defined in terms of the incident wave in (5), while the refracted wave is defined in terms of the incident wave in (6).
[ ][ ]ZB ZA
V2 • V1ZB ZA
−=
+ (5)
[ ][ ]
2 • ZBV3 • V1
ZB ZA=
+ (6)
In the case of an open circuit, the incident voltage wave (V1) and reflected voltage wave (V2) are both equal and of the same sign. Equation (5) shows that as ZB approaches infinity, V2 = V1. Furthermore, (6) shows that as ZB approaches infinity, V3 = 2 • V1. It may seem counterintuitive that a voltage wave refracts through an open circuit. However, the refracted voltage (V3) must be equal to the sum of the

incident voltage (V1) and the reflected voltage (V2) to maintain voltage continuity at a singular point on the line. The refracted wave is equal to the total voltage measured at the open-circuit point. In the case of an open circuit, the total voltage seen at the end of the line is twice the voltage that was sent, leading to the so-called doubling effect of voltage at an open-end line terminal.
In addition to the voltage wave, a current wave is also launched at the moment the switch is closed to energize the capacitance of the line. When the incident current wave reaches the end of the line, the reflected wave must be equal and opposite to prevent current from developing across the open circuit. The following equations are used for determining the reflected (7) and refracted (8) current waves.
[ ][ ]ZA ZB
I2 • I1ZB ZA
−=
+ (7)
[ ][ ]
2 • ZAI3 • I1
ZB ZA=
+ (8)
As ZB approaches infinity, I2 becomes equal and opposite to I1, as shown in (7), which forces the refracted current (I3) at the end of the line terminal to be zero, as shown in (8). The result is that I1 + I2 + I3 = 0, which satisfies Kirchhoff’s current law for the point at the end of the line. This is important to note because V3 and I3 represent the voltages and currents that pass through to ZB. In this case, V3 is 2 • V1 and I3 is zero. By dividing the voltage wave (V3) by the current wave (I3), we maintain that the surge impedance of ZB is infinite.
When the reflected voltage and current waves arrive back at the sending end of the line, ZB becomes the surge impedance of the sending source, ZA remains the surge impedance of the line, and the exercise of extracting the reflected and refracted waves begins again.
Note that if a trapped charge exists on the line when the switch is closed, the step change in voltage can be much larger than 1 pu and consequently reach even higher than 2 pu at the open-end line terminal.
D. History of AEP High-Speed Reclosing Trapped charges that remain in the line after a breaker is
opened set the stage for transient overvoltages that ensue when the breaker is reclosed. One factor that influences how large the trapped charge is at the time the breaker recloses is the length of the reclosing open interval.
AEP was a pioneer in high-speed closing and authored a paper in 1941 detailing a 91.5 percent successful reclose rate using an open interval of 12 cycles for their 132 kV system [12]. This philosophy of high-speed reclosing continued to 345 kV, where an open interval of 19 cycles was implemented [7].
One of the side effects of such a short reclose interval is that less time is given for any trapped charge on the line to drain. Up to this point in the paper, our assessment has neglected other devices connected to the power line that serve as a resistance path to ground and drain the trapped charge
over time. Examples of trapped charge drainage devices include the tower footing and the potential instrument transformers located at each end of the line. Both the towers and the potential instrument transformers have a large apparent resistance, but they serve to drain a charge over time. In addition, inclement weather can affect the resistance characteristics of these devices [13].
AEP published a paper in 1964 discussing the decay of trapped charges on transmission lines to better understand the time constants involved with trapped charges as a function of weather [13]. Once again, the Muskingum River terminal was involved in the study. The average time constant for trapped charge decay under dry weather conditions was found to be 25 seconds, meaning it would take this long for the trapped charge voltage to decay to 0.63 pu from 1 pu. In one case, the dry weather time constant was 2 minutes. Weather conditions with sleet had the shortest time constants, and a trapped charge of 0.6 pu was still present at the 24-cycle open interval time (starting from a 1 pu trapped charge voltage initially).
The 1964 study tells us that high-speed reclosing (less than a 30-cycle open interval time) leads to transient overvoltages more often than simple line energization. However, even open intervals measured in seconds rather than cycles can still pose an issue if the weather is dry. In our case, with the ice storm outside, high-speed reclosing played an important part in the voltage transient that was experienced.
VI. RELAY SECURITY DURING SURGE ARRESTER OPERATIONS Generally, protection engineers do not consider surge
arrester operations when setting phasor-based protective relays, because relays generally use a 1-cycle filtering window. This window is significantly longer than the operation time of a surge arrester. However, the 87Z relay in service at the time of this event used a half-cycle filtering window. The half-cycle filtering window allows for faster relay operation than a 1-cycle filtering window. The trade-off to speed is that the half-cycle window is susceptible to overshooting during transient events. Reference [6] discusses the use of a time delay to ride through these transients.
Although its filtering window was only half of a cycle, the 87Z relay in this event used a cosine filter, which adds a quarter-cycle delay when determining the magnitude of the filtered signal [14]. Use of a half-cycle cosine filter means that after a transient has subsided, it takes 0.75 cycles for filtered magnitude values to return to zero. Adding in a safety factor of 0.25 cycles and assuming a surge arrester operation time of 0.25 cycles or less, a typical time delay setting is 1.25 cycles.
While a half-cycle cosine filter can sense a surge arrester operation, note that a 1-cycle cosine filter is also not immune to sensing the same. In general, the magnitude of the 1-cycle cosine filter output is smaller than the magnitude of the half-cycle cosine filter output for a surge arrester operation. Assuming that a unipolar pulse is injected into each filter, the magnitude output of the 1-cycle cosine filter is half the magnitude output of the half-cycle cosine filter. While the magnitude output is smaller in the 1-cycle cosine filter, the output decays more slowly than in the half-cycle cosine filter.

Once the transient has subsided, it takes 1.25 cycles (a 1-cycle filtering window plus a quarter-cycle magnitude calculation) for the 1-cycle cosine filter to empty. Very sensitive settings in a 1-cycle cosine filter implementation could require a time delay to maintain security during a surge arrester operation.
Since the release of the 87Z relay in service at the time of this event, advancements have been made in bus differential protection. Low-impedance differential relays have become more commonplace because they offer greater flexibility for complex bus arrangement and a more comprehensive feature set due to independent current inputs for all nodes in the zone of protection.
Some low-impedance bus differential relays on the market provide a sample-based differential element to supervise a phasor-based differential element. One of the advantages of this design is that surge arrester operation can be ignored more easily because filtering delays do not need to be taken into consideration. One relay design samples waveforms 32 times per cycle. The sampled-based differential must see eight consecutive samples of differential current (about 4 ms) before the element is allowed to operate. Because surge arrester operations are typically less than 4 ms in duration, the phasor-based differential element is prevented from operating during a surge arrester conduction. The time delay is built into the relay and does not require user interaction, unless the surge arrester conducts for longer than 4 ms.
In summary, the 87Z relay in service during this event had a published recommendation to add a time delay greater than 1 cycle to maintain security during surge arrester operation. This required user interaction. Using a low-impedance relay with built-in relay logic to address surge arrester operation would not require user interaction. When applying a bus differential relay with a surge arrester in the zone of protection, it is important to be aware what steps the relay vendor has taken to maintain security for surge arrester operation.
VII. EVENT SIMULATION USING ATP-EMTP
A. Discussion At this point in the analysis, we know that a surge arrester
at West Millersport operated and caused the 87Z relay to operate. However, the event reports do not clearly show the trapped charges on the line or the propagation of the traveling wave that eventually led to the surge arrester operation. Unfortunately, assessing trapped charges accurately at the time of reclose is nearly impossible because the CCVT used in gathering voltage data uses a magnetic core transformer to provide ac signals to the relay. Essentially, any dc trapped charge measurement is blocked, although we can estimate the
trapped charge value by noting the voltage magnitude just before the line opened. As for propagation of the traveling waves, event reports are not sampled at a high enough rate to catch the waves. Sampling rates in the 1 MHz range are appropriate to catch traveling waves. To learn more about what happened, we use ATP-EMTP to simulate the event.
B. Model Overview The ATP-EMTP model was created as a two-source system
with the equivalent system impedances gathered from a short-circuit program used by AEP. For the West Millersport simulation, the source-equivalent surge impedance was selected as 10,000 Ω. Recall that at the time of reclose, only the autotransformer at West Millersport was connected to Line 1, while Line 2 was open. The autotransformer has a high surge impedance relative to the line [15]. The source-equivalent surge impedance used for the Muskingum River simulation was 100 Ω, which approximates the surge impedance based on the lines in service at the time of reclose.
Muskingum River-West Millersport Lines 1 and 2 have a calculated surge impedance of 366 Ω. The two lines were modeled with the appropriate conductor size and spacing using the line constants program within ATP-EMTP. Eight sections of line were created, each simulating 6.75 miles of line to make up the total 54 miles of line length required. This allows us to have the distributed parameter necessary to view traveling waves.
The initial phase-to-phase fault was placed one line section from West Millersport to simulate a fault at 6.75 miles from West Millersport. A 400 Ω resistor with a timed closing switch was placed in parallel with an open switch to simulate the opening resistor and main interruption contacts in the Line 2 breaker at West Millersport. A surge arrester with a 258 kV rating was placed at the West Millersport Line 1 terminal to simulate the arrester that operated. While the transformer was not modeled, the location of the surge arrester is effectively at the line terminal based on the breaker statuses at the time of the reclose. A switch was included with the arrester to easily remove or replace it to determine the voltage at the West Millersport Line 1 terminal with and without the arrester.
The opening and closing times of all breakers involved were determined through careful examination of the event reports reviewed in Section IV of this paper, including the order of poles opening and closing. In addition, the scheme was simplified to a single-breaker scheme, rather than the actual breaker-and-a-half scheme.
The goal of this simulation is to verify that a switching transient on Line 2 could lead to a surge arrester operation on Line 1. Fig. 13 shows the ATP-EMTP model that was used.

VWest MillersportLine 1 Terminal
West Millersport Line 2 Terminal
Muskingum RiverLine 1 Terminal
Muskingum River Line 2 Terminal
V
Fault
LSRS LR RRCG
LR
CG
LR
CG
LR
CG
LR
CG
LR
CG
LR
CG
LR
C
LR
Fig. 13 ATP-EMTP Model of Fault and Subsequent Reclose
C. Results Fig. 14 shows the results of the simulation from the West
Millersport Line 2 terminal. Note that it is very similar to the actual event report gathered from the relay (Fig. 5) with two exceptions. First, the open interval is shorter to speed up simulation time. Second, the trapped charges are visible in the model, giving us some new information we did not have from the event report. Peak Phase-A-to-ground voltage experienced during the reclose from Muskingum River Line 2 is –790 kV, or about 2.8 pu peak voltage. This is just over 10 percent higher than the event report voltage. This could be due to the fact that the ATP-EMTP model does not simulate a decaying charge, so the results would be a bit higher regarding the transient overvoltage. CCVT errors and relay sampling rate may also contribute to the discrepancy.
20,00015,000
–5,000
0.100 0.150 0.200 0.250
Cur
rent
(A p
rimar
y)V
olta
ge (V
prim
ary)
5,000
–10,000
Time (s)
0.050
0
–15,000
10,000
–20,000
0.100 0.150 0.200 0.2500.050
600,000400,000
–200,000–400,000
0
–600,000
200,000
–800,000
LegendWest_Millersport_2_IAWest_Millersport_2_IBWest_Millersport_2_IC
West_Millersport_2_IA_R West_Millersport_2_IB_R
LegendWest_Millersport_2_VAWest_Millersport_2_VBWest_Millersport_2_VC
Fig. 14 ATP-EMTP Simulation for West Millersport Line 2 Terminal
Next, we are interested in the voltage recorded at the West Millersport Line 1 terminal to see if it was high enough to get the surge arrester to operate. Fig. 15 shows the voltages and currents simulated at West Millersport Line 1 with the surge arrester out of service.
1,5001,000
–1,000
0.230 0.235 0.240 0.245
Cur
rent
(A p
rimar
y)V
olta
ge (V
prim
ary)
0
–1,500
Time (s)
0.225
–500
500
600,000400,000
–200,000–400,000
0
–600,000
200,000
–800,000
0.250 0.255 0.260
0.230 0.235 0.240 0.2450.225 0.250 0.255 0.260
LegendWest_Millersport_1_VAWest_Millersport_1_VBWest_Millersport_1_VC
LegendWest_Millersport_1_IAWest_Millersport_1_IBWest_Millersport_1_IC
Fig. 15 ATP-EMTP Simulation for West Millersport Line 1 Terminal at Time of Reclose From Muskingum River Line 1 Terminal
From Fig. 15, we see that the voltage on Phase A at West Millersport Line 2 does experience a transient voltage. In this case, the Phase A voltage is –600 kV, or 2.13 pu of the voltage peak value, which is well above the surge arrester pickup level of 1.3 pu. Another simulation was run with the surge arrester in service at West Millersport Line 1. Fig. 16 shows a comparison of the simulated VA voltage at the West Millersport Line 1 terminal with the surge arrester in service compared with the surge arrester out of service. The plot is zoomed in very closely to clearly see the difference. Note that the surge arrester operates and produces a current in excess of 600 A.

0
–400
0.240 0.241 0.242 0.243
Cur
rent
(A p
rimar
y)V
olta
ge (V
prim
ary)
–200
–500
Time (s)
0.239
–300
–600
–100
–700
200,000
–100,000
–300,000–400,000
0
–500,000
–200,000
–600,000
0.244 0.245
0.240 0.241 0.242 0.2430.239 0.244 0.245
100,000
LegendWest_Millersport_1_VA(no surge arrester)West_Millersport_1_VA(with surge arrester)
LegendWest_Millersport_1_Surge_IA
Fig. 16 West Millersport Line 1 Terminal Phase A Voltage With and Without a Surge Arrester
The simulation shows that a surge arrester operation did occur at West Millersport Line 1 as the result of a breaker reclose at Muskingum River Line 2. We can further analyze the traveling wave propagation by simply focusing on the step changes in voltage and current that occur from the switching surge. The ATP-EMTP model provides 1 MHz sampled data, so we can see these minute step changes to track how the waves travel. Fig. 17 shows the VA voltage for the four line terminals involved. In this figure, the surge arrester has been removed from the simulation to aid in viewing wave propagation. We also introduce line travel time (LTT), which is used in [7]. LTT is equal to L • C , where L and C are the positive-sequence inductance and capacitance values for the 54-mile line. LTT defines the length of time it takes a positive-sequence electrical wave (voltage or current) to propagate down the line. In this case, the LTT is equal to 0.000295 seconds for the 54-mile line. This equals a velocity of 183,185 miles per second, or 0.98 pu the speed of light. AEP testing showed that maximum voltage at the receiving end generally occurred 2LTT after the first wave arrived at the remote terminal, or 3LTT as defined by the time used in Fig. 17. Note that at 3LTT, the West Millersport Line 2 terminal is at nearly –2.8 pu and the West Millersport Line 1 terminal is at –2.13 pu.
At just before t = 0, we see that Muskingum River-West Millersport Line 2 has a trapped positive charge of +1 pu voltage. The in-service Muskingum River-West Millersport Line 1 has a voltage of –0.7 pu, which coincides with the magnitude of the voltage at the time that Breaker SG closed at Muskingum River Line 2, as gathered from the event report.
6
4
–4
1
Vol
tage
(V p
rimar
y)V
olta
ge (V
prim
ary)
0
–6
Multiples of LTT
–2
2
3
2
–1
–2
0
–3
1
–4
3
20
–8
• 105
• 105
Waves Arrive atWest Millersport Line 1 and Line 2 Terminals
Zero-Sequence Waves
Muskingum Line 2Terminal Closes,Launches Waves Toward West Millersport
–2.13 pu–2.80 pu
LegendMuskingum_River_1_VAMuskingum_River_2_VA
Waves Arrive at Muskingum River
LegendWest_Millersport_2_VAWest_Millersport_1_VA
Waves Arriveat West Millersport;Surge Arrester Operates
Multiples of LTT
Fig. 17 Simulated Propagation of Voltage Switching Surges
In our example, Pole A closes first and excites the zero-sequence network. This network has different L and C values than the positive- and negative-sequence networks, and therefore, it produces traveling waves that propagate at a slower speed (in this case, the zero-sequence LTT = 0.000409 seconds) than the waves seen in the positive- and negative-sequence networks. Also, in parallel lines, zero-sequence mutual coupling surge impedance induces voltage and current waves in the adjacent line.
Because there are multiple waves propagating at different speeds, the waves seen at any given moment on a per-phase basis are the combination of these waves. It can become rather difficult to extract the waves of importance. In Fig. 17, we see the zero-sequence waves at West Millersport shortly after the arrival of the initial wave. Our goal is to eliminate these zero-sequence waves, as well as the influence of zero-sequence mutual coupling.
Reference [16] details the use of Clarke components to detect traveling waves because they are an effective way to separate different waves that may be propagating on the line. The alpha component in particular is the ideal quantity to use in detecting traveling waves. The alpha component is found in all fault types and eliminates waves traveling through the earth. In addition, there is negligible coupling between two parallel circuits in the alpha network. The result of converting phase values into the alpha component is shown in Fig. 18.

Vol
tage
(V p
rimar
y)
4
–4
0
–6
–2
2
32
–1
–2
0
–3
1
–4
–8
Multiples of LTT
Vol
tage
(V p
rimar
y)• 105
• 105
1 3
20
Waves Arrive at West Millersport;Surge Arrester Operates
Muskingum Line 2Terminal Closes,Launches Waves Toward West Millersport Waves Arrive at
Muskingum River
LegendMuskingum_River_1_V_AlphaMuskingum_River_2_V_Alpha
Waves Arrive atWest Millersport Line 1 and Line 2 Terminals
LegendWest_Millersport_2_V_AlphaWest_Millersport_1_V_Alpha
Multiples of LTT
Fig. 18 Simulated Propagation of Alpha Component Voltage Switching Surges
Although it is a subtle difference, the alpha components show a more defined wave at Muskingum River at 2LTT, and they eliminate zero-sequence waves present on West Millersport Lines 1 and 2. The alpha plot presents a clearer picture of the traveling waves on the system.
When Breaker SG is closed at t = 0, the following two voltage waves are launched. We focus only on the waves that affect the West Millersport Line 1 terminal because that is our terminal of interest:
1. A positive voltage wave with small magnitude, denoted by the small positive step change in voltage, travels from the Muskingum River Line 1 terminal toward the West Millersport Line 1 terminal and arrives at 1LTT. This wave is of the opposite polarity of the standing wave and initially reduces the magnitude of the voltage at the West Millersport Line 1 terminal. Because this terminal terminates into an autotransformer with high surge impedance, the voltage wave that reflects back to the Muskingum River Line 1 terminal is positive. This wave arrives at 2LTT at the Muskingum River Line 1 terminal. Because the source surge impedance at this terminal is smaller than the line surge impedance, the voltage wave that reflects back to the West Millersport Line 1 terminal is negative, and it arrives at 3LTT.
2. A negative voltage wave with a very large magnitude, denoted by the large negative step change in voltage, travels from the Muskingum River Line 2 terminal toward the West Millersport Line 2 terminal and arrives at 1LTT. Because the terminal is open, the voltage wave that reflects back to the Muskingum River Line 2 terminal is also a negative voltage wave, and it arrives at 2LTT. Next, a negative refracted voltage wave leaves the Muskingum River Line 1 terminal and travels to the West Millersport Line 1 terminal, adding to the
standing negative voltage wave and producing a transient overvoltage at 3LTT.
Note that, at 2LTT, both of the Muskingum River Line 1 and Muskingum River Line 2 terminals show a negative wave. This is because the magnitude of Wave 2—a negative incident voltage wave—is much larger than the magnitude of Wave 1—a positive incident voltage wave. When they combine at Muskingum River, the result is a negative wave.
Interestingly, both waves lead to the overvoltage seen at the West Millersport Line 1 terminal that led to the surge arrester operation.
VIII. CONCLUSION The most severe switching surges occur when
re-energizing a line with a voltage at the opposite polarity of the trapped charge on the line. The shorter the open interval used for the reclose, the higher the magnitude of the trapped charge and the higher the switching surge voltage. When a line is reenergized, a traveling wave voltage is launched and produces reflections and refractions any time the wave reaches a discontinuity in the conductor where it is traveling. In the event we reviewed and simulated, these waves produced a large transient overvoltage at a substation remote from where the reclose occurred.
Switching surges are destructive to electrical equipment, so surge arresters are typically installed near large transformers and on line terminals to suppress surges. In this event, a switching surge that produced a voltage in excess of the surge arrester rating arrived from the remote terminal and caused the surge arrester to operate. When a surge arrester operates, it produces a temporary low-impedance path to ground to alleviate the overvoltage condition. This low-impedance path can produce a significant amount of current to flow for a short duration of time. If the surge arrester is in a differential zone of protection, the current flow does not satisfy Kirchhoff’s current law, which states that all current entering and leaving a node or zone of protection must sum to zero. Therefore, a differential relay can operate undesirably during a switching surge if the relay is able to operate as fast as a surge arrester.
The 87Z relay in service at the time of this event uses a short filtering window that allows the relay to operate very fast for internal faults—so fast, in fact, that it correctly but undesirably trips for the operation of the surge arrester. To ensure the relay does not operate for a surge arrester operation, a time delay must be added to the protection element to allow it to ride through a surge arrester operation.
Certain low-impedance differential relays that use a sample-based differential to supervise a filtered differential incorporate a small time delay in the 87Z operation to ride through surge arrester operations. While these relays are designed to allow the user to neglect the effects of surge arresters when setting the relay, it is still prudent to ensure that the time delay selected by the manufacturer is long enough to ride through the expected surge arrester operation time.
The time-aligned 2 kHz sample rate events gathered from the line relays in service allowed us to see the transient overvoltage produced by the switching surge and to identify
that a surge arrester operation was likely because the surge and 87Z operation occurred at the same time. Through simulation, we were able to validate the findings from our analysis and more clearly see how the surge traveled in the system and ultimately met up with the surge arrester installed at West Millersport Line 1.
In this particular event, the switching surge was fairly severe due to the following circumstances:
• Due to a previous relay operation on the West Millersport–Kirk line, only an autotransformer was connected to Line 1 at West Millersport. This eliminated other paths for incoming voltage surges to travel, forcing them to the surge arrester on the transformer.
• A current chop on a faulted phase elevated the trapped charges on the line.
• High-speed reclosing was being used, which allows a shorter time for trapped charges to decay.
• The reclose occurred out of phase with the trapped voltage charge on the line.
A series of events that happened in just the right way ultimately led to the 87Z operation.
Throughout the event analysis and simulation, we referenced AEP’s previous work regarding switching surges on their 345 kV system. Their papers provided further validation and insight into switching surges based on actual test data on the subject system, including pictures of oscilloscope traces during line re-energization. The statistical approach to determining real-world switching surges instead of simulating switching surges on miniature systems was groundbreaking at the time. Even decades later, their papers aided in the analysis of high-resolution event data gathered from a digital relay rather than a simple picture of an oscilloscope trace.
IX. ACKNOWLEDGEMENT The authors gratefully acknowledge the contribution of
Armando Guzmán at Schweitzer Engineering Laboratories, Inc. for his guidance in setting up the ATP-EMTP simulation software and of Ryan Knapp at AEP for his initial analysis of the event.
X. REFERENCES [1] “Kentucky Hardest Hit By Deadly Ice Storm,” CBS News, February
2009. Available: http://www.cbsnews.com/news/kentucky-hardest-hit-by-deadly-ice-storm/.
[2] “A Look Back at the Extreme Ice Storm of 2009,” AccuWeather.com, January 2012. Available: http://www.accuweather.com/en/weather-news/ice-storm-2009-photos-videos/60761.
[3] J. Wang, “Overhead Transmission Line Vibration and Galloping,” proceedings of the 2008 International Conference on High Voltage Engineering and Application, Chongqing, China, November 2008.
[4] K. Zimmerman and R. McDaniel, “Using Power System Event Data To Reduce Downtime,” proceedings of the IEEE Cement Industry Technical Conference, Palm Springs, CA, May 2009.
[5] K. Koellner, O. Reynisson, and D. Costello, “High-Impedance Bus Differential Misoperation Due to Circuit Breaker Restrikes,” proceedings of the 67th Annual Conference for Protective Relay Engineers, College Station, TX, March 2014.
[6] L. Underwood, “Applying the SEL-587Z With Lightning Arresters Within the Differential Zone,” April 2007. Available: http://www.selinc.com.
[7] A.J. McElroy, W.S. Price, H.M. Smith, and D.F. Shankle, “Field Measurement of Switching Surges on Unterminated 345-kV Transmission Lines,” IEEE Transactions on Power Apparatus and Systems, Vol. 82, Issue 67, August 1963, pp. 465–487.
[8] A.J. McElroy and H.M. Smith, “Propagation of Switching-Surge Wave-Fronts on EHV Transmission Lines,” Transactions of the American Institute of Electrical Engineers. Part III: Power Apparatus and Systems, Vol. 81, Issue 3, April 1962, pp. 983–995.
[9] W.S. Price, A.J. McElroy, H.M. Smith, and D.F. Shankle, “Field Measurement of 345-kV Lightning Arrester Switching Surge Performance,” IEEE Transactions on Power Apparatus and Systems, Vol. 82, Issue 67, August 1963, pp. 487–500.
[10] I.B. Johnson, R.F. Silva, and D.D. Wilson, “Switching Surges Due to Energization or Reclosing,” proceedings of the 23rd Annual American Power Conference, Chicago, IL, March 1961.
[11] A. Greenwood, Electrical Transients in Power Systems: Second Edition. Wiley-Interscience, 1991.
[12] P. Spom and C.A. Muller, “Five Years' Experience With Ultrahigh-Speed Reclosing of High-Voltage Transmission Lines,” Electrical Engineering, Vol. 60, Issue 5, May 1941, pp. 241–245.
[13] J.E. Beehler, “Weather, Corona, and the Decay of Trapped Energy on Transmission Lines,” IEEE Transactions on Power Apparatus and Systems, Vol. 83, Issue 5, May 1964, pp. 512–520.
[14] E.O. Schweitzer, III and D. Hou, “Filtering for Protective Relays,” proceedings of IEEE WESCANEX 93 Communications, Computers and Power in the Modern Environment, Saskatoon, Canada, May 1993.
[15] V. Hinrichsen, “Metal-Oxide Surge Arrester Fundamentals,” Siemens AG, Germany, 2001.
[16] E.O. Schweitzer, III, A. Guzmán, M.V. Mynam, V. Skendzic, and B. Kasztenny, “Locating Faults by the Traveling Waves They Launch,” proceedings of the 67th Annual Conference for Protective Relay Engineers, College Station, TX, March 2014.
XI. BIOGRAPHIES Jeff Iler is a staff engineer with American Electric Power’s Protection and Control Engineering group. Jeff has been in protection and control engineering for his entire career, serving in the field, the engineering office, and in multiple supervisory capacities since 1992. He has been an active member of the NERC System Protection and Control Subcommittee since 2010. Jeff has been a member of the NERC Standard Drafting Team developing PRC-027-1 Coordination of Protection Systems. He is also a member of the Reliability First Protection Subcommittee. Jeff earned a B.S.E.E. from the University of Akron and is a registered professional engineer in the state of Ohio.
Ryan McDaniel earned his B.S. in Computer Engineering from Ohio Northern University in 2002. In 1999, Ryan was hired by American Electric Power (AEP) as a relay technician, where he commissioned protective systems. In 2002, Ryan began working in the Station Projects Engineering group as a protection and control engineer. His responsibilities in this position included protection and control design for substation, distribution, and transmission equipment as well as coordination studies for the AEP system. In 2005, Ryan joined Schweitzer Engineering Laboratories, Inc. and is currently a senior field application engineer. His responsibilities include providing application support and technical training for protective relay users. Ryan is a registered professional engineer in the state of Illinois and a member of IEEE.
20170130 • TP6768