High School Attendance Zone Boundaries€¦ · October 31, 2016 High School Attendance Zone...
15
October 31, 2016 High School Attendance Zone Boundaries Proposed Options INCLUDES: PROPOSED OPIONS, COMPARISON OF OPTIONS, DATA BY PLANNING UNIT, AND STAFF’S ANALYSIS OF PLANNING UNIT DATA FOLLOWING 30‐2.2 CRITERIA
Transcript of High School Attendance Zone Boundaries€¦ · October 31, 2016 High School Attendance Zone...

October 31, 2016
High School Attendance Zone Boundaries
Proposed Options INCLUDES: PROPOSED OPIONS, COMPARISON OF OPTIONS, DATA BY PLANNING UNIT, AND STAFF’S ANALYSIS OF PLANNING UNIT DATA FOLLOWING 30‐2.2 CRITERIA

O c t o b e r 3 1 , 2 0 1 6 1 | P a g e
Wakefield A Revised
Planning Projected H.S. Siblings Neighborhood SB CriteriaUnit Students w/in School Efficiency Proximity Stability Alignment Demographics Contiguity
for 2020 Elem. Middle Within 1.5 mile radius Secondary (based on current
APS students in
grade 5, 6, 7 & 8)
4 years Wake W‐Lee York Students receiving
Free/Reduced Cost
Lunch
3706 40 10 Barcroft Kenmore Y 100% N N Y N 33 Y
4611 14 1 Henry Jefferson Y N N N Y Y <10 Y
4612 22 2 Henry Jefferson Y N N N Y Y <10 Y
4614 31 7 Hoff‐Boston Jefferson Y N N N Y Y 26 Y
4691 1 Long Branch Jefferson Y N N N Y Y <10 Y
4815 23 5 Hoff‐Boston Jefferson Y N N N Y Y 20 Y
4816 14 2 Hoff‐Boston Jefferson Y N N N Y Y <10 Y
4818 18 4 Long Branch Jefferson Y N N N Y Y 12 Y
4828 43 5 Hoff‐Boston Jefferson Y N N N Y Y 22 Y
4829 10 1 Hoff‐Boston Jefferson Y N N N Y Y <10 Y
Totals No. F/RL % FRLWakefield A 215 37 132 61%
Note: The total students in the table and in the total students in the boundary tool may be different by 1 due to rounding.
O c t o b e r 3 1 , 2 0 1 6 2 | P a g e
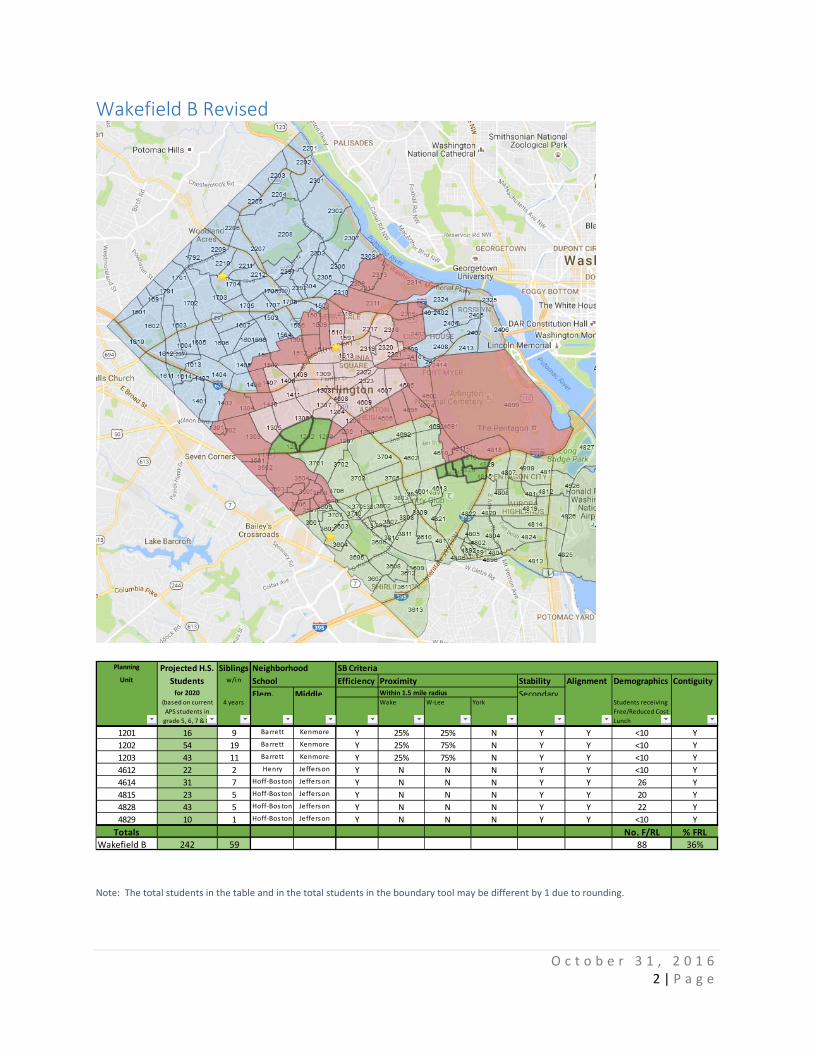
Wakefield B Revised
Planning Projected H.S. Siblings Neighborhood SB CriteriaUnit Students w/in School Efficiency Proximity Stability Alignment Demographics Contiguity
for 2020 Elem. Middle Within 1.5 mile radius Secondary (based on current
APS students in
grade 5, 6, 7 & 8)
4 years Wake W‐Lee York Students receiving
Free/Reduced Cost
Lunch
1201 16 9 Barrett Kenmore Y 25% 25% N Y Y <10 Y
1202 54 19 Barrett Kenmore Y 25% 75% N Y Y <10 Y
1203 43 11 Barrett Kenmore Y 25% 75% N Y Y <10 Y
4612 22 2 Henry Jefferson Y N N N Y Y <10 Y
4614 31 7 Hoff‐Boston Jefferson Y N N N Y Y 26 Y
4815 23 5 Hoff‐Boston Jefferson Y N N N Y Y 20 Y
4828 43 5 Hoff‐Boston Jefferson Y N N N Y Y 22 Y
4829 10 1 Hoff‐Boston Jefferson Y N N N Y Y <10 Y
Totals No. F/RL % FRL
Wakefield B 242 59 88 36%
Note: The total students in the table and in the total students in the boundary tool may be different by 1 due to rounding.
O c t o b e r 3 1 , 2 0 1 6 3 | P a g e
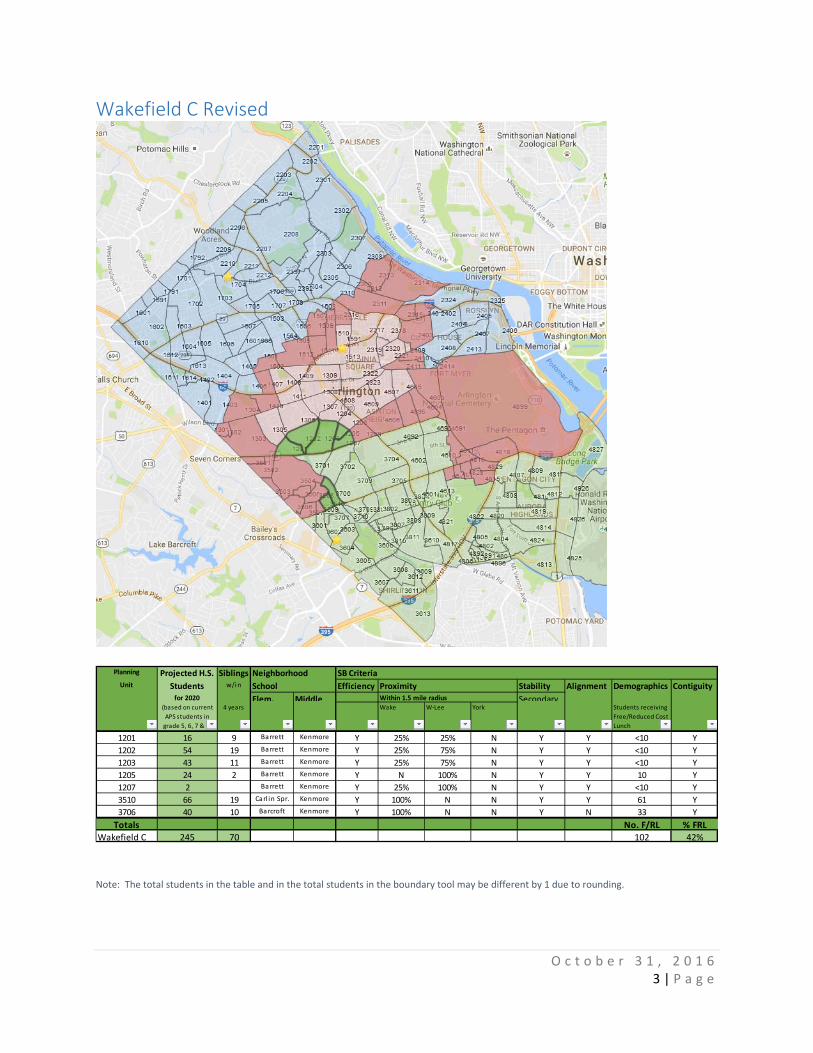
Wakefield C Revised
Planning Projected H.S. Siblings Neighborhood SB CriteriaUnit Students w/in School Efficiency Proximity Stability Alignment Demographics Contiguity
for 2020 Elem. Middle Within 1.5 mile radius Secondary (based on current
APS students in
grade 5, 6, 7 & 8)
4 years Wake W‐Lee York Students receiving
Free/Reduced Cost
Lunch
1201 16 9 Barrett Kenmore Y 25% 25% N Y Y <10 Y
1202 54 19 Barrett Kenmore Y 25% 75% N Y Y <10 Y
1203 43 11 Barrett Kenmore Y 25% 75% N Y Y <10 Y
1205 24 2 Barrett Kenmore Y N 100% N Y Y 10 Y
1207 2 Barrett Kenmore Y 25% 100% N Y Y <10 Y
3510 66 19 Carl in Spr. Kenmore Y 100% N N Y Y 61 Y
3706 40 10 Barcroft Kenmore Y 100% N N Y N 33 Y
Totals No. F/RL % FRLWakefield C 245 70 102 42%
Note: The total students in the table and in the total students in the boundary tool may be different by 1 due to rounding.

O c t o b e r 3 1 , 2 0 1 6 4 | P a g e
Yorktown A Revised
Planning Projected H.S. Siblings Neighborhood SB CriteriaUnit Students w/in School Efficiency Proximity Stability Alignment Demographics Contiguity
for 2020 Elem. Middle Within 1.5 mile radius Secondary (based on current
APS students in
grade 5, 6, 7 & 8)
4 years Wake W‐Lee York Students receiving
Free/Reduced Cost
Lunch
1302 0 Ashlawn Kenmore Y N N N Y Y <10 Y
1303 86 22 Ashlawn Kenmore Y N N N Y Y <10 Y
1304 63 17 Ashlawn Swanson Y N 25% N Y Y <10 Y
1410 41 14 McKinley Swanson Y N 100% N Y Y <10 Y
1502 23 4 McKinley Swanson Y N 100% 100% Y Y <10 Y
3501 10 2 Carl in Spr. Kenmore Y N N N Y Y <10 Y
3502 5 3 Carl in Spr. Kenmore Y 50% N N Y Y <10 Y
3503 2 Carl in Spr. Kenmore Y 100% N N Y Y <10 Y
Totals No. F/RL % FRLYorktown A 229 62 15 7%
Note: The total students in the table and in the total students in the boundary tool may be different by 1 due to rounding.

O c t o b e r 3 1 , 2 0 1 6 5 | P a g e
Yorktown B Revised
Planning Projected H.S. Siblings Neighborhood SB CriteriaUnit Students w/in School Efficiency Proximity Stability Alignment Demographics Contiguity
for 2020 Elem. Middle Within 1.5 mile radius Secondary (based on current
APS students in
grade 5, 6, 7 & 8)
4 years Wake W‐Lee York Students receiving
Free/Reduced Cost
Lunch
1302 0 Ashlawn Kenmore Y N N N Y Y <10 Y
1303 86 22 Ashlawn Kenmore Y N N N Y Y <10 Y
1304 63 17 Ashlawn Swanson Y N 25% N Y Y <10 Y
1502 23 4 McKinley Swanson Y N 100% 100% Y Y <10 Y
2312 5 2 Taylor Swanson Y N 100% N Y Y <10 Y
2313 33 5 Taylor Swanson Y N 75% N Y Y <10 Y
2314 32 3 Taylor Swanson Y N 75% N Y Y <10 Y
Totals No. F/RL % FRL
Yorktown B 241 53 <10 0%
Note: The total students in the table and in the total students in the boundary tool may be different by 1 due to rounding.

O c t o b e r 3 1 , 2 0 1 6 6 | P a g e
Yorktown C Revised
Planning Projected H.S. Siblings Neighborhood SB CriteriaUnit Students w/in School Efficiency Proximity Stability Alignment Demographics Contiguity
for 2020 Elem. Middle Within 1.5 mile radius Secondary (based on current
APS students in
grade 5, 6, 7 & 8)
4 years Wake W‐Lee York Students receiving
Free/Reduced Cost
Lunch
1302 0 Ashlawn Kenmore Y N N N Y Y <10 Y
1303 86 22 Ashlawn Kenmore Y N N N Y Y <10 Y
1304 63 17 Ashlawn Swanson Y N 25% N Y Y <10 Y
2312 5 2 Taylor Swanson Y N 100% N Y Y <10 Y
2313 33 5 Taylor Swanson Y N 75% N Y Y <10 Y
2314 32 3 Taylor Swanson Y N 75% N Y Y <10 Y
3501 10 2 Carl in Spr. Kenmore Y N N N Y Y <10 Y
3502 5 3 Carl in Spr. Kenmore Y 50% N N Y Y <10 Y
3503 2 Carl in Spr. Kenmore Y 100% N N Y Y <10 Y
Totals No. F/RL % FRL
Yorktown C 235 54 13 6%
Note: The total students in the table and in the total students in the boundary tool may be different by 1 due to rounding.

O c t o b e r 3 1 , 2 0 1 6 7 | P a g e
Yorktown D NEW
Planning Projected H.S. Siblings Neighborhood SB CriteriaUnit Students w/in School Efficiency Proximity Stability Alignment Demographics Contiguity
for 2020 Elem. Middle Within 1.5 mile radius Secondary (based on current
APS students in
grade 5, 6, 7 & 8)
4 years Wake W‐Lee York Students receiving
Free/Reduced Cost
Lunch
1502 23 4 McKinley Swanson Y N 100% 100% Y Y <10 Y
2311 93 28 Taylor Swanson Y N 100% N Y Y <10 Y
2312 5 2 Taylor Swanson Y N 100% N Y Y <10 Y
2313 33 5 Taylor Swanson Y N 75% N Y Y <10 Y
2314 32 3 Taylor Swanson Y N 75% N Y Y <10 Y
2315 25 3 Taylor Swanson Y N 100% N Y Y 14 Y
2401 20 2 Key/ASF Swanson Y N 100% N Y Y <10 Y
Totals No. F/RL % FRL
Yorktown D 231 47 14 6%
Note: The total students in the table and in the total students in the boundary tool may be different by 1 due to rounding.
O c t o b e r 3 1 , 2 0 1 6 8 | P a g e
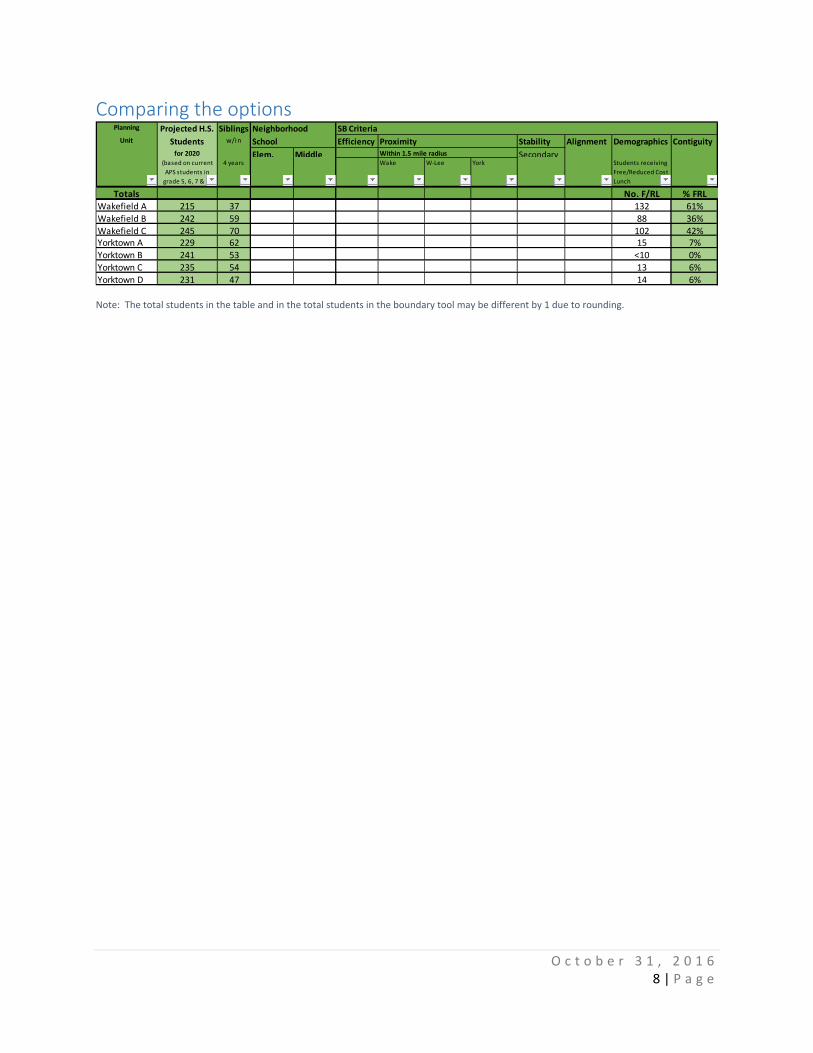
Comparing the options
Planning Projected H.S. Siblings Neighborhood SB CriteriaUnit Students w/in School Efficiency Proximity Stability Alignment Demographics Contiguity
for 2020 Elem. Middle Within 1.5 mile radius Secondary (based on current
APS students in
grade 5, 6, 7 & 8)
4 years Wake W‐Lee York Students receiving
Free/Reduced Cost
Lunch
Totals No. F/RL % FRL
Wakefield A 215 37 132 61%
Wakefield B 242 59 88 36%
Wakefield C 245 70 102 42%Yorktown A 229 62 15 7%
Yorktown B 241 53 <10 0%
Yorktown C 235 54 13 6%
Yorktown D 231 47 14 6%
Note: The total students in the table and in the total students in the boundary tool may be different by 1 due to rounding.

O c t o b e r 3 1 , 2 0 1 6 9 | P a g e
Data by Planning Unit Revised 10/31/16 Planning Unit
Projected H.S. Enrollment Students for 2020
(based on current APS students in grade 5, 6, 7 & 8)
Siblings w/in 4 years
Neighborhood School
SB Criteria
Efficiency
Proximity
Stability Secondary
Alignment
Demographics Students receiving Free/Reduced Cost Lunch
Contiguity
Elem.
Middle
Within 1.5 mile radius
Wake W‐Lee York
1201 16 9 Barrett Kenmore Y 25% 25% N Y Y <10 Y
1202 54 19 Barrett Kenmore Y 25% 75% N Y Y <10 Y
1203 43 11 Barrett Kenmore Y 25% 75% N Y Y <10 Y
1205 24 2 Barrett Kenmore Y N 100% N Y Y 10 Y
1207 2 Barrett Kenmore Y 25% 100% N Y Y <10 Y
1208 32 8 Barrett Swanson Y 5% 100% N Y Y 30 Y
1302 0 Ashlawn Kenmore Y N N N Y Y <10 Y
1303 86 22 Ashlawn Kenmore Y N N N Y Y <10 Y
1304 63 17 Ashlawn Swanson Y N 25% N Y Y <10 Y
1407 24 4 McKinley Swanson Y N 100% 50% Y Y <10 Y
1410 41 14 McKinley Swanson Y N 100% N Y Y <10 Y
1502 23 4 McKinley Swanson Y N 100% 100% Y Y <10 Y
1509 52 8 Glebe Swanson Y N 100% 75% Y Y <10 Y
1510 36 7 Glebe Swanson Y N 100% 5% Y Y <10 Y
1511 21 11 Glebe Swanson Y N 100% 25% Y Y <10 Y
1512 81 18 Glebe Swanson Y N 100% 75% Y Y <10 Y
2311 93 28 Taylor Swanson Y N 100% N Y Y <10 Y
2312 5 2 Taylor Swanson Y N 100% N Y Y <10 Y
2313 33 5 Taylor Swanson Y N 75% N Y Y <10 Y
2314 32 3 Taylor Swanson Y N 75% N Y Y <10 Y

O c t o b e r 3 1 , 2 0 1 6 10 | P a g e
Planning Unit
Projected H.S. Enrollment Students for 2020
(based on current APS students in grade 5, 6, 7 & 8)
Siblings w/in 4 years
Neighborhood School
SB Criteria
Efficiency
Proximity
Stability Secondary
Alignment
Demographics Students receiving Free/Reduced Cost Lunch
Contiguity
Elem.
Middle
Within 1.5 mile radius
Wake W‐Lee York
2315 25 3 Taylor Swanson Y N 100% N Y Y 14 Y
2316 16 5 Taylor Swanson Y N 100% 1% Y Y <10 Y
2401 20 2 Key/ASF Swanson Y N 100% N Y Y <10 Y
2403 50 16 Key/ASF Swanson Y N 100% N Y Y <10 Y
2410 20 Key/ASF Jefferson Y N 100% N Y Y <10 Y
2411 8 2 Key/ASF Jefferson Y N 100% N Y Y <10 Y
3501 10 2 Carlin Spr. Kenmore Y N N N Y Y <10 Y
3502 5 3 Carlin Spr. Kenmore Y 50% N N Y Y <10 Y
3503 2 Carlin Spr. Kenmore Y 100% N N Y Y <10 Y
3504 43 9 Carlin Spr. Kenmore Y 100% N N Y Y <10 Y
3505 13 2 Carlin Spr. Kenmore Y 100% N N Y Y <10 Y
3506 58 16 Carlin Spr. Kenmore Y 100% N N Y Y 44 Y
3507 137 32 Carlin Spr. Kenmore Y 100% N N Y Y 122 Y
3508 151 34 Carlin Spr. Kenmore Y 100% N N Y Y 118 Y
3509 44 11 Carlin Spr. Kenmore Y 100% N N Y Y 41 Y
3510 66 19 Carlin Spr. Kenmore Y 100% N N Y Y 61 Y
3706 40 10 Barcroft Kenmore Y 100% N N Y N 33 Y
4603 48 11 Long Branch Jefferson Y N 50% N Y Y 19 Y
4604 20 7 Long Branch Jefferson Y N 75% N Y Y <10 Y
4606 28 6 Long Branch Jefferson Y N 100% N Y Y <10 Y
4611 14 1 Henry Jefferson Y N N N Y Y <10 Y
4612 22 2 Henry Jefferson Y N N N Y Y <10 Y
4614 31 7 Hoff‐Boston Jefferson Y N N N Y Y 26 Y
4691 1 Long Branch Jefferson Y N N N Y Y <10 Y

O c t o b e r 3 1 , 2 0 1 6 11 | P a g e
Planning Unit
Projected H.S. Enrollment Students for 2020
(based on current APS students in grade 5, 6, 7 & 8)
Siblings w/in 4 years
Neighborhood School
SB Criteria
Efficiency
Proximity
Stability Secondary
Alignment
Demographics Students receiving Free/Reduced Cost Lunch
Contiguity
Elem.
Middle
Within 1.5 mile radius
Wake W‐Lee York
4695 33 8 Long Branch Jefferson Y N 100% N Y Y <10 Y
4815 23 5 Hoff‐Boston Jefferson Y N N N Y Y 20 Y
4816 14 2 Hoff‐Boston Jefferson Y N N N Y Y <10 Y
4818 18 4 Long Branch Jefferson Y N N N Y Y 12 Y
4828 43 5 Hoff‐Boston Jefferson Y N N N Y Y 22 Y
4829 10 1 Hoff‐Boston Jefferson Y N N N Y Y <10 Y
4899 9 Long Branch Jefferson Y N 1% N Y Y <10 Y
9999
Options No. F/RL* % FRL of Options
Wakefield A 215 37 132 61%
Wakefield B 242 59 88 36%
Wakefield C 245 70 102 42%
Yorktown A 229 62 15 7%
Yorktown B 241 53 <10 0%
Yorktown C 235 54 13 6%
Yorktown D 231 47 14 6%
*Total number of students receiving free/reduced cost lunch, using actual data (less than 10).

12 | P a g e 1 0 / 3 1 / 2 0 1 6 6 : 1 4 P M
Boundaries Policy 30‐2.2 Staff’s Analysis of Planning Unit Data following 30‐2.2 Criteria
Total Students (current APS students in Grades 5, 6, 7 and 8) This column reflects the total number of students by planning unit who are expected to enter high school in
2017 (current Grade 8 students)
2018 (current Grade 7 students)
2019 (current Grade 6 students)
2020 (current Grade 5 students) Siblings of current Washington‐Lee students are included in these totals. These siblings are now in Grades 5‐8 and would be concurrently enrolled with the older siblings (see below). Note: The numbers of students in an individual planning unit may differ from the boundary tool numbers by one student since these numbers are based on actual students currently enrolled in that grade and school and residing in the planning unit. The boundary tool uses projections which may require rounding.
Siblings within 4 years This column reflects the number of siblings who could potentially be impacted by “sibling considerations”. It represents siblings who will be concurrently enrolled in high schools
next year, when the older sibling will be in grade 10, 11 or 12, and
the younger sibling or siblings is/are currently in enrolled in grades 5‐8. Depending upon the decision about “sibling considerations”, these are the number of students who might have the option to attend Washington‐Lee with an older sibling.
Neighborhood Schools These columns reflect the current elementary and middle school for each planning unit.
Efficiency Policy definition ‐ “Minimizing future capital and operating costs” Use on baseline spreadsheet ‐ All planning units were assigned a rating of Y (yes) based on the reasoning that the changes are efficient by balancing enrollment and using available seats at Wakefield and Yorktown.
Proximity Policy definition ‐ “Encouraging the relationship between schools and the community by keeping students close to the schools that they attend so that they can walk safely to school or, if they are eligible for bus service, so that bus ride times are minimized”

13 | P a g e 1 0 / 3 1 / 2 0 1 6 6 : 1 4 P M
Use on baseline spreadsheet – Acknowledges the 1.5 mile walking distance in SB policy 50‐51, uses geographic area of each planning unit, and estimates a proportion of the planning unit that is within the 1.5 mile radius. Responses of (100%, 75%, 50%, 25% and N=0%) are assigned to most planning units. For planning units that touch the radius, a standard response of 5% acknowledges the relationship. Note: the radius is different from the walking distance, so students at the outer edges may already receive transportation.
Stability Policy definition ‐ “Minimizing the number of times that boundary changes affect an individual student who has continued to reside in a particular attendance area, and minimizing the number of students moved to a different school, while achieving the objective of the boundary change.” Use on baseline spreadsheet – All planning units were assigned a rating of Y (yes), indicating that none of the students were impacted by previous H.S. or M.S boundary changes.
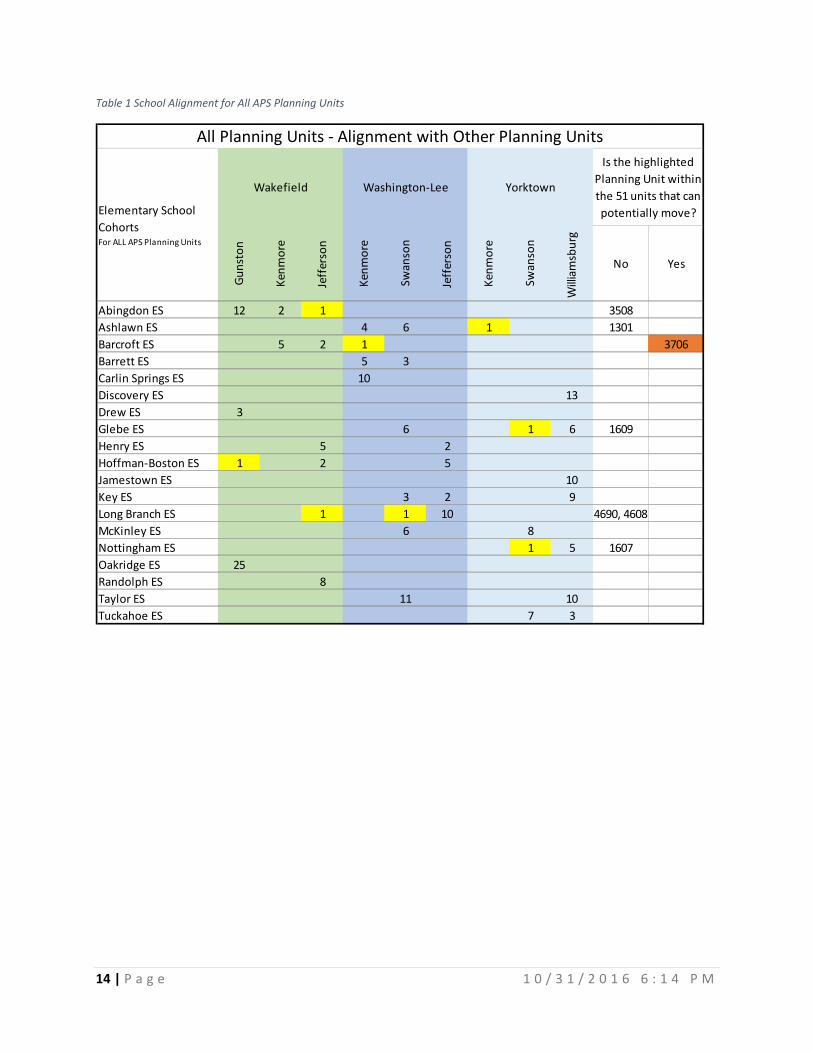
Alignment Policy definition ‐ “Minimizing separation of small groups of students from their classmates when moving between school levels.” Use on baseline spreadsheet – Current 2016‐17 data on neighborhood schools for all planning units was used to look at planning units with unique alignment. Among those identified, only one of the 51 planning units being considered for this refinement process did not meet the alignment criteria.
3706 was assigned a rating of N (no), because students in this planning unit have unique alignment (see Table 1).
All others were assigned a rating of Y (yes). Students in these planning units are joined by another planning unit AND are currently together for at least two school levels.
Demographics (No. of Students Receiving Free/Reduced Cost Lunch) Policy definition ‐ “Promoting demographic diversity” Use on baseline spreadsheet – This is a count of students receiving free or reduced lunch during 2015‐16 school year. “<10” means the number of students is too small to report.
Contiguity Policy definition ‐ “Maintaining attendance zones that are contiguous and contain the school to which students are assigned.” Use on baseline spreadsheet – All planning units were assigned a rating of Y (yes) because planning units not immediately adjacent to an existing attendance zone boundary cannot be moved unless a unit adjacent to a boundary is moved along with it; in other words, no separate attendance "islands" can be created.
1 “Safe transportation to school will be provided at public expense to transport students . . . living beyond a one and one‐half mile walking distance from middle and high schools”
14 | P a g e 1 0 / 3 1 / 2 0 1 6 6 : 1 4 P M
Table 1 School Alignment for All APS Planning Units
Gunston
Kenmore
Jefferson
Kenmore
Swanson
Jefferson
Kenmore
Swanson
Williamsburg
No Yes
Abingdon ES 12 2 1 3508
Ashlawn ES 4 6 1 1301
Barcroft ES 5 2 1 3706
Barrett ES 5 3
Carlin Springs ES 10
Discovery ES 13
Drew ES 3
Glebe ES 6 1 6 1609
Henry ES 5 2
Hoffman‐Boston ES 1 2 5
Jamestown ES 10
Key ES 3 2 9
Long Branch ES 1 1 10 4690, 4608
McKinley ES 6 8
Nottingham ES 1 5 1607
Oakridge ES 25
Randolph ES 8
Taylor ES 11 10
Tuckahoe ES 7 3
Wakefield Washington‐Lee Yorktown
Is the highlighted
Planning Unit within
the 51 units that can
potentially move?
All Planning Units ‐ Alignment with Other Planning Units
Elementary School
Cohorts For ALL APS Planning Units