
High Performance Go - QCon San Francisco · Today we're going to take a look at techniques for...
54
High Performance Go QConSF 2017 13 November 2017 Dave Cheney
Transcript of High Performance Go - QCon San Francisco · Today we're going to take a look at techniques for...

High Performance GoQConSF 2017 �13 November 2017
Dave Cheney

Introduction
Hello, I'm David. �
I'm a software programming from Sydney, Australia. �
I'm a bit of a fan of Go. I help organise GopherCon each year, have been involved with theSydney Go meetup for years, and travel a lot to talk about and teach Go.

Agenda
Today we're going to take a look at techniques for writing high performance Go applications.
We're going to focus on three areas in this presentation:
Benchmarking
Performance measurement and pro�ling
Memory management and GC
The goal is to give you, the audience, the tools you need to measure and improve theperformance of your Go applications.

Benchmarking

Benchmarking
Before you can begin to tune your application, you need to establish a reliable baseline tomeasure the impact of your change to know if you're making things better, or worse.
In other words, "Don't guess, measure"
This section focuses on how to construct useful benchmarks using the Go testingframework, and gives practical tips for avoiding the pitfalls.
Benchmarking is closely related to pro�ling, which we'll touch on during this section, thencover in more detail in the next.

Benchmarking ground rules
Before you benchmark, you must have a stable environment to get repeatable results.
The machine must be idle—don't pro�le on shared hardware, don't browse the webwhile waiting for a long benchmark to run.
Watch out for power saving and thermal scaling.
Avoid virtual machines and shared cloud hosting; they are too noisy for consistentmeasurements.
If you can a�ord it, buy dedicated performance test hardware. Rack it, disable all the powermanagement and thermal scaling and never update the software on those machines.
For everyone else, have a before and after sample and run them multiple times to getconsistent results.
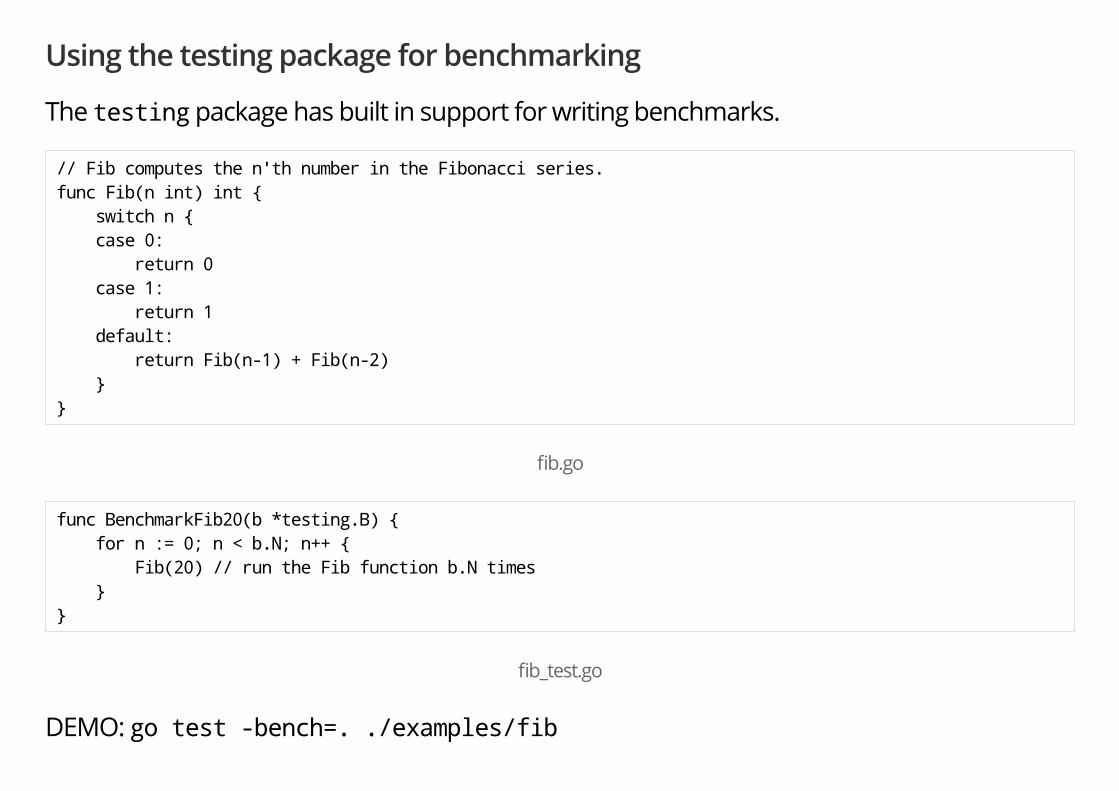
Using the testing package for benchmarking
The testing package has built in support for writing benchmarks.
// Fib computes the n'th number in the Fibonacci series. func Fib(n int) int { switch n { case 0: return 0 case 1: return 1 default: return Fib(n-1) + Fib(n-2) } }
�b.go
func BenchmarkFib20(b *testing.B) { for n := 0; n < b.N; n++ { Fib(20) // run the Fib function b.N times } }
�b_test.go
DEMO: go test -bench=. ./examples/fib

How benchmarks work
Each benchmark is run b.N times until it takes longer than 1 second.
b.N starts at 1, if the benchmark completes in under 1 second b.N is increased and thebenchmark run again.
b.N increases in the approximate sequence; 1, 2, 3, 5, 10, 20, 30, 50, 100, ...
% go test -bench=. ./examples/fib BenchmarkFib20-4 30000 46408 ns/op PASS ok _/Users/dfc/devel/high-performance-go-workshop/examples/fib 1.910s
Beware: below the μs mark you will start to see the relativistic e�ects of instructionreordering and code alignment.
Run benchmarks longer to get more accuracy; go test -benchtime=10s
Tip: If this is required, codify it in a Makefile so everyone is comparing apples to apples.

Comparing benchmarks
For repeatable results, you should run benchmarks multiple times.
You can do this manually, or use the -count �ag.
% go test -bench=. -count=10 | tee old.txt goos: darwin goarch: amd64 BenchmarkFib20-4 30000 52201 ns/op BenchmarkFib20-4 30000 53010 ns/op BenchmarkFib20-4 30000 50739 ns/op BenchmarkFib20-4 30000 51434 ns/op BenchmarkFib20-4 30000 51697 ns/op BenchmarkFib20-4 30000 52610 ns/op BenchmarkFib20-4 30000 53618 ns/op BenchmarkFib20-4 30000 51615 ns/op BenchmarkFib20-4 30000 52105 ns/op BenchmarkFib20-4 30000 52031 ns/op PASS ok _/Users/dfc/devel/qconsf-2017/examples/fib 21.035s

Comparing benchmarks (cont.)
Determining the performance delta between two sets of benchmarks can be tedious anderror prone.
% go test -bench=. -count=10 | tee old.txt
DEMO: Improve Fib
% go test -bench=. -count=10 | tee new.txt
Tools like rsc.io/benchstat (https://godoc.org/rsc.io/benchstat) are useful for comparing results.
% go get -u rsc.io/benchstat % benchstat {old,new}.txt name old time/op new time/op delta Fib-4 59.4µs ±11% 37.1µs ± 9% -37.56% (p=0.000 n=20+20)
Tip: p values above 0.05 are suspect, increase -count to add more samples.

Avoid benchmarking start up costs
Sometimes your benchmark has a once per run setup cost. b.ResetTimer() will can beused to ignore the time accrued in setup.
func BenchmarkExpensive(b *testing.B) { boringAndExpensiveSetup() b.ResetTimer() for n := 0; n < b.N; n++ { // function under test } }
If you have some expensive setup logic per loop iteration, use b.StopTimer() andb.StartTimer() to pause the benchmark timer.
func BenchmarkComplicated(b *testing.B) { for n := 0; n < b.N; n++ { b.StopTimer() complicatedSetup() b.StartTimer() // function under test } }

Benchmarking allocations
Allocation count and size is strongly correlated with benchmark time.
You can tell the testing framework to record the number of allocations made by codeunder test.
package q func BenchmarkRead(b *testing.B) { b.ReportAllocs() for n := 0; n < b.N; n++ { // function under test } }
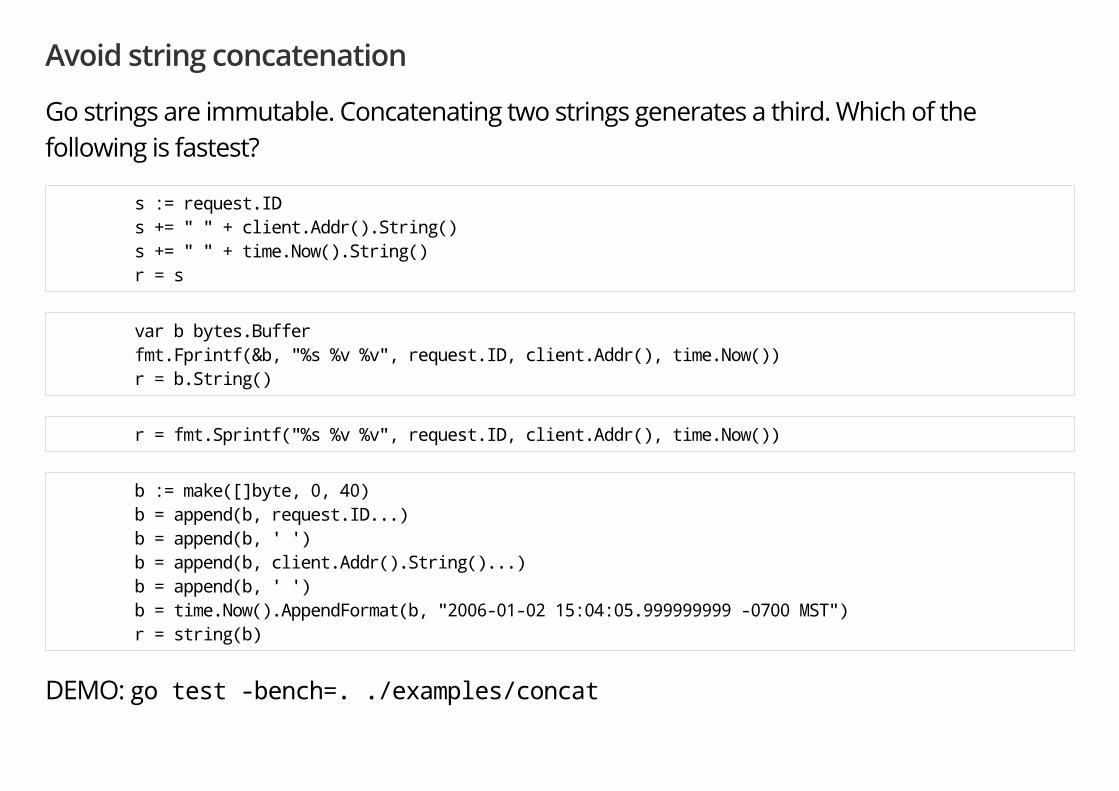
Avoid string concatenation
Go strings are immutable. Concatenating two strings generates a third. Which of thefollowing is fastest?
s := request.ID s += " " + client.Addr().String() s += " " + time.Now().String() r = s
var b bytes.Buffer fmt.Fprintf(&b, "%s %v %v", request.ID, client.Addr(), time.Now()) r = b.String()
r = fmt.Sprintf("%s %v %v", request.ID, client.Addr(), time.Now())
b := make([]byte, 0, 40) b = append(b, request.ID...) b = append(b, ' ') b = append(b, client.Addr().String()...) b = append(b, ' ') b = time.Now().AppendFormat(b, "2006-01-02 15:04:05.999999999 -0700 MST") r = string(b)
DEMO: go test -bench=. ./examples/concat

Watch out for compiler optimisations
This example comes from issue 14813 (https://github.com/golang/go/issues/14813#issue-140603392) .
const m1 = 0x5555555555555555 const m2 = 0x3333333333333333 const m4 = 0x0f0f0f0f0f0f0f0f const h01 = 0x0101010101010101 func popcnt(x uint64) uint64 { x -= (x >> 1) & m1 x = (x & m2) + ((x >> 2) & m2) x = (x + (x >> 4)) & m4 return (x * h01) >> 56 } func BenchmarkPopcnt(b *testing.B) { for n := 0; n < b.N; n++ { popcnt(uint64(n)) } }
How fast will this function benchmark?
% go test -bench=. ./examples/popcnt

What happened?
popcnt is a leaf function, so the compiler can inline it.
Because the function is inlined, the compiler can see it has no side e�ects, so the call iseliminated. This is what the compiler sees:
func BenchmarkPopcnt(b *testing.B) { for n := 0; n < b.N; n++ { // optimised away } }
The same optimisations that make real code fast, by removing unnecessary computation,are the same ones that remove benchmarks that have no observable side e�ects.
This is only going to get more common as the Go compiler improves.
DEMO: show how to �x popcnt

Performance measurement and pro�ling

Performance measurement and pro�ling
testing.B is useful for microbenchmarks.
Microbenchmarks are useful for tuning the performance of a hot piece of code, but it'simpractical (and unreliable) to write a testing.B benchmark for entire programs–you'd getmore reliable results with time(1).
In this section we'll explore the pro�ling tools built into Go to investigate the operation of theprogram from the inside.
pprof
The �rst tool we're going to be talking about today is pprof.
pprof (https://github.com/google/pprof) descends from the Google Perf Tools (https://github.com/gperftools/gperftools) suite.
pprof pro�ling is built into the Go runtime.
It consists of two parts:
runtime/pprof package built into every Go program
go tool pprof for investigating pro�les.

CPU pro�ling
CPU pro�ling is the most common type of pro�le, and the most obvious.
When CPU pro�ling is enabled the runtime will interrupt itself every 10ms and record thestack trace of the currently running goroutines.
Once the pro�le is complete we can analyse it to determine the hottest code paths.
The more times a function appears in the pro�le, the more time that code path is taking as apercentage of the total runtime.

Memory pro�ling
Memory pro�ling records the stack trace when a heap allocation is made.
Stack allocations are assumed to be free and are not tracked in the memory pro�le.
Memory pro�ling, like CPU pro�ling is sample based, by default memory pro�ling samples 1in every 1000 allocations. This rate can be changed.
Because of memory pro�ling is sample based and because it tracks allocations not use, usingmemory pro�ling to determine your application's overall memory usage is di�cult.

Other supported pro�les
Block pro�ling is similar to a CPU pro�le, but it records the amount of time a goroutine spentwaiting for a shared resource.
Block pro�ling can show you when a large number of goroutines could make progress, butwere blocked. This can be useful for determining concurrency bottlenecks in your application.Blocking includes:
Sending or receiving on a unbu�ered channel.
Sending to a full channel, receiving from an empty one.
Trying to Lock a sync.Mutex that is locked by another goroutine.
Mutex pro�ling records the stack traces of the holder of a contended mutex.
Thread creation pro�ling records the stack traces that led to the creation of new OS threads.
These are very specialised tools and should not be used until you believe you haveeliminated all your CPU and memory usage bottlenecks. In the interests of time, I'm only going to talk about CPU pro�ling.

One pro�le at at time
Pro�ling is not free.
Pro�ling has a moderate, but measurable impact on program performance—especially ifyou increase the memory pro�le sample rate.
Most tools will not stop you from enabling multiple pro�les at once.
If you enable multiple pro�le's at the same time, they will observe their own interactions andthrow o� your results.
Do not enable more than one kind of pro�le at a time.
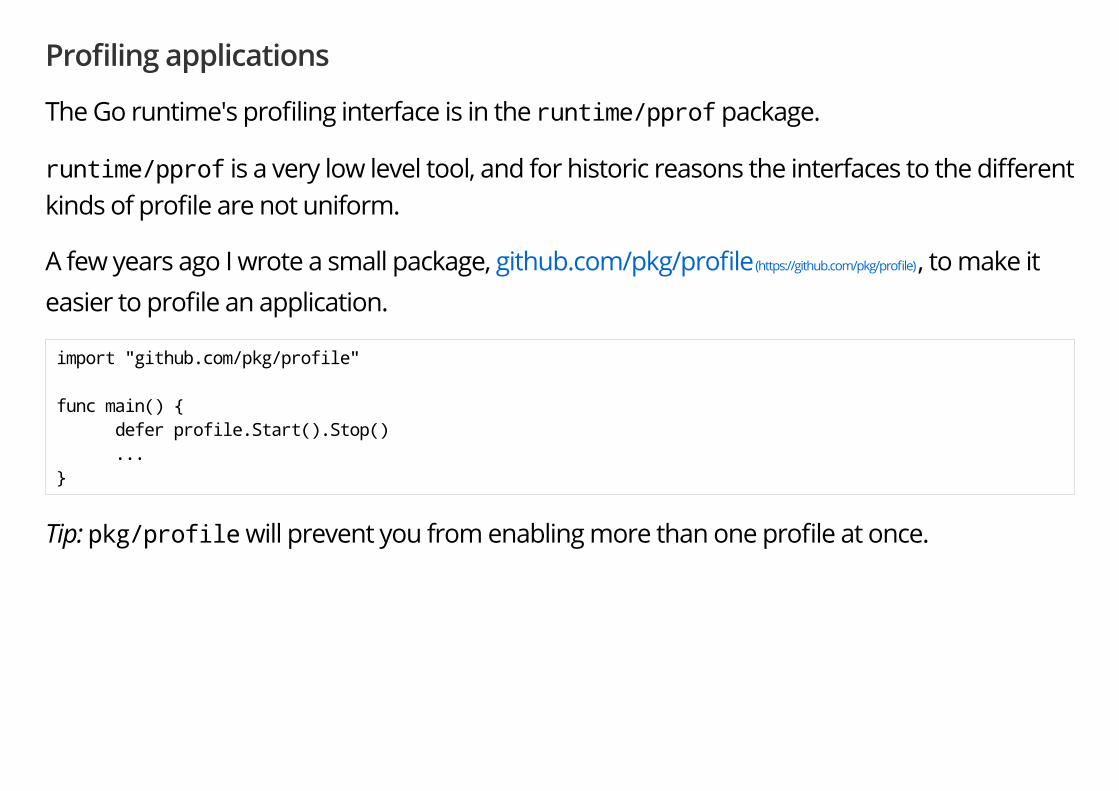
Pro�ling applications
The Go runtime's pro�ling interface is in the runtime/pprof package.
runtime/pprof is a very low level tool, and for historic reasons the interfaces to the di�erentkinds of pro�le are not uniform.
A few years ago I wrote a small package, github.com/pkg/pro�le (https://github.com/pkg/pro�le) , to make iteasier to pro�le an application.
import "github.com/pkg/profile" func main() { defer profile.Start().Stop() ... }
Tip: pkg/profile will prevent you from enabling more than one pro�le at once.

Pro�ling godoc
DEMO: add CPU pro�ling to godoc.
1. edit $GOPATH/src/golang.org/x/tools/cmd/godoc/main.go, add
defer profile.Start(profile.CPUProfile).Stop()
2. go install -v golang.org/x/tools/cmd/godoc 3. godoc -http=:8000 4. go tool pprof $PROFILE

Using pprof
Now that I've talked about what pprof can measure, I will talk about how to use pprof toanalyse a pro�le.
Starting with Go 1.9, pprof only requires one argument.
go tool pprof $PROFILE
Tip: If you're using Go 1.8, pprof takes two arguments and will produce the wrong result ifyou give it just one. Upgrade to Go 1.9.

Using pprof (cont.)
This is a sample CPU pro�le:
% go tool pprof /tmp/c.p Entering interactive mode (type "help" for commands) (pprof) top Showing top 15 nodes out of 63 (cum >= 4.85s) flat flat% sum% cum cum% 21.89s 9.84% 9.84% 128.32s 57.71% net.(*netFD).Read 17.58s 7.91% 17.75% 40.28s 18.11% runtime.exitsyscall 15.79s 7.10% 24.85% 15.79s 7.10% runtime.newdefer 12.96s 5.83% 30.68% 151.41s 68.09% test_frame/connection.(*ServerConn).readBytes 11.27s 5.07% 35.75% 23.35s 10.50% runtime.reentersyscall 10.45s 4.70% 40.45% 82.77s 37.22% syscall.Syscall 9.38s 4.22% 44.67% 9.38s 4.22% runtime.deferproc_m 9.17s 4.12% 48.79% 12.73s 5.72% exitsyscallfast 8.03s 3.61% 52.40% 11.86s 5.33% runtime.casgstatus 7.66s 3.44% 55.85% 7.66s 3.44% runtime.cas 7.59s 3.41% 59.26% 7.59s 3.41% runtime.onM 6.42s 2.89% 62.15% 134.74s 60.60% net.(*conn).Read 6.31s 2.84% 64.98% 6.31s 2.84% runtime.writebarrierptr 6.26s 2.82% 67.80% 32.09s 14.43% runtime.entersyscall
Often this output is hard to understand.

Using pprof (cont.)
A better way to understand your pro�le is to visualise it.
% go tool pprof /tmp/c.p Entering interactive mode (type "help" for commands) (pprof) web
Opens a web page with a graphical display of the pro�le.
images/pro�le.svg (images/pro�le.svg)
Note: visualisation requires graphviz.
I �nd this method to be superior to the text mode, I strongly recommend you try it.
pprof also supports these modes in a non interactive form with �ags like -svg, -pdf, etc. Seego tool pprof -help for more details.
Further reading: Pro�ling Go programs (http://blog.golang.org/pro�ling-go-programs)
Further reading: Debugging performance issues in Go programs (https://software.intel.com/en-
us/blogs/2014/05/10/debugging-performance-issues-in-go-programs)

Pro�ling benchmarks
The testing package has built in support for generating CPU, memory, and block pro�les.
-cpuprofile=$FILE writes a CPU pro�le to $FILE.
-memprofile=$FILE, writes a memory pro�le to $FILE, -memprofilerate=N adjusts thepro�le rate to 1/N.
-blockprofile=$FILE, writes a block pro�le to $FILE.
Example: Running benchmarks of the bytes package.
% go test -run=XXX -bench=. -cpuprofile=c.p bytes % go tool pprof c.p
Note: use -run=XXX to disable tests, you only want to pro�le benchmarks. You can also use -run=^$ to accomplish the same thing.

Go Execution tracer
The execution tracer was developed by Dmitry Vyukov (https://github.com/dvyukov) for Go 1.5 and remainedunder documented, and under utilised, until last year.
Unlike sample based pro�ling, the execution tracer is integrated into the Go runtime, so itdoesn't just know what a Go program is doing at a particular point in time, but why.
Captures with nanosecond precision:
goroutine creation/start/end
goroutine blocking/unblocking
network blocking
system calls
GC events

go tool trace
Before we go on there are some things we should talk about the usage of the trace tool.
The tool uses the javascript debugging support built into Chrome. Trace pro�les can onlybe viewed in Chrome, they won't work in Firefox, Safari, IE/Edge. Sorry.
Because this is a Google product, it supports keyboard shortcuts; use WASD to navigate,use ? to get a list.
Viewing traces can take a lot of memory. Seriously, 4Gb won't cut it, 8Gb is probably theminimum, more is de�nitely better.

go tool trace (cont.)
DEMO: add an execution trace to godoc.
1. edit $GOPATH/src/golang.org/x/tools/cmd/godoc/main.go, add
defer profile.Start(profile.TraceProfile).Stop()
2. go install -v golang.org/x/tools/cmd/godoc 3. godoc -http=:8000 4. go tool trace $PROFILE

Tracing running applications
In the previous examples we ran the trace over the whole program.
As you saw, traces can be very large, even for small amounts of time, so collecting trace datacontinually would generate far too much data. Also, tracing can have an impact on the speedof your program, especially if there is a lot of activity.
What we want is a way to collect a short trace from a running program.
Fortuntately, the net/http/pprof package has just such a facility. Adding this line to yourmain package:
import _ "net/http/pprof"
It will register tracing and pro�ling routes with http.DefaultServeMux.

Mandelbrot microservice
It's 2017, generating Mandelbrots is pointless unless you can o�er them on the internet as amicrosevice.
Thus, I present to you, Mandelweb
% go run examples/mandelweb/mandelweb.go 2017/09/17 15:29:21 listening on http://127.0.0.1:8080/
127.0.0.1:8080/mandelbrot (http://127.0.0.1:8080/mandelbrot)
We can grab a �ve second trace from mandelweb with curl (or wget)
curl -o trace.out http://127.0.0.1:8080/debug/pprof/trace?seconds=5

Generating some load
The previous example was interesting, but an idle webserver has, by de�nition, noperformance issues. We need to generate some load. For this I'm using hey by JBD(https://github.com/rakyll/hey) .
go get -u github.com/rakyll/hey
Let's start with one request per second.
hey -c 1 -n 1000 -q 1 http://127.0.0.1:8080/mandelbrot
And with that running, in another window collect the trace
% curl -o trace.out http://127.0.0.1:8080/debug/pprof/trace?seconds=5 % Total % Received % Xferd Average Speed Time Time Time Current Dload Upload Total Spent Left Speed 100 66169 0 66169 0 0 13233 0 --:--:-- 0:00:05 --:--:-- 17390 % go tool trace trace.out 2017/09/17 16:09:30 Parsing trace... 2017/09/17 16:09:30 Serializing trace... 2017/09/17 16:09:30 Splitting trace... 2017/09/17 16:09:30 Opening browser. Trace viewer is listening on http://127.0.0.1:60301

Further reading
Rhys Hiltner, Go's execution tracer (https://www.youtube.com/watch?v=mmqDlbWk_XA) (dotGo 2016)
Rhys Hiltner, An Introduction to "go tool trace" (https://www.youtube.com/watch?v=V74JnrGTwKA) (GopherCon 2017)
Dave Cheney, Seven ways to pro�le Go programs (https://www.youtube.com/watch?v=2h_NFBFrciI) (GolangUK2016)
Dave Cheney, High performance Go workshop (https://dave.cheney.net/training#high-performance-go)
Francesc Campoy, just for func #22: using the Go execution tracer (https://www.youtube.com/watch?
v=ySy3sR1LFCQ)

Memory management and GC

Memory management and GC
Go is a garbage collected language. This is a design principle, it will not change.
As a garbage collected language, the performance of Go programs is often determined bytheir interaction with the garbage collector.
Next to your choice of algorithms, memory consumption is the most important factor thatdetermines the performance and scalability of your application.
This section discusses the operation of the garbage collector and strategies for loweringmemory usage if garbage collector performance is a bottleneck.

Go GC is focused on reducing latency
The purpose of a garbage collector is to present the illusion that there is an in�nite amountof memory available to the program.
You may disagree with this statement, but this is the base assumption of how garbagecollector designers think.
The Go GC is designed for low latency servers and interactive applications.
The Go GC favors lower latency over maximum throughput; it moves some of the allocationcost to the mutator to reduce the cost of cleanup later.

Garbage collector design
The design of the Go GC has changed over the years
Go 1.0, stop the world mark sweep collector based heavily on tcmalloc.
Go 1.3, fully precise collector, wouldn't mistake big numbers on the heap for pointers,thus leaking memory.
Go 1.5, new GC design, focusing on latency over throughput.
Go 1.6, GC improvements, handling larger heaps with lower latency.
Go 1.7, small GC improvements, mainly refactoring.
Go 1.8–1.9, further work to reduce STW times, now down to the 100 microsecond range.
Go 1.10, ROC collector is an experiment to extend the idea of escape analysis pergoroutine.

Garbage collector monitoring
A simple way to obtain a general idea of how hard the garbage collector is working is toenable the output of GC logging.
These stats are always collected, but normally suppressed, you can enable their display bysetting the GODEBUG environment variable.
% env GODEBUG=gctrace=1 godoc -http=:8000 gc 1 @0.017s 8%: 0.021+3.2+0.10+0.15+0.86 ms clock, 0.043+3.2+0+2.2/0.002/0.009+1.7 ms cpu, 5->6->1 MB, 4gc 2 @0.026s 12%: 0.11+4.9+0.12+1.6+0.54 ms clock, 0.23+4.9+0+3.0/0.50/0+1.0 ms cpu, 4->6->3 MB, 6 MB gogc 3 @0.035s 14%: 0.031+3.3+0.76+0.17+0.28 ms clock, 0.093+3.3+0+2.7/0.012/0+0.84 ms cpu, 4->5->3 MB, 3 gc 4 @0.042s 17%: 0.067+5.1+0.15+0.29+0.95 ms clock, 0.20+5.1+0+3.0/0/0.070+2.8 ms cpu, 4->5->4 MB, 4 MB gc 5 @0.051s 21%: 0.029+5.6+0.33+0.62+1.5 ms clock, 0.11+5.6+0+3.3/0.006/0.002+6.0 ms cpu, 5->6->4 MB, 5 gc 6 @0.061s 23%: 0.080+7.6+0.17+0.22+0.45 ms clock, 0.32+7.6+0+5.4/0.001/0.11+1.8 ms cpu, 6->6->5 MB, 7 gc 7 @0.071s 25%: 0.59+5.9+0.017+0.15+0.96 ms clock, 2.3+5.9+0+3.8/0.004/0.042+3.8 ms cpu, 6->8->6 MB, 8
The trace output gives a general measure of GC activity.
DEMO: Show godoc with GODEBUG=gctrace=1 enabled
Recommendation: use this env var in production, it has no performance impact.

Garbage collector monitoring (cont.)
Using GODEBUG=gctrace=1 is good when you know there is a problem, but for generaltelemetry on your Go application I recommend the net/http/pprof interface.
import _ "net/http/pprof"
Importing the net/http/pprof package will register a handler at /debug/pprof withvarious runtime metrics, including:
A list of all the running goroutines, /debug/pprof/heap?debug=1.
A report on the memory allocation statistics, /debug/pprof/heap?debug=1.
Warning: net/http/pprof will register itself with your default http.ServeMux.
Be careful as this will be visible if you use http.ListenAndServe(address, nil).
DEMO: godoc -http=:8080, show /debug/pprof.
Garbage collector tuning
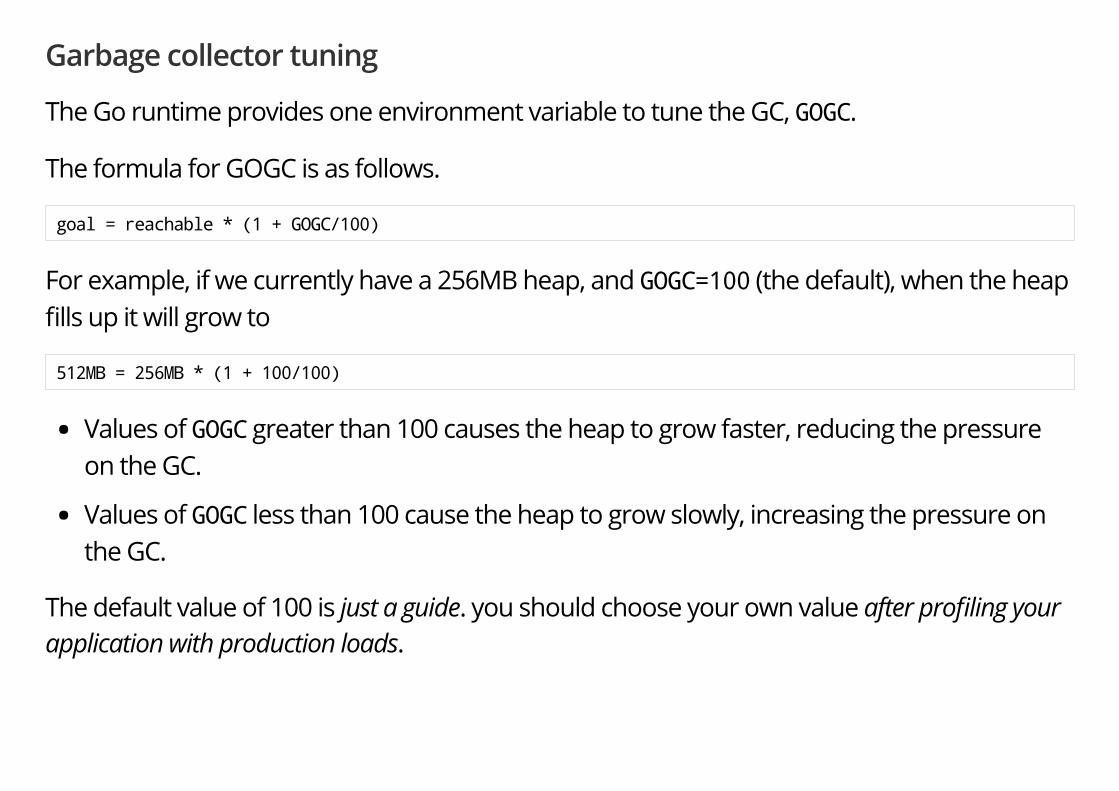
The Go runtime provides one environment variable to tune the GC, GOGC.
The formula for GOGC is as follows.
goal = reachable * (1 + GOGC/100)
For example, if we currently have a 256MB heap, and GOGC=100 (the default), when the heap�lls up it will grow to
512MB = 256MB * (1 + 100/100)
Values of GOGC greater than 100 causes the heap to grow faster, reducing the pressureon the GC.
Values of GOGC less than 100 cause the heap to grow slowly, increasing the pressure onthe GC.
The default value of 100 is just a guide. you should choose your own value after pro�ling yourapplication with production loads.

Reduce allocations
Make sure your APIs allow the caller to reduce the amount of garbage generated.
Consider these two Read methods
func (r *Reader) Read() ([]byte, error) func (r *Reader) Read(buf []byte) (int, error)
The �rst Read method takes no arguments and returns some data as a []byte. The secondtakes a []byte bu�er and returns the amount of bytes read.
The �rst Read method will always allocate a bu�er, putting pressure on the GC. The second�lls the bu�er it was given.

strings and []bytes
In Go string values are immutable, []byte are mutable.
Most programs prefer to work string, but most IO is done with []byte.
Avoid []byte to string conversions wherever possible, this normally means picking onerepresentation, either a string or a []byte for a value. Often this will be []byte if you readthe data from the network or disk.
The bytes (https://golang.org/pkg/bytes/) package contains many of the same operations— Split, Compare,HasPrefix, Trim, etc—as the strings (https://golang.org/pkg/strings/) package.
Under the hood strings uses same assembly primitives as the bytes package.

Preallocate slices if the length is known
Append is convenient, but wasteful.
Slices grow by doubling up to 1024 elements, then by approximately 25% after that. What isthe capacity of b after we append one more item to it?
If you use the append pattern you could be copying a lot of data and creating a lot ofgarbage.
func main() { b := make([]int, 1024) b = append(b, 99) fmt.Println("len:", len(b), "cap:", cap(b)) } Run
Preallocate slices if the length is known (cont.)
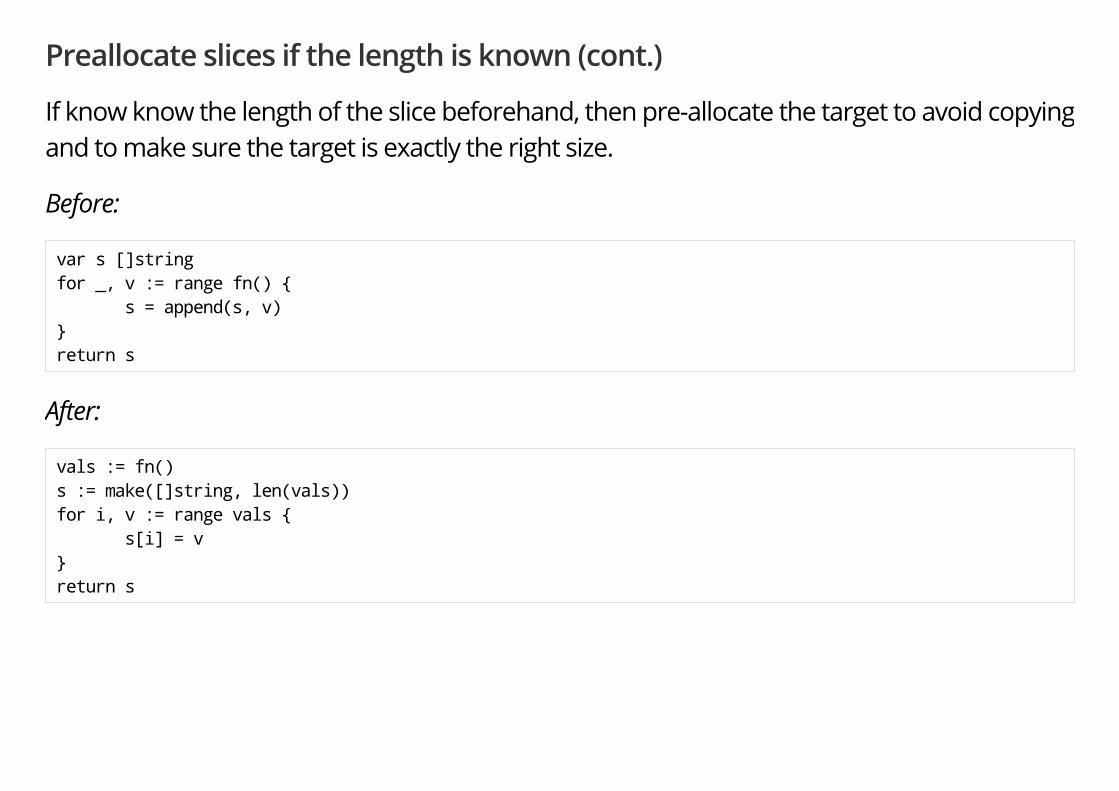
If know know the length of the slice beforehand, then pre-allocate the target to avoid copyingand to make sure the target is exactly the right size.
Before:
var s []string for _, v := range fn() { s = append(s, v) } return s
After:
vals := fn() s := make([]string, len(vals)) for i, v := range vals { s[i] = v } return s

Using sync.Pool
The sync package comes with a sync.Pool type which is used to reuse common objects.
sync.Pool has no �xed size or maximum capacity. You add to it and take from it until a GChappens, then it is emptied unconditionally.
var pool = sync.Pool{New: func() interface{} { return make([]byte, 4096) }} func fn() { buf := pool.Get().([]byte) // takes from pool or calls New // do work pool.Put(buf) // returns buf to the pool }
Warning: sync.Pool is not a cache. It can and will be emptied at any time.
Do not place important items in a sync.Pool, they will be discarded.

Use streaming IO interfaces
Where-ever possible avoid reading data into a []byte and passing it around.
Depending on the request you may end up reading megabytes (or more!) of data intomemory. This places huge pressure on the GC, which will increase the average latency ofyour application.
Instead use io.Reader and io.Writer to construct processing pipelines to cap the amountof memory in use per request.
For e�ciency, consider implementing io.ReaderFrom / io.WriterTo if you use a lot ofio.Copy. These interface are more e�cient and avoid copying memory into a temporarybu�er.

Conclusion

Conclusion
Start with the simplest possible code.
Measure. Pro�le your code to identify the bottlenecks, do not guess.
If performance is good, stop. You don't need to optimise everything, only the hottest parts ofyour code.
As your application grows, or your tra�c pattern evolves, the performance hot spots willchange.
Don't leave complex code that is not performance critical, rewrite it with simpler operations ifthe bottleneck moves elsewhere.

Conclusion (cont.)
Always write the simplest code you can, the compiler is optimised for normal code.
Shorter code is faster code; Go is not C++, do not expect the compiler to unravel complicatedabstractions.
Shorter code is smaller code; which is important for the CPU's cache.
Pay very close attention to allocations, avoid unnecessary allocation where possible.

Don't trade performance for reliability
"I can make things very fast if they don't have to be correct."Russ Cox
"Readable means reliable"Rob Pike
Performance and reliability are equally important.
I see little value in making a very fast server that panics, deadlocks or OOMs on a regularbasis.
Don't trade performance for reliability

Thank you
Dave [email protected] (mailto:[email protected])
http://dave.cheney.net/ (http://dave.cheney.net/)
@davecheney (http://twitter.com/davecheney)


![SED686 - Database Performance and Optimization · 2018-10-03 · SED 686 Transcript [00:02:31] JM: I have learned a ton from QCon. QCon San Francisco takes place this year, November](https://static.fdocuments.us/doc/165x107/5f4a16806e8dc261cd363ce2/sed686-database-performance-and-optimization-2018-10-03-sed-686-transcript-000231.jpg)