High-Performance Global Account Management Teams… · · 2011-06-28High-Performance Global...
225
High-Performance Global Account Management Teams: Design Dimensions, Processes and Outcomes DISSERTATION of the University of St. Gallen, Graduate School of Business Administration, Economics, Law and Social Sciences (HSG) to obtain the title of Doctor of Business Administration submitted by Yana Atanasova from Bulgaria Approved on the application of Prof. Winfried Ruigrok, PhD and Dr. Christoph Senn Dissertation no. 3324 Gutenberg AG, Schaan 2007
Transcript of High-Performance Global Account Management Teams… · · 2011-06-28High-Performance Global...
High-Performance Global Account Management Teams: Design Dimensions, Processes and Outcomes
DISSERTATION of the University of St. Gallen,
Graduate School of Business Administration, Economics, Law and Social Sciences (HSG)
to obtain the title of Doctor of Business Administration
submitted by
Yana Atanasova from
Bulgaria
Approved on the application of
Prof. Winfried Ruigrok, PhD and
Dr. Christoph Senn
Dissertation no. 3324
Gutenberg AG, Schaan 2007

The University of St. Gallen, Graduate School of Business Administration,
Economics, Law and Social Sciences (HSG) hereby consents to the printing of
the present dissertation, without hereby expressing any opinion on the views
herein expressed.
St. Gallen, May 21, 2007
The President:
Prof. Ernst Mohr, PhD

Acknowledgements
This dissertation has been a very challenging and interesting endeavor, which would have been impossible without the contributions of a number of persons. Therefore, I would like to thank all the people who supported me throughout this ambitious project. I am particularly grateful to all managers who participated in the empirical part of the study and gave me the opportunity to learn more about their companies. Sincere thanks to all interviewees who took time to discuss the topics with me as well as to all survey sponsors who showed interest in my work and helped me to make it a success – Andrew Payne from Halcrow, Heinz Felber and Michael Merz from Hilti, Richard Willems from Honeywell, Steve Richard from Marriott, Bart Logghe from Philips, and Teri Walker from Xerox. Thank you also to Elisabeth Cornell from the Strategic Account Management Association who provided me with valuable contacts and study materials. I would like to thank my supervisors Dr. Christoph Senn and Prof. Winfried Ruigrok. Throughout the last years, I had the opportunity to work on a lot of interesting projects in the area of global account management with Dr. Christoph Senn and my colleague and fellow doctoral student Axel Thoma and I am very grateful to them for the many enriching discussions. This dissertation profited greatly also from the statistical support of Dr. Jürg Schwarz from the University of Zurich whose guidance taught me a lot about analytical methods and resulted in very interesting research findings in the study. Furthermore, I benefited from the financial support of the Research Commission of the University of St. Gallen that awarded me the Central Europe Scholarship to finance the final stages of my research. Last but not least I would like to thank all my friends and loved ones. Many thanks to Yanko Djinkov, Sabina Tacheva and Mladen Rikanovic for always being there for me to offer feedback and encouragement. Warm thanks to Claudio Castagnetti for the many wonderful moments that made my “life outside the dissertation” a truly happy one. Undoubtedly, my family has been the greatest source of strength throughout my years of research and education. My parents Mariana and Cvetan Atanasovi and my brother Philip have always believed in me and have been a pillar of reassurance and comfort for me. So it is with great gratitude and love that I dedicate this work to them. Zurich, July 2007 Yana Atanasova

Abstract
Designing and implementing global account management (GAM) teams represents a
key task for suppliers that are expanding the scope of their relationships with global
customers. However, research has not provided an explanation of how these teams
function and what determines their performance. Extending concepts from several
research streams regarding teams in an organization to the complex GAM context, this
dissertation develops and empirically tests a framework of GAM team design and
performance. The results indicate that team performance is directly influenced by three
team processes: communication and collaboration, conflict management, and
proactiveness. Team design in terms of goal and role definition, customer coverage,
empowerment, heterogeneity, skills adequacy and leadership has an indirect influence
on performance, mediated by the three team processes. In addition, three factors from
the organizational environment – top management support, rewards and incentives,
and training – have similar indirect effects. From a theoretical perspective, this study
makes a contribution by examining this new and emerging organizational form and
extending existing research in the area of supplier-customer relationships and
organizational behavior. From a practical point of view, it identifies key success
factors of GAM teams, and thus, aims to help companies achieve better performance
with their strategic customers.
i
Table of Contents
List of figures................................................................................................................. iii List of tables................................................................................................................... iv List of abbreviations ....................................................................................................... v
1. Introduction............................................................................................................... 1 1.1. Background and relevance ................................................................................... 1 1.2. Objective and research questions ......................................................................... 4 1.3. Study outline ........................................................................................................ 6
2. Literature review ...................................................................................................... 8 2.1. Global account management ................................................................................ 8
2.1.2. GAM literature overview ............................................................................ 10 2.1.3. Reasons for implementing GAM ................................................................ 11 2.1.4. GAM relationship development .................................................................. 14 2.1.5. Strategy........................................................................................................ 17 2.1.6. GAM/KAM configuration........................................................................... 18 2.1.7. GAM performance....................................................................................... 26 2.1.8. Limitations................................................................................................... 31
2.2. Small groups in the organization........................................................................ 33 2.2.1. Definitions ................................................................................................... 33 2.2.2. Small group effectiveness models and frameworks .................................... 36 2.2.3. Limitations................................................................................................... 42
2.3. Cross-functional teams....................................................................................... 44 2.3.1. Functional diversity ..................................................................................... 44 2.3.2. External activity........................................................................................... 48 2.3.3. Limitations................................................................................................... 51
2.4. Sales teams ......................................................................................................... 53 2.4.1. Team selling definition................................................................................ 53 2.4.2. Functional interdependence......................................................................... 54 2.4.3. Selling center composition .......................................................................... 56 2.4.4. Roles of selling center members ................................................................. 57 2.4.5. Selling team frameworks............................................................................. 58 2.4.6. Limitations................................................................................................... 62
2.5. Summary of research gaps ................................................................................. 62 3. Conceptual framework........................................................................................... 63
3.1. Framework development.................................................................................... 63 3.1.1. Overview ..................................................................................................... 63 3.1.2. Qualitative study description....................................................................... 64 3.1.3. Summary findings from the qualitative study ............................................. 66
3.2. Conceptual framework ....................................................................................... 69 3.2.1. GAM team design........................................................................................ 70 3.2.2. Organizational context................................................................................. 83 3.2.3. Team processes............................................................................................ 89 3.2.4. GAM team performance.............................................................................. 98

ii
4. Empirical study ..................................................................................................... 101 4.1. Method ............................................................................................................. 102 4.2. Sample.............................................................................................................. 103 4.3. Questionnaire ................................................................................................... 106 4.4. Variable operationalization .............................................................................. 107
4.4.1. Dependent variables .................................................................................. 108 4.4.2. Independent variables................................................................................ 109 4.4.3. Control variables ....................................................................................... 112
4.5. Data collection procedures ............................................................................... 113 4.6. Data analysis procedures.................................................................................. 114
5. Results .................................................................................................................... 116 5.1. Sample description ........................................................................................... 116 5.2. Examination for potential biases...................................................................... 120
5.2.1. Nonresponse bias....................................................................................... 120 5.2.2. Common method bias................................................................................ 122
5.3. Examination of the variables............................................................................ 122 5.4. Reliability and item analysis ............................................................................ 124 5.5. Results of the exploratory factor analysis ........................................................ 127 5.6. Results of the confirmatory factor analysis...................................................... 134 5.7. Test of the structural path model...................................................................... 141
5.7.1. Results of the model test............................................................................ 141 5.7.2. Effect sizes................................................................................................. 145
5.8. Comparison among performance groups ......................................................... 147
6. Discussion and conclusions .................................................................................. 150 6.1 Key findings: What are the key elements of GAM team design?..................... 151 6.2 Key findings: How does GAM team design influence team performance? ..... 154 6.3 Key findings: What other factors have an influence on GAM team performance?........................................................................................................... 157 6.4 Contributions to theory ..................................................................................... 158 6.5 Managerial implications.................................................................................... 160 6.6 Limitations and suggestions for further research.............................................. 163 6.7 Concluding remarks .......................................................................................... 165
Bibliography ............................................................................................................... 166 Appendix A: Account Management Literature .......................................................... 190 Appendix B: Organizational Team Models ................................................................ 198 Appendix C: Selling Team Models ............................................................................ 201 Appendix D: List of Interviews .................................................................................. 203 Appendix E: Interview Questionnaire ........................................................................ 205 Appendix F: Survey questionnaire ............................................................................. 206 Appendix G: Means, standard deviations and correlations ........................................ 211 Appendix H: CFA results for the first-order constructs ............................................. 213 Appendix I: Full structural path model....................................................................... 215

iii
List of figures
Figure 1: Interactions of traditional selling and GAM…………………………………2
Figure 2: Study outline………………………………………..………………………..6
Figure 3: A typology of global vendor-customer relationships……………….…........13
Figure 4: Development stages in the GAM relationship……………………..……….15
Figure 5: Conceptual framework………………………………………………..…….69
Figure 6: Summary of the sequence of data analysis……………………….……….115
Figure 7: Respondents by company………………………………………….……...116
Figure 8: Respondents by country…………………………………………..……….117
Figure 9: Respondents’ position……………………………………………………..117
Figure 10: Respondents’ team tenure………………………………………..………118
Figure 11: Respondents’ organizational tenure……………………………………...119
Figure 12: Structural path model 1…………………………………………..………142
Figure 13: Structural path model 2………………………………………………..…143
iv
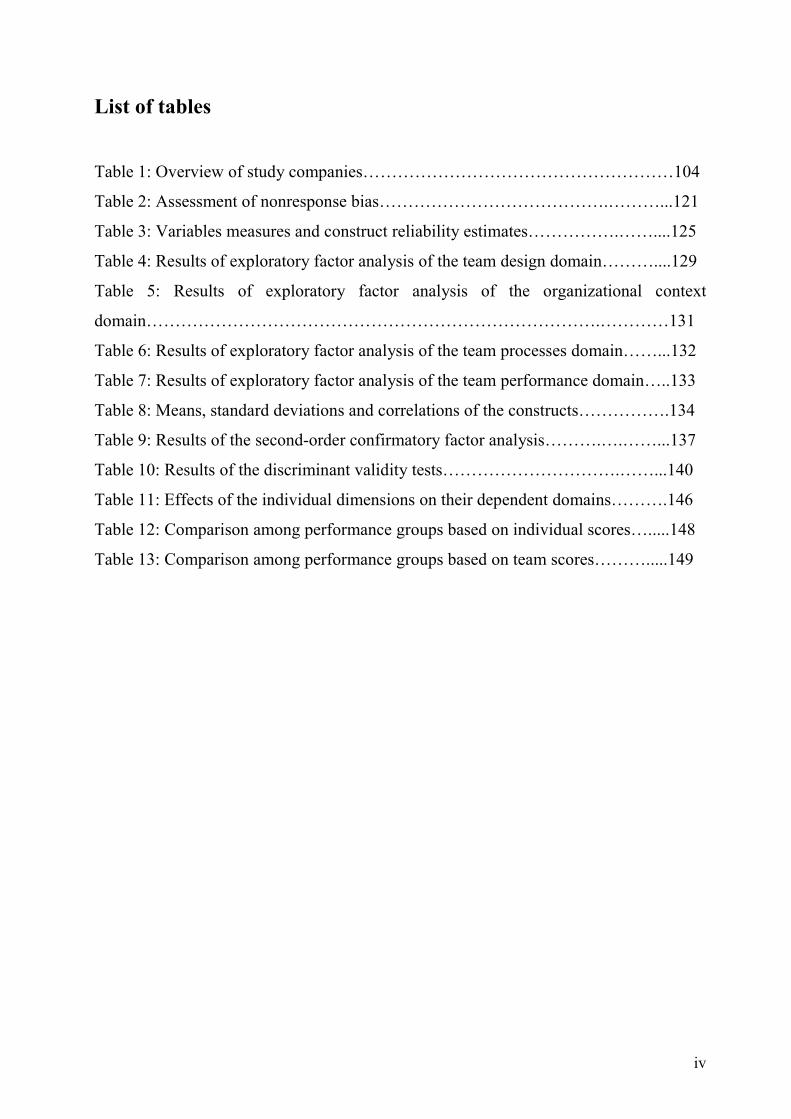
List of tables
Table 1: Overview of study companies………………………………………………104
Table 2: Assessment of nonresponse bias………………………………….………...121
Table 3: Variables measures and construct reliability estimates…………….……....125
Table 4: Results of exploratory factor analysis of the team design domain………....129
Table 5: Results of exploratory factor analysis of the organizational context
domain…………………………………………………………………….…………131
Table 6: Results of exploratory factor analysis of the team processes domain……...132
Table 7: Results of exploratory factor analysis of the team performance domain…..133
Table 8: Means, standard deviations and correlations of the constructs…………….134
Table 9: Results of the second-order confirmatory factor analysis……….….……...137
Table 10: Results of the discriminant validity tests………………………….……...140
Table 11: Effects of the individual dimensions on their dependent domains……….146
Table 12: Comparison among performance groups based on individual scores….....148
Table 13: Comparison among performance groups based on team scores……….....149

v
List of abbreviations
ANOVA Analysis of variance
B2B Business-to-business
CFA Confirmatory factor analysis
CFI Comparative fit index
CRM Customer relationship management
EFA Exploratory factor analysis
e.g. Exempli gratia (for example)
EMEA Europe, Middle East and Africa
etc. Et cetera (and so forth)
GAM Global account management
HR Human resources
i.e. Id est (that is)
KAM Key account management
M Mean
MNC Multinational corporation
NFI Normed fit index
P&L Profit and loss
SAMA Strategic Account Management Association
SD Standard deviation
SEM Structural equation modeling
RMR Root-mean-square residual
RMSEA Root-mean-square error of approximation
UK United Kingdom
USA United States of America

1
1. Introduction
1.1. Background and relevance
Driven by the search for both new business opportunities and competitive advantage,
companies in business-to-business (B2B) markets increasingly have moved away from
a transactional form of exchange (Dyer, 1997) to look for closer, more collaborative
relationships with their customers (Cannon and Perreault, 1999; Heide and John, 1990;
Narayandas and Rangan, 2004). A common approach to exploiting the potential of
long-term supplier–customer relationships (Anderson and Weitz, 1992) has been to
adopt various customer management techniques, such as relationship management
(Subramani and Venkatraman, 2003), relationship marketing (Grönroos, 1994;
Morgan and Hunt, 1994; Webster, 1992), and national and key account management
(McDonald et al., 1997; Shapiro and Moriarty, 1984; Weilbaker and Weeks, 1997).
However, these approaches often become more challenging as customers become
more global and powerful. With their global expansions, customers establish a direct
presence in a growing number of countries and expect the supplier to provide
consistent, coordinated services worldwide, which entails moving away from
traditional relationships with local subsidiaries toward uniform prices, terms, and
services in markets in which the supplier has no operations (Montgomery and Yip,
2000). Furthermore, these customers recognize the strategic value-adding potential of
global procurement (Cohen and Huchzermeier, 1999; Ellram and Carr, 1994) and
therefore adopt integrated, centralized purchasing practices (Olsen and Ellram, 1997;
Sheth and Sharma, 1997) and reduce their supplier base (Capon, 2001). Examples of
this practice are abundant, including IBM’s decision to replace the 40 advertising
agencies with which it had been working worldwide with a single agency that could
provide global services (Montgomery and Yip, 2000) or Motorola’s decision to reduce
its suppliers from 10,000 to 3,000 in only a few years (Senn, 1999).
The resulting shift of power to the customer further increases through industry
consolidation (Birkinshaw et al., 2001) and advances in information and
communication technologies, which enable customers to track the supplier’s quality
and prices globally (Narayandas et al., 2000). These factors have heightened the

2
challenges facing suppliers and made international approaches such as global account
management (GAM) (Birkinshaw et al., 2001; Harvey et al., 2003a; Shi et al., 2004,
2005) the new frontier in customer management (Yip and Madsen, 1996).
Defined as “an organizational form and process in multinational companies by which
the worldwide activities serving one or more multinational customers are coordinated
centrally by one person or team within the supplier company” (Montgomery and Yip,
2000: 24), GAM represents a key organizational design issue for suppliers (Homburg
et al., 2002). Unlike traditional sales and relationship marketing, GAM involves a
complex network of interactions (Figure 1) that demands coordinated cross-functional
effort, including the establishment of a customer dimension that crosses existing
product, country, or functional units and mobilizes organization-wide resources to
deliver on customer expectations (Galbraith, 2001).
Figure 1: Interactions of traditional selling and GAM
An interaction between a customer organization and traditional sales force
An interaction between a customer organization and global account management
Source: Adapted from Sharma (1997: 29).
Finance
Purchasing
Engi- neering
Sales- person
Finance
Engi- neering
Finance
Purchasing
Engi- neering
Account Manager
Finance
Engi- neering

3
In its simplest form, the customer dimension might be a specialized global account
manager who plays a pivotal boundary-spanning role in managing external and
internal relationships and coordinating dispersed value-adding activities (Millman,
1996). As the relationship with the customer develops, however, the number of
contacts between the two companies and the need for dedicated resources and
relationship-specific adaptations increases (Dwyer et al., 1987; Millman and Wilson,
1994), as does the number of people involved in the relationship. A dedicated team—
which can be composed of sales representatives from various product lines and
countries or take a cross-functional composition to include manufacturing,
distribution, finance, R&D, and other functional units—works to present a unified face
to the customer (Galbraith, 2001). Ultimately, in an overall GAM organization, all
account managers and teams integrate to reconcile the customer’s external alignment
requirements with the organization’s existing configuration of activities.
Consequently, three main levels of analysis emerge in the context of GAM
organizational solutions: the individual global account manager, the GAM team, and
the overall GAM program. Whereas prior work has addressed the role of global
account managers (Harvey et al., 2003b; Millman, 1996; Wilson and Millman, 2003)
and some structural aspects at the program level (Birkinshaw et al., 2001; Homburg et
al., 2002; Kempeners and van der Hart, 1999; Shapiro and Moriarty, 1984), no
research has considered the design and functioning of the team in detail. As a result, a
lack of understanding remains about when teams should be formed, how they should
be structured and managed, and, most important, what determines their performance.
Following the call of Workman et al. (2003) for more research that examines how
team types influence effectiveness, this dissertation develops and tests a framework of
GAM team design and performance that draws on relevant literature from the fields of
GAM and team selling (Moon and Armstrong, 1994; Moon and Gupta, 1997; Smith
and Barclay, 1993), as well as organizational behavior studies of small groups within
the organization (e.g., Ancona and Caldwell, 1992a; Cohen and Bailey, 1997;
Gladstein, 1984).

4
1.2. Objective and research questions
This research aims to fill the gap in the existing literature with regard to GAM team
characteristics and their effects on performance. Its main objective is to contribute by
identifying the key determinants of GAM performance and integrating them in a
comprehensive framework of GAM team dimensions, processes, and outcomes.
Toward that end, it answers a general question—what determines team
performance?—by breaking it down into three more specific research questions:
Q1: What are the key elements of GAM team design?
This question helps to conceptualize and delineate the specific aspects of team
structure and composition that have impacts on team performance.
Q2: How does GAM team design affect GAM team performance?
Furthermore, the study seeks to assess the relationship between team design and
performance and investigate the mechanisms through which they may be linked. The
literature suggests that this link rarely is straightforward and may be mediated by team
members’ interactions and behaviors (Lawrence, 1997). Therefore, this dissertation
aims to identify key team processes that may mediate the relationship or have their
own influences on team outcomes.
Q3: What other factors have an influence on GAM team performance?
Finally, this third question investigates whether additional factors in the team
environment, external to the team structure, composition, and processes, may influence
team performance.
By answering these questions, this study offers several theoretical and practical
contributions. From a theoretical perspective, the dissertation extends previous
contributions in the field of global and key account management and the more general
area of customer management by narrowing the traditional focus on the overall GAM
approach to concentrate on one of its less researched building blocks. Moreover, it
complements prior suggestions regarding the key decisions involved in designing an
account team (Kempeners and van der Hart, 1999) by proposing additional design
dimensions and linking them to outcomes. Beyond its GAM implications, this study
5
contributes to organizational behavior research by extending key concepts from
research on small groups (Gladstein, 1984; Hackman, 1987) and cross-functional
teams (Ancona and Caldwell, 1992a, b; Denison et al., 1996) to the more complex,
boundary-transcending context of GAM. From this perspective, the novelty of this
study lies in its focus on teams with higher degrees of complexity, characterized by
blurred boundaries and multifaceted vertical and horizontal involvements.
From a practical point of view, this research helps managers to better understand the
drivers of their GAM team performance. By identifying key elements of the GAM
team structure, composition, and organizational environment that uniquely
characterize high-performance teams, the study highlights critical success factors of
effective, collaborative teamwork and provides managers with ideas about how to
improve their overall performance with global customers. Best practice examples
obtained in interviews with GAM experts from leading multinational companies
further strengthen these contributions.

6
1.3. Study outline
The study is organized into six chapters which follow the logical flow of the main
research steps. Figure 2 presents the organization of the study.
Figure 2: Study outline
Chapter 1 introduces the research context, elaborates on the relevance of the topic, and
outlines the three research questions that guide this dissertation. Chapter 2 establishes
the theoretical foundations of the study through a review of extant literature in four
relevant research streams: global and key account management, small groups in the
organization, cross-functional teams, and selling teams. In a first step, Chapter 3
describes the qualitative study and explains how it helped to construct the conceptual
framework, and then in a second step, consolidates the findings from the literature
review and the exploratory interviews into an integrated framework that defines the
constructs and leads to specific hypotheses. Chapter 4 describes the empirical study by
Introduction
Literature review Qualitative study
Conceptual framework
Empirical study
Analysis and results
Discussion and conclusions
1
2
3.2
4
5
6
3.1

7
outlining the sample, questionnaire, measures, and procedures employed in the data
collection and analysis. Chapter 5 provides the results of the quantitative analysis and
elaborates on the chosen analytical approach and methods. Finally, Chapter 6
discusses the implications of the empirical results for both theory and practice. The
dissertation concludes with a discussion of the limitations of this study and
suggestions for further research.

8
2. Literature review
This chapter reviews relevant literature in several research streams. The resultant
detailed discussion of key constructs, models, and frameworks helps to indicate
implications for this study. In addition, in this chapter, I outline the limitations of each
literature stream for the study of GAM teams.
2.1. Global account management
2.1.1. Definitions Theory and practice use different terms to describe managing global customers: global
account management, international account management, parent account management,
and so forth. However, they usually refer to the same concept. The most commonly
cited definition of global account management, which is also employed in this study,
is “an organizational form and process in multinational companies by which the
worldwide activities serving a given multinational customer are coordinated centrally
by one person or team within the supplying company” (Montgomery and Yip, 2000:
2).
This definition can be extended to include the element of long-term relationship
building, as identified by Kempeners and van den Hart (1999: 311): “Account
management is the process of building and maintaining relationships over an extended
period, which cuts across multiple levels, functions, and operating units in both the
selling organization and in carefully selected customers (accounts) that contribute to
the company’s objectives now or in the future.” Adding a dependency dimension from
the relational contracting theory, Harvey et al. (2003b: 564) define GAM as “a
dependency agreement between the customer and supplying organizations (or their
parts) that are interrelated through both formal and informal ties at multiple levels
across national borders.” Finally, recognizing the role of collaboration, Shi et al.
(2004: 539) provide the following definition: “GAM is a collaborative process
between a multinational customer and a multinational supplier by which the

9
worldwide buying-selling activities are centrally coordinated between the two
organizations.”
A closely related term is key account management (KAM), defined by McDonald et al.
(1997: 737) as “the approach adopted by selling companies aimed at building a
portfolio of loyal key accounts by offering them, on a continuing basis, a
product/service package tailored to their individual needs.” The literature on KAM
developed prior to that on GAM and usually refers to managing strategic accounts
with a narrower geographic scope (also referred to as national account management).
However, more recent studies (e.g., Homburg et al., 2002) use the term KAM to
incorporate all approaches to managing the most important customers described by
different terms such as key account selling, national account management, strategic
account management, major account management, and global account management.
Furthermore, the term “national account management” has become limiting because
companies with important customers increasingly conduct business internationally
(Colletti and Tubridy, 1987). Consequently, this study focuses on the more global side
of customer management and uses the term GAM.
Global key accounts are those multinational customers with growing expectations of
being supplied and serviced worldwide in a consistent and coordinated way (Millman,
1996). Wilson and Croom (1999: 26) define global strategic accounts as those that
“coordinate and integrate their operations internationally, are of major strategic
importance to the supplier and demand a coordinated account management process
worldwide.” This definition matches Wilson et al.’s (2000), who state that
geographical reach itself does not constitute a global account. Three additional criteria
must also be fulfilled: strategic importance, demand for and acceptance of global
solutions, and a centrally coordinated purchasing process.
Academic literature does not provide a precise definition of global account
management teams. Through deduction, however, such a team comprises all the
persons involved in developing and maintaining relationships with one or several
related key customers on a global basis; its responsibilities include developing a
10
customer strategy and account plan, creating innovative solutions, and coordinating
various networks (Galbraith, 2001). Its distinguishing characteristics include:
– Geographic dispersion and multinational composition (Montgomery and Yip,
2000).
– Cross-functional involvement (Galbraith, 2001).
– The involvement of several hierarchical levels (Harvey et al., 2003b).
– Full- and part-time membership (Kempeners and van den Hart, 1999).
– Parallel existence with other organizational forms (Arnold et al., 1999).
– A boundary-spanning role (Harvey et al., 2003a).
– A continuous, long-term task (Wilson et al., 2000).
2.1.2. GAM literature overview
A summary overview of the existing literature in the fields of GAM and KAM,
including major findings and contributions, appears in Appendix A. A brief analysis of
the reviewed studies indicates that the majority of research is descriptive and
conceptual, which demonstrates that it remains in an early stage of development
(Arnold et al. 2001; Birkinshaw and Terjesen 2002; Harvey et al. 2003a, b; Millman
1996, 1999; Wilson 1999; Yip and Madsen 1996). Most studies are based on
interviews or surveys in a relatively small number of firms (Birkinshaw et al. 1999;
Dishman and Nitse, 1998; Narayandas et al. 2000; Senn and Arnold 1999; Shi et al.,
2004, 2005; Stevenson and Page, 1979). This type of survey research thus has resulted
in descriptive data about the concept, the situations in which it might be used, and
some aspects of GAM/KAM programs.
Some more recent studies attempt to overcome these limitations by conducting surveys
of a greater number of companies, testing a more extensive set of hypotheses, and
embarking on more advanced theoretical development (Birkinshaw et al., 2001;
Homburg et al., 2002; Montgomery et al., 1998a, b, 2001, 2002; Senn, 1999;
Workman et al., 2003).

11
The next sections focus on the major aspects of GAM that have been discussed in the
literature to provide a broad overview of the recurring topics and significant findings,
as well as elaborate on the research gaps addressed in this dissertation. The groups of
discussed topics follow the logical sequence of events, starting with reasons to
establish a GAM program, the major elements of a GAM program, GAM
implementation, and performance.
2.1.3. Reasons for implementing GAM
The most frequently discussed dimension of the collaboration between suppliers and
global customers pertains to the reasons and general internal and external conditions
for entering such a relationship.
On the customer side, one of the major driving forces for GAM has been supply chain
management practices. Economies of scale in purchasing offer good opportunities for
cost savings and have been growing due to the increased internationalization, merger
and acquisition activity, and communications advances (Wilson et al., 2000). Evidence
shows that many corporations perceive supply chain management as being of high
strategic importance and a source of competitive advantage (Cohen and Huchzermeier,
1999). The increasingly centralized purchasing functions of the buyer thus start posing
demands for the aggregation of the supplier’s selling operations.
That is, both the customer and globalization drivers in the supplier’s industry have
been major triggers of GAM implementation. Yip and Madsen (1996) outline the
underlying market, cost, and other industry conditions that create the potential for a
worldwide business to achieve the benefits of GAM relationship, among which they
rank the global client as the first and most important. However, global/regional
channels of distribution and middlemen can also force suppliers to rationalize their
international pricing and terms of trade because they have the capability to exploit
differences in pricing through arbitrage. In addition, multinational corporations
(MNCs) may be encouraged to adopt GAM practices to benefit from transferable
marketing elements, such as brand names and advertising, which require only minimal
adaptation and simultaneously facilitate customer relationship management on an

12
international basis. Moreover, GAM can be initiated as a tool for knowledge creation
through access to so-called “lead countries,” where innovation in products or processes
is concentrated. For example, most global accounts of high-tech companies, such as
Hewlett-Packard, are located in the United States, Japan, and a few Western European
countries whose use of IT is greatest. Other factors for the development of GAM
include high product development costs, fast changing technology, and global
competitors.
These arguments are in line with and can be supported by the theory of
internationalization of the firm, which focuses on the industry or nature of the business
as the key determinants of globalization potential. The industry globalization
conditions can be summarized as market, cost, government, and competition (Yip,
1989). In terms of GAM, market globalization factors refer to the possibility of
offering global products, which would encourage the customer to buy on a global basis
and therefore demand standardized pricing, service, terms, and conditions. Cost
globalization drivers are associated with the possibility of exploiting scale economies
and the extent to which global shipment of the product becomes possible through
logistics and other factors. Thus, a company that can benefit from scale-related cost
reductions in product development would be willing to integrate development
activities for a given international customer. The extent to which a supplier can serve
customers on a global basis also depends on existing regulations imposed by
governments, such as tariffs and other barriers, investment restrictions, and so forth.
Finally, the competitive drivers with regard to GAM mainly refer to transferable
competitive advantages. Customers in industries with transferable advantages, such as
technology in the IT industry, are more likely to employ global procurement practices.
Although customer demands are a strong driver for suppliers to provide GAM
services, many authors emphasize the potential benefit of being proactive in
establishing GAM relationships and its positive impact on the balance of power
(Arnold et al., 1999). Using the bargaining framework of relational contracting theory,
Harvey et al. (2003a) identify two dimensions of supplier GAM motivation: relational
behavior (ranging from negative/reactive to positive/proactive) and supplier
dependence (reflecting an orientation toward the short- or long-term), and argue that
13
the potential for increasing efficiency and effectiveness through global customer
relationships is greatest when the supplier has a proactive, long-term perspective.
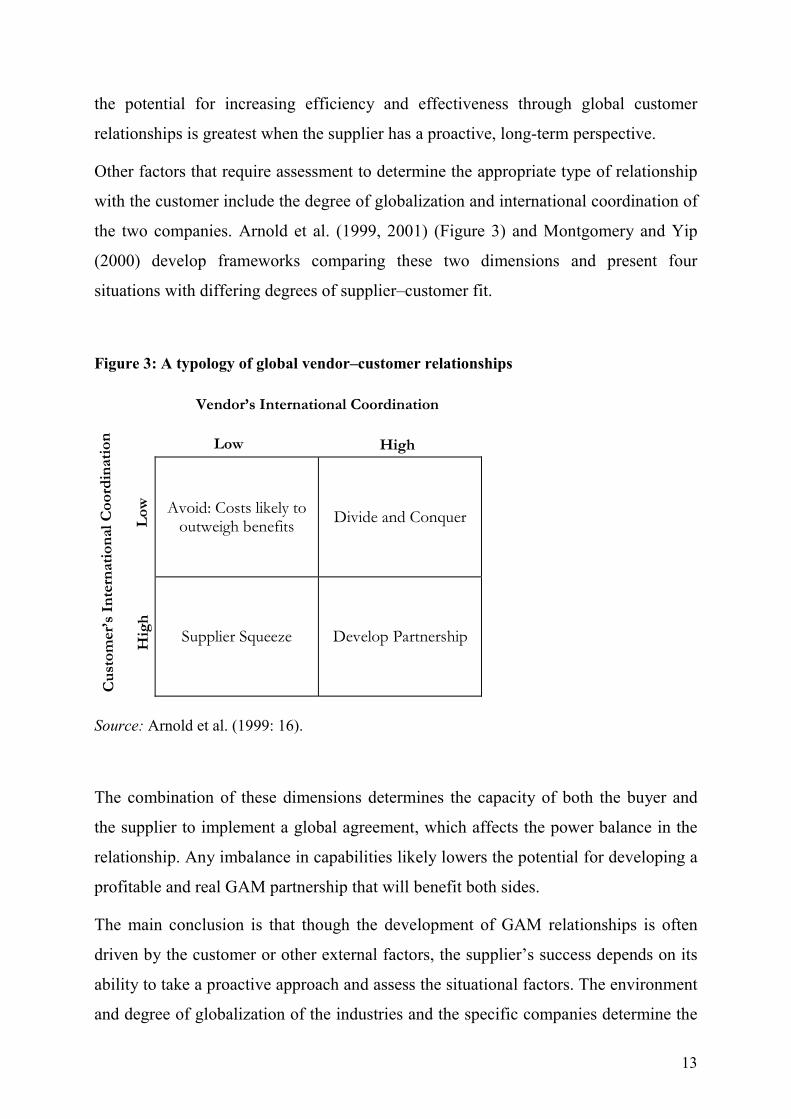
Other factors that require assessment to determine the appropriate type of relationship
with the customer include the degree of globalization and international coordination of
the two companies. Arnold et al. (1999, 2001) (Figure 3) and Montgomery and Yip
(2000) develop frameworks comparing these two dimensions and present four
situations with differing degrees of supplier–customer fit.
Figure 3: A typology of global vendor–customer relationships
Source: Arnold et al. (1999: 16).
The combination of these dimensions determines the capacity of both the buyer and
the supplier to implement a global agreement, which affects the power balance in the
relationship. Any imbalance in capabilities likely lowers the potential for developing a
profitable and real GAM partnership that will benefit both sides.
The main conclusion is that though the development of GAM relationships is often
driven by the customer or other external factors, the supplier’s success depends on its
ability to take a proactive approach and assess the situational factors. The environment
and degree of globalization of the industries and the specific companies determine the
Avoid: Costs likely tooutweigh benefits Divide and Conquer
Supplier Squeeze Develop Partnership
Low High
Cu
stom
er’s
In
tern
atio
nal
Coo
rdin
atio
n
Vendor’s International Coordination
Low
Hig
h

14
type of relationship, the behavior of the two parties, and the design of the GAM
organization. Consequently, these factors should play key roles in the formation of
GAM cross-functional teams by determining their composition and geographic reach.
2.1.4. GAM relationship development
As the previous section indicated, the readiness and motives of the customer and the
supplier to enter a GAM agreement likely determine the degree of collaboration,
which in turn influences GAM performance. As it moves from discrete market
transactions to full integration, the customer–supplier relationship becomes
progressively more collaborative. Lambe and Spekman (1997) outline a continuum of
national account management relationships ranging from repeated transactions to long-
term relationships to buyer–seller alliances. Movement along this spectrum is
associated with increasing relationship-specific investments, higher switching costs for
both sides, and higher degrees of collaboration, which include joint planning, joint
coordination, information sharing, and long-term commitments. In addition, the
emphasis on selling and concern about price decrease.
These findings mirror the notion of business relation evolution, which serves as a basis
for Dwyer et al’s (1987) model, in which they distinguish among several types of
relationships on the basis of the degrees of the buyer’s and seller’s motivational
investment in the collaboration according to five development phases: awareness,
exploration, expansion, commitment, and dissolution. This evolution moves
companies from discrete spot market transactions to relational exchanges, which helps
both partners benefit from reduced uncertainty, well-managed dependence, greater
efficiencies, and social gains. Increasing the depth of the relationship is associated
with increases in trust, largely based on consecutive rounds of specific investments.
Morgan and Hunt (1994) build on this research and consider commitment and trust the
key mediating variables of a relationship, as well as crucial for long-term partnerships.
In a more specific KAM context, Millman and Wilson (1994) provide similar insights
in the Key Account Relational Development model (Figure 4). These authors suggest
that KAM goes through several stages as the relationship changes from transactional to

15
collaborative and involvement with customers moves from simple to more complex.
The main stages are pre-KAM, early KAM, mid-KAM, partnership KAM, and
synergistic KAM.
Figure 4: Development stages in the GAM relationship
Source: Wilson et al. (2002: 52).
McDonald et al. (1997) suggest that the potential for collaborative KAM also depends
on two other dimensions: the complexity of the processes between buyer and seller
and the complexity of the product and technology supplied by the seller. Studying the
case of the key account unit of a telecom company, Pardo et al. (1995) also find
Relational distance
Increasing organizational complexity and cultural diversity
Time
Pre-GAM
Early-GAM
Mid-GAM
Partnership GAM
Synergistic GAM
Buyer
Seller
Buyer‘s stategic drivers
Seller‘s stategic drivers
Relational distance
Increasing organizational complexity and cultural diversity
Time
Pre-GAM
Early-GAM
Mid-GAM
Partnership GAM
Synergistic GAM
Buyer
Seller
Buyer‘s stategic drivers
Seller‘s stategic drivers

16
evidence that KAM is a process of adaptation in the organization that aims to manage
relationships with important customers. They call this process “the key accountization
of the firm.”
This adaptation is influenced by the GAM strategy and configuration and therefore is
associated with the GAM team. In the earlier stages (pre-GAM and early GAM), the
supplier likely conducts business with the customer at a national or regional level.
Therefore, the team is likely to be smaller and less international; the focal relationship
is that between the global account manager and the global purchasing officer or a
small team at the global customer headquarters. Although there might be centers of
interaction with the customer at various locations around the world, they are localized
and uncoordinated. Links may exist between individual managers within both the
supplier and the customer organization, but an integrated network of global cross-
functional interaction is not in place. As a result, neither an established GAM team for
the account nor a small core team whose main tasks include establishing a network of
relationships with key support functions of the supplier and key players of the client
(i.e., expanding and strengthening the team and its influence) exist.
The movement to mid-GAM is associated with greater relationship complexity, more
cross-boundary contacts, and increasing needs for dedicated resources and
relationship-specific adaptations. Therefore, the number of people involved in the
relationship increases, and a dedicated, cross-functional, likely interorganizational
team develops. However, though this team might have a global reach, it is not yet
considered of strategic importance to either party, and its activities focus on
operational issues.
Partnership GAM implies that the two parties perceive each other as strategic partners,
share risks, and explore joint opportunities for value creation. There are strong ties
between the two companies at many levels around the world. Therefore, the
composition and size of the team depend on the various interdependencies between the
buyer and the seller. The team tasks become more complex, and the structure must
resolve the implications for individual country and functional managers. Finally, in the
synergistic stage, the two companies stop perceiving themselves as two separate
17
organizations but rather as parts of a larger entity, creating synergies. Thus, between
the two organizations emerges a third one: the GAM team, which includes members
from both sides who work as one team to integrate their skills and create joint value.
2.1.5. Strategy
Another key dimension of the supplier–customer relationship is strategy, one of the
four building blocks of the Key Account Congruence Model of Capon (2001) that
encompasses the degree of commitment to key accounts and the selection of such
accounts. Wilson et al. (2000) categorize GAM strategies into three hierarchical
groups to reflect the culture of the supplier and the operationalization of their global
capabilities. The economic GAM strategy focuses on sales volume and supply chain
efficiencies; the relationship is based on adversarial negotiations. The innovative
strategy demonstrates a higher degree of collaboration and focuses on problem
resolution and value creation. Finally, companies with an entrepreneurial strategy aim
to exploit joint value creation and wider business opportunities and build a relationship
based on strategic alignment, integration, and coordination of core competencies.
Dishman and Nitse (1998) identify a similar range of strategic approaches, including
protective, technology-based, and needs-based. The protective strategy is most reactive
and might be a short-term solution because it does not provide a high level of
customization. At the other end, the needs-based strategy entails the highest
commitment to key accounts and requires additional resources and support be
dedicated to their management. The implication is that more complex and
collaborative strategies place higher demands on the GAM team and therefore require
a larger and more diverse cross-functional commitment.
Customer assessment and selection is a major part of the strategy. Having assessed the
balance of power, suppliers must define clear and objective selection criteria. Wilson
et al. (2000) and Millman (1999) divide the various selection criteria into two large
groups—operational/financial and strategic—and stress the importance of both.
McDonald et al. (1997) find that the most common factors for the selection of key
accounts are volume-related factors, potential for profit, and status-related factors. On

18
the buyer’s side, the most common selection factors include ease of doing business,
quality of the product/service, and people factors, such as the personality and skills of
the selling company contacts.
In addition, it is crucial to assess the customer’s receptiveness to global partnering and
the possibility of establishing a relationship on an equal footing. Relationships that
have been initiated by the supplier for strategic reasons are usually more successful
than those based entirely on operational and financial rationales, because they manage
to shift the negotiation’s focus away from price and discounts. Arnold et al. (2001)
argue that this strategic potential refers to three different levels—overall strategic
importance, marketing and sales strategy, and top executive support—and that the
relationship is unlikely to be successful if any of them is missing.
2.1.6. GAM/KAM configuration
Depending on the GAM strategy selected, firms must allocate specific resources and
configure their activities. Research contributions in this vein refer to the building
blocks of a GAM program, which has great relevance for this study, because most
researched elements have implications for the formation of teams and can influence
performance. The literature review table in Appendix A indicates that much of the
research has addressed only one or a few relevant factors. One of the few empirical
studies that attempt to encompass all key dimensions of KAM is that by Homburg and
his coauthors (Homburg et al., 2002; Workman et al., 2003). They aim to develop an
integrative conceptualization of KAM approaches and define key constructs in four
areas: activities, actors, resources, and approach formalization.
Activities: Products/services, pricing, information
Key account activities are those not offered to average customers, including special
pricing, special service and distribution arrangements, customization of
products/services, and information sharing. The two most important dimensions of this

19
construct are activity intensity and activity proactiveness, which have significant
positive impacts on KAM effectiveness (Workman et al., 2003).
Other researchers emphasize the importance of offering a consistent value proposition
worldwide and global pricing. Millman (1996) discusses systems selling in global key
account management, that is, offering and delivering a comprehensive “package” of
products and services, including both standardized and customized components, to
selected customers. Arnold et al. (2001) find that GAM leads to downward pressure on
prices, which requires close attention to this aspect and relationships that go beyond
pricing agreements. Narayandas et al. (2000) provide a comprehensive analysis of the
benefits and risks of entering into a global pricing agreement and argue that these
agreements could be crucial for the company’s performance and so must be
approached carefully.
In addition, key customers increase the information processing and sharing needs of
the supplier, which makes information a major dimension of the customer–supplier
collaboration and demands the establishment of appropriate systems and procedures.
Using information processing theory, Birkinshaw et al. (2001) find that the scope of
relationships between two organizations, the frequency of communication between the
global account manager and other individuals in the two companies, and the use of
extensive internal support systems lead to better information management and hence to
improved efficiency and sales growth.
The key account manager
The key account manager and others involved in the relationship are key elements of
the buyer–seller dyad. There seems to be consensus that the global account manager is
a special position that requires high-caliber personnel with varied skills and
knowledge. Due to his or her boundary-spanning role, the manager must be able to
perform a wide range of tasks: coordination, communication, account planning,
external and internal relationship management, sales and profit responsibility,
selling/negotiation, and multicultural teamwork, to name just a few (Colletti and
Tubridy, 1987; McDonald et al., 1997; Millman, 1996). Therefore, he or she also

20
needs strong skills in the areas of finance (analytic and bargaining skills related to
pricing, revenue improvement, contract negotiations), sales (problem-solving and
presentation skills related to account performance, company and product capabilities),
human relations (interpersonal and intercultural relationship skills), and marketing
(market research and account profiling skills, information collection, ability to
communicate customer needs internally) (Colletti and Tubridy, 1987). In addition, the
skills involved in the role of a key account manager include integrity, product/service
knowledge, and a solid understanding of the buying company’s business and business
environment (McDonald et al., 1997).
Very often, the traditional role of the supply manager must be adapted and new
competencies developed to meet the demands of global customers (Harvey et al.,
2003b). Therefore, this position is associated with a specific job analysis, the creation
of specific job profiles, and stringent hiring practices (Wotruba and Castleberry, 1993).
Furthermore, these managers need special compensation arrangements (Colletti and
Tubridy, 1987) and skills development through training programs (Weeks and Stevens,
1997). Finally, a very important actor in this scene is top management, because top
executive involvement consistently has been identified as a critical success factor
(Arnold et al., 2001; Homburg et al., 2002; Millman and Wilson, 1999a; Napolitano,
1997; Toulan et al., 2002).
Organizational structures
The structure of GAM/KAM activities is of major importance because global account
management is, above all, an organizational challenge (McDonald et el., 1997). As
Shapiro and Moriarty (1984: 1) note, “formal organization structure is perhaps the
most interesting and controversial part of national account management.” Because the
issue of GAM teams represents part of the larger GAM organizational context, the
major findings in this area require a more in-depth analysis to assess their applicability
to the more specific context of teams.
One of the most extensive discussions of the diverse structural forms employed in
GAM appears in Shapiro and Moriarty (1984). These authors use as a foundation the
21
concepts of differentiation and integration by Lawrence and Lorsch (1967: 11), who
define differentiation as “the difference in cognitive and emotional orientation among
managers in different functional departments” and integration as “the quality of the
state of collaboration that exists among departments that are required to achieve unity
of effort by the demands of the environment.” Balancing the requirements of the
environment and the customer means that a trade-off must always occur between
differentiation and integration, on the one hand, and among different forms of
integration (i.e., with the customer, with nonmarketing and nonsales functions in the
supplier company, within the account management organization) on the other. On this
basis, Shapiro and Moriarty (1984) identify six options for structuring the GAM
organization:
– No KAM program.
– Part-time KAM program.
– Operating unit program at the group level.
– Operating unit program at the division level.
– Corporate-level program (centralized).
– National account division.
The no-KAM option has no implications for the topic being researched herein, because
teams likely form only at more advanced KAM development stages. The part-time
KAM may have relevance if it serves as a bridge from no program to a full-time
program. In this case, the development of teams would begin and likely has
consequences for the future development of the program. As McDonald et al. (1997)
report, the first step in building an effective GAM organization is the “dotted-line” or
semi-formal team whose members tend to have different line managers but meet
regularly with the account manager. A key success factor for this organizational
decision is the establishment of shared incentives and rewards. Team members tend to
have objectives related to key accounts, such as the percentage of time they should be
devoting to their key account. Moreover, strong performance on the account reportedly
leads to improved career development and job security for the team members.
22
When moving to a more formalized and structured approach, companies must choose
among programs at the operating unit or corporate level or a separate account division.
The choice between the group-level and the division-level largely depends on three
factors: (1) the amount of overlap among the largest customers and prospects of each
division, (2) the advisability of joint sales efforts among divisions, and (3) the
organization of the general sales force.
The benefits of a group-level program are greatest when the various divisions in the
group have the same customers and the group has a pooled or shared sales force in
which the KAM program can be embedded. The rationale for establishing a corporate-
level program is similar, namely, a substantial overlap in the customer bases of the
operating units. This type of organizational structure has two important advantages.
First, the account managers have greater authority and the opportunity to use corporate
power to solve problems and exploit business opportunities. As a result, the program
has greater leverage both internally and externally. Second, a corporate-level program
contributes to increasing customer orientation in the company and making the voice of
the customer heard. This conclusion is supported by McDonald et al. (1997), who find
that decision-making authority is a key element of GAM design. The customer expects
that the account managers can get things done and have sufficient resources at their
disposal. The main indication of authority is the global account manager’s reporting
line, which implies that the GAM organization has a greater chance of success if it is
positioned at a high organizational level and has sufficient support from top
management. In contrast, corporate programs face the disadvantages of greater
complexity and lower responsiveness to the needs of individual operating units.
The ultimate form of a KAM organization is a separate operating unit that serves all
key accounts. Such a division incorporates some other functions such as
manufacturing, engineering, product development, and other sales and marketing
functions. Consequently, it is the most likely form to employ cross-functional KAM
teams on a full-time basis.
Although Shapiro and Moriarty’s (1984) work provides valuable insights into overall
KAM organizational structures and some of the options for structuring a KAM team, it

23
is limited in three primary ways. First, it is mostly descriptive and offers a summary of
the most common forms used in practice but does not validate the motivations for
choosing one option over another and all the advantages and disadvantages related to
it. Second, it focuses on national account programs and does not account for the
increased complexity of GAM. Third, the relationship between the choice of an
organizational form and performance is not discussed, which leaves open the question
of whether some forms are superior to others.
Kempeners and van der Hart (1999) build on Shapiro and Moriarty’s (1984) work and
advance their findings by matching them with case study field research. The result is
an identification of 15 decision topics in the process of designing an account
management organization. Some of the major decisions include the organization level
at which the GAM program should be positioned (group, division, business unit), the
levels of account managers (single vs. multiple), the number of account managers per
level and accounts per account manager, the use of teams, the functions included in the
teams, the location of the account managers, and the reporting lines.
Homburg et al. (2002) attempt to overcome the limitations of previous studies and
develop a taxonomy of eight prototypical approaches to organizing KAM. On the basis
of the key constructs in the four areas of activities, actors, resources, and approach
formalization, their study distinguishes between top-management KAM, middle-
management GAM, operating-level GAM, cross-functional dominant KAM,
unstructured KAM, isolated KAM, country-club KAM, and no KAM. Thus, it
empirically confirms Shapiro and Moriarty’s (1984) types of KAM but also finds two
additional approaches.
The results further indicate that the approaches with the highest values for most of the
variables are cross-functional dominant KAM, top management KAM, and operating-
level KAM. That is, companies with such programs do more for their global customers
than do companies with other forms of KAM. It is important to note that these three
approaches also make more extensive use of teams. Therefore, full-time formalized
GAM teams should be found in companies with fairly developed GAM activities and a
greater focus on customers, which results in structured and formalized programs
24
located relatively high in the organization. In such companies, the account managers
have authority and the ability to access resources from other parts of the organization
(i.e., marketing and sales as well as nonmarketing and nonsales), which facilitates the
work of the team.
GAM teams
Although teams facilitate the complex task of coordinating the efforts of individuals
across functional, product, and geographic units to serve customer needs (Shapiro and
Moriarty, 1984) and form an integral part of many GAM programs (Homburg et al.,
2002), the literature does not provide a precise definition of what constitutes a GAM
team.
Shapiro and Moriarty (1984) make a first attempt to identify the ways a KAM team can
be organized. They note the importance of integrating two groups of support
functions—sales and other—into the KAM structure. The option of developing account
teams, which include field salespeople, appears preferable to using existing,
independent field sales forces, because doing so provides greater integration and more
responsiveness to the key account managers, who have direct line authority over the
local representatives. The suggested organizational choices are (1) a set of field
representatives dedicated to the accounts of each global account manager, (2) account
managers sharing the services of the field representatives on a predetermined basis and
the field representatives reporting to the account managers for whom they work, or (3)
a pooled field sales force directed by a field manager who reports to the head of
account management (Shapiro and Moriarty, 1984).
In addition, the account team must integrate other functions that are relevant in
managing key customers. The options are similar to those for the sales force, namely, a
general function shared by account management and other sales functions, functional
specialists dedicated to one account and reporting to the account manager, functional
specialists shared by a few accounts and account managers, and a pooled force of
functional specialists managed by a functional specialist manager who reports to the
head of account management.

25
Recognizing that account teams often cross unit, division, and region borders,
Kempeners and van der Hart (1999) elaborate on the various ways to organize such
complex structures. They distinguish between a full-time core team and various other
functions (e.g., technical support) that can participate as part-time members. Another
identified possibility is the “ad hoc team,” whose members take part only when a
certain problem arises. Such teams are disbanded when the account problem is solved
(Sengupta et al., 1997).
Kempeners and van den Hart’s (1999) results show that in two of the seven cases they
study, the companies used no teams, and the account managers received no support at
all. In another case, the account manager worked at a highly centralized level and was
supported extensively, whereas in the three other cases, the account teams were less
formalized. These observations suggest a list of decision topics:
1. Account team or no account team.
2. Participating functions in the team.
3. Full- and/or part-time members.
4. Hierarchical relationships: members report to account managers and/or other
managers.
5. When reporting to account managers, account managers have dedicated or shared
teams.
6. Location of account teams/managers.
These decisions, combined with Shapiro and Moriarty’s (1984) options for sales and
nonsales support integration, can lead to three different types of teams:
– Own account team—Dedicated members report directly to the account
manager. Appropriate for large and concentrated account teams; otherwise, the
costs exceed revenues.
– Shared account team—Members work in small account management systems
or on naturally overlapping accounts. These teams can create ambiguity in

26
terms of control and resource allocation. To avoid conflicts, teams must share
members on a predetermined basis.
– Shared account team with own manager—Appropriate for large account
organizations involving intensive coverage of many customer locations.
Empirical evidence shows that companies tend to avoid this option to avoid
creating an extra management function. Instead, the support staff reports
directly to the account managers.
An additional possibility is a team formed of lower-level account managers who
provide various support tasks. Two of Kempeners and Van der Hart’s (1999) case
study subjects employed international account managers who coordinated a group of
other account managers globally. This manager was located close to the headquarters
of the customer, while the lower-level account managers supported him in other
countries and regions.
Although this research offers some clarity to the issue of organizing GAM teams, it
does not explain if these options lead to different outcomes. Therefore, the next section
analyzes the literature on overall GAM performance and identifies such factors in a
more general GAM context.
2.1.7. GAM performance
The models related to GAM performance may be divided into three major groups, as
determined by their content and scope. The first group includes models that study the
environment–GAM configuration–performance link. The second group focuses on the
link between interorganizational capabilities and performance. Finally, the third group
addresses only internal factors and their effects on outcomes.
Environment, GAM configuration, and performance
Montgomery and his coauthors (Montgomery and Yip, 2000; Montgomery et al.,
2002) build a model based on Yip and Madsen’s (1996) framework and test it
empirically to identify a link between the use of GAM and performance. Linking

27
various globalization factors in both the suppliers’ and the customers’ industries to the
implementation of GAM, they find some support that the supplier’s industry
globalization drivers and customer’s demand for GAM lead to the development of
GAM programs in response, and this GAM adoption in turn has an impact on overall
performance. However, this relationship is quite moderate in magnitude.
Whereas their research contributes by finding a positive correlation between GAM
efforts and performance, it is not complete because it fails to identify specific GAM
elements, particularly team-related factors. To a lesser degree, this limitation also
appears in a similar study (Townsend et al., 2004), which tests the links among
globalization drivers, marketing programs, and outcomes. From a broader marketing
perspective, Townsend et al. (2004) find support for the hypothesis that the main
global marketing dimensions include global product standardization, global marketing
structure, and global product processes and that the development of the first two
capabilities is triggered by both external (global consumer convergence) and internal
(leadership’s global orientation) factors. Global product standardization and global
marketing structure in turn drive global product processes. However, the study fails to
find a significant relationship with marketing performance.
Using a similar line of thinking but narrowing the focus to global marketing strategy,
Zou and Cavusgil (2002) find that global marketing strategy is influenced by
international experience, global orientation, and external globalizing conditions.
Furthermore, it has a positive impact on global strategic performance in terms of
global market share, competitive position, and global financial performance regarding
cost position, sales growth, and profitability. The implication in a GAM context is that
global strategy is likely to improve performance, but the findings are incomplete
because the model does not consider other important aspects of GAM, such as
relationship management capabilities.
To conclude, the studies in this group provide support for the link among
environmental drivers, use of GAM or global customer strategy, and performance. In
particular, the two main factors triggering the development of GAM capabilities are
industry globalization drivers and firm orientation. However, the models allow for two

28
major critiques. First, most fail to identify clearly the critical success factors for GAM.
Instead, they present a general conceptualization of GAM antecedents and
consequences and omit the organizational competencies required for GAM
implementation. Second, though they find a positive relation with performance, in
most cases, it is relatively weak.
Interorganizational capabilities and performance
Shi et al. (2004) develop a framework of GAM capabilities in which they
conceptualize what constitutes competence and its impact on performance. Using the
resource-based view (RBV), they argue that the sources of GAM competitive
advantage are interorganizational capabilities, which could be defined as bundles of
knowledge and skills “deeply embedded in inter-organizational routines and processes
and deployed through the joint idiosyncratic contributions of the specific GAM
partners” (Shi et al., 2004: 541). Those capabilities may be divided into three
categories: collaborative orientation, GAM strategic fit (including standardization fit,
participation fit, and coordination fit), and GAM configuration—and have a positive
effect on the GAM strategic outcomes, specifically, joint profit performance and
dyadic competitive advantage. The antecedents of these GAM-related capabilities are
the extent to which both supplier and customer have a common set of strategic goals
(goal congruence) and each of the companies can provide complementary knowledge
and assets (resource complementarity). A major contribution of Shi et al. (2004) is
their extension of prior studies (Homburg et al., 2002; Toulan et al., 2002) by
combining them into a broader framework that considers both sides of the buyer–seller
dyad and links GAM capabilities to the joint performance of the two parties.
Similarly, the concept of GAM interorganizational fit was studied by Toulan et al.
(2002), who define it according to four dimensions: fit regarding the strategic
importance of the relationship, product/marketing standardization, the configuration of
activities, and senior executive involvement. The results indicate that strategic,
configuration, and executive involvement fit improve efficiency and sales growth;
simultaneously, standardization and executive involvement fit affect the extent to
29
which partnerships with the customer get established.
At first, the finding that a match between the configuration of activities at the
supplier–customer interface relates positively to performance seems to contradict the
results of a prior study by the same authors. Birkinshaw et al. (2001) use information
processing theory and resource dependency theory to test the effect of GAM
capabilities on efficiency/sales growth and partnerships with customers. Their
evidence supports the two hypotheses of resource dependency theory: (1) the higher
the buyer’s dependence on the supplier, the better the supplier’s performance, and (2)
the more centralized the sales activities of the supplier and the more decentralized the
buyer, the better the supplier’s performance. However, Toulan et al. (2002) find that
the second hypothesis is valid only when the relationship is unbalanced, because fit
remains the first best solution.
With regard to the hypotheses from information processing theory, statistical evidence
indicates account performance is predicated on the scope of relationships and the
frequency of communication. As relationships get established at multiple levels, not
just through the global account manager, and as the global account manager begins to
communicate more frequently both with the customer and within his or her own
organization on matters related to the account, account performance improves.
Therefore, managerial competencies and internal support systems represent key
capabilities that lead to successful GAM.
The common finding of this research group is that GAM performance is determined by
the degree of collaboration and the match of strategies and structures between the
supplier and the customer. The most important areas demanding coordination are
product and marketing standardization and activities configuration. As compared with
studies in the previous subsection, this group defines GAM capabilities more precisely
and tests their individual and joint effects on performance. In addition, it recognizes
customers and their role in the GAM relationship in a more dynamic, active, and
participative manner, unlike the previous group, which limits the analysis to the
customer’s pressure for GAM implementation.

30
Internal capabilities and performance
Taking an internal supplier perspective, Homburg et al. (2002) show significant
performance differences among their eight configuration designs, such that cross-
functional dominant KAM provides the highest level for almost all variables. In a
subsequent paper, Workman et al. (2003) test the impact of the four key dimensions
(activities, actors, resources, and approach formalization) on KAM effectiveness and
firm profitability directly. As predicted, activity intensity and proactiveness, top
management involvement, KAM esprit de corps, and control over marketing and sales
resources relate positively to KAM effectiveness. The only unexpected results of the
model are that the use of teams has no significant relation with KAM effectiveness and
that approach formalization has a negative impact. However, this research identifies
and refines specific KAM capabilities that lead to effectiveness through a large-scale,
cross-national empirical study.
Shi et al. (2005) provide a conceptual framework of GAM capability and performance,
in which they posit that GAM capability comprises three distinct processes—
intelligence acquisition, coordination, and reconfiguration—that have positive impacts
on GAM market performance and profitability. However, they do not test this
framework empirically.
Another study, which develops a detailed model and identifies various GAM success
drivers, is that by Senn and Arnold (1999). Using customer satisfaction as a proxy for
success, the authors identify nine core fields that determine performance with global
accounts. These fields are positioned at three levels—strategic, operational, and
tactical—and stress the importance of both a holistic (across all process levels) and an
integrative (across functions of the organization) view. On the strategic level,
companies are concerned with selecting global accounts, developing long-term
relationships, and leveraging corporate knowledge. On the operational level, the focus
is on creating consistent product and service packages, synchronizing business
processes, and establishing appropriate systems. On the tactical level, companies select
and train the right people, put in place the right structures, and collect relevant
information. The results show that each of the nine fields relates positively to customer

31
satisfaction and that seven (excluding task and information management) have
significant impacts. The Congruence Model of Capon (2001) confirms the relevance of
some of these success drivers as it divides the elements of the KAM process into four
interconnected building blocks, including strategy, organization, systems and
processes, and human resources. However, Capon (2001) does not test the
performance effect or interactions among them.
2.1.8. Limitations
This extensive GAM literature review reveals various factors that are important for
GAM, including global strategy (Capon, 2001; Yip and Madsen, 1996; Zou and
Cavusgil, 2002), organizational structures (Capon, 2001; Homburg et al., 2002; Shi et
al., 2004; Townsend et al., 2004, Yip and Madsen, 1996), processes (Senn and Arnold,
1999; Shi et al., 2004, 2005; Townsend et al., 2004), and human resources
(Birkinshaw et al., 2001; Capon, 2001; Harvey et al., 2003b; Senn and Arnold, 1999;
Yip and Madsen, 1996). However, despite the importance of the topic, research in the
area of GAM teams remains sparse.
The main limitation of this research stream is that virtually no study focuses on the
factors that facilitate GAM teamwork and impact team performance. The only
empirical attempt to test the relationship between the use of teams and key account
management effectiveness finds no significant impact (Workman et al., 2003);
however, its lack of delineation between different types of teams and failure to identify
specific team characteristics limits the usefulness of its results. In contrast, studies that
have touched on more specific design issues discuss only the structural options
available from a practical perspective and stop short of identifying the determinants
and performance effects of various team dimensions (Harvey et al., 2003 a, b;
Kempeners and van der Hart, 1999). Recent research indicates that the development of
specific supplier and interorganizational capabilities is a more important predictor of
GAM performance than pure structural solutions (Shi et al., 2004, 2005), indicating
that GAM team research should move beyond these issues to encompass team

32
competencies and processes. This literature review therefore highlights the need for a
comprehensive model that integrates all relevant elements and links them to outcomes.
The reviewed GAM studies contain many limitations from a methodological
perspective as well. First, the existing models are either conceptual and descriptive
(Capon, 2001; Shi et al., 2004; Yip and Madsen, 1996) or use data from a small
number of companies or a single country (cf. Homburg et al., 2002). This point
indicates the need for more empirical studies that use larger samples and more
advanced research techniques. Second, the discussed academic work examines GAM
mainly from the supplier’s perspective and thus lacks a means to perform comparisons
with the customer point of view. Such research risks getting lost in internal issues,
which may be of little relevance for the buyer. Third, the performance measures are
based on self-assessments, which may be related to certain biases, and do not present
objective valuations, such as sales and profit.
In summary, this review of GAM/KAM contributions outlines the growing importance
of the GAM team as an organizational form. Furthermore, it indicates the positive
correlation between GAM efforts and performance, which further confirms the
relevance of the topic researched herein. However, the review provides very limited
insights about this dissertation’s research questions because of the lack of studies in
this specific area. Therefore, in the next sections, I consider studies in the broader
context of organizational teams and try to identify useful implications.
33
2.2. Small groups in the organization
The importance of teams for organizational success has been widely recognized in
practice and in academic research. The key benefit of using teams in organizations lies
in their potential to increase both productivity and satisfaction among employees
simultaneously (Gladstein, 1984; Goodman et al., 1988), thus helping resolve the
productivity–satisfaction trade-off previously presumed to be inherent in work design
(Campion et al., 1993). However, some negative effects also have been associated with
teamwork: poor decisions (Janis, 1972), conflict (Alderfer, 1977), and member
frustration or disappointment (Katzenbach, 1987). As a result, researchers have
attempted to understand how teams work and what determines their effectiveness. The
wide range of team effectiveness models developed in recent years encompasses
different disciplines such as social psychology (McGrath, 1964; Steiner, 1972), socio-
technical theory (Cummings, 1978; Pasmore et al., 1982), industrial engineering
(Davis and Wacker, 1987), and organizational psychology (Gladstein, 1984; Guzzo
and Shea, 1992; Hackman, 1987; Sundstrom et al., 1990). This section reviews the
major models and frameworks of teamwork effectiveness and summarizes the main
findings.
2.2.1. Definitions
Team
Before analyzing research contributions pertaining to team effectiveness, it is
important to define the concept of a team in an organizational setting. Numerous
definitions of organizational groups and teams can be found in academic studies, and
whereas popular management literature has embraced the term “team,” academic
contributions tend to use the term “group,” as in group dynamics, group processes, and
group effectiveness. Katzenbach and Smith (1993: 85) explicitly distinguish between a
work group and a team, noting that
unlike teams, working groups rely on the sum of ‘individual bests’ for their
performance. They pursue no collective work products requiring joint
34
effort. By choosing the team path instead of the working group, people
commit to take the risks of conflict, joint work-products, and collective
action necessary to build a common purpose, set of goals, approach, and
mutual accountability.
Although this delineation is not widely shared and most authors use the two terms
interchangeably, it is clear that groups differ in their degree of “groupness,” with some
being more integrated and interdependent than others (Cohen and Bailey, 1997). The
main determinants of the degree of the groupness appear to be the size,
interdependence, and temporal patterns of the group (McGrath, 1984:3).
Teams have been defined as “a small number of people with complementary skills
who are committed to a common purpose, performance goals, and approach for which
they hold themselves mutually accountable” (Katzenbach and Smith, 1993: 45). Cohen
and Bailey (1997: 241) use a slightly different definition: “a collection of individuals
who are interdependent in their tasks, who share responsibility for outcomes, who see
themselves and who are seen by others as an intact social entity embedded in one or
more larger social systems (for example, business unit or the corporation), and who
manage their relationships across organizational boundaries.” In a more recent study of
team processes, teams have been defined as “multitasking units that perform multiple
processes simultaneously and sequentially to orchestrate goal-directed taskwork”
(Marks et al., 2001: 356). The attributes that are stressed in all definitions are
interdependence, common goals, and identity, as well as interactions among team
members.
Different team typologies have been presented in literature, but the categories often
overlap. Sundstrom et al. (1990) distinguish between advice and involvement teams,
production and service teams, project and development teams, and action and
negotiation teams. These four pairs of categories correspond notably to the four types
of teams suggested by Cohen and Bailey (1997): parallel, work, project, and
management teams. The most common type is the work team, which differs from other
forms in that it is a continuous work unit responsible for producing goods or providing
services, characterized by stable, full-time, and well-defined membership. Recently,
35
such teams have been increasingly organized as self-managing or empowered entities
to reduce costs or improve productivity (Pearson, 1992; Cohen and Ledford, 1994). In
contrast, project teams exist for a limited duration and usually are nonrepetitive.
Because their tasks are related to the development or introduction of new concepts
(e.g., products, information systems, plants), they commonly draw team members from
various functions to create a pool with specialized expertise. Parallel teams also attract
members from different work units, but their goal is to perform functions that the
regular organization is not prepared to do well. Typical examples include quality
circles or quality and employee improvement teams. These teams exist in parallel with
the established organization and have limited authority.
Team process
Another important construct used in all teamwork studies is the team process.
Gladstein (1984: 500) refers to group processes as “the intragroup and intergroup
actions that transform resources into a product” and differentiates between two forms
of process behavior: maintenance behaviors that build, strengthen, and regulate group
life and task behaviors that help the group achieve the common goal. Similarly, Cohen
and Bailey (1997: 244) highlight the central role of internal and external interaction
when they refer to the team process as “interactions such as communication and
conflict that occur among group members and external others.” Team process is also
regarded as “members’ interdependent acts that convert inputs to outcomes through
cognitive, verbal, and behavioral activities directed toward organizing taskwork to
achieve collective goals” (Marks et al., 2001: 357). In essence, this construct describes
how teams interact with one another and their environment to complete their tasks.
Team effectiveness
Probably the variable with the most crucial importance is team effectiveness. Most
models use different conceptualizations of this aspect, but the majority of effectiveness
variables are based on three fundamental dimensions: team performance, ability of the

36
team to work together over time, and satisfaction of team members’ needs (Hackman
and Morris, 1975). Cohen and Bailey (1997) also categorize effectiveness in three
dimensions, two of which refer to performance and member attitudes, such as
satisfaction, commitment, and trust. In addition, they highlight another set of
variables—behavioral outcomes such as absenteeism, turnover, and safety.
2.2.2. Small group effectiveness models and frameworks
The models discussed in this section and illustrated in Appendix B emerge from the
large body of small group research as the most influential and inclusive. Some have
served as a basis or frame of reference for numerous subsequent studies (McGrath,
1964; Gladstein, 1984; Hackman, 1987) and thus have shaped scientific thought on
group functioning. Others are based on extensive reviews of research conducted over
the years (Cohen and Bailey, 1997; Gist et al., 1987) and therefore integrate the most
relevant findings from those periods. As a result, these models may represent existing
conceptualizations of groups in organizations.
One of the classic models of team effectiveness, which originates from the social
psychology research stream, is that of McGrath (1964). Based on a typical input–
process–output view of teamwork, the model distinguishes among three categories of
inputs and outputs: those associated with individual group members; those that
describe the group as a whole; and those that refer to the physical, sociocultural, and
technological environment in which the group functions. A fundamental assumption of
this model is that input variables affect group outputs only through the interaction that
takes place in the group. This assumption, as well as the overall logic of the model, has
served as a basis for much subsequent research on team functioning.
Following an organizational psychology approach, Gladstein (1984) develops a
revised version of McGrath’s (1964) model that distinguishes between inputs at the
group and organizational levels. Furthermore, the inputs at group level are divided into
composition (adequate skills, heterogeneity, organizational tenure, job tenure) and
structure (role and goal clarity, specific work norms, task control, size, formal
leadership). The organizational variables considered important are the resources

37
available (training and technical consultation, markets served) and organizational
structure (rewards for group performance and supervisory control). The model predicts
that these inputs influence the team process, which in turn leads to effectiveness. The
key maintenance components of the team process include open communication,
supportiveness, and conflict, whereas the task components are discussion of strategy,
weighting individual inputs according to knowledge and skill, and boundary
management. According to the model, the group process–effectiveness link varies with
the nature of the task to be performed. For example, flexible communication patterns
likely lead to better performance only when task uncertainty is high. Consequently,
Gladstein (1984) suggests that the nature of the task has a moderating effect on the
link between process and performance and identifies three critical task dimensions
(task complexity, environmental uncertainty, and interdependence) derived from the
information processing approach (Galbraith, 1977; Lawrence and Lorsch, 1967). The
empirical study of 100 sales teams in a single organization provides support for some
of the hypothesized relationships. However, the group process scales form two
clusters, intragroup processes and boundary management, which indicates that sales
team members regarded behaviors they needed to interact with the external
environment as distinctly different from those required for internal interactions. The
link between group processes and performance, as measured by sales revenue, is not
supported, though Gladstein finds evidence of a link between intragroup processes and
subjectively rated effectiveness measures, such as team and customer satisfaction.
Hackman (1987) takes a more action-oriented approach and proposes a model that
defines group effectiveness as team performance, members’ satisfaction, and the
ability of the group to exist over time. Similarly, the input variables are divided into
organizational context and group design. However, this model suggests new variables,
namely, information systems as an important factor in the organizational context and
group norms pertaining to performance processes. The assumption is that group
members usually agree on approaches to performing a task during the early stages, but
not all actions and behaviors needed to achieve the group goals can be specified in
advance. Therefore, the development and execution of appropriate performance
strategies depends on established group norms. Hackman (1987) argues that the norms
38
that lead to higher performance are those that support self-regulation, situation
scanning, and strategy planning.
This author also challenges the traditional view of team functioning, in which input
variables influence performance exclusively through their effect on how team
members interact. Instead, he sees the interaction process both as an indicator of how
(and how well) the group is doing its work and as a point of intervention for improving
group performance. Therefore, he suggests focusing on those aspects of interaction
that relate directly to the team’s work on its task—the effort group members exert
collectively, the amount of knowledge and skills brought by members to the team, and
the appropriateness of the task performance strategies. These aspects are useful in
identifying the strengths and weaknesses of the group and directing improvement
interventions. The key proposition of this model is that overall team effectiveness is a
joint function of these three variables, which Hackman (1987) refers to as process
criteria of effectiveness. Moreover, group interaction offers a potential source of group
synergy that moderates the impact of design and contextual factors, because it helps
reduce process losses or create process gains.
In addition, a few models have been developed on the basis of summaries of empirical
studies. Such heuristic models have not been tested in practice and do not constitute an
exhaustive or definitive description of the variables and relationships impacting team
effectiveness. Nevertheless, they represent a useful point of reference because of their
broad theoretical basis. Reviewing articles from 27 journals in the period 1982–1987,
Gist et al. (1987) develop a heuristic model, in which design input variables have both
direct and indirect influences on team outcomes. The factors identified as key inputs
include group structure (size, ability, personality, gender, race), group strategies,
leadership, and reward allocation. Additional input variables appear in the reviewed
literature but were not included in the model, specifically, social comparison (Seta,
1982) and time limits and task types (Kelly and McGrath, 1985). Borrowing from
Hackman and Walton (1985), the outcome dimensions include group performance
(quantity, quality, and timeliness of group output), the degree to which group
processes increase members’ capability to work independently in the future, and the
extent to which the group contributes to the growth and personal well-being of team

39
members. The intervening role of these processes is represented by three groups of
factors: influence of members on one another, group development and member
integration, and decision making. The influence of other members should have
positive consequences as a result of facilitation and social impact, as well as negative
effects related to social loafing. These authors also analyze the effects of the decision-
making process on outcomes through variables such as participative decision making,
alternative/information generation, alternative evaluation, and consensus building.
Reviewing 54 studies from the period 1990–1996, Cohen and Bailey (1997) develop a
similar heuristic framework but focus on studies in organizational settings, in which
the dependent variables relate to various dimensions of effectiveness. As noted
previously, they differentiate among four types of teams—work, parallel, project, and
management teams—and consider the most important dimensions for each type. Their
model thus depicts team effectiveness as a function of task, group, and organization
design dimensions; environmental factors; internal and external processes; and group
psychosocial traits. Effectiveness combines performance outcomes (work quality and
productivity), attitudinal outcomes (job satisfaction and trust), and behavioral
outcomes (turnover and absenteeism). The model departs from the pure input–
process–output tradition by suggesting a richer set of relationships, such that design
factors can influence effectiveness both directly and indirectly. Furthermore, linkages
between the two types of processes suggest they should not be studied in isolation.
Finally, these authors predict that environmental factors affect only the design
variables, unlike other researchers, who believe they either have a direct influence on
team processes (McGrath, 1964) or moderate the relationship between process and
outcome (Gladstein, 1984). Moreover, novel in this framework is the separation of
group psychosocial traits from group processes. Psychosocial traits such as norms,
cohesiveness, and shared mental models can impact effectiveness directly, but more
important, they shape the internal and external processes of teamwork.
Another distinctive feature of this review is its recognition that critical interactions
occur both inside and outside the group, and hence, internal and external processes
determine performance. This recognition indicates a newer development in the
understanding of team functioning, not present in earlier studies. As Gist et al. (1987:

40
237) remark in their review of team research in the 1980s, “the limited empirical
literature on intergroup relations led to a decision to exclude this topic from review.”
The importance of external interaction, however, seems to vary across types of teams.
It appears mostly in a project team context, where groups are formed for R&D or
product development purposes, which requires cooperation across functional and
divisional borders in the organization (Ancona, 1990; Ancona and Caldwell, 1992 a, b;
Hansen, 1995; Kim and Lee, 1995).
Finally, much of the value of this research contribution lies in its selection of studies of
real organizational teams. Most group research has been conducted with laboratory
experiments, in which small groups of people (usually students) come together to work
for a limited period of time, with the assumption that the results from such
experiments can be generalized to real organizational settings. Gist et al. (1987) adopt
the same assumption and include in their review studies conducted in both the lab and
the field. However, experimental studies are often criticized for their lack of practical
relevance (Hackman, 1987; McGrath, 1964; McGrath and Kravitz, 1982; Smith and
Barclay, 1993). As Guzzo and Shea (1992) note, it is not certain if this methodology
allows inferences about natural groups; in laboratory settings, some of the variables
(e.g., external factors such organizational structure, reward systems, task
characteristics) that may powerfully affect outcomes remain constant, which makes it
impossible to determine their effects. This shortcoming is particularly obvious in a
GAM context, in which teams operate in a complex network of internal and external
relations, with loosely structured tasks and responsibilities, and in which team
members often receive direction from different managers and reward systems.
Therefore, the literature review herein excludes studies of this type and focuses
explicitly on empirical research in real organizational settings. In this respect, the
study on work teams by Campion et al. (1993) is worth discussing because it develops
and tests a full multivariate model of team effectiveness.
Campion et al. (1993) adopt a work design perspective to groups and examine the
relationships between design characteristics and various outcomes. Their literature
review led to the identification of five common themes of work group design,
containing 19 individual characteristics: job design (self-management, participation,

41
task variety, task significance, task identity), interdependence (task interdependence,
goal interdependence, interdependent feedback, rewards), composition (heterogeneity,
flexibility, relative size, preference for group work), context (training, managerial
support, communication/cooperation between groups), and process (potency, social
support, workload sharing, communication/cooperation within groups). Consistent
with prior studies (Gladstein, 1984; Hackman, 1987; Sundstrom et al, 1990; Wall et
al., 1986), their definition of effectiveness includes productivity and employee
satisfaction. In addition, managers’ judgments of effectiveness serve as an
effectiveness criterion. The model predicts a direct link between these five sets of
work group characteristics and outcomes but provides no indication about any
potential interrelations among these five factors or any moderating/mediating
influences in the design–outcome relationship. The empirical tests support the model,
and job design and process characteristics have slightly higher predictive power than
the other three themes. The managers’ judgments construct was most predictable,
followed by productivity and then satisfaction.
However, these discussed models display some differences in their conceptualizations.
Some focus on team and organizational design as the main determinants of
performance, whereas others examine the role of processes for team outcomes.
Although the focal point of most studies is the final effectiveness criteria, Hackman
(1987) distinguishes between intermediate and final criteria. In all cases, however,
aspects such as task characteristics, group composition, and organizational factors play
important roles. Furthermore, many of the constructs and the underlying logic are
similar in nature.
Although these models represent the state of the art in understanding team behavior,
they have been criticized for several reasons. First, they remain predominantly
heuristic and therefore offer a good conceptual overview of importance variables but
fail to identify the critical ones and their interrelations. That is, relationships appear in
terms of linear directions rather than functional forms or weights among variables
(Goodman et al., 1986). Second, the suggested lists of variables are usually very large
and constructs are broadly defined, which makes it difficult to assess the models’
validity. Further refinement of the variables and simplification of the models could

42
help uncover some less obvious relationships. Third, a major concern results from the
role of time for team interactions and performance, in that none of the models
explicitly considers the dynamic nature of team functioning. In response, some
research has looked more closely at the influence of time (Gersick, 1988, 1989; Kelly
and McGrath, 1985; Kozlowski et al., 1999; McGrath, 1991). For example, McGrath
(1991) suggests that teams usually engage in multiple activities over time, which
simultaneously creates complex sequences of interdependent tasks that cannot be
presented within a single, static model. Kozlowski et al. (1999) argue that team tasks
follow a cyclical path that leads to the creation of learning skills at different stages of
development. Thus, “team compilation is a sequence of modal phases and transition
points” (Kozlowski et al., 1999: 248). The notion of time as an environmental factor
linked to goal achievement in an episodic framework is the fundamental assumption of
the temporally based framework of team processes offered by Marks et al. (2001), who
argue that team performance is best depicted by a series of related input–process–
output episodes in which outcomes from earlier episodes serve as inputs for the later
cycles. As a result, teams engage in two main types of interactions, which follow each
other sequentially: action processes that contribute directly to accomplishing goals and
transition processes that pertain to the evaluation and/or planning activities to guide
team goal accomplishment. Both action and transition phases are accompanied by
interpersonal team processes, such as conflict management, motivation and confidence
building, and affect management.
2.2.3. Limitations
In addition to the methodological limitations, such as the use of laboratory
experiments, this group of studies offers limited applicability to studying GAM teams
because of their low generalizability, specifically, their varying explanatory power and
predictability across different types of groups. Although many of the constructs and
findings can be useful for understanding the way GAM teams interact and perform,
some major differences remain between small groups in organizations and this form of
teamwork. First, the responsibility of GAM teams is to manage relationships with the
43
largest and most important customers, which involves complex interactions with
groups external to the organization (customers, competitors), whereas most small
group research uses more bounded or isolated groups as the unit of analysis. Second,
GAM teams are usually cross-functional and geographically dispersed, so they must
manage complex relationships both within the team and with other parts of the
organization. These challenges are not evident in studies of smaller organizational
teams. Third, the general models of team effectiveness usually assume that teams form
to perform well-defined tasks and have clear goals. In the dynamic GAM context,
however, tasks are likely to be unstructured, customer-specific, and evolving over the
course of the customer relationship. Furthermore, the involvement of people from
different functions and country organizations can lead to a complex matrix in which
GAM members report to different managers and have blurred tasks and
responsibilities (Birkinshaw et al., 2001). All these aspects necessitate the examination
of team research in areas more closely related to GAM. Consequently, the next section
reviews literature on cross-functional teams.

44
2.3. Cross-functional teams
Cross-functional teams are widely used in companies, particularly those that want to
cut cycle times for new product development (Ancona and Caldwell, 1992c; Hitt et al.,
1993). The most typical form of cross-functional teams is a working group that links
with multiple subunits of the organization and overlays existing functional structures.
Such teams are designed to integrate the expertise of different functions and may
include planning, quality, process improvement, product development, or various ad
hoc project teams. Cross-functional teams differ from conventional teams in several
aspects. First, they include members from various parts of the organization who
possess competing social identities and perform tasks for other subunits (Alderfer,
1987). Second, the team’s lifespan is usually short, because such teams form
specifically for temporary tasks. Third, the performance expectations of cross-
functional teams usually differ, in that they are concerned with more subtle and
intangible outputs such as innovation and knowledge dissemination (Denison et al.,
1996).
In searching for the determinants of effective new product development, studies in this
area identify two groups of factors: team diversity in terms of the functional expertise
and skills represented by members and the ability to span organizational borders to
integrate various inputs (Fruin, 1996). Due to the importance of these two factors, the
next sections contain more detailed examinations of them.
2.3.1. Functional diversity
Empirical research on functional diversity in teams has shown both positive and
negative links to performance. In a thorough review of team diversity literature,
Williams and O’Reilly (1998) find that functionally diverse teams perform at a higher
level than teams composed of members from similar functions. For example, cross-
functional teams produce more successful administrative innovations (Bantel and
Jackson, 1989), developing clearer strategies (Bantel, 1993), react more appropriately
to environmental change (Keck and Tushman, 1993), respond more effectively to
competitive threats (Hambrick et al., 1996), and take less time to implement

45
organizational changes (Williams et al., 1995). From an internal perspective, such
teams tend to possess a wider range of viewpoints, which leads to more extensive and
creative information exchange within the team (Glick et al., 1993). Externally, they
also are likely to communicate more often and more successfully, which ensures more
external resources for the team (Ancona and Caldwell, 1992a).
At the same time, functional diversity can have some negative consequences due to the
inherent differences in opinions and perspectives. Such consequences can include
increased conflict, reduced group cohesion, and communication difficulties within the
team (Knight et al., 1999; Pelled et al., 1999; Wagner et al., 1984). In some cases,
diversity in function even compromises performance (Murray, 1989; Simons et al.,
1999). As a result, studies that review the extensive body of group diversity literature
(Milliken and Martins, 1996; Williams and O’Reilly, 1998) conclude that functional
diversity is a double-edged sword that has both positive and negative effects,
depending on the context and the process or performance variables being investigated.
Bunderson and Sutcliffe (2002) challenge these findings by arguing that the difference
in effects could be a function of not only the examined context or dependent variables
but also the way in which functional diversity has been conceptualized and measured.
They imagine the construct in two ways: dominant and intrapersonal functional
diversity. Dominant function diversity refers to the extent to which team members
differ in the functional areas in which they have gained the most experience during
their careers. The larger the number of functions represented in the team in this way,
the broader the knowledge base of the team should be. Intrapersonal functional
diversity, in contrast, refers to the diversity represented in the functional backgrounds
of individual team members, that is, the extent to which each member is a narrow
functional specialist with experience in a limited number of functions or a broad
generalist who has worked in various functional areas. The two conceptualizations are
fundamentally different; dominant function diversity pertains to the breadth of
functional experiences at a team level, whereas intrapersonal functional diversity
concerns functional diversity at an individual team member level. Bunderson and
Sutcliffe (2002) find empirical evidence that intrapersonal functional diversity relates
positively to performance, though the relationship is mediated by the information
46
sharing process. However, the results for dominant function diversity suggest a
negative influence on performance, only partially mediated by information sharing,
which indicates it may lead to further negative consequences, such as increased
conflict, slower decision making, and coordination difficulties. Thus, teams composed
of functionally broad members likely perform better, because these members are more
motivated to share information and understand one another’s positions; they also are
less susceptible to stereotypes and biases about other functions, which could impede
their successful collaboration.
With a few exceptions (Ancona and Caldwell, 1992b; Pelled et al., 1999), research on
functional diversity exclusively addresses top management teams, which differ from
more conventional cross-functional teams. To expand its scope, this literature review
also considers studies of other organizational groups, such as product development
teams. In their model of new product team performance, Ancona and Caldwell (1992b)
examine the direct and indirect effects of group heterogeneity on team performance
and emphasize the intervening role of internal and external group processes. The
critically important elements of team diversity in such teams are organizational tenure
and functional diversity. Those who join the organization at a similar time tend to have
more opportunities for interaction, develop similar experiences and perspectives, and,
as a result, create more cohesive work groups. Similarly, it may prove difficult for
people from different functional areas to develop an effective work process because of
the different perspectives they bring to the team. Consequently, Ancona and Caldwell
(1992b) predict that tenure and functional diversity have negative influences on
internal task processes but relate positively to external communications. They reason
that diverse team members have access to a wide set of external networks they can use
to accomplish group goals. In addition to the indirect link with performance through
the processes, the two demographic variables may be directly and positively related to
performance (both team- and managerial-rated). Although the authors expect them to
have similar effects, the empirical results indicate that each variable has its own
distinct effects. Thus, heterogeneity in terms of tenure has a positive influence on
internal task processes, such as goal and priority clarification, which in turn lead to
higher team ratings of performance. In contrast, the diversity of represented functions

47
enhances external communication, which is associated with higher managerial ratings
of performance. However, the direct impact of both independent variables on team
performance is negative and significant, which indicates that the link between diversity
and team performance may not be straightforward. A possible explanation for these
conflicting results could be a missing mediating variable, such as conflict, that
impedes performance. Thus, for example, cross-functional teams may have strong
creative potential but poor implementation because of their weaker teamwork
capabilities or because they lack social cohesion, which prevents their effective use of
the information and resources obtained from the outside.
Building on Ancona and Caldwell’s (1992b) suggestion that further research should
assess the mediating effect of conflict, Pelled et al. (1999) develop a model of the
relationships using diversity, conflict, and performance and test it with cross-
functional teams responsible for new product and process development. In this model,
tenure and functional diversity represent job-related types of diversity, and three other
heterogeneity variables are added, namely, age, gender, and race. Task conflict,
defined as disagreement about task issues such as goals, procedures, and courses of
action, is mostly driven by job-related diversity and enhances cognitive task
performance. They argue that differences in viewpoints encourage teams to gather
more information, analyze issues more extensively, and reach alternative solutions. In
contrast, the three other diversity constructs lead to emotional conflict, which
decreases performance due to interpersonal clashes. Similar to Ancona and Caldwell
(1992b), these authors conclude that the performance of cross-functional teams can be
influenced in both positive and negative directions by various team composition
characteristics and that different types of team diversity lead to different results. Here,
the benefits of functional heterogeneity may be counterbalanced by other
dissimilarities among team members, which increase conflict and diminish
performance. The novelty of this research is that it introduces conflict as a key
intervening variable and delineates two types of conflict.

48
2.3.2. External activity
The other factor likely to determine the performance of cross-functional teams is the
interaction between the team and its context. Although organizational context and an
organization’s impact on teams appear among the variables of the group models
discussed previously (Gladstein, 1984; Hackman, 1987), these studies consider context
as a given and depict teams as without much control over it. Thus, groups get treated
as closed systems, in which the main issue of interest is the interaction among team
members. From a resource-dependence perspective however, groups actively manage
their relations with external parties to secure access to vital resources and information
(Pfeffer, 1986). This activity is particularly prevalent among teams, which depend
extensively on inputs from other units of the organization and therefore need to gain
support from those entities or senior management. Consequently, Ancona and
Caldwell (2000) argue that interactions between teams and external environments
should be studied in a more action-oriented manner and that managers should
configure teams specifically to maximize external boundary-spanning activities. As
this description often holds true for GAM teams, some implications for the study of
GAM teams can be drawn from this limited body of literature.
A few studies have addressed different aspects of the interaction between a team and
its context. For some, the focal point is the amount of information exchanged with
external entities; they argue mostly that teams should match their information-
processing capability to the information-processing capability of the context (Nadler
and Tushman, 1988; Gresov, 1989). Others examine more specific types of external
interaction, such as boundary spanning and the transfer of technical information in an
R&D context, and identify various communication roles, such as stars, gatekeepers,
and liaisons (Allen, 1984; Tushman, 1977, 1979; Tushman and Katz, 1980). For
example, Tushman and Katz (1980) suggest that certain boundary-spanning persons,
whom they label gatekeepers, can fulfill an important linking function between project
teams and outsiders: They develop links to external domains and facilitate
communication. Empirical findings support the hypothesis that teams with gatekeepers
perform better than teams without such mediators, which implies that external
communication is positively associated with team performance.

49
Although these researchers demonstrate the importance of external communication
and identify some key dimensions, they analyze only a small number of specific
aspects. A more extensive, “external” perspective of teams mostly is associated with
the work of Ancona and Caldwell (Ancona, 1987, 1990; Ancona and Caldwell, 1988,
1992a, b, c, 2000). For example, Ancona (1990) describes the role orientations of
consulting teams in an educational organization and reveals three strategies that teams
adopt toward their environment: informing, parading, and probing. Informing teams
remain concentrated on internal processes and relatively isolated from the outside
world, whereas parading teams take a more balanced approach of simultaneously
building internal cohesion and achieving external visibility for the team’s work and
importance. However, this latter group exhibits high levels of passive observation of
the environment. In contrast, probing teams stress external processes and require their
members to engage outsiders actively in the teamwork to understand their needs and
test possible new solutions. This final type of team achieves the highest performance,
though they rank poorly in terms of cohesiveness and member satisfaction in the short
run. That is, external activities are better predictors of performance. However, this
study examines teams with a high degree of external dependence in a new and
demanding environment, so these results might not be valid in contexts with lower
complexity.
Ancona and Caldwell (1992a) extend this research and propose a taxonomy of external
activities and strategies based on an empirical investigation of new product teams. The
most common activities include ambassador (buffering and representation), task
coordinator (technical coordination), scout (information gathering and scanning), and
guard (protecting internal information). Teams use different strategies according to the
combinations of their activities. Some are specialized (e.g., ambassadorial or technical
scouting teams). Others prefer a generalist approach and engage simultaneously in
ambassadorial and technical scouting activities. Yet another group chooses an
isolationist strategy with low levels of external interaction. These four strategies, as
well as their relationship to performance and internal processes, are similar to those
identified by Ancona (1990). In contrast to propositions from information processing
theory, the type of external activities rather than the amount and frequency of external

50
communication determines performance. Specifically, according to the empirical
evidence, technical scouting and isolationist strategies suffer poor performance,
whereas the ambassadorial strategy performs well in the short run and comprehensive
teams are the best performers. These findings imply that managing the power structure
and persuading others to support the team has positive consequences in the short term.
However, only teams that successfully manage both the power structure and the
workflow structure (i.e., both external and internal activities) can maintain their
performance over time. Such comprehensive teams usually create positive cycles of
external activities and internal processes, which enables them to meet budget and
schedule demands in the short run and develop innovative products in the longer term.
Similar results are reported by Zirger and Maidique (1990) in their study of new
product development processes in high-tech companies. This finding has a very
important implication for GAM teams; namely, their performance depends on how
they manage to balance the needs for external interactions and intrateam collaboration.
Although literature on cross-functional teams has generated some valuable insights
into the way such teams function, it has not provided a more comprehensive
framework for understanding team effectiveness. Aiming to overcome this limitation,
Denison et al. (1996) develop and validate a diagnostic model that focuses on three
domains: organizational context, internal process, and outcome measures. The key
variables defining the context in which cross-functional teams operate include
coordination with other teams, autonomy and power, linkages to functions, resources,
mission and direction, and reward for team performance. Thus, context is depicted in a
broader way to include both external process dimensions, such as coordination with
other teams and functions, and organizational factors, which are less likely to be
determined by the team itself. The primary contribution of these findings is that they
identify hierarchical, lateral, and function-specific links, missing from previous
research (Ancona and Caldwell, 1992a, b). The process dimension encompasses
aspects of intragroup interaction such as norms, the importance of work, effort,
efficiency, creative strategy, and breadth. This conceptualization is based on
Hackman’s (1987) process criteria of effectiveness but extends to include measures
such as breadth of perspectives and efficiency. Another contribution is its
51
identification of a broader set of outcome measures than those in previous models. The
range of performance indicators includes factors such as information creation, time
compression, image expansion, learning, growth satisfaction, capability development,
and overall effectiveness. These results imply that both short- and long-term measures
should be applied to assess performance appropriately. Although Denison et al. (1996)
provide a broad definition of concepts and a useful framework for studying cross-
functional teams, they do not reveal the interactions among their lists of variables. As a
result, it remains unclear how different aspects of context and process affect
performance.
2.3.3. Limitations
Research on cross-functional teams helps forward the understanding of GAM teams,
because it shifts the focus from small and relatively isolated groups to more complex
teams, which must manage relations with various stakeholders in the organization. It
also offers some useful implications, such as the important roles of external activity
and context. In addition, it uses more empirical research methods to investigate real
organizational teams.
However, several limitations are common to cross-functional team literature. First, the
effect of different structural designs on team performance has not been extensively
researched. Apart from the impact of functional diversity and tenure (Ancona and
Caldwell, 1992b), very little is known about other dimensions of team composition,
such as the role of the team manager, team size, and skills other than functional
expertise. Second, most studies focus on task-focused, limited-duration teams that
form for a specific project and are dismantled after its completion. In contrast, GAM
teams create and maintain long-term relationships with global customers. In turn, their
long-term, relation-oriented goal often clashes with the short-term, profit-driven
objectives of some team members or units that must support the team. This conflict
heightens the importance of factors such as role clarification, empowerment, rewards,
and top management support, which do not appear in cross-functional team literature.
Moreover, the short-term nature of cross-functional teams stresses a different skill set
52
compared with that required by GAM teams. Although cross-functional team
performance depends on the team’s ability to develop a collaborative team process
during early stages to avoid conflicts (Ford and Randolph, 1992), their emphasis is
primarily on team members’ product or functional expertise rather than their
relationship-building and communication skills. In contrast, GAM emphasizes
intercultural, social, managerial, and strategic skills, which are stronger predictors of
people’s ability to work together over time, handle less structured tasks, and achieve
long-term goals. As a result, to integrate literature on teams whose natures are more
similar to GAM teams, the next section reviews research contributions on team selling.

53
2.4. Sales teams
Although much more complicated and far-reaching than traditional selling, GAM can
be subsumed within the wider context of sales and marketing management.
Consequently, the body of research on team selling may be a fruitful source of ideas
for the conceptualization of GAM teams.
Functional groups other than sales play increasing roles in servicing key customers
(Hutt et al., 1985). As a result, the literature in this field distinguishes between core
selling teams, which have a permanent responsibility for specific accounts, and the
larger selling center, which includes members of other functional units on a part-time
or ad hoc basis. Before models of team processes and performance can be analyzed, a
clear understanding of the composition of these teams is necessary, which implies (1) a
definition of the selling team and (2) a delineation of functions and roles involved in
the sales process.
2.4.1. Team selling definition
The terms selling team and selling center are often used interchangeably and
inconsistently in academic literature; some authors use one term to describe groups
that are relatively permanent and customer-oriented, whereas others use the same term
for groups of a rather temporary and transaction-oriented nature. Hutt et al. (1985: 38)
refer to a selling center as a rather permanent formation and note that “a national
account program might be considered a formalized selling center.” In contrast, Moon
and Armstrong (1994) define the selling team as a relatively permanent, customer-
focused group whose primary objective is to establish and maintain strong customer
relationships. Membership in such teams is relatively stable and determined by
assignment to a specific buying organization. The selling center, however, refers to a
transaction-focused group with the objective of successfully completing a specific
sales task. Its membership is very fluid and determined by involvement in a sales
transaction for a particular good or service. In practice, it might be difficult to
distinguish where the team ends and the selling center begins, so it may be helpful to
think of these forms not as mutually exclusive but as endpoints on a continuum (Smith

54
and Barclay, 1990). On the basis of this conclusion, this literature review involves
studies that explore groups at the higher end of the continuum in terms of long-term
customer focus. Although both selling team and selling center terminology may be
employed, in neither case does this review refer to less stable, transaction-oriented
formations.
Selling center literature has emerged from the observation that in certain conditions,
the supplier–customer interaction involves a large number of people on both sides.
Therefore, the selling center concept is an extension of the buying center idea,
originally developed by Robinson et al. (1967) and later extended by various authors
(e.g., Bunn, 1993; Johnston and Bonoma, 1981; Lau et al., 1999; Spekman and Stern,
1979; Wilson et al., 1991).
Similar to the buying center, which consists of “those members of an organization who
become involved in the buying process for a particular product or service” (Johnston
and Bonoma, 1981: 143), the selling center includes persons from the selling company
who are involved in the selling process to a particular customer. Hutt et al. (1985: 33)
describe them as “the organizational members who are involved in initiating and
maintaining exchange relationships with industrial customers.” This definition
recognizes that the special requirements of the buyer necessitate the involvement of
functional areas such as physical distribution, R&D, manufacturing, and technical
services in the selling process. Therefore, the selling center can be depicted as an
interfunctional decision unit with representatives from both inside and outside the
selling organization. In turn, one of the key dimensions of selling teams is functional
interdependence.
2.4.2. Functional interdependence
Spekman and Johnston (1986) stress that all parts of a company are linked inextricably
to the success of the marketing and selling plan and that value to the customer is often
a result of joint activities that converge to satisfy the customer’s purchasing criteria.
This convergence requires the management of interdependencies among functional
units, which is ultimately driven by the corporate plan and therefore should involve

55
both senior management and sales and marketing management. The first step in
building an effective selling center is the diagnosis of the degrees of functional
interdependence that exist in the organization and their effect on competitive
advantage. This type of analysis can enhance understanding of the responsibilities to
be undertaken by different functions to serve the customer and can help identify
deficiencies in critical areas that must be assessed and eliminated.
The selling center consists of people from different functional units who are
responsible for different tasks; the key salespeople must initiate and manage
communications with the functional specialists. Facilitating and coordinating
cooperation among the functional units is crucial because each department is likely to
have different objectives and priorities, as well as different views of the customer
(Spekman and Johnston, 1986).
On the basis of social systems theory and resource dependence models, Ruekert and
Walker (1987) develop a framework that clarifies the interaction across different
functional areas and different types of marketing positions. Using the system-structural
perspective (Van de Ven, 1976), it explores the interrelations among three groups of
dimensions: situational, structural and process, and outcome. The centerpiece of the
framework is the interaction process between marketing and other functional areas,
which is divided into transactions, communication flows, and coordination patterns.
The authors propose that transactions between marketing and other functions take the
form of exchanges of resources, work, and technical assistance. At the same time,
these interactions require information flow exchanges, which are determined by the
amount of communication, the difficulty of communication, and the degree of
formalization. Furthermore, interaction must be coordinated through formal rules and
procedures, informal influence, and/or conflict-resolution mechanisms. Each of these
three process dimensions is influenced by the context within which the interaction
takes place, so the framework distinguishes between two groups of contextual
dimensions: internal environmental conditions including resource dependence, domain
similarity, and strategic imperatives and external environmental conditions, such as
complexity and turbulence. Finally, the interaction process determines the nature of
the performance outcomes, explicitly divided into functional and psychosocial

56
outcomes. Beyond the functional result of achieving the goals desired by marketing
and the other functions, psychosocial outcomes, such as the perceived effectiveness of
the relationship and conflicts, determine the willingness of members to participate in
similar forms of cooperation in the future.
This framework is generally supported by the preliminary empirical tests, but though
the relations between situational and process variables earn strong support from both
marketing and nonmarketing respondents, the impact of the interaction process on
outcomes produces mixed results. The perceptions of the effectiveness of the
relationship are inconsistent across functions, which suggests that marketing’s
relations with other areas might depend on the kind of resources being exchanged.
2.4.3. Selling center composition
The second step in understanding the selling center involves an examination of its
composition, coordination, and control mechanisms. Johnston and Bonoma (1981) use
five dimensions to describe the composition of the buying center: (1) vertical
involvement, or the number of hierarchical levels of the organization represented in
the center; (2) horizontal involvement, or the number of different departments
involved; (3) extensivity, or the number of members belonging to the center; (4)
connectedness, or the degree of direct communication links between members; and (5)
member centrality, or the number of communication links between a member and
other center participants divided by the total number of possible links.
Moon and Armstrong (1994) hypothesize these five dimensions also can apply to
selling center composition, according to several factors. First, if the purchase situation
contains a higher degree of novelty for the buyer, the selling center will achieve
greater vertical and horizontal involvement, as well as greater extensivity and
connectedness. Novel situations require more extensive information flows to the buyer
and make customer needs more uncertain, which necessitates more complex
communication patterns and the involvement of more functions and management
levels. The same effects are likely when the sales situation is more novel to the
supplier. This hypothesis matches Hutt et al.’s (1985) finding that new selling

57
situations demand more information and problem solving by the selling organization.
In addition, such situations require more substantial management involvement and
hence result in higher levels of vertical integration. Novel selling situations also have
important implications for the coordination and control strategies adopted by the
selling firm. Because such situations are characterized by higher interdependence and
task uncertainty, less formal coordination strategies, such as spontaneous contacts
between managers and greater horizontal information flows, likely will be more
appropriate (McCann and Galbraith, 1981).
Second, the greater importance of the sales opportunity to the customer and the
supplier may make the selling center larger, wider, and more connected. The logical
explanation is that situations of strategic importance tend to require greater resource
commitments to meet objectives.
Third, Moon and Armstrong (1994) find that selling center composition is influenced
by the experience of members. Low levels of experience relate to greater centrality of
the member due to his or her need to obtain more information and guidance from other
members. Lack of experience also leads to greater vertical integration, because it
necessitates more extensive management involvement and monitoring.
2.4.4. Roles of selling center members
Buying center literature distinguishes among the different roles of buying center
members. For example, Robinson et al. (1967) identify deciders, influencers,
gatekeepers, users, and buyers. Selling center members likely also play distinct roles.
Moon and Armstrong (1994) define five such roles: initiator, coordinator, resource,
approver, and implementer. As the name suggests, the initiator first recognizes a
business opportunity and seeks support within the supplier company to realize that
opportunity. The coordinator’s role is to ensure that all members work together
effectively, while the approver reviews their work and suggests improvements. The
resource and implementer provide expertise and carry out the main tasks.

58
Hutt et al. (1985) outline five roles as well, namely, responsible, approve, consult,
inform, and implement. The responsible role, similar to the initiator role of Moon and
Armstrong (1994), takes the initiative to analyze customer needs, develops
alternatives, and makes an initial recommendation. The approval and implementation
roles are also analogous, whereas the consulting reflects slightly different content.
2.4.5. Selling team frameworks
A summary of the most relevant selling team frameworks appears in Appendix C.
Despite its potential managerial implications, research on the link between selling
team composition and team performance remains scarce. Using the contributions of
Ruekert and Walker (1987), Moon and Armstrong (1994), and Souder (1987), Moon
and Gupta (1997) develop an input–process–output model that links the situational,
structural, and outcome dimensions of selling center formations. Whereas Ruekert and
Walker (1987) include both internal and external environmental conditions as
determinants of team structure and process, this framework proposes that only the
internal environment has a direct influence on these dimensions. Furthermore, it
suggests different variables characterize the internal company environment—market
orientation and information infrastructure. The influence of external environmental
complexity is limited to its moderating effect on the link between the size and shape of
the selling center and functional outcomes. This conceptualization of selling center
structure meets Johnston and Bonoma’s (1981) dimensions, as adapted by Moon and
Armstrong (1994). However, in this case, the connectedness dimension represents a
process rather than structural variable and therefore, together with difficulty of
communication, describes the communication processes among selling center
participants. Adapted from Ruekert and Walker’s (1987) model, the suggested
outcomes are based on both functional and psychosocial variables. This research
identifies customer responsiveness as an additional functional outcome, and by
reflecting the nature of the selling center better, it emphasizes the crucial task of
satisfying customer requests to remain successful during both current sales
opportunities and future interactions (Wilson, 1995). The framework enhances

59
understanding of the structure, functions, and performance effects of selling centers, as
well as the factors that can enhance or inhibit an organization’s ability to seize and
deliver on selling opportunities. However, its lack of empirical tests of the
hypothesized interrelations constitutes a major limitation that has not been addressed
in subsequent studies.
Another framework of team selling effectiveness developed by Smith and Barclay
(1993) represents a concerted effort to understand team selling and draws on
constructs from the multidisciplinary small group research stream to create an
integrative conceptual framework. Based on McGrath’s (1964) input–process–output
view of team functioning, the framework includes a long list of variables at the
individual, group, organizational, and task/environmental levels. Its major contribution
is the broad array of identified factors and relationships involved in team selling
effectiveness and their delineation at four distinct levels.
In a next step, Smith and Barclay (1993) refine the framework by eliminating the
variables with relatively lower theoretical and managerial relevance for a team selling
context. The resulting team selling model identifies key constructs at the individual,
group, and organizational levels and hypothesizes that they influence perceived task
performance either directly or indirectly through their effect on two group process
factors: selling center cohesiveness and boundary management. Thus, the effectiveness
measure with the highest relevance is the subjective evaluation of the degree to which
a selling center achieves its goals and objectives. This approach suggests that group-
level outcomes are more appropriate performance measures than individual and
organizational outcomes in studies of selling centers. Furthermore, it improves on
objective performance outcomes, which are difficult to measure in a team selling
context (Gladstein, 1984). However, it still allows for a strong evaluation basis,
because it can be measured by the team, its management, and/or customers. According
to this revised framework, selling center cohesiveness and boundary management,
which reflect both the internal processes of belonging to and actively participating in a
team and the external processes of communication and resource acquisition, are
influenced by five constructs at three levels: (1) individual level, with participative
leader behavior and supportive leader behavior; (2) group level, including member

60
interdependence and potency; and (3) organizational level, or market orientation.
Although the individual and organizational level factors should influence effectiveness
only indirectly through the process variables, the group-level inputs influence
perceived task performance both directly and indirectly. The idea that the selling task
is influenced by both internal and external interaction processes is similar to the
concept at the heart of Ruekert and Walker’s (1987) and Moon and Gupta’s (1997)
models. However, Smith and Barclay’s (1993) input dimensions present a different set
of variables and, most important, introduce the leader behavior and potency constructs.
This incorporation of leadership aspects responds to the suggestion of Perry et al.
(1999) that leadership and empowerment are major determinants of selling team
outcomes. Because sales managers ultimately have less time and opportunity to
micromanage sales teams as their span of control increases, Perry et al. (1999) argue
that empowerment and shared leadership can enhance team effectiveness. They
explain this claim by arguing that given sufficient power and authority to lead
themselves, teams develop greater levels of collaboration and coordination and make
better decisions that are based on the unique skills of all members. Katzenbach and
Smith’s (1993) study of teams also provides evidence that high-performance teams
engage in shared leadership much more often than do other teams.
In their model of empowered selling teams, Perry et al. (1999) identify five basic types
of leadership behavior (transactional, transformational, directive, empowering, and
social supportive) that team members might share. Although empowered teams are
responsible for making decisions on their own, they cannot function completely
independently; therefore, the model assumes that vertical leadership also plays a role
by influencing team characteristics and shared leadership. However, the vertical
manager’s role differs from that portrayed in traditional models of vertical leadership,
because the responsibilities include team design, boundary management, contingent
support, and facilitating empowerment within the team. The inputs to the model reflect
two aspects: team and task characteristics. Perry et al. (1999) identify five key
composition characteristics: proximity, ability, maturity, diversity, and team size.
Whereas higher ability and maturity likely lead to shared leadership, the effect of the
other three variables is less clear. As teams become larger, more dispersed, and more
61
diverse, the increasing difficulty of communication and coordination make shared
leadership less likely. However, the process of shared authority and decision making in
such conditions can provide a better mechanism for team interaction than would a
single vertical leader. Finally, the model distinguishes between two types of outcomes:
intermediate, represented by affective/cognitive and behavioral responses to the shared
leadership process, and ultimate, reflected in team effectiveness. Arguing that selling
team effectiveness should not be measured solely by sales volume at a single point in
time because of the long-term nature of developing customer relationships, the authors
suggest both qualitative and quantitative effectiveness measures. The qualitative
criteria include ratings by the team, its management, and the customer, whereas the
qualitative measures focus on sales volume and profitability.
Although the reviewed models exhibit a wide variety of relevant variables and
hypothesized relationships, several common themes emerge. First, all models are of
the input–process–output type, which indicates that team processes play important
intervening roles in the team characteristics–performance relationship. Although some
input variables also may have direct effects on performance, the influence usually
works through the internal and external interactions of the team, which then shape the
outcomes. Second, team composition and process are rarely considered in isolation;
rather, the models consider the influence of environmental factors and the selling task
characteristics, though in different ways. For example, the nature of the selling task
and environmental complexity appear as independent variables in some models (Perry
et al, 1999; Ruekert and Walker, 1987) but as moderators of the link between team
composition and performance in others (Moon and Gupta, 1997). Third, this literature
appears to accept that outcomes have two components, functional and psychological.
Furthermore, the studies recognize that quantitative indicators such as sales volume
and profitability are likely to be affected by many factors external to the team and the
company. Consequently, such measures are usually avoided, and team performance is
conceptualized as perceived task performance or the accomplishment of specified
goals.

62
2.4.6. Limitations
Selling team research can offer some insights into GAM teams because it involves
tasks that are more similar to those of GAM teams. However, its implications also are
limited because team selling literature does not capture the difficulty of managing
multinational teams that cross geographic and business unit boundaries. Furthermore,
the focus is primarily on selling, whereas the role of GAM teams goes far beyond sales
and includes developing innovative solutions for the customer and coordinating
processes along the entire value chain. The key limitation of team selling research,
however, is the lack of empirical validation of the proposed models. All are conceptual
and unsupported by empirical research.
2.5. Summary of research gaps
In summary, no clear conceptualization of what constitutes a GAM team exists, which
highlights the need for an integrated framework to address this research gap. The
review of organizational behavior studies indicates a wide range of team constructs
and relationships, but most findings are context specific with low degrees of
generalizability, making it difficult to compare results and preventing the direct
transfer of frameworks and concepts to a GAM context. For example, GAM teams
differ from (1) pure sales teams in that they reflect the increased organizational
complexity, cultural diversity, and complexity of solutions associated with global
customers; (2) cross-functional teams in that they have a long-term, continuous task;
and (3) other small groups in that they have a much higher degree of external
interactions, blurred boundaries and responsibilities, and less structured tasks.
Consequently, as a distinct type of group, the GAM team requires more profound
investigation to identify which of these constructs are most relevant for team
performance in a global customer management context.
63
3. Conceptual framework
3.1. Framework development
3.1.1. Overview
The findings from the literature, together with the research objective and questions,
determine the research design that led to the development and validation of the
conceptual framework. On the one hand, the general phenomenon of teamwork is not
new, and prior studies have developed a variety of concepts to explain it, which favors
a more quantitative approach. On the other hand, the specific context of teamwork in a
GAM setting remains underresearched and requires further elucidation of the relevant
concepts, which makes qualitative research methods more appropriate. To address
both sides, this research follows a two-stage approach. The first phase, exploratory and
qualitative in nature, aims to deepen understanding of GAM teamwork by determining
which of the wide array of variables proposed in the literature have the greatest
relevance in a GAM context and exploring whether any additional factors determine
team formation, interaction, and performance. This phase ends with the development
of the framework. The second stage is quantitative and builds on the first by
empirically testing the framework that emerges from the investigation.
In the beginning of this research, the scope of the phenomenon and the related
concepts were relatively unclear, which required a flexible and unrestrictive research
design. Therefore, a qualitative approach appeared the best way to start the research
process. The qualitative approach provides a deeper understanding through less
structured research techniques and more open-ended questions. In turn, it provides
more flexibility and greater possibility to explore various directions. Furthermore,
qualitative data offer rich descriptions of processes in a local context and preserve
chronological flows, which enables researchers to determine which events lead to
specific consequences (Miles and Huberman, 1994). They are also useful for
explaining why emergent relationships hold and providing an understanding of the
dynamics of a phenomenon (Eisenhardt, 1989). Thus, data provided through
qualitative research represent the best strategy for exploring a new area and developing
hypotheses.
64
An evaluation of the major phenomenological, or qualitative, methodologies—action
research, case studies, ethnography, grounded theory, hermeneutics, and participative
enquiry (Collis and Hussey, 2003)—reveals that an approach based on grounded
theory would be the most appropriate for framework development. Originating from
Glaser and Strauss’s (1967) work, this methodology entails a systematic set of
procedures that develop a theoretical framework through an iterative process of
alternating inductive and deductive methods. Theory development follows a
progression in which the researcher collects information, develops proposals or
hypotheses on the basis of the collected data, and then goes back to the field to test the
hypotheses or fill in missing information. This cycling back and forth between theory
construction and data examination results in continuous improvements and a solid
grounding for the emerging theory (Glaser and Strauss, 1967).
3.1.2. Qualitative study description
The qualitative study that assisted the framework development is based on 13
exploratory in-depth interviews with GAM experts from 12 companies conducted
during May–July 2006. The list of interview partners appears in Appendix D. In
selecting interviewees, I followed the principles of theoretical sampling, which
requires the sampling to develop the researcher’s theory, not represent a population, as
is common in interview research (Strauss and Corbin, 1990). The criteria for selecting
the companies were as follows:
- Large multinational companies with an established GAM program.
- Extensive use of GAM teams.
- Different extent of GAM development.
- Representative of different industries.
First, I identified a sample of companies that meet these criteria, according to
knowledge gleaned from various practical projects and research into practice-oriented
literature (primarily publications of the Strategic Account Management Association),
which provides examples of the GAM practices of different multinational companies.

65
Second, I identified the most appropriate informants in these companies, namely, the
person responsible for managing GAM teams. At this stage of the research process, it
was crucial to obtain an overview of GAM team–related issues across the entire
company, so the informant had to have a broader perspective and objective
observations of the determinants of team functioning and performance. Thus, the
interviewees were all senior managers either in charge of the entire GAM program or
who led a GAM team.
All interviews were face-to-face and semi-structured. The semi-structured approach
guarantees that a predetermined set of questions guides the interview but still leaves
enough flexibility to explore new and unanticipated issues. Interviewees received the
initial list of questions (see Appendix E), together with a description of the research
project, in advance to make them more comfortable about participating in the
interview and ensure their better preparation.
The first part of each interview centered on general GAM team issues, such as the
number of teams and team members, responsibilities and tasks performed by the
teams, positioning within the organization, and reporting lines. The second part
concentrated on key topical areas: context, design dimensions, team processes, and
performance criteria. The questions pertained to the most important factors in each
area and how they influenced other areas. Using both the laddering approach (Durgee,
1986) and the narrative approach (Mishler, 1986), which are common for qualitative
research of this type, follow-up questions served to explore these issues in greater
detail.
Eleven of the interviews were audio-recorded; however, in two cases, the respondents
did not feel comfortable with recording, so only hand-written notes are available. In all
cases, the interviews were transcribed immediately after the meeting to capture any
information that may be potentially useful for the analysis. The data collection process
overlapped with the data analysis, which means the data collection process could be
adjusted as necessary, a key advantage of qualitative research (Eisenhardt, 1989).
Therefore, after each interview, the data were analyzed and the findings compared
with existing research. Some preliminary conclusions emerged after each analysis,

66
which then provided an expanded basis for the subsequent interviews. For example,
when earlier interviews did not provide sufficient responses to some questions and the
analysis revealed the need for more information or a different direction, subsequent
interviews could address these gaps. This approach also resulted in some questions
being omitted or added during the interviews. Because the goal was to understand the
phenomenon with as much depth as possible, altering the question set is considered
completely legitimate (Eisenhardt, 1989).
The analysis of the collected qualitative data aimed to find integrative themes that
could capture the entire range of issues represented in the data. This process followed
the coding methodology described by Charmaz (2002). In the first step, initial or open
coding of each interview, detailed codes constructed for each interview transcript
indicated categories that simultaneously describe and dissect the data. The codes
capture the participants’ implied and explicit meanings and, at the same time, preserve
the flow of events or ideas expressed by the participant. In the second step, selective or
focused coding served to identify the codes that appear most frequently to sort and
synthesize the data into a comprehensive framework. These focused codes are more
general and yet more analytically incisive than the initial codes, because they cut
across multiple interviews and categorize recurrent themes more precisely (Charmaz,
2002). A reanalysis of relevant literature supported my decisions about which focused
codes to adopt and include in the conceptual framework. Thus, the emerging
conceptual framework was grounded in both theory and empirical findings. The next
section describes the framework and elaborates on each construct by discussing its
theoretical underpinnings and the related results from the qualitative analysis.
3.1.3. Summary findings from the qualitative study
This section explains how the interviews guided the research process and highlights
their contributions to the development of a relevant conceptual framework. The major
findings of the interview research are further described in the next section, including
specific examples from the experience of the study companies.

67
The significance of the qualitative study results from several large areas of
contributions. First, the interviews provided a solid confirmation of the relevance of
the research topic and the need for more research in the area due to its novelty and the
fast growing use of GAM teams in practice. On average, the interviewed companies
have had a structured GAM program for 11 years and all managers stated that it has
played a vital role for the growth and overall success of their companies. The tendency
has been for these GAM programs to start from a relatively small pilot program with a
few selected customers and to develop over time to involve more customers and
account management personnel. As a result, many of the responsibilities that were
initially carried out by individual account managers are nowadays entrusted to entire
GAM teams who in many cases manage more extensive relationships and satisfy the
requests of ever larger and more demanding customers. With this comes increased
complexity in the organization and need for special attention on GAM team issues.
One of the interviewees expresses well the importance of developing a clear
understanding of all GAM team issues:
You don’t build something like this [GAM team] easily because you
basically change the structure of how decisions are taken and this creates
different areas of tension. Therefore, you need to balance things out and
above all to know all key elements that drive the behavior in the team and
the organization.
Identifying those crucial performance-shaping elements was the key objective of the
interviews. Therefore, their second key contribution is that in the process of creating
grounded theory the interview findings helped to determine which concepts from the
pool identified in literature are most relevant in a GAM context. Thus, the qualitative
research helped to both eliminate constructs and relationships that turned to be of little
importance and to refine others whose content and definition needed adaptation to the
GAM context. As a result, some concepts that have been traditionally employed in
sales teams context – vertical involvement and horizontal involvement – were
disregarded although there was some theoretical support for including them in the
framework. The interviews indicated that the number of people from various
departments involved (horizontal involvement) is important but only to the extent that

68
it brings people from different functions and backgrounds that can share their
knowledge to create superior solutions for the customer. Therefore, the pure number
has significantly lower predictive power than variables such as the scope of skills and
diversity in expertise represented on the team. Similarly, the number of hierarchical
levels involved (vertical involvement) did not receive strong support in the interviews.
Instead, the interviewed managers singled out one particular level – top management –
whose involvement has proved critical for the GAM programs in all interviewed
companies.
In addition, the interviews provided strong support for several concepts from literature
– goal and role definition, structure, heterogeneity, adequate skills, leadership, rewards
and incentives, communication and conflict management – which led to the integration
of this constructs in the framework. Apart from confirming their relevance, the
qualitative study helped to crystallize their specific content in a GAM context. Thus,
out of the large number of heterogeneity aspects it helped to identify skills diversity as
the most relevant type of heterogeneity in this context, which resulted in a more
focused subsequent investigation of the concept. Furthermore, due to the nature of
GAM teams’ work, the interviews pointed to the need to study some of these
constructs in relation to the customer. Thus, the team structure variable gained a
different meaning from the one usually attached to it in team studies. The adapted
construct reflects the need for the team to both reflect the customer organization and fit
in the internal supplier organization. Similarly, the importance of aligning team roles
and objectives with those of the customer emerged from the interview research
findings.
The third key contribution of the interview research is that it helped to identify
concepts that are relatively new or underresearched in a team context. These include
empowerment, top management support, training and proactiveness. Although they
may appear in extant literature, they are not strongly emphasized as performance
determinants and would likely have been omitted from the framework were it not for
the findings from the interviews. The explanation is that these factors gain increasing
importance for GAM teams due to the higher complexity, the more dynamic
environment and the blurred boundaries in which teams operate. Furthermore, the

69
interviews played a crucial role in identifying a novel relationship among the
constructs that was included in the framework. Whereas previous research traditionally
does not view relational and financial performance as interlinked, all interviewed
managers considered relational performance as a step towards improving financial
performance and emphasized the causal relationship between the two. Thus, this first
qualitative research stage helped to significantly enhance the understanding of GAM
teams gained through the literature review and to develop a more precise and relevant
framework, which increased the precision of the subsequent empirical study.
3.2. Conceptual framework
The conceptual framework presented in Figure 5 is based on the four key domains
identified through the literature review and exploratory interviews: team design,
organizational context, team processes, and team performance indicators. Although the
main focus is on team structure and composition, as well as their direct and indirect
effects on team performance, various factors related to the organizational context of
the team also emerged in the analysis and therefore appear in the framework.
Figure 5: Conceptual framework
Team relational performance
GAM team design
• Goal and role definition• Structure• Empowerment• Size adequacy• Heterogeneity • Adequate skills• Leadership
Organizational context
• Top management support• Rewards and incentives• Training
Team processes
• External communication/ collaboration
• Communication/ collaboration within team
• Conflict management• Proactiveness Team financial
performance
H1
H2
H3
H4
H5

70
3.2.1. GAM team design
A GAM team must operate within multi-actor structures with different tasks and levels
of authority, and its success depends on its ability to secure continuous support and
manage the various technical, legal, economic, and political dimensions of the
relationship (Harvey et al., 2003b). In these circumstances, the design of the team
becomes a critical managerial issue because it determines the operating format and
effectiveness of the GAM effort (Harvey et al., 2003a). The key variables that
characterize GAM team design can be mapped along two main dimensions: team
organization and team composition (Gladstein, 1984; Smith and Barclay, 1993). In this
context, the organization refers to the relatively stable arrangements pertaining to the
division of work and the coordination and control mechanisms. Because it is a rather
broad concept, several organizational subdimensions also emerge from the analysis,
including goal and role definition, structure, size adequacy, and empowerment.
Composition, in contrast, here reflects the distribution of team member characteristics,
captured in the framework by the heterogeneity of represented skills, the adequacy of
skills and competencies that team members possess, and the leadership qualities of the
team manager.
Team organization
Goal and role definition
A key problem in forming groups is that team members might have mixed motives in
terms of cooperating and sharing information, which creates a dilemma in which group
and individual goals conflict (Bettenhausen, 1991). In a review of cross-functional
team studies, Holland et al. (2000) find that some of the most common obstacles to
team effectiveness include conflicting organizational or personal goals, overlapping
responsibilities, and a lack of clear direction or priorities. Similar results appear in a
GAM context, in which team members often have multiple, organizationally defined
roles and identities (Arnold et al., 2001). That is, they are members not only of
functional areas (e.g., sales, marketing, R&D, production), business units, and country
organizations but also of various other project groups. The result of these multiple

71
memberships is their mixed objectives regarding their clients, which increases the
likelihood of conflict with authority and responsibility. This problem is further
exacerbated when GAM is not a full-time responsibility for all team members. In the
majority of the interviewed companies, only 2–5 core team members were full time;
the rest were responsible for sales to smaller customers or for other specialized
activities in addition to their involvement in the GAM team. Consequently, many of
the interviewees highlighted that without clear delineations of the role and mission of
the GAM team, conflicts would likely arise and the support of operating managers for
the GAM team would be minimal. The first step most of the researched companies
undertook was to communicate clearly to all related parties who had been assigned to
the team and what their responsibilities were. In Clariant, Wacker, and SAP, for
example, this communication took the form of posting the organizational chart and the
description of members’ responsibilities on the companies’ intranets.
The interview research indicates that role and goal setting should be aligned along
several dimensions. First, the team goals and responsibilities should be aligned with
the customer’s if the company is to provide the required value. Following this
principle, many of the interview companies organize joint planning and strategy
development sessions between the GAM team and its customer. Second, the goals of
the GAM team must be closely aligned with the overall strategic goals of the
company. As Cespedes et al. (1989: 48) mention, “a strategy that does not imply
certain behavior by the sales force is often no strategy; it is merely an interesting idea.”
Linking team objectives to corporate strategy gives GAM team members information
about the company’s goals in the marketplace, the nature of its potential competitive
advantage, and their expected role in achieving those goals. Third, group goals often
coexist with individual performance goals, and when they conflict, dysfunctions within
the team are inevitable. As a result, team goals should be compatible with the
objectives of individual members.
The literature offers extensive support for the link between such goal and role
alignment and performance. For example, specifying relationships between various
organizational roles and clarifying their responsibilities and dependencies enhances
interfunctional collaboration when marketing and R&D collaborate to develop new

72
products (Moenaert and Souder, 1990). In a similar setting, Ruekert and Walker
(1987) argue that formalization through prescribed policies and norms increases
effectiveness, whereas Brown and Eisenhardt (1995) draw attention to more flexible
and fluid job descriptions and novel routines. In both cases, however, the goal is to
clarify team members’ roles and responsibilities to reduce confusion and wasted time.
Empirical studies of small groups also show that setting compatible individual and
group goals leads to significantly greater performance improvements than do situations
with no goals, individual goals only, or group goals only (Gowen, 1986; Matsui et al.,
1987). Weldon and Weingart (1993) argue that this effect occurs indirectly through the
mediating function of processes such as cooperation, communication, and member
effort. Tjosvold (1988) supports this argument by observing that employees from
different groups within a company who believe that their goals are cooperative, rather
than competitive or independent, exchange more information and resources and are
more willing to collaborate.
In summary, teams with well-defined and aligned goals and responsibilities are more
likely to communicate efficiently, collaborate, and experience lower levels of conflict.
Furthermore, they are more likely to act proactively in search of opportunities to fulfill
their objectives.
Team structure
As Shi et al. (2005) propose, one of the key GAM capabilities that influences market
performance and profitability is a process to ensure integrated efforts, both across
hierarchical levels in the supplier and customer organizations (i.e., from top executives
to sales representatives) and across all the markets in which the customer conducts
business. This integration requires that the GAM team be structured to facilitate
coordination. Team structure describes the nature and strength of the relationships
among individual members of the team and often is described by three dimensions:
vertical differentiation, horizontal differentiation, and connectedness (O’Reilly and

73
Roberts, 1977; Pearce and David, 1983). As discussed in Chapter 2.4, though these
dimensions have been considered in a GAM or team selling context, no strong
empirical evidence exists regarding their impact on performance. Conceivably, group
structural properties alone may be less significant predictors of team performance than
the degree of fit between the team’s structure and environment (Bettenhausen, 1991),
as is supported empirically (e.g., Gresov et al., 1989). This contingency perspective
has its roots in the principle of requisite variety, which contends that organizational
adaptability increases when the organizational structure reflects the complexity of the
environment (Ashby, 1952), as well as the more general concept of fit, which has been
applied widely to various elements of organizational strategy, structure, and
environment (Egelhoff, 1982; Lawrence and Lorsch, 1967; Meyer et al., 1993; Van de
Ven and Drazin, 1985) and previously employed in GAM literature (Shi et al., 2004;
Toulan et al., 2002).
The GAM team has the boundary-spanning role of absorbing and interpreting the
complexity of the environment (Galbraith, 1973). Its task thus is to interact with
diverse parts of the customer organization, bring together the multiple demands of
those parts, develop appropriate strategies and solutions, and organize additional
elements of the supplier firm to deliver on those demands (Birkinshaw and Terjesen,
2002). This complex responsibility requires, on the one hand, a structure that fits with
the customer structure and, on the other, a structure that is well integrated and fits with
the existing supplier organization. Structural fit between the supplier and the customer
can improve supplier performance (Toulan et al., 2002), as well as joint supplier–
customer outcomes in terms of dyadic competitive advantage and joint profit
performance (Shi et al., 2004). In addition, establishing a team structure that is aligned
with the two organizations leads to performance improvements, because it allows the
supplier to increase its information-processing capability and bargaining power vis-à-
vis its global account (Birkinshaw et al., 2001).
Interviewees reached a consensus about the importance of structural fit and
accentuated the importance of adapting the GAM team structure to the customer’s
requirements. When Clariant created its first teams, it approached the customer to
discuss how it could adjust its structure to provide optimal customer coverage. In most

74
researched companies, the core members of the GAM team are based close to the
customer headquarters, with extended team members spread around the world to cover
the various locations where the customer operated. In addition, product and functional
specialists often come from different parts of the supplier company to provide
additional needed coverage. For example, when a DHL account team develops a
proposal, whether proactively or in response to a customer request, it pools members
from various units: logistics consultants, IT consultants, transportation and operations
specialists, customer specialists, pricing experts, and even financial specialists for
billing and tax advice. Many of these people are virtual members based in different
locations worldwide and may be part of the GAM organization or pulled from
different business units. An interviewee from Citigroup describes the rationale for
adopting such a flexible and yet complex structure best:
What we are trying to do by combining these three dimensions—
geography, product, and functional expertise—is to deliver the industry
knowledge, the local presence, and the in-depth understanding of the client
in a superior way than our competitors.
To conclude, a team structure based on a fit with the internal supplier organization and
with the customer should facilitate both internal and external communication and
collaboration, reduce conflicts, and, ultimately, improve team performance.
Empowerment
During the interviews, GAM experts highlighted GAM team empowerment as one of
the most common success factors. Providing the team with sufficient authority tells the
customer that account managers have the power and resources to “get things done” in
a timely and effective manner (Homburg et al., 2002; McDonald et al., 1997). In a
more general aspect, team empowerment represents a powerful mechanism for
enabling organizations to be more flexible and responsive to environmental changes
and customer needs (Kirkman and Rosen, 1999; Kirkman et al., 2004).

75
The organizational behavior literature contains two conceptualizations of
empowerment: structural and psychological. Structural empowerment refers to the set
of practices and work arrangements in a company that delegate authority and
responsibilities (Kirkman and Shapiro, 2001; Mills and Ungson, 2003). The
psychological approach considers empowerment the psychological state that team
members possess in terms of their perceived authority to control how their work is
conducted and responsibility for their work outcomes. This responsibility may include
the freedom to choose how to perform tasks, a sense that the team’s work is important,
and the belief that the team influences the effectiveness of the larger systems within
which it operates (Kirkman and Rosen, 1999; Spreitzer, 1995, 1996). These two
approaches are not antithetical but rather complementary and thereby provide a
comprehensive perspective of empowerment (Menon, 2001).
The interview results point to two distinct aspects of empowerment in a GAM context:
decision-making authority and sufficient resources. As Perry et al. (1999) note, a fully
empowered selling team possesses the authority to make decisions for which,
collectively, the team is responsible. Providing teams with this opportunity is
particularly appropriate when they need to take advantage of the unique skills and
talents of individual employees across the organization, because authority facilitates
the team’s access to these persons and ensures that the team’s demands and needs are
met. Consequently, Perry et al. (1999) argue that empowered selling teams result in
greater collaboration, coordination, and cooperation, as well as novel and innovative
solutions to customer problems. This claim is supported by empirical research that
indicates empowerment influences team processes and is a significant moderator of the
relationship between organizational context and team performance (Mathieu et al.,
2006). Of equal importance, previous research has identified a positive relationship
between empowerment and proactiveness (Kirkman and Rosen, 1999), as well as with
important customer-related outcomes such as customer service (Kirkman and Rosen,
1999), customer satisfaction, and process improvement (Kirkman et al., 2004).
The experiences of IBM and Citigroup confirm these claimed benefits. The GAM
teams at these companies receive full profit and loss (P&L) responsibility for their
customers. Although the country general managers at IBM are responsible for sales,

76
they do not oversee revenues and are not allowed to make any significant decisions
about the customer without consultation with the GAM team. Providing the teams with
this level of responsibility offers multiple advantages: It ensures the team can respond
proactively and quickly to customer needs and guarantees the decisions it makes will
not be blocked at the country level by managers with different interests and their own
agendas. These factors facilitate communication and reduce the risk of conflicts.
In addition, resources are key to empowerment (Mohrman et al., 1995) and important
predictors of team performance (Cohen et al., 1996; Denison et al., 1996; Gladstein,
1984). Because global customers are crucial to the success of the company, the GAM
team must have sufficient resources to innovate and make a distinctive value
proposition based on customer needs and preferences. In turn, this creates value for the
customer and therefore leads to sustainable competitive advantage for the supplier
(Gosselin and Heene, 2005).
Team size adequacy
The size of the team also can be an important predictor of how well it carries out its
activities. In general, teams should be large enough to accomplish their goals but not
too large, because too many members can lead to overwhelming coordination needs or
reduced involvement (Gladstein, 1984; O’Reilly and Roberts, 1977). Therefore, some
authors argue that teams should take the smallest size needed to do the work
(Goodman et al., 1986; Sundstrom et al., 1990). Whereas early research suggests an
inverted U-shape or curvilinear relationship between size and performance (Steiner,
1972), subsequent empirical studies identify various performance improvements
associated with size. For example, Campion et al. (1993) find a positive impact of
group size on productivity, manager judgments of effectiveness, and employee
satisfaction. In employee involvement teams, Magjuka and Baldwin (1991) also find a
significant positive relationship with performance. In contrast, Vinokur-Kaplan’s
(1995) study, which applies Hackman’s (1987) model in practice, suggests that size is
a negative predictor of performance. These varied research findings clearly indicate
that size has a differential impact depending on the setting and team design. In a GAM
77
team context, smaller team size should facilitate internal communication and
coordination and result in relatively lower conflict levels. However, smaller teams
might have difficulty obtaining sufficient resources and communicating the
significance of their work, as a result of their lower visibility, which may suggest that
size increases external communication.
The interview results confirm Cohen et al.’s (1996) suggestions that the absolute
number of people on the team is a poor indicator of its potential, because the “ideal”
size depends largely on the context. The teams in the interviewed companies ranged
from 4–5 to 50–60 members on a global basis, but in most cases, the interviewees
stated they still experienced capacity problems and would happily increase the number
of people on their GAM teams. In line with these arguments, the concept of team size
adequacy, or whether the size of the team is sufficient to perform its tasks, emerges.
When confronted with an insufficient number of people, the team experiences
increased workloads, time constraints, and reduced job satisfaction, the results of
which include decreased communication and collaboration, more tensions and
disputes, and a lower degree of proactivity. In other words, insufficient team size
likely has a negative impact on all team processes and performance.
Team composition
Team composition pertains to what members bring to the group in terms of skill,
ability, and disposition (Hollenbeck et al., 1998). In a recent meta-analytic review of
the effects of team design on performance, Stewart (2006) argues that the skill and
capability composition of a team can be viewed from two perspectives: (1) individual
characteristics that aggregate in a linear fashion, such that more is always better, or (2)
individual characteristics that do not aggregate in this manner and whose desirability
therefore depends on the traits of other team members, such that the heterogeneous
characteristics require fit among members. Following this classification, the proposed
framework incorporates both skill heterogeneity and adequate skills, as well as a third
distinct type of skill—team leadership.

78
Heterogeneity
The extent to which team members are similar or bring unique qualities to the team
can influence group processes and outcomes, so significant research has studied team
diversity according to various attributes, such as race or ethnic background, age,
gender, nationality, skills and knowledge, values, and tenure (Milliken and Martins,
1996). In a GAM context, the most relevant diversity variables should be diversity in
skills and nationality, because they represent proxies for the team’s ability to develop
creative solutions to complex problems and manage the cultural diversity inherent in
its environment. In addition, many of the interviewees discussed these two types of
diversity extensively. Overall, the results of the qualitative analysis indicate that
nationality diversity should be taken into account but usually is a given because of the
multinational nature of the teams. Therefore, it is not a strong predictor of performance
by itself. Executives typically noted that it is more important to ensure the right mix of
skills on the team and recruit members who are able to work in a diverse, multicultural
environment than focus on a specific mix of nationalities. Consequently, I drop the
nationality diversity variable from further analysis and focus on skills heterogeneity.
Heterogeneity in terms of skills and expertise usually refers to task-related abilities or
professional experience, with the basic premise that when people with relevant areas
of expertise come together, team decisions and actions likely include the entire range
of perspectives and skills, which then leads to success (Van der Vegt and Bunderson,
2005). However, reviews by Milliken and Martins (1996), Webber and Donahue
(2001), and Williams and O’Reilly (1998) suggest that empirical evidence about the
performance benefits of diversity in skills is equivocal and indicates both positive and
negative relationships. Some studies (e.g., Watson et al., 1993) find that skill diversity
can both enhance and diminish performance on cognitive tasks, whereas others (e.g.,
Bantel and Jackson, 1989) indicate a positive link between diversity and cognitive task
performance, that is, tasks that involve generating creative ideas, solving problems, or
making decisions. The proposed explanations for the positive relationship between
skill diversity and team performance range from a better use of member knowledge to
better communication and cooperation with external groups (Goodman et al., 1986;
Magjuka and Baldwin, 1991). More recent research has tried to explain the skill
79
diversity–performance link by opening the “black box” of team processes (Lawrence,
1997) and identifying relevant moderating and mediating factors. Process variables
such as intrateam conflict (Jehn et al., 1999; Pelled et al., 1999; Simons et al., 1999),
external communication (Ancona and Caldwell, 1992; Keller, 2001), information
sharing (Bantel and Jackson, 1989; Bunderson and Sutcliffe, 2002), and the ability to
acquire, refine, and combine knowledge (i.e., learning orientation, Van der Vegt and
Bunderson, 2005) represent the key mechanisms by which diversity promotes or
hinders performance.
An important finding that can provide insights into the effects of diversity in GAM
teams is that skill diversity has more positive performance effects on nonroutine,
diverse tasks that require a wide range of competencies (Hambrick et al., 1996;
Murray, 1989, Wall et al., 1986), which is a good description of GAM team
responsibilities. Following the resource-based view (Barney, 1991; Teece et al., 1997),
Harvey et al. (2003a) argue that individual and collective organizational knowledge as
a resource enables the GAM team to develop unique competencies valuable to global
customers. Similarly, the interviewee from Hewlett-Packard compared its GAM teams
to a lens that brings into focus the supplier’s resources, including everything from
R&D and product development to distribution and customer service, for the global
customer. Therefore, incorporating a variety of backgrounds, areas of expertise, and
experience in the team is a prerequisite if the team is to develop superior knowledge
bases to coordinate and combine its system-wide resources and capabilities in unique
ways that provide value to the customer.
Adequate skills
As opposed to skill heterogeneity, this construct focuses on individual characteristics
that combine in such a way that more is always better for a team. Several
organizational behavior studies assess member skills and ability levels (LePine et al.,
1997), personality traits (Barrick et al., 1998; Neumann and Wright, 1999), and
background and experience (Bantel and Jackson, 1989), but their results tend to
depend on the context and type of team.
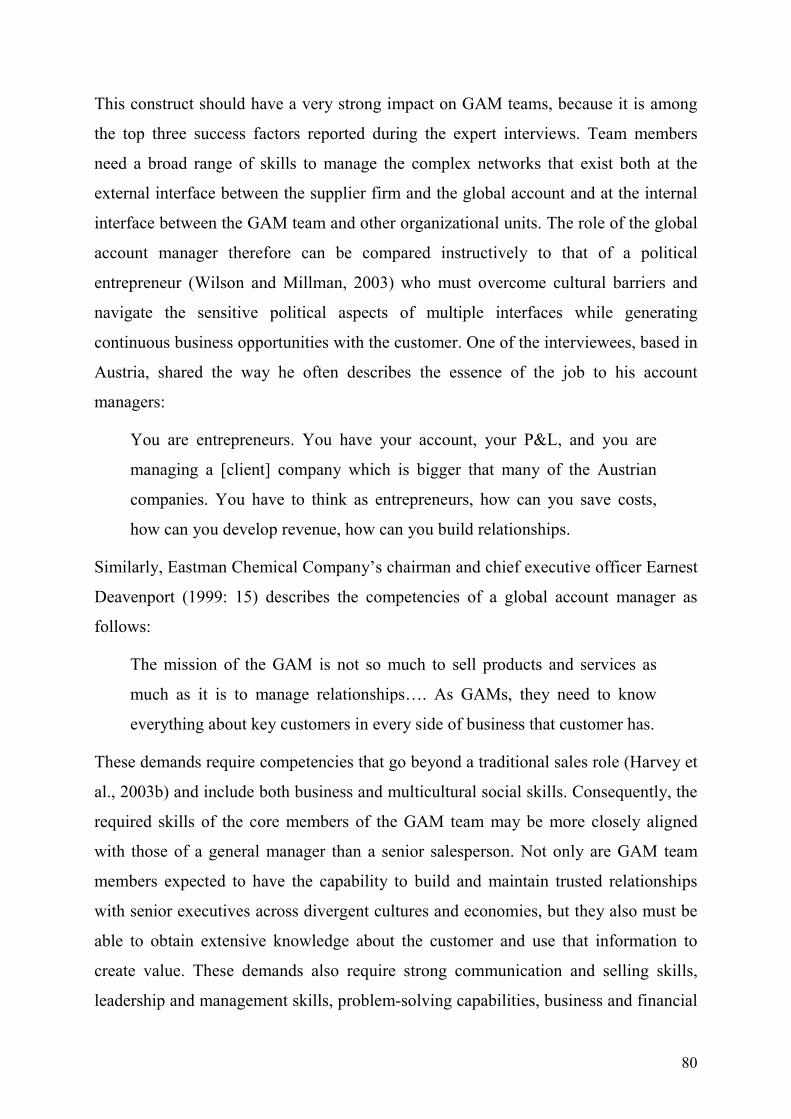
80
This construct should have a very strong impact on GAM teams, because it is among
the top three success factors reported during the expert interviews. Team members
need a broad range of skills to manage the complex networks that exist both at the
external interface between the supplier firm and the global account and at the internal
interface between the GAM team and other organizational units. The role of the global
account manager therefore can be compared instructively to that of a political
entrepreneur (Wilson and Millman, 2003) who must overcome cultural barriers and
navigate the sensitive political aspects of multiple interfaces while generating
continuous business opportunities with the customer. One of the interviewees, based in
Austria, shared the way he often describes the essence of the job to his account
managers:
You are entrepreneurs. You have your account, your P&L, and you are
managing a [client] company which is bigger that many of the Austrian
companies. You have to think as entrepreneurs, how can you save costs,
how can you develop revenue, how can you build relationships.
Similarly, Eastman Chemical Company’s chairman and chief executive officer Earnest
Deavenport (1999: 15) describes the competencies of a global account manager as
follows:
The mission of the GAM is not so much to sell products and services as
much as it is to manage relationships…. As GAMs, they need to know
everything about key customers in every side of business that customer has.
These demands require competencies that go beyond a traditional sales role (Harvey et
al., 2003b) and include both business and multicultural social skills. Consequently, the
required skills of the core members of the GAM team may be more closely aligned
with those of a general manager than a senior salesperson. Not only are GAM team
members expected to have the capability to build and maintain trusted relationships
with senior executives across divergent cultures and economies, but they also must be
able to obtain extensive knowledge about the customer and use that information to
create value. These demands also require strong communication and selling skills,
leadership and management skills, problem-solving capabilities, business and financial
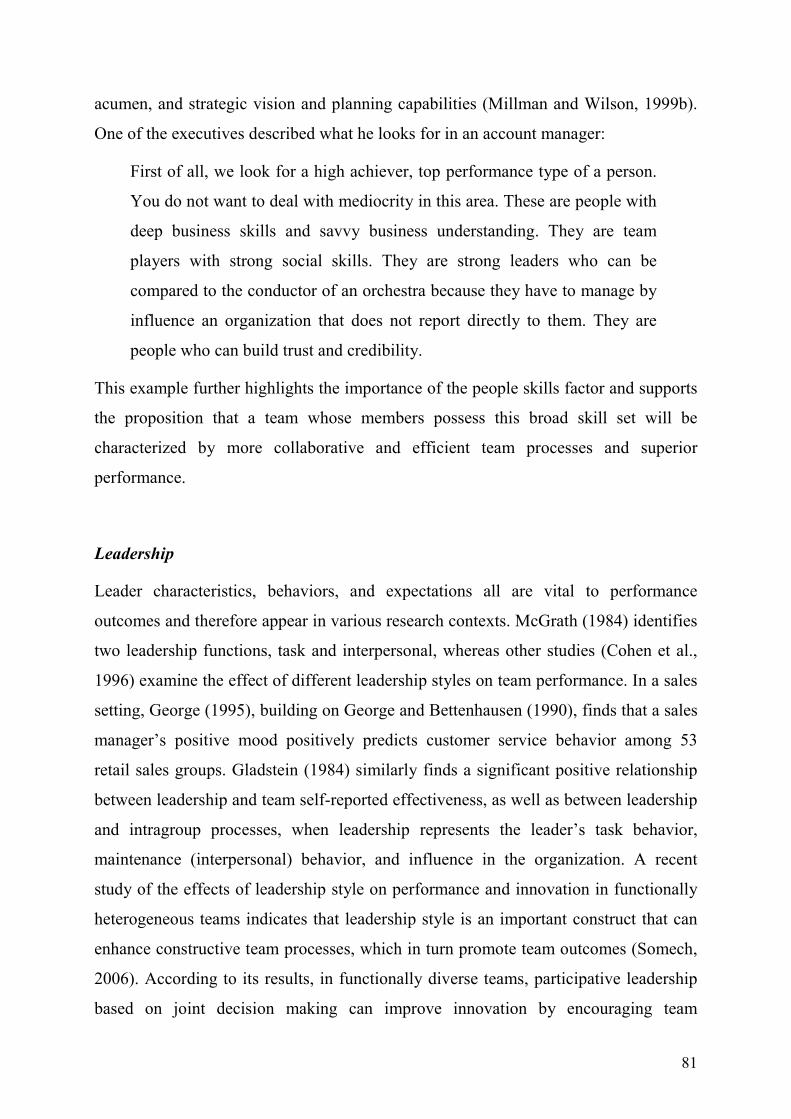
81
acumen, and strategic vision and planning capabilities (Millman and Wilson, 1999b).
One of the executives described what he looks for in an account manager:
First of all, we look for a high achiever, top performance type of a person.
You do not want to deal with mediocrity in this area. These are people with
deep business skills and savvy business understanding. They are team
players with strong social skills. They are strong leaders who can be
compared to the conductor of an orchestra because they have to manage by
influence an organization that does not report directly to them. They are
people who can build trust and credibility.
This example further highlights the importance of the people skills factor and supports
the proposition that a team whose members possess this broad skill set will be
characterized by more collaborative and efficient team processes and superior
performance.
Leadership
Leader characteristics, behaviors, and expectations all are vital to performance
outcomes and therefore appear in various research contexts. McGrath (1984) identifies
two leadership functions, task and interpersonal, whereas other studies (Cohen et al.,
1996) examine the effect of different leadership styles on team performance. In a sales
setting, George (1995), building on George and Bettenhausen (1990), finds that a sales
manager’s positive mood positively predicts customer service behavior among 53
retail sales groups. Gladstein (1984) similarly finds a significant positive relationship
between leadership and team self-reported effectiveness, as well as between leadership
and intragroup processes, when leadership represents the leader’s task behavior,
maintenance (interpersonal) behavior, and influence in the organization. A recent
study of the effects of leadership style on performance and innovation in functionally
heterogeneous teams indicates that leadership style is an important construct that can
enhance constructive team processes, which in turn promote team outcomes (Somech,
2006). According to its results, in functionally diverse teams, participative leadership
based on joint decision making can improve innovation by encouraging team

82
reflection, which prioritizes a collective debate and analysis of the team’s objectives,
strategies, and the best way to use relevant knowledge. Such leaders reduce the
barriers that exist between diverse professionals in heterogeneous teams by opening
communication channels inside and outside the team and facilitating the exchange of
ideas and perspectives (Lewis et al., 2002). However, many of these existing studies
center primarily on the leader’s behavior within the team and its impact on internal
team processes.
In contrast, studying product development teams, Katz and Allen (1985) note that
leadership both within the team and in terms of broader organizational influence
affects team members’ motivation and behaviors. Consequently, selling team
managers’ behaviors should attempt to not only develop internal bonds but also
succeed in external activities. Smith and Barclay (1993) observe that effective selling
teams are led by experienced sales representatives with strong social and boundary
management skills who inspire team members by example to maintain their
commitment and professionalism. Similarly, Perry et al. (1999) argue that the selling
team manager should focus his or her efforts externally to facilitate good working
relationships between the team and the rest of the organization and garner resources
from outside.
Organizational influence should be a strong characteristic of successful GAM leaders
as well. Teams with influential leaders are more effective because they communicate
better with senior managers and act as advocates for their teams within the
organization, which in turn improves overall communication and collaboration and
reduces potential conflicts. In addition, influential leaders often cause members and
outsiders to infer that the team’s activities are important and prestigious, which
improves both their efforts and team cohesiveness (Scott, 1997). This is of utmost
importance because leaders of GAM teams often have no formal authority, rely
heavily on other members, and are contributing members to team activities (Deeter-
Schmelz and Ramsey, 1995). As a result, they “lead” as opposed to “manage” the
GAM team (Parker, 1994). In these circumstances, strong leaders are those who create
an environment that fosters performance, ensure that team efforts are coordinated with
divisional and organizational efforts, and align team members’ objectives.

83
In summary, a GAM team leader can have a strong positive effect on team processes
and performance if he or she (1) possesses broader influence in the organization that
extends to top management and across various functional and divisional boundaries
and (2) creates an effective working environment and motivates team members to
contribute.
Hypothesis 1: GAM team design (i.e., goal and role definition, structure,
empowerment, adequate size, heterogeneity, adequate skills, leadership) has a
positive influence on GAM team processes (i.e., external and internal
communication and collaboration, conflict management, proactiveness).
3.2.2. Organizational context
Teams can be understood best in relation to their external surroundings and internal
processes (Sundstrom et al., 1990). Therefore, many models of team effectiveness
incorporate aspects such as reward systems and training resources that represent the
organizational context of teams (e.g., Campion et al., 1993; Cohen et al., 1996;
Hackman, 1987; Shea and Guzzo, 1987). Cespedes et al. (1989: 55) clearly illustrate
the importance of these factors for GAM: “Sales teamwork is ultimately a by-product
of the organization and has to come from the top down. People in the trenches can be
team players, but they need encouragement and incentives.”
In a similar vein, one of the interviewees highlighted the importance of the
organizational context for changing corporate cultures and mindsets that do not
support global team collaborations:
There are many things that you can do to change behavior, through how
you pay people, how you train people, the systems and processes by which
you want them to interact. These are levers at the disposal of the managers
of the business. If we work on changing those things, before we know
where we are, those behaviors will be how we do things around here.

84
Because today’s behaviors are the short term of what culture is all about,
they will eventually turn into a culture.
Recognizing this behavior-shaping role of the organizational environment, the
proposed framework captures context through three constructs: top management
support, rewards and incentives, and training.
Top management support
This quote from one of the interviews effectively represents the opinions of all
interviewed managers:
There is only one golden rule about GAM programs: If you do not have the
undying support of the chief executive, they will go nowhere, it is just a
waste of money.
Top management support was among the top three GAM team success factors
accentuated in the interviews and is often identified as crucial for all aspects of GAM
activities in the literature (Arnold et al., 2001; Homburg et al., 2002). According to
Millman and Wilson (1999a: 330), GAM “is a strategic issue and the process should
therefore be initiated and overseen by senior management.” Because GAM is typically
an organization-wide initiative, it requires shifts of power, responsibilities, and
resources from the local to the global level or from individual countries to GAM units
that span boundaries (Homburg et al., 2000). As a result, managers at various levels
confront trade-off decisions between local business units and global accounts. By
making an unequivocal commitment to the long-term benefits of GAM, top
management emphasizes global firm success as opposed to national or market-based
measures, which helps managers make this trade-off and creates a global
organizational mindset oriented toward the complexities of global strategy, structures,
and processes. As Srivastava et al. (1999) argue, for marketing to be institutionalized
in organizations, it must be infused in the actions of the managers who influence the
work process.

85
Support in the form of resource allocation and public recognition of the GAM team’s
efforts conveys the importance attributed by top management to the GAM initiative
and is pivotal for overcoming potential resistance or power struggles and legitimizing
the efforts of the team as a strategic undertaker (Harvey et al., 2003b). Without it, the
team lacks sufficient clout to direct customer activities proactively, and team members
likely ascribe lower importance and significance to their contributions. For example,
when 3M began implementing action teams, senior management sponsors were crucial
to their success. These “enablers” allocated the needed resources and visibly supported
the team, which altered the mindset of middle managers and motivated team members
(Hershock et al., 1994). Empirical studies support this observation in their
identification of the positive relationship between top management commitment and
market orientation (Jaworski and Kohli, 1993), global marketing structure, marketing
performance (Townsend et al., 2004), and, crucially, GAM effectiveness (Workman et
al., 2003).
The other key aspect of top management support is the active involvement of senior
managers in developing relationships with the customer. Senn (2006) observes that a
replicable, systematic process of senior executive interactions with the customer can
represent an essential sales and profitability growth factor. Many of the researched
companies implement executive sponsorship or top-to-top relationship programs that
require top managers to meet with the top management of the customer firm to discuss
business opportunities and set strategies. For example, DHL’s CEO commonly meets
with customer executives such as Michael Dell and discusses the possibilities for joint
business, whereby the two companies can integrate their competencies and develop
tailor-made solutions. This type of support is invaluable to the GAM team working
with Dell, or whichever respective account, and can lead to joint innovations with
superior sales potential. Similarly, Siemens uses a formal, four-step Top Executive
Relationship Process that mandates at least eight executive customer engagements per
year for each team, so the customer contacts are systematically planned, organized,
and reported. This mandate helped shift customers’ perceptions of Siemens to a more
customer-driven and engaged partner. Moreover, four years after the introduction of

86
the process, the growth rate of these accounts increased significantly and reached
levels two times higher than other accounts (Senn, 2006).
In summary, top management support has a positive effect on team process and
performance because it enhances internal and external collaboration by embedding a
GAM focus, reduces conflicts, and enforces a proactive approach toward global
customers.
Rewards and incentives
A reward system that recognizes and reinforces contributions to the GAM team can
significantly amplify the motivational incentives provided by top management
commitment or well-designed goals and responsibilities. In most interviews,
respondents pointed to measurement, metrics, and compensation as key success
factors. In the organizational behavior research stream, rewards for team performance
do not produce conclusive empirical results, because some studies find no significant
influence on objective performance (Campion et al., 1993; Magjuka and Baldwin,
1991), whereas others (Cohen et al., 1996; Pritchard et al., 1988) indicate that
introducing group incentive plans increases team ratings of performance and
satisfaction or that perceived inequity in compensation among team members is
positively associated with perceived conflict (Wall and Nolan, 1986).
Nevertheless, compensation is one of the three most important areas in team selling,
according to Cespedes et al. (1989: 45), who note that “in sales management, you
won’t get what you don’t pay for.” Gosselin and Heene (2005) also argue that
remuneration and measurement determine whether account managers act as strategic
global account managers with long-term, relational perspectives or as pure
salespersons with a short-term, transaction orientation. Because GAM teams often
work alongside preexisting national sales organizations, and both units have vital roles
in managing the account, it is important that the incentive structure helps reconcile any
potential tensions between the units and enhances collaboration (Arnold et al., 2001).

87
Creating such a compensation structure requires two aspects. First, the supplier must
have a measurement system that tracks the sales of the global account and the implied
results of the GAM team efforts worldwide. It should be flexible and fair enough to
recognize sales contributions in a transparent and consistent manner and share sales
credit. Otherwise, the team might get caught in a situation in which it wastes
significant time and energy arguing about the split of sales credit. Companies whose
interviewed managers stated they had found a workable solution usually double-
credited sales and used shadow P&L accounting. For example, DHL and Citigroup use
a shadow P&L system that helps smooth the tension between the GAM team and local
managers regarding sales to the global account. Furthermore, this system establishes
the unique contributions of different units associated with the revenues.
Second, to stimulate contributions, the compensation system must reward team
members appropriately. Regardless of their content, rewards should be contingent on
performance, and the system should reward only those behaviors that lead to the
required positive outcomes (Hackman, 1987). For example, interviewees indicated that
the compensation system for the GAM team should employ an appropriate timeframe.
Sales to large multinational customers often take months or even years to complete, so
incentives tied to short-term performance will encourage efforts that fail to maximize
overall results. Interviewed executives also mentioned various options, such as
bonuses for multiple-year performance or qualitative objectives like building customer
relationships. Furthermore, to encourage a more holistic and relationship-oriented
view among team members, the researched companies all provide incentives that are
based on both GAM team or program-level goals and personal objectives, and they
include both quantitative and qualitative targets.
In general, the experts indicated that appropriate GAM incentives involve a
compensation package with a significant variable portion (bonus) contingent on certain
prespecified, GAM-related objectives. Although the size of this portion varies
considerably across industries and companies (from 20–30% of total compensation in
companies such as Coca-Cola, HBC, and Wacker to 4–5 times the fixed salary in
banking GAM teams at Citigroup), it remains a strong determinant of willingness to
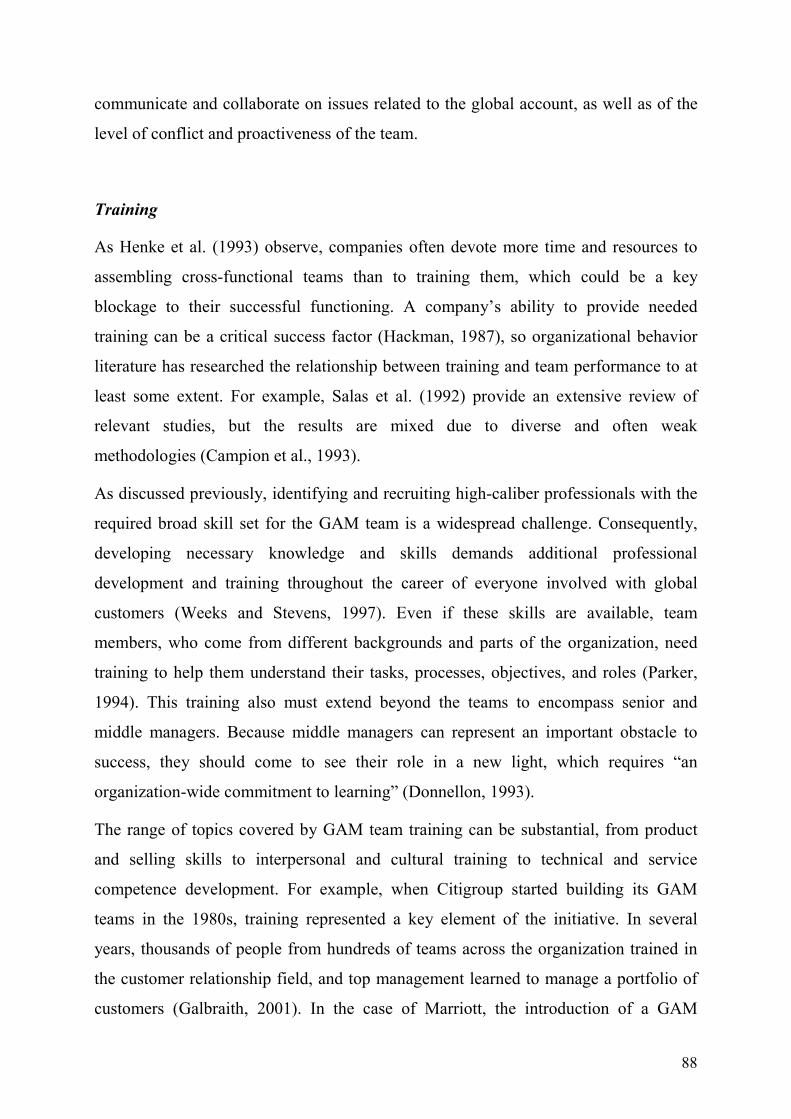
88
communicate and collaborate on issues related to the global account, as well as of the
level of conflict and proactiveness of the team.
Training
As Henke et al. (1993) observe, companies often devote more time and resources to
assembling cross-functional teams than to training them, which could be a key
blockage to their successful functioning. A company’s ability to provide needed
training can be a critical success factor (Hackman, 1987), so organizational behavior
literature has researched the relationship between training and team performance to at
least some extent. For example, Salas et al. (1992) provide an extensive review of
relevant studies, but the results are mixed due to diverse and often weak
methodologies (Campion et al., 1993).
As discussed previously, identifying and recruiting high-caliber professionals with the
required broad skill set for the GAM team is a widespread challenge. Consequently,
developing necessary knowledge and skills demands additional professional
development and training throughout the career of everyone involved with global
customers (Weeks and Stevens, 1997). Even if these skills are available, team
members, who come from different backgrounds and parts of the organization, need
training to help them understand their tasks, processes, objectives, and roles (Parker,
1994). This training also must extend beyond the teams to encompass senior and
middle managers. Because middle managers can represent an important obstacle to
success, they should come to see their role in a new light, which requires “an
organization-wide commitment to learning” (Donnellon, 1993).
The range of topics covered by GAM team training can be substantial, from product
and selling skills to interpersonal and cultural training to technical and service
competence development. For example, when Citigroup started building its GAM
teams in the 1980s, training represented a key element of the initiative. In several
years, thousands of people from hundreds of teams across the organization trained in
the customer relationship field, and top management learned to manage a portfolio of
customers (Galbraith, 2001). In the case of Marriott, the introduction of a GAM

89
approach involved sales training classes for more than 500 people every year to
demonstrate how strategic account management would change their jobs and
expectations regarding their contributions (Hennessey and Jeannet, 2003). Siemens
requires all GAM team members to undergo intercultural training, because it believes
that acceptance of different cultures is one of the keys to global success. As David
Macaulay, Siemens’ Managing Director for Corporate Accounts, notes, “If you don’t
understand culture or are not sensitive to another person’s culture, doing business can
be twice as hard.”
Finally, DHL uses training not only to enhance the GAM team’s skills but also to
increase its credibility and improve its relationship with the business units. The
company is designing a structured training program that will resemble a university, in
the sense that it will incorporate detailed assessments of competencies and gaps and a
formal process of education, to the point that account managers might be asked to take
tests. When GAM team members have successfully undergone this rigorous training
process and passed the tests, customers and business units likely will perceive them as
more competent and respectable and therefore be more willing to collaborate with
them.
Hypothesis 2: The organizational context (i.e., top management support, rewards
and incentives, training) has a positive influence on GAM team processes (i.e.,
external and internal communication and collaboration, conflict management,
proactiveness).
3.2.3. Team processes
Although the team’s structure and composition may have a direct impact on team
outcomes, in most cases, this relationship is mediated by the processes that
characterize the interactions of team members (Hackman, 1987). Prior studies based
on the organizational demography approach (Pfeffer, 1983), which focuses on the
direct link between team design variables and outcomes, create a “black box” because

90
they fail to measure and test the effect of team processes and other intervening
variables (Lawrence, 1997). These variables might include both internal and external
processes (Ancona and Caldwell, 1992a; Gladstein, 1984; Marks et al., 2001), as well
as group psychosocial traits, such as group norms and shared mental models (Cohen
and Bailey, 1997). The field interviews similarly suggest certain variables moderate
the relationship—specifically, external communication and collaboration, internal
communication and collaboration, conflict management, and proactiveness.
External communication and collaboration
Effective GAM teams must detect changes in the business environment, gain
knowledge about customers, and improve team members’ collective understanding of
the business situation. Because GAM team members have varying functions and are
exposed to multiple sources of information, the team needs to communicate
extensively and effectively both internally and externally and to ensure that it uses all
valuable information to its fullest potential (Jones et al., 2005).
As already discussed in Section 2.3, external activity refers to the process of building
relationships with other members inside and outside the organization to ensure
cooperation and obtain vital information and resources. In previous studies of smaller
and relatively isolated groups, external activities have been either completely omitted
or considered less important than intragroup processes (Gladstein, 1984). However,
studies that extend the focus to new and demanding environments with a high degree
of external dependence recognize that teams whose members communicate actively
with and engage outsiders in the team’s work achieve higher performance (Ancona
and Caldwell, 1992a, b; Keller, 1994, 2001). In the context of key account managers,
for example, Schultz and Evans (2002) examine collaborative communications with
customers along four dimensions—informality, bidirectionality, frequency, and
strategic content—and find that all of them relate positively to role performance, trust
in the key account manager, and synergistic solutions.
Furthermore, the active management of external linkages is crucial from a resource-
dependence perspective (Pfeffer, 1986) and a key determinant of GAM performance
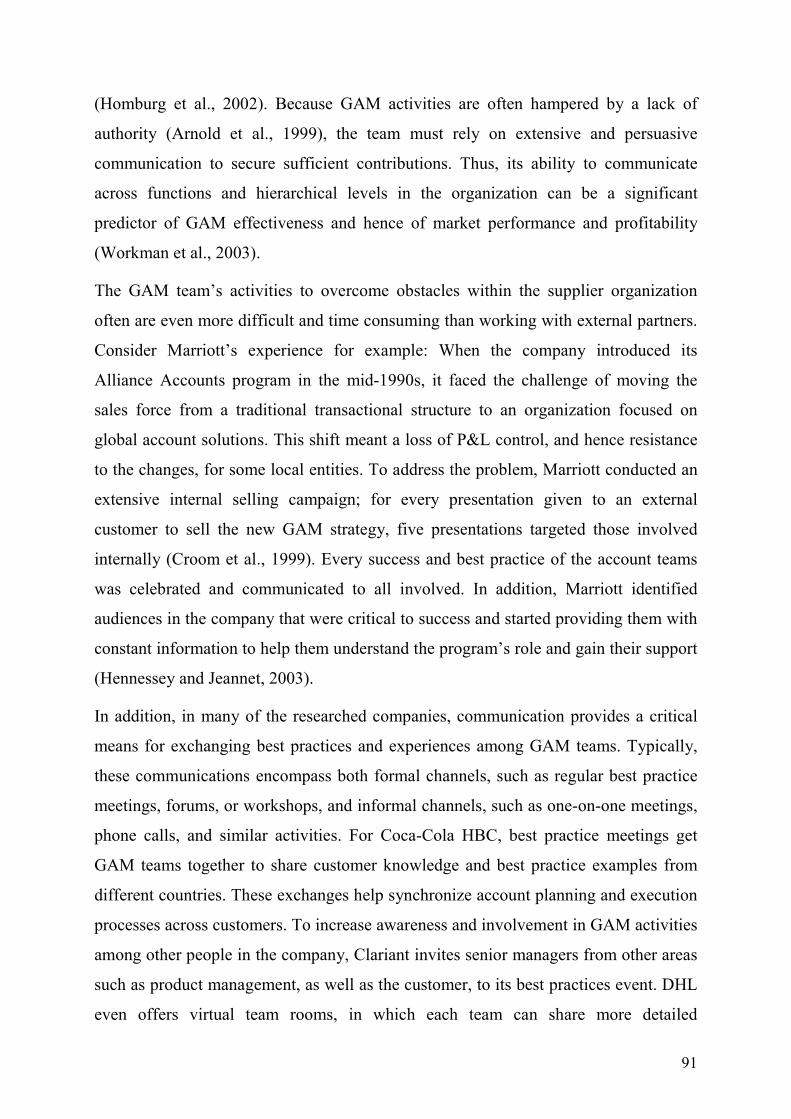
91
(Homburg et al., 2002). Because GAM activities are often hampered by a lack of
authority (Arnold et al., 1999), the team must rely on extensive and persuasive
communication to secure sufficient contributions. Thus, its ability to communicate
across functions and hierarchical levels in the organization can be a significant
predictor of GAM effectiveness and hence of market performance and profitability
(Workman et al., 2003).
The GAM team’s activities to overcome obstacles within the supplier organization
often are even more difficult and time consuming than working with external partners.
Consider Marriott’s experience for example: When the company introduced its
Alliance Accounts program in the mid-1990s, it faced the challenge of moving the
sales force from a traditional transactional structure to an organization focused on
global account solutions. This shift meant a loss of P&L control, and hence resistance
to the changes, for some local entities. To address the problem, Marriott conducted an
extensive internal selling campaign; for every presentation given to an external
customer to sell the new GAM strategy, five presentations targeted those involved
internally (Croom et al., 1999). Every success and best practice of the account teams
was celebrated and communicated to all involved. In addition, Marriott identified
audiences in the company that were critical to success and started providing them with
constant information to help them understand the program’s role and gain their support
(Hennessey and Jeannet, 2003).
In addition, in many of the researched companies, communication provides a critical
means for exchanging best practices and experiences among GAM teams. Typically,
these communications encompass both formal channels, such as regular best practice
meetings, forums, or workshops, and informal channels, such as one-on-one meetings,
phone calls, and similar activities. For Coca-Cola HBC, best practice meetings get
GAM teams together to share customer knowledge and best practice examples from
different countries. These exchanges help synchronize account planning and execution
processes across customers. To increase awareness and involvement in GAM activities
among other people in the company, Clariant invites senior managers from other areas
such as product management, as well as the customer, to its best practices event. DHL
even offers virtual team rooms, in which each team can share more detailed

92
information about presentations and other materials that may be relevant for managing
DHL’s global customers as a whole.
Internal communication and collaboration
Internal communication and collaboration refers to the interaction within the team. Shi
et al. (2005) argue that the degree of collaboration and coordination of GAM activities
within the team, across both countries and different levels, determines a supplier’s
GAM market performance and profitability. This link receives broad support from
supplier–buyer relationship literature (Buvik and John, 2000; Heide and John, 1990;
Mohr and Spekman, 1994) and organizational behavior studies (Bunderson and
Sutcliffe, 2002; Gladstein, 1984; Pinto et al., 1993). For example, Seers et al. (1995)
link internal communication and collaboration in a 10-item scale that measures
reciprocal exchange and find a positive link to efficiency. Their definition of internal
communication involves members’ contributions and receipt of ideas, feedback,
assistance, and recognition to other members.
Some authors suggest that communication has two distinct aspects—frequency and
content—that might have different effects on performance outcomes. For example,
Ancona and Caldwell’s (1992a) study shows that the frequency of communication is
unrelated to performance, unlike the content of the information. Similarly, Smith et al.
(1994) indicate that the frequency of internal communication relates negatively to the
performance of top management teams, because it tends to indicate high levels of
conflict and requires time that detracts from performance. Pinto and Pinto (1990) find
that highly cooperative project teams make significantly more use of informal
communication methods (particularly phone calls) than do less effective teams. More
important, their reasons for communication tend to revolve around obtaining project-
related information, reviewing progress, brainstorming, and receiving feedback rather
than resolving disputes, which again suggests that the content and effectiveness of
communication are more important predictors of performance than is frequency itself.
The relatively limited evidence from GAM teams, however, reveals slightly different
results. Birkinshaw et al. (2001) argue that the frequency of communication between
93
the global account manager and other individuals (both within and outside the team)
on GAM-related matters improves performance in terms of efficiency, sales growth,
and customer partnerships. These authors suggest frequent communication may
convey a sense of where priorities lie and speed up problem-solving processes.
Interviewees generally agreed that both frequency and effectiveness of communication
among team members are important; many complained that dispersed team members
lacked knowledge about what was going on with the account in other parts of the
world and what other team members had discussed with the customer on an individual
basis. As a result, these companies have introduced various channels and tools to share
information within the team. Regular face-to-face or virtual meetings involving all
team members, or at least the core, are the norm, though the frequency varies across
companies and teams, depending on the size and geographical dispersion of the team.
Other tools include regular e-mails or formal reports from the team leader to all
members on anything that seems important about the account, such as the latest
developments and results, account planning updates, and planned meetings and events.
These communications usually employ specialized Web-based tools or customer
relationship management (CRM) systems that enable the sharing of far more detailed
information. For example, IBM, Siemens, and SAP consider their CRM systems key
facilitators of inter- and intrateam collaboration and invest significantly in them. The
systems provide complete transparency about customers and the activities of other
team members and welcome input from team members regarding all relevant
information they might have about the customer—client visits reports, key issues
discussed with the customer, types of products the customer buys from their country or
division, competitive threats, new opportunities, and so forth.
However, as one of the interviewees stated, “CRM systems are just a tool that can
even get in the way of effective team working. There is nothing more effective than
people talking to one another.” This assertion reemphasizes that, regardless of the
infrastructure used to facilitate communication, the key determinant of effective
collaboration remains people’s skills and their willingness to exchange information
and work together as a team.
94
Conflict
A commonly studied team process, conflict refers to “the tension between team
members due to real or perceived differences” (De Dreu and Van Vianen, 2001: 309).
It has two main dimensions, amount of conflict and conflict resolution or management,
and comprises two types identified by research, namely, cognitive (task-based) and
affective (relationship-based) (Amason, 1996; Jehn, 1995). Jehn and Mannix (2001)
add a third type: process-based conflict. These various types differ in terms of their
effects on performance (Amason and Sapienza, 1997); high-performing teams likely
encourage functional conflict but avoid or resolve dysfunctional types of conflict.
In GAM teams, conflicts can arise from the diverse aspects of the home organizations
(functions, units, regions) represented on the team, which lead to contrasting views
and divergent task interpretations. Cultural differences associated with different ways
of doing business also emerge. SAP, for example, experienced increased disagreement
and misunderstanding among team members from countries such as Japan and China
when Western team leaders’ expectations about taking initiative and higher degrees of
independence clashed with the Asian members’ need for closer coaching and detailed
directives. Similar issues at Clariant had to be resolved through regular visits from top
management to these countries.
However, an even more problematic area from which conflicts arise, as repeatedly
noted in the exploratory research interviews, is resource disparities and disagreements
about resource allocations (Denison, 1996; Donnellon, 1993). Teams question “Who
owns the customer?” and how the P&L responsibility will split among the involved
parties, which can create performance-inhibiting tensions, as described by one of the
interview respondents:
The typical conflict that we have is that the business units are not always
aligned with what we are trying to achieve. It could be about, we think that
something is important and they don’t. But in most cases, it comes down to
money. They are there to drive short-term P&L, and we are there to
develop long-term cash flows.

95
As discussed previously, the level of these conflicts depends on (1) how the
responsibilities are split, (2) how rewards and incentives are defined, and (3) the skills
team members have in terms of demonstrating the value of global collaborations and
enforcing the global goals.
Because conflict is such a common phenomenon in GAM teams, performance depends
significantly on effective mechanisms for managing disputes. Ruekert and Walker
(1987) suggest that when conflicting parties can work out their differences in a
cooperative manner, the perceived effectiveness of the relationship between marketing
and representatives of other parts of the organization increases. Examining selling
teams, Smith and Barclay (1993) also find that unresolved conflicts or conflicts
resolved through avoidance or competition lead to declining trust and team
effectiveness.
The literature identifies several conflict-resolution mechanisms for a dispute within an
organization, including (1) conflict avoidance, (2) focusing on common interests, (3)
openly confronting the issue and resolving the dispute through negotiation and
compromise, and (4) resorting to higher authority to decide the issue unilaterally
(Ruekert and Walker, 1987). In their taxonomy of team processes, Marks et al. (2001)
group these mechanisms into two types: preemptive conflict management that
establishes conditions to prevent, control, or guide conflict management before it
occurs and reactive conflict management that works through disagreements to solve
them. The experts generally confirm these findings; in most cases, they assume the
team will work together and come up with different alternatives to solve the conflict.
In the companies with more mature GAM programs such as Citigroup, teams have
gained experience in handling such situations and manage to solve conflicts internally
in almost 95% of the cases. To a large extent, one of the interviewees noted, this
resolution depends on the skills and training of the account managers:
I believe that a really good account manager can resolve 80% of those
competing goals situations without escalation. It all comes down to the art
of negotiation, which is a function of skills and training.

96
When such resolution simply is not possible, a mechanism must specify how the team
should escalate the conflict to senior managers who can make a decision. This
recommendation presumes, of course, that management is receptive to taking a
position in these situations and helping resolve the conflict and that the team does not
perceive escalation as a failure that should be avoided. As one interviewee noted:
The basic value system in our company is that the team has to find a way to
reconcile conflicts. You have to respect one another’s different points of
view and work it out. The escalation process takes place only if this is
impossible. In such situations, teams are advised not to avoid escalating. If
you let a problem stay a problem, you will get beaten up with a vengeance
for not escalating. It is not a failure if the team cannot solve a particular
problem. A failure is if the team has not sorted out the problem and has not
escalated it.
In conclusion, clashes in teams that are as diverse and complex as global customer
teams often are just a fact of life. Therefore, GAM team performance is influenced by
the extent and frequency of conflicts, as well as the existence of working mechanisms
that can help resolve disputes in a timely and effective manner.
Proactiveness
Although many GAM activities result from a customer’s demand, the potential for a
cooperative and synergistic relationship is greatest when the supplier adopts more
proactive behavior (Harvey et al., 2003a). Arnold et al. (1999: 15) note that “the
proactive–reactive dimension matters a great deal,” and Workman et al. (2003)
identify a significant relationship between activity proactiveness and KAM
effectiveness that confirms the importance of supplier-initiated activities. As an
organization-wide strategy that defines future business for both the supplier and the
customer, GAM requires a proactive approach to understanding customers’ explicit
and latent needs and cultivating new value creation opportunities, such as creating new
demand rather than waiting for requests (Shi et al., 2005). Some of the executives in
the field interviews commented on proactivity explicitly:
97
Highly successful GAM teams are those that sell not what exists but what
does not exist.
The classical account manager from the past was waiting for interesting
new products that can boost the business and then going to the customer
and trying to sell them. The GAM team of today and the future has to see
business opportunities, come up with solutions that can boost the business.
and then find people to help execute the solutions (e.g., logistics, finance,
etc.). It really has to radar the situation, decide in which direction to go, and
mobilize the needed resources to get there.
Although some research has been conducted at the individual level of analysis
(Bateman and Crant, 1993; Crant and Bateman, 2000), relatively few studies address
this construct at the group level. Bateman and Crant (1993) define proactive behavior
as individual actions that effect environmental change through scanning for
opportunities, showing initiative, taking action, solving problems, and persevering
until changes occur. At the team level of analysis, Hyatt and Ruddy (1997) define
proactiveness as the extent to which team members actively seek areas for continuous
improvement, continuously revise work processes, seek alternative and innovative
solutions to problems, and address issues before they become major problems.
Furthermore, their study implies that proactive team behavior relates to higher
managerial ratings of team performance. Wellins et al. (1991) support this argument
by noting that a team’s ability to take action on problems and improve the quality of its
work by initiating changes can be a critical success factor.
The example of 3M’s IBM global account team illustrates how proactive efforts can
increase customer value, customer satisfaction, and the business potential of the
relationship. Having interviewed IBM managers around the world, the GAM team at
3M managed to identify an opportunity to reduce IBM’s storage losses by using new
materials that make IBM disk drives less vulnerable to contamination. The company
initiated a 3M technology group that spent two years creating a new material that
reduced IBM storage losses by 10% (Sperry, 2000). As this example shows,
companies whose GAM teams proactively and systematically look for new

98
opportunities and then are not afraid to take actions to realize those opportunities are
likely to reap the benefits of long-term customer relationships and thus outperform
their competitors. To achieve such benefits though, GAM teams sometimes must
initiate changes in their existing organizations and processes in ways that may be
considered radical but still are justified by the positive outcome (Shi et al., 2005).
Hypothesis 3: GAM team processes (i.e., external and internal communication and
collaboration, conflict management, proactiveness) have a positive influence on
GAM team relational performance.
Hypothesis 4: GAM team processes (i.e., external and internal communication and
collaboration, conflict management, proactiveness) have a positive influence on
GAM team financial performance.
3.2.4. GAM team performance
Although the team’s composition and interactions have implications for individual
members and overall GAM organizational outcomes, it is most appropriate to examine
performance at the team level. Individual performance narrows the focus and provides
only limited insights about the group aspect under investigation; furthermore, overall
GAM performance likely is affected by factors external to the team. Because this
research is designed to gain a better understanding of the team phenomenon, it focuses
on two types of team outcomes: financial, or quantitative, and relational, or qualitative,
performance.
Financial performance
In identifying appropriate team performance measures, Cohen and Bailey (1996)
recommend performance criteria specific to the task and the type of team, as well as
aggregated measures of overall performance. In the selling team context, quantitative
performance measures might include sales volume, profitability, customer retention
rates, and/or the number of new customers acquired (Perry et al., 1999). Because the

99
responsibilities of the GAM team are limited to one or a few related customers and
because its goals are to develop long-term collaborative relationships, sales growth and
profitability represent more appropriate criteria (Birkinshaw et al., 2001; Homburg et
al., 2002; Shi et al., 2005). These two measures constitute an integral part of the key
performance indicators of all the researched companies, because they avoid measuring
sales at a certain point and instead assess the team’s ability to identify cross-selling
opportunities through cross-divisional cooperation and work together with the
customer to reduce costs and increase sales to end consumers. Other measures of key
account performance identified in prior research include reduced cost of sales to
customers, more efficient use of salespeople’s time in serving the customer, cross-
selling to divisions of the customer’s operation in which the supplier traditionally has
been weak (Arnold et al., 2001), securing desired market share, and attracting new
customers (Homburg et al., 2002). However, the interviews reveal yet another
important GAM team performance metric: share of the customer’s wallet. This
measure refers to the share of the customer’s total purchasing volume actually devoted
to the specific supplier. Again, growth in the share of wallet may be more important
than the absolute value, because it indicates that the team has been able to gain share
from its competitors who supply the same customer.
Relational performance
Measuring GAM team performance using purely quantitative criteria runs the risk of
missing vital aspects of partnering with the customer. The goals and objectives of a
supplier when forming GAM teams and developing relationships with key customers
are much broader than simply sales volume. Some of these goals include the creation
of a long-term relationship, learning, and innovation, the latter of which can result
from various joint initiatives and increased access to new product ideas or leading-
edge practices undertaken by the customer (Birkinshaw et al., 2001). Other qualitative
measures of GAM team performance might include customer assessments of the
relationship and customer satisfaction (Gladstein, 1984; Shea and Guzzo, 1987). In
addition, the team’s ability to meet its goals and objectives (Moon and Gupta, 1997),

100
gain broader market access, and achieve better competitive position in the market can
provide an indication of its performance (Smith and Barclay, 1993). Field research by
Shi et al. (2005) indicates that for GAM executives, some of the most important
relational outcomes are customer satisfaction and the ability to provide customer
value. Many of these measures appear integrated into the GAM outcomes proposed by
Homburg et al. (2002)—maintaining long-term relationships, achieving mutual trust,
achieving customer satisfaction, providing customer value, and successfully
introducing new products.
Finally, the relationship between the two performance indicator groups is worth
investigating. In many studies they are considered as ultimate unrelated outcomes
(Cohen and Bailey, 1997). However, if the relational performance construct is
decomposed in its building elements such as customer satisfaction, customer value or
enhanced market position, it becomes clear that it may have an influence on financial
outcomes. The debate about the effects of customer satisfaction has been ongoing in
the marketing literature and some authors argue that customer satisfaction does not
always correlate with organizational performance (Jones and Sasser, 1995). However,
a number of studies support the notion of a positive relationship between satisfied
customers and financial performance (Anderson et al., 1997; Rust and Zahonik, 1993)
as well as the customer’s willingness to pay (Homburg et al., 2005). Similarly,
customer value delivery has been considered a source of competitive advantage and
performance improvement (Naumann, 1995; Woodruff, 1997). Therefore, it is
expected that relational performance will have a positive influence on financial
performance.
Hypothesis 5: Relational performance has a positive influence on financial
performance.

101
4. Empirical study
As discussed earlier, the objective of this second empirical research stage was to build
on the findings from the qualitative interview research and to test the framework with
more robust statistical methods. Despite the advantages of qualitative methods in early
research phases, qualitative research usually yields findings that cannot be generalized
to whole populations (Eisenhardt, 1989). Consequently, once the problem becomes
clearer and specific propositions emerge, a quantitative approach that tests hypotheses
and examines cause-and-effect relationships between variables is more appropriate.
Because most surveys have a descriptive or analytical objective, they represent a good
research strategy for theory testing (Black, 1999). Therefore, a survey was selected as
the best strategy to test the framework developed through the first stage of interview
research.
Furthermore, surveys are widely used in the areas of marketing, business, political
science, psychology, and sociology (Babbie, 1990) and have been instrumental in team
research (e.g., Campion et al., 1993; Denison et al., 1996; Gladstein, 1984). Their key
advantage is their generalizability (i.e., high external validity), which results from their
ability to generate large representative samples that can be tested statistically (Snow
and Thomas, 1994). The use of large samples enables the development of
methodologically robust conclusions. Moreover, the abstraction achieved by
quantifying the studied phenomena facilitates an identification of common patterns
that indicate more or less persistent structures (Bentz and Shapiro, 1998).
Finally, recent empirical research that identifies a trend toward increased use of
combined methods in academic publications supports the choice of this research
design (Scandura and Williams, 2000). Combining methodological approaches offers
several advantages and likely leads to more profound insights through the resultant
enhanced validity, reliability, and holistic perspective (Bentz and Shapiro, 1998;
Denzin, 1970). In a review of 57 mixed-method studies, Greene et al. (1989) propose
that linking qualitative and quantitative methods can help sequentially develop ideas
(i.e., the results of the first method appear in the second’s sampling, instrumentation,
and so forth) and expand the scope and breadth of a study. In addition, Rossman and
102
Wilson (1985) suggest that the use of combinatory methods is justified when the goal
is to confirm or corroborate findings through triangulation.
4.1. Method
The first step in designing the survey was to decide whether to conduct a cross-
sectional study with many companies represented by one or few respondents per
company or a study of a limited number of companies that each provide many teams
and respondents. Research into top management teams traditionally uses cross-
sectional surveys, because they engage top managers best by requiring less of their
time and efforts. In addition, single-company surveys often are not possible because of
the few top managers. In organizational group research, however, single-company
surveys are more common. In a review of 28 team studies, Cohen and Bailey (1997)
find that most investigate teams within a single company; only one-quarter extend
their setting to at least two organizations, and only two examine more than one
industry. Notable one-company studies not reviewed by Cohen and Bailey (1997)
include Gladstein (1984), Keller (1986), Denison et al. (1996), Bunderson and
Sutcliffe (2002), and, in a marketing context, Ruekert and Walker (1987). Surveys of
just a few companies are also common; for example, Pelled et al. (1999) survey teams
from three companies, Keller (2001) four, and Ancona and Caldwell (1992a) five.
For this study, a research design involving a small number of companies appears more
appropriate, largely because the unit of analysis is the team, not the company. By
examining teams in fewer organizational settings, it becomes possible to reduce the
variance in external factors that may affect team performance. In turn, a more precise
investigation of the hypothesized relationships becomes possible, which also increases
internal validity. Furthermore, the problems associated with cross-sectional surveys of
GAM teams become evident in Workman et al.’s (2003) study of the determinants of
GAM effectiveness. With a sample of 385 companies in Germany and the United
States, their study captures a great variety of teams and team contexts and yet fails to
find significant support for the hypothesis that the use of teams improves
effectiveness. The authors suggest that future research efforts should examine the team

103
characteristics that influence effectiveness more precisely, which requires a certain
level of comparability among the surveyed teams.
The selected research design is also preferable to a cross-sectional study because of the
potential difficulties associated with the latter, such as sampling problems and low
response rates. A survey from a small number of companies should induce a higher
response rate, because it would be endorsed by senior managers who could inform the
respondents in advance and ask them to complete the survey. More important, such a
survey likely involves a more appropriate sample of qualified respondents.
Determining who is considered a member of the GAM team and defining the limits of
the team can be a substantial challenge for an outsider and represents a major obstacle
and limitation of a large cross-sectional research design. With a survey of only a few
companies, I avoided this problem by discussing the objectives of the project with the
project sponsor in each of the companies and clearly indicated that all respondents
should be in positions to complete the questionnaire; namely, they should be assigned
to or actively involved in the work of a GAM team as full- or part-time members or
have regular working contacts with the team that qualify them to assess its work. This
specification ensured that the potential respondents were the most qualified in each
company, which is a critical prerequisite for collecting high-quality data.
4.2. Sample
The selection of the companies for the survey followed similar criteria as the interview
research. The companies had to be large MNCs with an established GAM program and
extensive usage of GAM teams. Initially, unlike in the exploratory research, some
industry similarity was sought to limit the variance in external influences. However,
finding a sufficient number of companies from related industries proved difficult, so
this condition had to be abandoned in favor of a larger sample.
The initial sampling frame emerged from the Strategic Account Management
Association (SAMA) membership list, as well as additional contacts from the
interview research and other appropriate projects. The head of SAMA’s Education and
Resources division evaluated the Association’s membership base to identify managers
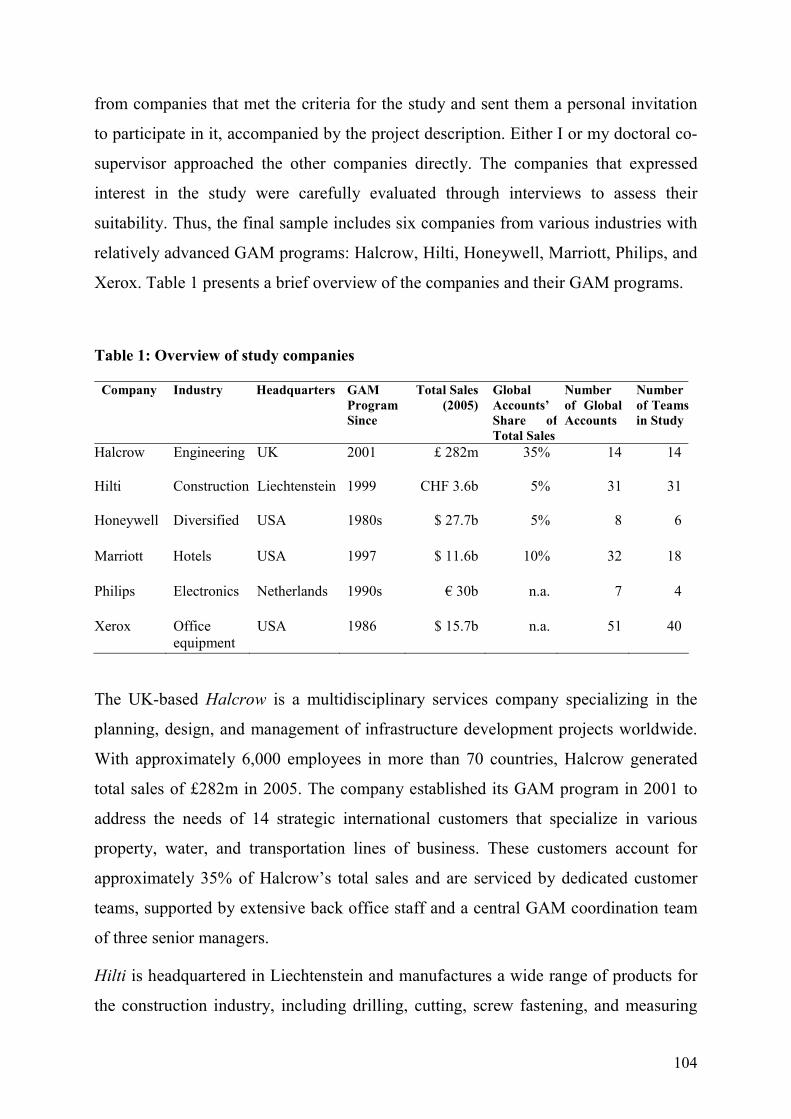
104
from companies that met the criteria for the study and sent them a personal invitation
to participate in it, accompanied by the project description. Either I or my doctoral co-
supervisor approached the other companies directly. The companies that expressed
interest in the study were carefully evaluated through interviews to assess their
suitability. Thus, the final sample includes six companies from various industries with
relatively advanced GAM programs: Halcrow, Hilti, Honeywell, Marriott, Philips, and
Xerox. Table 1 presents a brief overview of the companies and their GAM programs.
Table 1: Overview of study companies
Company Industry Headquarters GAM Program Since
Total Sales (2005)
Global Accounts’ Share of Total Sales
Number of Global Accounts
Number of Teamsin Study
Halcrow Engineering UK 2001 £ 282m 35% 14 14
Hilti Construction Liechtenstein 1999 CHF 3.6b 5% 31 31
Honeywell Diversified USA 1980s $ 27.7b 5% 8 6
Marriott Hotels USA 1997 $ 11.6b 10% 32 18
Philips Electronics Netherlands 1990s € 30b n.a. 7 4
Xerox Office equipment
USA 1986 $ 15.7b n.a. 51 40
The UK-based Halcrow is a multidisciplinary services company specializing in the
planning, design, and management of infrastructure development projects worldwide.
With approximately 6,000 employees in more than 70 countries, Halcrow generated
total sales of £282m in 2005. The company established its GAM program in 2001 to
address the needs of 14 strategic international customers that specialize in various
property, water, and transportation lines of business. These customers account for
approximately 35% of Halcrow’s total sales and are serviced by dedicated customer
teams, supported by extensive back office staff and a central GAM coordination team
of three senior managers.
Hilti is headquartered in Liechtenstein and manufactures a wide range of products for
the construction industry, including drilling, cutting, screw fastening, and measuring

105
systems. Its 2005 total sales reached CHF3.6b, and the number of employees was
16,000 in 120 countries. The first global account managers were appointed almost 15
years ago, but a more structured GAM program has been in place only since 1999. The
program encompasses 31 global customers from the construction industry that account
for approximately 5% of Hilti’s total sales. They are managed by 23 global account
executives and their teams.
Honeywell is a diversified technology and manufacturing company, serving customers
worldwide with aerospace products and services; control technologies for buildings,
homes, and industry; automotive products; turbochargers; and specialty materials. It is
based in the United States and generated US$27.7b in 2005 from more than 100,000
employees in 95 countries. Its GAM program dates back to the early 1980s, and in the
last two years, the company has devoted increased efforts to reenergize it. The GAM
program involves 8 global accounts and 10 regional EMEA accounts, primarily from
the oil and gas industry. Each has a dedicated team at Honeywell.
Marriott International is a worldwide hospitality company based in Washington, DC.
It employs 143,000 people and runs more than 2,800 hotels and other lodging
properties in 67 countries. Its total sales in 2005 amounted to US$11.6b, of which 10%
was generated by its 32 global accounts from various industries. The GAM program
was established in 1997 and involves 14 Global Account Directors and more than 400
people in account management or global sales positions.
Royal Philips Electronics, headquartered in the Netherlands, is a leading provider of
products and services in four business areas: consumer electronics, domestic
appliances and personal care, medical systems, and lighting. It employs 125,500
people in more than 60 countries and generated sales in excess of EUR30b in 2005. Its
GAM program targets large retailers such as Wal-Mart and covers 7 large global
customers (Tier 1 accounts) and 13 smaller Tier 2 customers.
Headquartered in Connecticut, in the United States, the Xerox Corporation is a leader
in the document industry, providing a wide range of products such as printing and
publishing systems, digital presses, copiers, and fax machines. With 55,200 employees
worldwide, the company generated revenues of US$15.7b. Since 1986, when Xerox

106
started with a GAM test program, the program has expanded to 51 premier global
accounts and hundreds of smaller global or regional ones. Xerox also employs
hundreds of global account managers supported by teams that are responsible for one
or a few accounts.
The overall sample consists of 273 valid responses from 113 GAM teams in these six
companies. Table 1 indicates the number of teams per company. Whereas Halcrow and
Hilti involved all their GAM teams, the other four companies contained some teams
deemed unsuitable for the study for various reasons, such as ongoing restructuring or
low performance in the previous year for reasons external to the team. Even after
excluding these cases, the survey encompassed the majority of teams, which ensures a
sufficient number of representative teams and variance. All respondents met the
selection requirements; they directly supported or were involved in the GAM team, in
positions ranging from key or global account managers to regional or country general
managers to members of the top management team. More detailed sample
characteristics appear in the results section.
4.3. Questionnaire
The data collection instrument consists of a multiple-item survey questionnaire. To
ensure the reliability and validity of the measurements, questionnaire development
occurred in several stages, following the guidelines provided in the literature
(Churchill, 1979; DeVellis, 1991; Venkatraman and Grant, 1986). The first step
involved reviewing all relevant literature again, with a specific focus on existing scales
used in previous empirical research. A content analysis of the 13 expert interviews
provided the means to adapt the validated scales to the context of GAM teams and
develop new measures if no available scales existed. The development of these new
scales also relied on a thorough review of the conceptual literature. Several academic
experts and other doctoral students reviewed the initial list of items in the
questionnaire and provided suggestions for improvement. In accordance with their
comments, I added, deleted, or reworded several questions. Finally, 11 senior GAM
executives, including managers from each of the six research companies and some of

107
the interviewees from the exploratory research phase, agreed to pretest the modified
survey. They completed the survey, commented on the importance of the items, and
identified any ambiguous or biased questions or potential quality issues. Their major
concern centered on the length of the survey; therefore, I identified several items to
eliminate that did not cause a significant loss of validity in the constructs.
The final version of the questionnaire appears in Appendix F. To increase the
credibility of the questionnaire and improve the response rate, each company received
a separate questionnaire that contained the same questions but was personalized with
the company name and signed by both the project sponsor and me. The questionnaire
design followed Dillman’s (2000) guidelines for constructing questionnaires; the first
section contained a short description and instructions that stressed that all provided
data would be treated as confidential and aggregated prior to analysis.
The core part of the questionnaire consists of five sections—structure and tasks; skills,
competencies, and leadership; organizational context; processes and behaviors; and
outcomes—that reflect the key dimensions of interest. Following Salancik and
Pfeffer’s (1977) approach to avoiding consistency bias effects, the outcome section,
which contains the dependent variables, appears at the end of the questionnaire, after
the independent variables. Within each section, the questions group around the topics
they assess and appear in a logical sequence, which increases their salience and ease of
understanding (Heberlein and Baumgartner, 1978). Finally, respondents are asked to
provide some background information and could express any relevant comments in a
provided blank space.
4.4. Variable operationalization
As described previously, the questionnaire development followed several steps
designed to ensure the maximum validity of the measures. Wherever possible, the
scales used to measure the proposed constructs were based on existing and tested
scales, though most existing measures had to be adapted to fit the researched
constructs. For example, measures from organizational behavior literature had to be
adapted to the context of GAM, and measures used in account management literature
108
to assess performance at a program or company level had to be adapted to the team
level. In addition, several new scales appear in the questionnaire. The meta-analysis
results of Churchill and Peter (1984) provide support for the use of adapted or newly
developed scales in marketing research. Having failed to find significant differences
among the reliabilities of originally developed, borrowed-modified and borrowed-
unmodified scales, they concluded that the properties of the measures themselves are
more influential than the measure development procedures.
All core questions, except those referring to team financial and overall performance,
are based on statements that participants evaluated on five-point Likert scales ranging
from 1 = “strongly disagree” to 5 = “strongly agree.” The questions follow an
informant rather than respondent approach, in that the participants evaluate their
team’s rather than their own personal behaviors or attitudes (Van der Vegt and
Bunderson, 2005).
4.4.1. Dependent variables
Although the six focal companies were requested to provide objective measures of
performance, such as actual sales and profitability figures per team, they all rejected
this request for several reasons. First, not all of the companies had such measures
available at a team level because their financial systems and sales allocation
mechanisms do not track sales in this way. Second, some companies refused for
confidentiality reasons. As a result, this study uses subjective performance ratings.
Subjective assessments of task performance, buyer–seller relationship maintenance,
and other performance outcomes at the group level are appropriate in team selling
research because objective outcomes can be difficult to measure in contexts that
involve long, complex selling cycles and whose results may be influenced by product
and competitive factors extraneous to the team (Gladstein, 1984; Smith and Barclay,
1993). Furthermore, objective measures are appropriate to determine how well the
team achieves its quantitative goals, but in many cases, perceptions of effectiveness
among key stakeholders (e.g., customer satisfaction) represent strong indicators of
team performance as well (Cohen and Bailey, 1996).
109
A three-item scale adapted from the performance scale of Homburg et al. (2002) and
the efficiency and sales growth scale of Birkinshaw at al. (2001) measures the
financial performance dependent variable. Respondents evaluated how their team
performed, in the past three years, with respect to (1) growth in sales, (2) profitability,
and (3) growth in the share of global customers’ wallets. These questions use a five-
point Likert scale ranging from 1 = “poor” to 5 = “outstanding.”
The relational performance dependent variable uses a six-item scale adapted from the
KAM effectiveness scale of Homburg et al. (2002) and the partnership with customer
scale of Birkinshaw at al. (2001). The items are as follows: “Our team is characterized
by strong and harmonious long-term relationships with global customers,” “Our
customers are satisfied with the overall performance of our team,” “Our team provides
real value to our customers,” “Our team has successfully learned some critical skills or
capabilities from our customer relationships,” “Our company’s competitiveness has
been enhanced due to our team’s GAM achievements,” and “Our team achieves its
goals and objectives.”
4.4.2. Independent variables
Following McGrath’s (1984) recommendations about studying work groups, multiple
constructs and multiple items per construct represent all team characteristics. At least
three items reflect nearly every construct to ensure adequate internal consistency.
The goal and role definition measure involves a newly developed five-item scale that
consists of the following items: “Our GAM team has well-defined goals and objectives
related to our global customers,” “Our team’s goals and objectives are well aligned
with our overall corporate strategies,” “Team members’ individual objectives and
targets are linked to GAM team objectives,” “The roles and responsibilities of team
members are clearly defined,” and “The roles and responsibilities of team members are
understood across the organization.”
A newly developed five-item scale also measures team structure; the items are “The
team has a workable structure and clear reporting lines,” “The team is well positioned
110
and integrated in the overall organizational structure of our company,” “The team
structure provides appropriate cross-geographical coverage for our customers,” “The
team structure provides appropriate cross-functional coverage for our customers,” and
“The team structure provides appropriate cross-divisional coverage for our customers.”
Empowerment consists of a three-item scale, specifically: “Our team has sufficient
authority to make important decisions about our customer business,” “Our team has
sufficient authority to change organizational routines to achieve better results for our
customers,” and “Our team has the resources required to innovate and develop our
global customer relationships continuously.” These items represent adaptations from
the authority scale that Mathieu et al. (2006) use to measure empowerment, and from
the resources measure of Denison et al. (1996).
The size adequacy measure is one item adapted from Cohen et al. (1996): “The
number of people in our team is sufficient for our customer business to be developed
efficiently.”
To measure heterogeneity, this study uses the three-item scale proposed by Campion et
al. (1993): “Team members vary widely in their areas of expertise,” “Team members
have a variety of backgrounds and experiences,” and “Team members have
complementary skills and abilities.”
The adequate skills construct employs a newly developed nine-point scale that asks
respondents to what extent they agree with the statements that the account and sales
managers on their team: “are capable of building strong and trusting relationships,”
“have a good understanding of our customer’s business and organization,” “have a
good understanding of our business and the internal capabilities of our company,” “are
able to think and work in an interdisciplinary way,” “are able to coordinate complex
networks and activities,” “are able to think creatively to deliver value to the customer,”
“are able to work in a diverse and multicultural environment,” “employ strategic, long-
term thinking,” and “possess powers of persuasion.”
A three-item scale adapted from Gladstein’s (1984) leadership measure and Scott’s
(1997) measure of a team leader’s organizational influence serves to measure the
leadership variable. The questionnaire items asked respondents to what extent they

111
agreed with the statement that their team leader: “has substantial influence in the
organization (even when he/she has no formal authority),” “has a strong relationship
with top management,” and “is able to motivate team members and create synergies
within the team.”
The items related to top management support come from the top management global
orientation measure of Townsend et al. (2004) and Scott’s (1997) scale of top
management support and recognition. The three items are as follows: “Our top
management is actively involved in the team’s efforts to develop profitable, long-term
relationships with global customers,” “Our top management is committed to deploying
the necessary resources to make our global customer operations succeed,” and “Our
top management publicly promotes our team’s GAM activities to others in the
organization.”
The newly developed three-item scale used to measure rewards and incentives
includes the following items: “Team members’ contributions to developing global
customers are measured in a systematic and transparent manner,” “Our compensation
system promotes global collaboration by appropriately rewarding contributions to the
GAM team,” and “Many professional rewards (e.g., pay, promotions) are determined
in large part by team members’ performance on the GAM team.”
The training scale, adapted from Campion et al. (1993), includes three items: “The
company provides adequate global selling and negotiation training for our team,” “The
company provides adequate team skills training for our team (e.g., communication,
organization, interpersonal),” and “The company provides adequate technical training
for our team.”
The measure of external communication and collaboration employs a newly developed
three-item scale: “Our team regularly exchanges best practices and market knowledge
with other GAM teams,” “Team members communicate proactively on issues related
to our GAM activities across boundaries and hierarchical levels in the entire
organization,” and “Our team has difficulty obtaining support from other parts of the
organization” (reverse coded).

112
Internal communication and collaboration entail a four-item scale adapted from
Bunderson and Sutcliffe’s (2002) information-sharing scale and the measure of within-
group collaboration from Campion et al. (1993). The items are as follows:
“Communication in the team is effective, despite the geographical distance of team
members,” “Team members keep one another updated about their activities and key
issues affecting the business,” “Team members are good at coordinating their efforts to
serve the customer efficiently,” and ”Team members collaborate to achieve our global
goals.”
The conflict management scale includes two items adapted from Denison et al. (1996):
“Disputes between the different units represented on our team make it difficult to do
our work” (reverse coded) and “Our team is able to identify and resolve conflicts in a
timely and effective manner,” as well as two newly developed items: “Our team can
easily send problems up the chain of command (escalate to senior management) when
they cannot be resolved within the team” and “The negative politics within the team
are minimal.”
Finally, the proactiveness scale contains a three-item adaptation of Bateman and
Crant’s (1993) measure of individual proactivity, similar to the team adaptation of the
same construct used by Kirkman and Rosen (1997): “Team members proactively
cultivate new business opportunities,” “Our team is not afraid to challenge the status
quo to improve our customer relationships,” and “The team is a powerful force for
constructive change in the organization.”
4.4.3. Control variables
In addition to the dependent and independent variables described above, the
questionnaire included a number of variables that aimed to control for the influence of
key respondents’ characteristics: (1) organizational tenure, (2) team tenure, (3) gender,
and (4) age. All of these variables were measured with single-item scales.
Furthermore, three control variables at a company level were considered: (1) company
industry, (2) company size as measured by sales, and (3) GAM program size as

113
measured by the number of global accounts and the percentage of total sales generated
from global customers.
4.5. Data collection procedures
The data collection took place during August 15–September 30, 2006. The entirely
online survey relied on the Internet platform www.questionpro.com because an online
format offers several advantages over mail surveys. First, Internet surveys are
particularly useful for international studies because they overcome geographical
boundaries, one of the primary barriers to conducting surveys (Dillman, 2000). The
very nature of the sample required a fast and efficient way to reach a relatively large
number of people in various countries. Furthermore, in their positions as global
account managers, many respondents spend a large part of their time traveling, which
demands an approach they could access even if they were away from their usual
workplace. Second, common concerns about Internet surveys, such as limited access to
computers or varying degrees of computer literacy (Dillman, 2000), are not a problem
in this study because the sample includes managers with daily access to e-mail and the
Internet and who must possess the required computer skills and feel comfortable with
Internet applications for their jobs (Zhang, 2000). Third, Internet surveys reduce time
and costs substantially. Fourth, an online survey significantly reduces the likelihood of
transcription and coding errors because the data entry takes place as the respondents
fill in the questionnaire and automatically gets stored in an electronic form (Sills and
Song, 2002; Simsek and Veiga, 2001). In addition, a pretest of the survey on the Web
platform confirmed that the interface was operational, the server was reliable, and the
data were collected correctly.
Multiple data collection contacts increase response rates in both mail (Linsky, 1975;
Dillman, 1991) and e-mail (Schaefer and Dillman, 1998) surveys better than any other
technique. Therefore, the data collection followed a four-step approach, similar to that
Dillman (2000) recommends for mail surveys. First, the survey sponsors in each of the
six research companies informed the participants about the forthcoming survey by e-
mail. In all companies, the sponsors were senior managers responsible for global
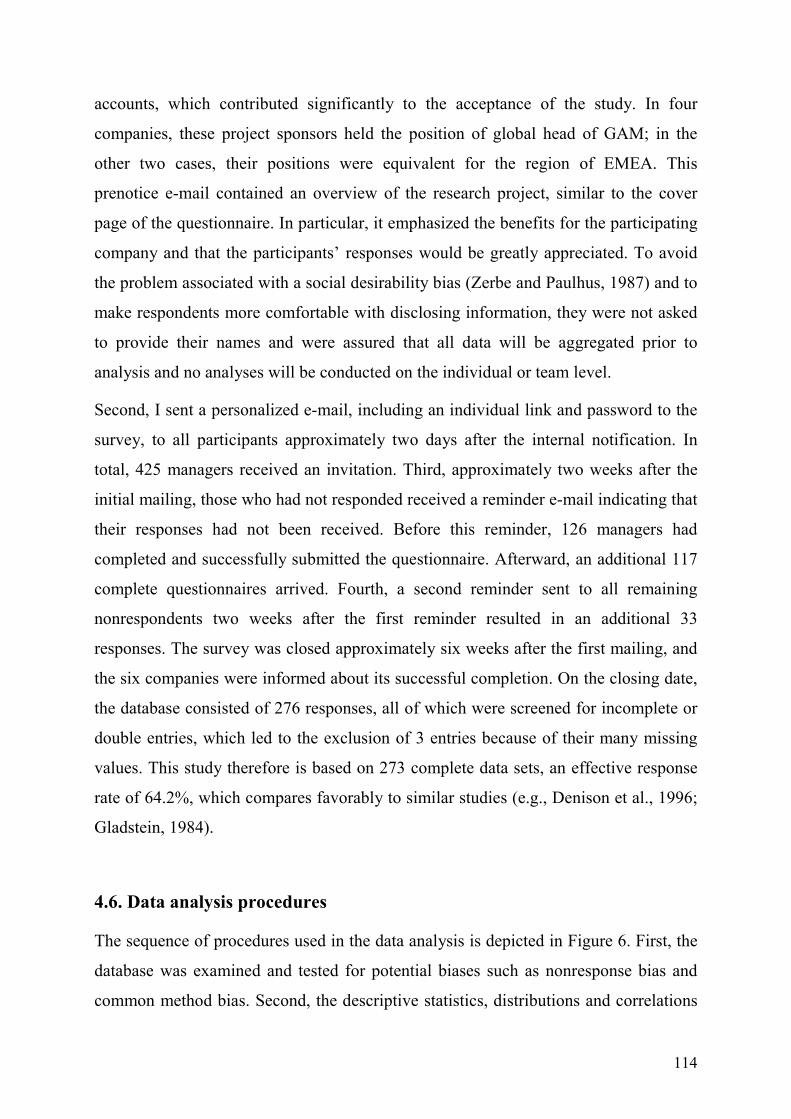
114
accounts, which contributed significantly to the acceptance of the study. In four
companies, these project sponsors held the position of global head of GAM; in the
other two cases, their positions were equivalent for the region of EMEA. This
prenotice e-mail contained an overview of the research project, similar to the cover
page of the questionnaire. In particular, it emphasized the benefits for the participating
company and that the participants’ responses would be greatly appreciated. To avoid
the problem associated with a social desirability bias (Zerbe and Paulhus, 1987) and to
make respondents more comfortable with disclosing information, they were not asked
to provide their names and were assured that all data will be aggregated prior to
analysis and no analyses will be conducted on the individual or team level.
Second, I sent a personalized e-mail, including an individual link and password to the
survey, to all participants approximately two days after the internal notification. In
total, 425 managers received an invitation. Third, approximately two weeks after the
initial mailing, those who had not responded received a reminder e-mail indicating that
their responses had not been received. Before this reminder, 126 managers had
completed and successfully submitted the questionnaire. Afterward, an additional 117
complete questionnaires arrived. Fourth, a second reminder sent to all remaining
nonrespondents two weeks after the first reminder resulted in an additional 33
responses. The survey was closed approximately six weeks after the first mailing, and
the six companies were informed about its successful completion. On the closing date,
the database consisted of 276 responses, all of which were screened for incomplete or
double entries, which led to the exclusion of 3 entries because of their many missing
values. This study therefore is based on 273 complete data sets, an effective response
rate of 64.2%, which compares favorably to similar studies (e.g., Denison et al., 1996;
Gladstein, 1984).
4.6. Data analysis procedures
The sequence of procedures used in the data analysis is depicted in Figure 6. First, the
database was examined and tested for potential biases such as nonresponse bias and
common method bias. Second, the descriptive statistics, distributions and correlations
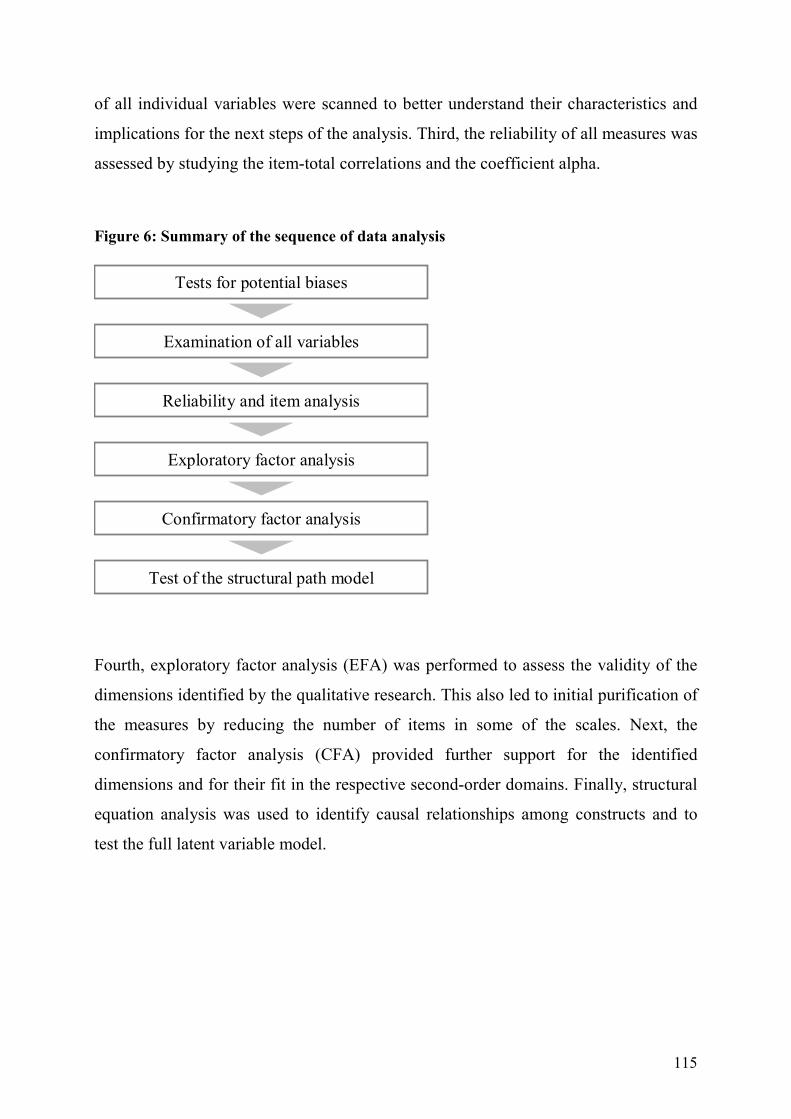
115
of all individual variables were scanned to better understand their characteristics and
implications for the next steps of the analysis. Third, the reliability of all measures was
assessed by studying the item-total correlations and the coefficient alpha.
Figure 6: Summary of the sequence of data analysis
Fourth, exploratory factor analysis (EFA) was performed to assess the validity of the
dimensions identified by the qualitative research. This also led to initial purification of
the measures by reducing the number of items in some of the scales. Next, the
confirmatory factor analysis (CFA) provided further support for the identified
dimensions and for their fit in the respective second-order domains. Finally, structural
equation analysis was used to identify causal relationships among constructs and to
test the full latent variable model.
Tests for potential biases
Examination of all variables
Reliability and item analysis
Confirmatory factor analysis
Exploratory factor analysis
Test of the structural path model
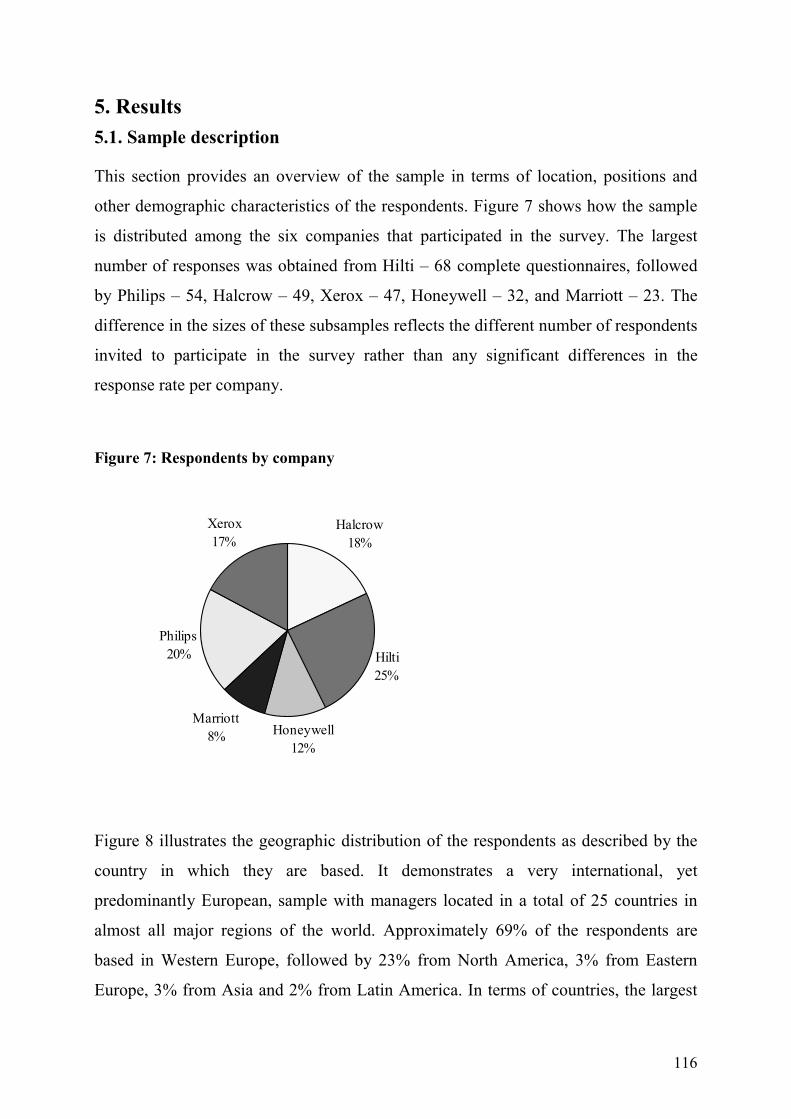
116
5. Results 5.1. Sample description
This section provides an overview of the sample in terms of location, positions and
other demographic characteristics of the respondents. Figure 7 shows how the sample
is distributed among the six companies that participated in the survey. The largest
number of responses was obtained from Hilti – 68 complete questionnaires, followed
by Philips – 54, Halcrow – 49, Xerox – 47, Honeywell – 32, and Marriott – 23. The
difference in the sizes of these subsamples reflects the different number of respondents
invited to participate in the survey rather than any significant differences in the
response rate per company.
Figure 7: Respondents by company
Halcrow18%
Hilti25%
Honeywell12%
Marriott8%
Philips20%
Xerox17%
Figure 8 illustrates the geographic distribution of the respondents as described by the
country in which they are based. It demonstrates a very international, yet
predominantly European, sample with managers located in a total of 25 countries in
almost all major regions of the world. Approximately 69% of the respondents are
based in Western Europe, followed by 23% from North America, 3% from Eastern
Europe, 3% from Asia and 2% from Latin America. In terms of countries, the largest

117
share is represented by the UK (28%) followed by the USA (23%), Germany (8%) and
France (7%).
Figure 8: Respondents by country
28%
8%
7%5%4%4%3%
10%
3%
23%
2%
3%UKGermanyFranceLiechtensteinBelgiumNetherlandsItalyRest of W. EuropeEastern EuropeUSALatin AmericaAsia
The respondents hold a wide range of positions ranging from technical specialists and
country sales representatives to CEO and board members.
Figure 9: Respondents’ position
GAM, IKAM, Head of GAM
24%
Other15%
KAM, NAM, account manager
20%Sales director, sales manager, head of sales
17%
TMT member, managing
director, general manager, head of region , head
of BU24%
118
Figure 9 shows that some 24% of the respondents are in a senior-level position with
general management responsibilities. The same percentage of respondents are
responsible for managing international customer relationships with job titles such as
global account manager or international key account manager. Another 20% are
responsible for customer relationships in a more limited geographical region and had
titles such as key account manager or national account manager. Finally, 17% were
responsible for sales and 15% held other more specialized positions, e.g. technical
support, logistics, marketing etc. Overall, Figure 9 provides support that the
respondents were well qualified for the study because they represent positions and
functions that are expected to be well acquainted with the work of the GAM teams in
an organization.
Figure 10: Respondents’ team tenure
3 to 4 years19% 1 to 2 years
42%
Less than 1 years16%
More than 4 years23%
Figure 10 presents the sample composition in terms of respondents’ team tenure. The
average team tenure is 3 years (SD = 2.8). Respondents who have been involved in
their respective teams for less than one year account for only 16% of the total sample.
Approximately 42% have been working with their teams for a period of one to two

119
years. 19% have been involved for three to four years and 23% for more than four
years. These figures reflect the relatively early age of GAM teamwork in some of the
participating companies. For example, at Halcrow and Hilti, GAM teams have been
more formalized only in the recent years. Also, in many of the other companies, the
GAM programs have started with a smaller number of people and with time larger
teams have gradually formed around the individual account managers.
A profile of the survey participants in terms of organizational tenure is presented in
Figure 11. The average organizational tenure is 12.5 years (SD = 8.6), with
approximately half of the respondents (51%) having worked in their company for 12
years or longer. This indicates a good familiarity with the company and potentially a
strong understanding of the global customer organization and processes.
Figure 11: Respondents’ organizational tenure
More than 20 years17%
16 to 20 years18%
1 to 3 years19%
4 to 7 years16%
8 to 11 years14%12 to 15 years
16%

120
5.2. Examination for potential biases
The first step in analyzing the data was to check the database for potential biases. In
particular, two types of bias – nonresponse and common method – were of concern for
this study.
5.2.1. Nonresponse bias
Nonresponse bias in a database refers to the possibility that the persons who responded
differ significantly from those who did not, which does not allow to draw conclusions
for the entire sample. Literature suggests that the best remedy against this type of bias
is the reduction of nonresponse itself (Armstrong and Overton, 1977). Therefore, the
high response rate (64%) of this study suggests that there is no strong reason to suspect
the existence of nonresponse bias. Nevertheless the first step is to assess it because
surveys have often been criticized for it. Armstrong and Overton (1977) suggest three
methods of estimating nonresponse bias: comparison with known values for the
population, subjective estimates and extrapolation (i.e., comparison between early and
late respondents assuming that late participants resemble nonrespondents). The first
two methods are not applicable in this research because no prior values are available
for any of the variables examined in this study and there is no strong basis for
subjectively estimating differences between respondents and nonrespondents.
Consequently, similar to other studies in GAM and marketing (Townsend et al., 2004;
Workman et al., 2003), the extrapolation procedure was used. Following the procedure
described by Workman et al. (2003), the dataset was divided into thirds within each
company according to the date when the questionnaire was completed. Next,
independent sample t-tests were conducted to check for differences between the first
third (n = 91) and the last third (n = 91) in the mean responses for the items used.
The results for the independent variables do not indicate the existence of substantial
response bias. In most cases (71% of the items) late respondents have given higher
ratings than early respondents but these differences are not significant. The only three
items with significantly different mean responses are: 2.5 “Team members have a

121
good understanding of our customer’s business and organization” (t = -2.28, p = .02);
4.2 “Team members communicate proactively on issues related to our GAM activities”
(t = 1.84. p = .07) and 4.12 “Team members proactively cultivate new business
opportunities” (t = -1.73, p = .09). However, the p-values of two of them are above the
conventional level of .05.
Table 2 presents the results for the dependent variables as well as for two key control
variables. It indicates the mean difference between the ratings of the early and late
respondents and the respective t- and p-values.
Table 2: Assessment of nonresponse bias
Variable Mean difference t-value Sig.
(p-value)
Team tenure of respondents .010 .022 .982
Organizational tenure of respondents 2.059 1.544 .124
5.1 Strong and harmonious long-term customer relation. -.330 -2.730 .007
5.2 Customer satisfaction -.165 -1.455 .148
5.3 Customer value .060 .553 .581
5.4 Learning of skills and capabilities from customer rel. -.064 -.656 .512
5.5 Enhanced competitive position -.073 -.600 .549
5.6 Achievement of goals and objectives -.085 -.664 .508
5.7 Sales growth -.085 -.648 .518
5.8 Profitability -.127 -.965 .336
5.9 Share of wallet growth -.205 -1.605 .110
With the exception of item 5.1 “Our team is characterized by strong and harmonious
long-term relationships with global customers” (t = -2.73, p = .007), these variables do
not exhibit any significant differences. P-values range from .11 to .98. Hence, there is
no strong reason to believe that nonrespondents differ from respondents in terms of
their demographics or the performance of their teams. Overall, nonresponse bias does
not seem to be a concern.
122
5.2.2. Common method bias
Common method bias is of some concern because the data were collected from the
same respondents with the use of a single instrument. When two measures are
collected from same-source self-reports, any defect in that source may contaminate
both measures, presumably in the same fashion and in the same direction. As a result,
the two measures may exhibit a correlation that does not reflect an actual relationship
and may lead to erroneous conclusions (Podsakoff and Organ, 1986).
As discussed, the first step to prevent this bias was made during the study design. The
questionnaire items were arranged so that the dependent variables followed the
independent ones to prevent the possibility of consistency artifacts that leads to
common method variance. Guaranteeing anonymity to respondents was used as a tool
to reduce social desirability effects which are another source of common method
variance. Second, the possibility of a common method bias was checked with
Harman’s (1967) single-factor test using the procedure suggested by Podsakoff and
Organ (1986). The assumption of this test is that if a common method bias is present,
an unrotated factor analysis of all variables of interest will generate either a single
factor or a general factor that accounts for most of the covariance in the independent
and dependent variables. Following this technique, I entered all dependent and
independent variables in an unrotated factor analysis based on the principal
components method and found 14 distinct factors with eigenvalues greater than one.
The first factor explained 26% of the variance in the data, which is not high enough to
conclude that it captures the majority of the variance. Therefore, a substantial common
method bias is not evident in the data and should not be considered a threat.
5.3. Examination of the variables
After no bias was detected in the overall data set, the next step was to examine all
individual items for potential sources of concern. In the first place, I evaluated the data
set by looking for outliers. A careful examination of the frequencies and scatterplots of
all variables revealed that no outliers are present. Second, the distribution properties of
all variables were checked. Because many analytical methods assume that the used
123
variables are normally distributed, it is important to detect any nonnormal distributions
that might threaten the validity of such methods. For this purpose, the histograms for
all variables were reviewed as well as distribution indicators such as skewness and
kurtosis. The negative skewness indicators of the majority of items suggest that their
distribution is skewed to the left. However, almost all skewness values are within the
range of -1.00 to 1.00, and hence provide no strong indication of nonnormality. Only
item 2.1 “Team members vary widely in their areas of expertise” (Skewness = -1.15)
is just outside these boundaries but still well within the -5.00 to 5.00 boundaries of
concern for skewness. Similarly, most of the sample kurtosis are within or close to the
-1.00 to 1.00 range. Only item 2.2 “Team members have a variety of backgrounds and
experiences” (Kurtosis = 2.18) has kurtosis above the conventional cutoff point of 2.00
beyond which nonnormality becomes a concern. Thus, no strong indication of
nonnormal distributions is detected.
The third step was to examine the data for missing values. The average percentage of
missing values per item is 4.6% and no item has more than 12% of missing values,
which is a sign of no serious concern. However, in order to ensure more stable results
in the subsequent analyses, all missing values are replaced with the median, which is
an appropriate method given the distribution properties of the dataset and the relatively
low number of missing values. The key advantage of these imputations is that they
allow calculating modification indexes in AMOS (Arbuckle, 1997), which is very
important for the confirmatory factor analysis and the test of the structural path model.
Finally, the correlations among all items were examined. The correlation matrix in
Appendix G indicates that most of the variables are significantly correlated with each
other. However, the Cohen’s (1977) criteria, whereby correlations of .1 are considered
small, .3 medium and .5 large, indicate that large correlations (marked in bold) are
observed mainly among items from the same scale. This can be expected because these
items are used to measure the same construct and the high correlations provide some
initial support for the reliability of the measures.

124
5.4. Reliability and item analysis
The next step in the analysis is to evaluate the reliability of the scales used. Reliability
can be defined broadly as the degree to which measures are free from error and
therefore yield consistent results. As Peter (1979) notes, behavioral measures are
seldom totally reliable and valid but the degree of their validity and reliability should
be assessed if research is to be truly scientific. Reliability could be examined in terms
of stability and consistency of the measurement whereby stability is related to the
ability to reproduce measurement results at different points in time and consistency
refers to the reliability of alternative scales designed to measure the same characteristic
(McCullough and Best, 1979).
There are three basic methods of assessing the reliability of a measurement scale: test-
retest, internal consistency and alternative forms (Peter, 1979). The test-retest and the
alternative forms methods require that either the same or two different sets of items are
administered to the same objects at two different times. Since the nature of this study
makes these methods impossible to conduct, the internal consistency approach is the
most appropriate. It requires that the measurement scale is applied to subjects at one
point in time and subsets of items within the scale are then correlated. The two major
methods for assessing the internal consistency of an instrument are Cronbach’s (1951)
coefficient alpha and split-half reliability methods such as the Spearman-Brown
coefficient or the Guttman split-half coefficient. However, the results of the split-half
model are strongly influenced by the way the scale is split and it is less reliable when
the number of items in the two halves are not equal (Green and Salkind, 2005).
Because some of the constructs in the questionnaire are measured by only 3 items, this
method is not appropriate and the coefficient alpha is preferred.
As Churchill (1979: 68) suggests coefficient alpha „absolutely should be the first
measure one calculates to assess the quality of an instrument.” Specifically within
marketing research, it has been considered the most useful method for assessing the
reliability of measures (Peter, 1979). According to Nunnally and Bernstein’s (1994)
guidelines, in early stages of research modest coefficient alpha levels of .5 to .6 will
suffice and for basic research in general increasing reliability beyond .8 is unnecessary

12
5
Tab
le 3
: Var
iabl
es m
easu
res a
nd c
onst
ruct
rel
iabi
lity
estim
ates
Con
stru
cts a
nd it
ems
Sour
ce
Item
-tot
al
corr
elat
ion
Coe
ff.
alph
a G
oal a
nd r
ole
defin
ition
1.
1 O
ur G
AM
team
has
wel
l-def
ined
goa
ls a
nd o
bjec
tives
rela
ted
to o
ur g
loba
l cus
tom
ers.
1.2
Our
team
’s g
oals
and
obj
ectiv
es a
re w
ell a
ligne
d w
ith o
ur o
vera
ll co
rpor
ate
stra
tegi
es.
1.3
Team
mem
bers
’ ind
ivid
ual o
bjec
tives
and
targ
ets a
re li
nked
to G
AM
team
obj
ectiv
es.
1.4
The
role
s and
resp
onsi
bilit
ies o
f tea
m m
embe
rs a
re c
lear
ly d
efin
ed.
1.5
The
role
s and
resp
onsi
bilit
ies o
f tea
m m
embe
rs a
re u
nder
stoo
d ac
ross
the
orga
niza
tion.
T
eam
stru
ctur
e 1.
6 Th
e te
am h
as a
wor
kabl
e st
ruct
ure
and
clea
r rep
ortin
g lin
es.
1.7
The
team
is w
ell p
ositi
oned
and
inte
grat
ed in
the
over
all o
rgan
izat
iona
l stru
ctur
e of
our
com
pany
. 1.
8 Th
e te
am st
ruct
ure
prov
ides
app
ropr
iate
cro
ss-g
eogr
aphi
cal c
over
age
for o
ur c
usto
mer
s. 1.
9 Th
e te
am st
ruct
ure
prov
ides
app
ropr
iate
cro
ss-f
unct
iona
l cov
erag
e fo
r our
cus
tom
ers.
1.10
The
team
stru
ctur
e pr
ovid
es a
ppro
pria
te c
ross
-div
isio
nal c
over
age
for o
ur c
usto
mer
s. E
mpo
wer
men
t 1.
11 O
ur te
am h
as su
ffic
ient
aut
horit
y to
mak
e im
porta
nt d
ecis
ions
abo
ut o
ur c
usto
mer
bus
ines
s. 1.
12 O
ur te
am h
as su
ffic
ient
aut
horit
y to
cha
nge
orga
niza
tiona
l rou
tines
to a
chie
ve b
ette
r res
ults
for o
ur c
usto
mer
s.
1.13
Our
team
has
the
reso
urce
s req
uire
d to
inno
vate
and
dev
elop
our
glo
bal c
usto
mer
rela
tions
hips
con
tinuo
usly
. Si
ze a
dequ
acy
1.14
The
num
ber o
f peo
ple
in o
ur te
am is
suff
icie
nt fo
r our
cus
tom
er b
usin
ess t
o be
dev
elop
ed e
ffici
ently
. H
eter
ogen
eity
2.
1 T
eam
mem
bers
var
y w
idel
y in
thei
r are
as o
f exp
ertis
e.
2.2
Tea
m m
embe
rs h
ave
a va
riety
of b
ackg
roun
ds a
nd e
xper
ienc
es.
2.3
Tea
m m
embe
rs h
ave
com
plem
enta
ry sk
ills a
nd a
bilit
ies.
Ade
quat
e sk
ills
The
acco
unt/s
ales
man
ager
s on
our t
eam
2.
4 …
are
cap
able
of b
uild
ing
stro
ng a
nd tr
ustin
g re
latio
nshi
ps.
2.5
… h
ave
a go
od u
nder
stan
ding
of o
ur c
usto
mer
’s b
usin
ess a
nd o
rgan
izat
ion.
2.
6 …
hav
e a
good
und
erst
andi
ng o
f our
bus
ines
s and
the
inte
rnal
cap
abili
ties o
f our
com
pany
. 2.
7 …
are
abl
e to
thin
k an
d w
ork
in a
n in
terd
isci
plin
ary
way
. 2.
8… a
re a
ble
to c
oord
inat
e co
mpl
ex n
etw
orks
and
act
iviti
es.
2.9
… a
re a
ble
to th
ink
crea
tivel
y to
del
iver
val
ue to
the
cust
omer
. 2.
10 …
are
abl
e to
wor
k in
a d
iver
se a
nd m
ultic
ultu
ral e
nviro
nmen
t. 2.
11 …
em
ploy
stra
tegi
c, lo
ng-te
rm th
inki
ng.
2.12
… p
osse
ss p
ower
s of p
ersu
asio
n.
Lea
ders
hip
2.13
Our
team
lead
er h
as su
bsta
ntia
l inf
luen
ce in
the
orga
niza
tion
(eve
n w
hen
he/s
he h
as n
o fo
rmal
aut
horit
y).
2.14
Our
team
lead
er h
as a
stro
ng re
latio
nshi
p w
ith to
p m
anag
emen
t.
2.15
Our
team
lead
er is
abl
e to
mot
ivat
e te
am m
embe
rs a
nd c
reat
e sy
nerg
ies w
ithin
the
team
.
New
N
ew
Den
ison
et a
l. (1
996)
, Mat
hieu
et
al.
(200
6)
Coh
en e
t al.
(199
6)
Cam
pion
et a
l. (1
993)
N
ew
Gla
dste
in (1
984)
, Sc
ott (
1997
)
.559
.4
80
.547
.5
89
.424
.4
80
.532
.6
39
.666
.6
31
.616
.7
39
.496
.6
37
.661
.4
55
.692
.6
87
.515
.6
77
.706
.7
12
.575
.6
83
.637
.7
32
.709
.5
94
.755
.8
04
.776
.7
48
.893
.8
20

12
6
Top
man
agem
ent s
uppo
rt
3.1
Our
top
man
agem
ent i
s act
ivel
y in
volv
ed in
the
team
’s e
ffor
ts to
dev
elop
pro
fitab
le, l
ong-
term
rela
tions
hips
with
glo
bal c
usto
mer
s. 3.
2 O
ur to
p m
anag
emen
t is c
omm
itted
to d
eplo
ying
the
nece
ssar
y re
sour
ces t
o m
ake
our g
loba
l cus
tom
er o
pera
tions
succ
eed.
3.
3 O
ur to
p m
anag
emen
t pub
licly
pro
mot
es o
ur te
am’s
GA
M a
ctiv
ities
to o
ther
s in
the
orga
niza
tion.
R
ewar
ds a
nd in
cent
ives
3.
4 Te
am m
embe
rs’ c
ontri
butio
ns to
dev
elop
ing
glob
al c
usto
mer
s are
mea
sure
d in
a sy
stem
atic
and
tran
spar
ent m
anne
r. 3.
5 O
ur c
ompe
nsat
ion
syst
em p
rom
otes
glo
bal c
olla
bora
tion
by a
ppro
pria
tely
rew
ardi
ng c
ontri
butio
ns to
the
GA
M te
am.
3.6
Man
y pr
ofes
sion
al re
war
ds (e
.g.,
pay,
pro
mot
ions
) are
det
erm
ined
in la
rge
part
by te
am m
embe
rs’ p
erfo
rman
ce o
n th
e G
AM
team
. T
rain
ing
3.7
The
com
pany
pro
vide
s ade
quat
e gl
obal
selli
ng a
nd n
egot
iatio
n tra
inin
g fo
r our
team
. 3.
8 Th
e co
mpa
ny p
rovi
des a
dequ
ate
team
skill
s tra
inin
g fo
r our
team
(e.g
., co
mm
unic
atio
n, o
rgan
izat
ion,
inte
rper
sona
l).
3.9
The
com
pany
pro
vide
s ade
quat
e te
chni
cal t
rain
ing
for o
ur te
am.
Ext
erna
l com
mun
icat
ion
and
colla
bora
tion
4.1
Our
team
regu
larly
exc
hang
es b
est p
ract
ices
and
mar
ket k
now
ledg
e w
ith o
ther
GA
M te
ams.
4.2
Team
mem
bers
com
mun
icat
e pr
oact
ivel
y on
issu
es re
late
d to
our
GA
M a
ctiv
ities
acr
oss b
ound
arie
s and
hie
rarc
hica
l lev
els i
n th
e en
tire
orga
niza
tion.
4.
3 O
ur te
am h
as d
iffic
ulty
obt
aini
ng su
ppor
t fro
m o
ther
par
ts o
f the
org
aniz
atio
n. (r
ever
se c
oded
) * re
mov
ed a
fter r
elia
bilit
y an
alys
is
Inte
rnal
com
mun
icat
ion
and
colla
bora
tion
4.4
Com
mun
icat
ion
in th
e te
am is
eff
ectiv
e, d
espi
te th
e ge
ogra
phic
al d
ista
nce
of te
am m
embe
rs.
4.5
Team
mem
bers
kee
p on
e an
othe
r upd
ated
abo
ut th
eir a
ctiv
ities
and
key
issu
es a
ffec
ting
the
busi
ness
. 4.
6 Te
am m
embe
rs a
re g
ood
at c
oord
inat
ing
thei
r eff
orts
to se
rve
the
cust
omer
eff
icie
ntly
. 4.
7 Te
am m
embe
rs c
olla
bora
te to
ach
ieve
our
glo
bal g
oals
. C
onfli
ct m
anag
emen
t 4.
8 D
ispu
tes b
etw
een
the
diff
eren
t uni
ts re
pres
ente
d on
our
team
mak
e it
diff
icul
t to
do o
ur w
ork.
(rev
erse
cod
ed)
4.9
Our
team
is a
ble
to id
entif
y an
d re
solv
e co
nflic
ts in
a ti
mel
y an
d ef
fect
ive
man
ner.
4.10
Our
team
can
eas
ily se
nd p
robl
ems u
p th
e ch
ain
of c
omm
and
(esc
alat
e to
seni
or m
anag
emen
t) w
hen
they
can
not b
e re
solv
ed w
ithin
the
team
. 4.
11 T
he n
egat
ive
polit
ics w
ithin
the
team
are
min
imal
. Pr
oact
iven
ess
4.12
Tea
m m
embe
rs p
roac
tivel
y cu
ltiva
te n
ew b
usin
ess o
ppor
tuni
ties.
4.13
Our
team
is n
ot a
frai
d to
cha
lleng
e th
e st
atus
quo
to im
prov
e ou
r cus
tom
er re
latio
nshi
ps.
4.14
The
team
is a
pow
erfu
l for
ce fo
r con
stru
ctiv
e ch
ange
in th
e or
gani
zatio
n.
Rel
atio
nal a
nd m
arke
t per
form
ance
5.
1 O
ur te
am is
cha
ract
eriz
ed b
y st
rong
and
har
mon
ious
long
-term
rela
tions
hips
with
glo
bal c
usto
mer
s. 5.
2 O
ur c
usto
mer
s are
satis
fied
with
the
over
all p
erfo
rman
ce o
f our
team
. 5.
3 O
ur te
am p
rovi
des r
eal v
alue
to o
ur c
usto
mer
s. 5.
4 O
ur te
am h
as su
cces
sful
ly le
arne
d so
me
criti
cal s
kills
or c
apab
ilitie
s fro
m o
ur c
usto
mer
rela
tions
hips
. 5.
5 O
ur c
ompa
ny’s
com
petit
ive
posi
tion
has b
een
enha
nced
due
to o
ur te
am’s
GA
M a
chie
vem
ents
. 5.
6 O
ur te
am a
chie
ves i
ts g
oals
and
obj
ectiv
es.
Fina
ncia
l per
form
ance
H
ow h
as y
our t
eam
, ove
r the
pas
t thr
ee y
ears
, per
form
ed w
ith re
spec
t to
5.7
… g
row
th in
sale
s?
5.8
… p
rofit
abili
ty?
5.9
… g
row
th in
the
shar
e of
you
r glo
bal c
usto
mer
s’ w
alle
ts?
Tow
nsen
d et
al.
(200
4), S
cott
(199
7)
New
C
ampi
on e
t al.
(199
3)
New
B
unde
rson
and
Su
tclif
fe (2
002)
, C
ampi
on e
t al.
(199
3)
Den
ison
et a
l. (1
996)
B
atem
an a
nd
Cra
nt (1
993)
, K
irkm
an a
nd
Ros
en (1
997)
B
irkin
shaw
et a
l. (2
001)
, Hom
burg
et
al.
(200
2)
Birk
insh
aw e
t al.
(200
1), H
ombu
rg
et a
l. (2
002)
.642
.6
81
.661
.6
06
.712
.6
59
.600
.7
27
.568
.3
70/.5
54*
.532
/.554
* .1
35
.596
.6
64
.564
.5
65
.365
.4
83
.383
.4
66
.517
.5
85
.508
.6
76
.718
.7
30
.623
.6
65
.629
.7
69
.645
.6
42
.811
.8
10
.790
.5
24/
.713
* .7
88
.651
.7
21
.873
.8
26
* V
alue
s afte
r que
stio
n 4.
3 w
as re
mov
ed fr
om th
e sc
ale

127
because at that level measurement error has a very little impact on correlations. As a
result, coefficients of .7 or above are usually considered satisfactory.
Table 3 reports the results of the reliability analysis of all constructs including the
coefficient alpha and the item-total correlation that describes the extent to which each
item is correlated to its own scale. In general, the Cronbach’s alphas for all
independent constructs meet the minimum recommended level of .7 with the exception
of conflict management which is slightly lower but still satisfactory (α = .65). The
coefficients of the other independent constructs range from .71 to .89. The two
performance constructs are reliable as well, as indicated by their coefficient alphas of
.87 and .83, respectively. Only one item (4.3 “Our team has difficulty obtaining
support from other parts of the organization”) had a low item-total correlation (.135)
resulting in a coefficient alpha below the recommended level (α = .52) and was
considered for elimination from the scale (Churchill, 1979). Its elimination improved
the internal reliability of the measure for external communication and collaboration to
.71.
5.5. Results of the exploratory factor analysis
As suggested by Churchill (1979) and Anderson (1987), the next step after evaluating
the internal consistency of the scales is to assess the validity of all constructs, usually
through factor analysis. Validity refers to the degree to which instruments truly
measure the constructs which they are intended to measure (Peter, 1979) and factor
analysis is an appropriate method for assessing construct validity when an instrument
consists of multiple questions that measure different constructs (Nunnally and
Bernstein, 1994).
Following the procedure employed by Denison et al. (1996) to confirm their three-
domain model of cross-functional team effectiveness, the factor analysis was
conducted in two steps. First, exploratory factor analysis was used to examine the
acceptability of the 16 individual constructs suggested by the literature and by the
qualitative analysis and to determine how the item pool relates to the developed

128
constructs. In a second step, I conducted confirmatory factor analysis to further refine
these results and to determine if the derived factors fit in the four second-order factors
of team design, organizational context, processes and performance. Starting with an
exploratory rather than a confirmatory approach was justified by the exploratory
nature of this study, the lack of developed theory and the relative novelty of some
measures (Thompson, 2004) as well as the large number of items (Bentler and Chou,
1987).
A separate EFA for each of the four second-order domains was chosen as opposed to
EFA on all items for two main reasons. First, a single EFA on all items would require
a significantly larger sample size to compensate for the large number of items.
Gorsuch (1983: 332) suggests that “an absolute minimum ratio is five individuals to
every variable” and Nunnally and Bernstein (1994) recommends that for any kind of
multivariate analysis, there should be at least 10 times as many subjects as items. A
sample size of 273 data points and an item pool of 52 independent and 9 dependent
variables results in a subject-to-item ratio that is much lower than the recommended
value and the ratio in other studies that use this method (e.g. Campion et al., 1993).
This entails the risk of producing unreliable estimates in a single EFA. Second, EFA
per domain is legitimate when the domains are clearly delineated. Conceptually
distinct domains provide a considerable degree of assurance that the items from one
domain do not relate to, and therefore will not load on, another domain. Thus, they can
be separated for the analysis to improve the subject-to-item ratio and increase the
robustness of the results. As the framework is based on extensive review of previous
studies that consistently distinguish between the four domains, the analysis was based
on this method and followed the procedure of Denison et al. (1996).
All EFA used the principle components extraction method with Varimax rotation.
Items were selected for inclusion in a factor based on the Kaiser (1958) criterion of
loading above .50. Items with loading below this cutoff point were excluded from
further analysis. Table 4 presents the results from the EFA of the team design domain.

129
Table 4: Results of exploratory factor analysis of the team design domain
Constructs and items 1 2 3 4 5 6 Goals and roles (α = .777)
1.1 Our GAM team has well-defined goals and objectives related to our global customers.
1.2 Our team’s goals and objectives are well aligned with our overall corporate strategies.
1.3 Team members’ individual objectives and targets are linked to GAM team objectives.
1.4 The roles and responsibilities of team members are clearly defined.1.6 The team has a workable structure and clear reporting lines.
Customer coverage (α = .714) 1.8 The team structure provides appropriate cross-geographical
coverage for our customers. 1.9 The team structure provides appropriate cross-functional
coverage for our customers. 1.10 The team structure provides appropriate cross-divisional coverage
for our customers. Empowerment (α = .776)
1.11 Our team has sufficient authority to make important decisions about our customer business.
1.12 Our team has sufficient authority to change organizational routines to achieve better results for our customers.
1.13 Our team has the resources required to innovate and develop our global customer relationships continuously.
Heterogeneity (α = .748) 2.1 Team members vary widely in their areas of expertise. 2.2 Team members have a variety of backgrounds and experiences. 2.3 Team members have complementary skills and abilities.
Adequate skills (α = .893) The account/sales managers on our team 2.4 … are capable of building strong and trusting relationships. 2.5 … have a good understanding of our customer’s business and
organization. 2.6 … have a good understanding of our business and the internal
capabilities of our company. 2.7 … are able to think and work in an interdisciplinary way. 2.8 … are able to coordinate complex networks and activities. 2.9 … are able to think creatively to deliver value to the customer. 2.10 … are able to work in a diverse and multicultural environment. 2.11 … employ strategic, long-term thinking. 2.12 … possess powers of persuasion.
Leadership (α = .820) 2.13 Our team leader has substantial influence in the organization
(even when he/she has no formal authority). 2.14 Our team leader has a strong relationship with top management. 2.15 Our team leader is able to motivate team members and create
synergies within the team. Eigenvalues Variance explained by factor after Varimax rotation Total variance explained
.763
.698
.716
.701.628
.401
.172
.073
.209
.083
.222
.067 -.010.191
.144
.130
.066 .011 .072 .067 .053 .126 .168
.167
.096 .206
2.80911.5%65.2%
.031
.118
.061
.092 .269
.707
.822
.818
.175
.135
.214
.001
.039
.106
-.047 .055
.185
.195 .069 .053 .176 .058 .019
.069
.093 .025
1.565 8.4%
.130
.202
.168
-.032 .044
.043
.214
.259
.733
.856
.646
-.025 .001 .234
.077 -.061
-.137
.155 .166 .006 .063 .258 .251
.216
.112 .172
1.673 8.6%
.047
.058
.140
.059 -.106
-.054
.118
.061
-.045
.022
.144
.867
.859
.579
.012 -.062
-.108
.028 .124 .143 .192 .078 .167
.123
.074 .077
1.156 7.9%
.193
.000
.034
.176 .126
.124
.151
.203
.121
.182
.131
-.004.154 .322
.733
.765
.612
.749
.769
.802
.684
.726
.651
.208
.107
.233
7.89719.9%
.070
.030
.121
.122 .159
.176
.027
.031
.261
.139
.119
.150
.049
.023
.329
.152
.297
.011
.064
.032
.022
.049
.123
.799
.852
.693
1.8608.9%
The results reveal six factors with eigenvalues greater than 1.0, which correspond
directly to the developed GAM team design constructs. Because the size adequacy

130
variable is measured by a single item, it is not included in this analysis. All items
measuring GAM team empowerment, heterogeneity, skills and leadership load on their
own factors and have loadings above the cutoff point of .50. However, some of the
items from the role and goal definition and the team structure scales did not load as
expected. The item 1.6 “The team has a workable structure and clear reporting lines”
loads on the first factor as opposed to the team structure factor. A possible explanation
is that reporting lines and structural arrangements within the team are more closely
related to the division of roles and responsibilities that is captured by the roles and
goals construct. The items 1.5 “The roles and responsibilities of team members are
understood across the organization” and 1.7 “The team is well positioned and
integrated in the overall organizational structure” cross-load on the first two factors
and have loadings below .50. Consequently, they had to be removed from the analysis.
Since all the remaining items in the structure factor relate to the extent that the team
structure provides adequate customer coverage, this construct is named customer
coverage to better reflect its content. Despite the changes in the first two scales, they
remain reliable with Cronbach’s alphas of .78 and .71 respectively. The six factors
explain 65.2% of the total variance with skills having the largest share (19.9%)
followed by roles and goals (11.5%) and leadership (8.9%). In summary, these results
provide satisfactory support for the validity of the six team design dimensions.

131
Table 5: Results of exploratory factor analysis of the organizational context domain
Constructs and items 1 2 3 Top management support (α = .811)
3.1 Our top management is actively involved in the team’s efforts to develop profitable, long-term relationships with global customers.
3.2 Our top management is committed to deploying the necessary resources to make our global customer operations succeed.
3.3 Our top management publicly promotes our team’s GAM activities to others in the organization.
Rewards and incentives (α = .810) 3.4 Team members’ contributions to developing global customers are
measured in a systematic and transparent manner. 3.5 Our compensation system promotes global collaboration by
appropriately rewarding contributions to the GAM team. 3.6 Many professional rewards (e.g., pay, promotions) are determined in
large part by team members’ performance on the GAM team. Training (α = .790)
3.7 The company provides adequate global selling and negotiation training for our team.
3.8 The company provides adequate team skills training for our team (e.g., communication, organization, interpersonal).
3.9 The company provides adequate technical training for our team. Eigenvalues Variance explained by factor after Varimax rotation Total variance explained
.817
.830
.800
.377
.260
.240
.090
.138
.164
4.255 25.8% 72.9%
.235
.236
.307
.676
.825
.804
.434
.230
-.056
1.404 24.8%
.145
.163
.113
.133
.153
.145
.690
.844
.837
.904 22.4%
Table 5 presents the results from the EFA of the organizational context domain. The
initial solution based on the eigenvalues-greater-than-one rule yielded only two factors
whereby all top management support and rewards items loaded on the same factor.
However, since all theoretical and conceptual arguments as well as the qualitative
research findings point to a clear distinction between these two constructs, imposing a
three-factor EFA solution is acceptable (Thompson, 2004: 32). The results of this
analysis show that all items load on their own factor and have loadings above the .50
level, which supports the separation of top management support and rewards and the
validity of the three constructs. These three factors explain 72.9% of the total variance
in this domain.

132
Table 6 presents the results from the EFA of the team processes domain.
Table 6: Results of exploratory factor analysis of the team processes domain
Constructs and items 1 2 3 Communication and collaboration (α = .823)
4.1 Our team regularly exchanges best practices and market knowledge with other GAM teams.
4.2 Team members communicate proactively on issues related to our GAM activities across boundaries and hierarchical levels in the entire organiz.
4.4 Communication in the team is effective, despite the geographical distance of team members.
4.5 Team members keep one another updated about their activities and key issues affecting the business.
4.6 Team members are good at coordinating their efforts to serve the customer efficiently.
4.7 Team members collaborate to achieve our global goals. Conflict management (α = .602)
4.8 Disputes between the different units represented on our team make it difficult to do our work. (reverse coded)
4.9 Our team is able to identify and resolve conflicts in a timely and effective manner.
4.11 The negative politics within the team are minimal. Proactiveness (α = .721)
4.12 Team members proactively cultivate new business opportunities. 4.13 Our team is not afraid to challenge the status quo to improve our
customer relationships. 4.14 The team is a powerful force for constructive change in the organization.
Eigenvalues Variance explained by factor after Varimax rotation Total variance explained
.592
.707
.742
.810
.631
.642
.050
.250
.125
.245 .090
.344
4.600 26.1% 58.1%
-.055
.098
.154
.115
.236
.208
.802
.631
.701
.098 .245
.127
1.008 14.7%
.259
.291
.043
.041
.287
.287
-.025
.268
.274
.737 .795
.656
1.36817.3%
The results indicate three factors with eigenvalues greater than 1.0. All communication
and collaboration variables load on the same factor, contrary to the expected
distinction between internal and external collaboration. To further explore this result,
the six communication and collaboration items were entered in a separate factor
analysis independent of the other process variables, which yielded only one factor as
well. Consequently, these items are combined into one more general construct named
communication and collaboration. The item 4.10 “Our team can easily send problems
up the chain of command (escalate to senior management) when they cannot be
resolved within the team” has a loading below the cutoff point and had to be removed
from the conflict management scale. The three extracted factors explain 58.1% of the
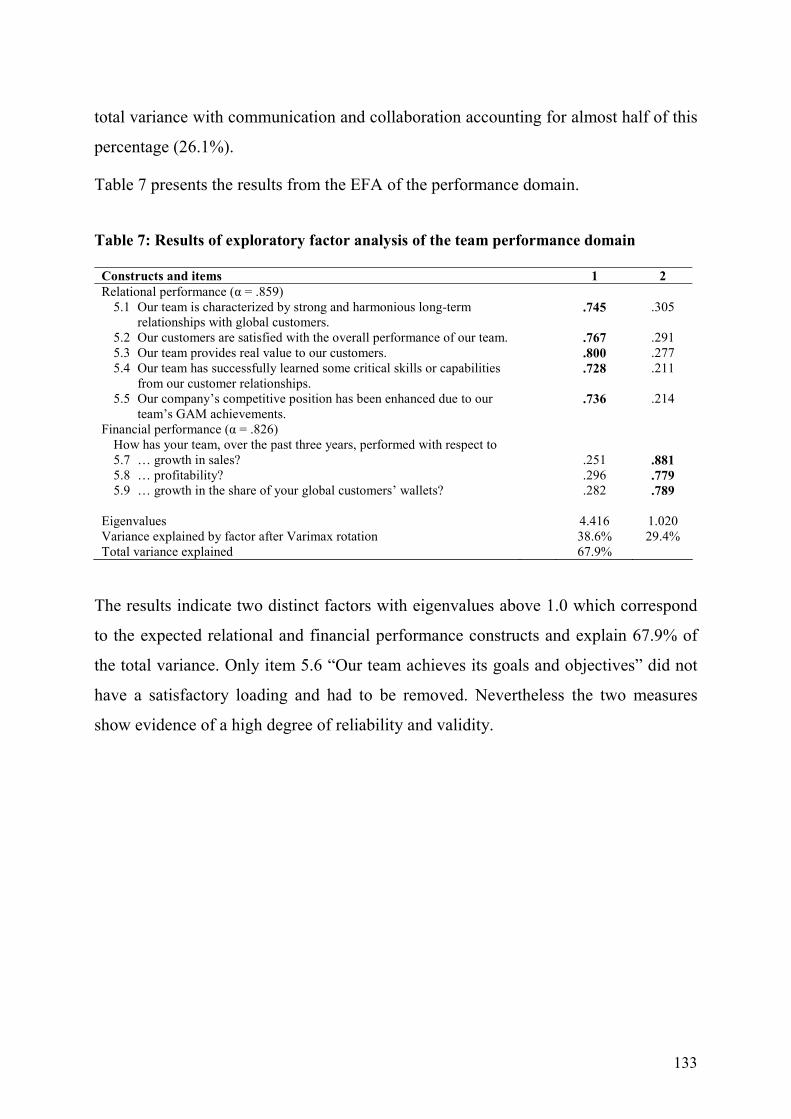
133
total variance with communication and collaboration accounting for almost half of this
percentage (26.1%).
Table 7 presents the results from the EFA of the performance domain.
Table 7: Results of exploratory factor analysis of the team performance domain
Constructs and items 1 2 Relational performance (α = .859)
5.1 Our team is characterized by strong and harmonious long-term relationships with global customers.
5.2 Our customers are satisfied with the overall performance of our team. 5.3 Our team provides real value to our customers. 5.4 Our team has successfully learned some critical skills or capabilities
from our customer relationships. 5.5 Our company’s competitive position has been enhanced due to our
team’s GAM achievements. Financial performance (α = .826)
How has your team, over the past three years, performed with respect to 5.7 … growth in sales? 5.8 … profitability? 5.9 … growth in the share of your global customers’ wallets?
Eigenvalues Variance explained by factor after Varimax rotation Total variance explained
.745
.767 .800 .728
.736
.251
.296
.282
4.416 38.6% 67.9%
.305
.291 .277 .211
.214
.881
.779
.789
1.020 29.4%
The results indicate two distinct factors with eigenvalues above 1.0 which correspond
to the expected relational and financial performance constructs and explain 67.9% of
the total variance. Only item 5.6 “Our team achieves its goals and objectives” did not
have a satisfactory loading and had to be removed. Nevertheless the two measures
show evidence of a high degree of reliability and validity.

134
Table 8: Means, standard deviations and correlations of the constructs
Mean SD 1 2 3 4 5 6 7 8 9 10 11 12 13 14
GAM team design1) Goals and roles 3.60 .682) Customer coverage 3.50 .78 .463) Empowerment 3.09 .87 .39 .474) Adequate size 3.20 1.05 .21 .41 .355) Heterogeneity 3.86 .61 .22 .19 .22 .106) Adequate skills 3.86 .53 .32 .37 .37 .16 .307) Leadership 3.81 .70 .36 .23 .35 .12 .24 .40
Organizational context8) Top management support 3.57 .76 .43 .38 .49 .30 .26 .31 .419) Rewards and incentives 2.64 .81 .40 .27 .47 .17 .24 .38 .39 .5810) Training 3.37 .77 .28 .21 .21 .19 .18 .27 .27 .31 .37
GAM team processes11) Communication/ collaboration 3.50 .59 .46 .38 .32 .19 .21 .44 .39 .48 .42 .3012) Conflict management 3.66 .60 .22 .32 .35 .19 .12 .36 .32 .27 .16 .16 .3413) Proactiveness 3.66 .66 .40 .41 .42 .18 .29 .56 .43 .40 .41 .20 .50 .37
GAM team performance14) Relational performance 3.86 .61 .39 .41 .44 .24 .21 .49 .49 .48 .44 .27 .49 .41 .6415) Financial performance 3.69 .72 .33 .21 .23 .03 .08 .33 .41 .35 .34 .16 .36 .29 .46 .58
Note: Correlations of .16 are significant at the .05 level (two-tailed). Large correlations (> .50) are
indicated in bold.
Table 8 reports the means, standard deviations and correlations of the factors derived
through EFA. Many of the correlations are significant. Nevertheless the lack of large
correlations of .50 or above (Cohen, 1977) among the constructs per domain provides
some additional support for the independence of the identified dimensions.
5.6. Results of the confirmatory factor analysis
Following the initial support for the validity of the proposed constructs, the next step
was to provide a confirmatory measurement through CFA. Unlike EFA, CFA allows
constructs to intercorrelate freely and helps to estimate relations with higher-order
constructs (Thompson, 2004), which is needed to determine how the dimensions fit in
the four domains. Moreover, CFA models are the critical starting point in structural
equation modeling. As Anderson and Gerbing (1988) argue, model-testing can be
thought of as the analysis of two distinct models: 1) a confirmatory measurement, or

135
factor analysis, model that specifies the relations of the observed measures to their
posited underlying constructs and 2) a confirmatory structural model that specifies the
causal relations of the constructs to one another. Following the recommendations for a
two-step approach in which the measurement model is estimated separately prior to the
simultaneous estimation of the measurement and structural submodels (Anderson and
Gerbing, 1988; Fornell and Yi, 1992), I conducted CFA first and then tested the full
structural model. This approach is consistent also with other studies in the marketing
area (e.g. Townsend et al., 2004; Zou and Cavusgil, 2002)
Unlike EFA which does not require the researcher to have or to declare any specific
expectations about the number and the nature of underlying factors, CFA explicitly
and directly requires expectations regarding the number of factors, the variables which
reflect given factors and the correlations among factors (Thompson, 2004). Therefore,
to increase precision, the CFA was based on the results of the EFA. Similarly to EFA,
CFA was conducted per domain because sample size is of even greater concern in this
type of analysis (Jackson, 2001; MacCallum et al., 1996). All measured items were
modeled as observed variables and all first- and second-order constructs were modeled
as latent variables. The CFA was performed using the maximum likelihood method in
AMOS 5.0.
The analysis of the CFA results of all domains follows the procedure recommended by
Bagozzi and Yi (1988). First, the output is screened to detect any anomalies or
problems in the minimization process. This screening showed that in all cases the
estimation process converged properly. Second, to obtain a comprehensive assessment
of the model fit, a number of fit statistics are examined as recommended in the
literature (Hu and Bentler, 1999). Third, the internal structure of the models is
examined and the convergent and discriminant validity of the dimensions are tested
(Campbell and Fiske, 1959).
The team design domain required some modifications due to the large number of
variables, which are briefly discussed before presenting the overall CFA results.
Before pooling all constructs together to form the second-order factor team design, I
tested if instead the constructs split into two second-order factors of team organization

136
and team composition as suggested in some studies (Gladstein, 1984). These two
factors have a strong relation between each other (covariance coefficient = .81) and the
model does not fit very well (RMSEA = .06), which is an indication for a single
second-order factor that captures the entire team design domain.
The examination of the parameter estimates and variances as well as the residuals and
modification indexes of the initial CFA model of this domain does not reveal any
irregular or insignificant results. However, several items are not very strongly
correlated with their constructs and are removed from further analysis for two reasons.
First, this modification improves the validity of the scales and has been justified in
studies of similar nature (Gladstein, 1984). Second, actions to decrease the number of
measures are often necessary in complex models with a large number of indicators and
first-order factors such as the model of this domain As Cohen et al. (1996) observe, in
previous studies using structural equation models, researchers attempting to model
relationships among a large number of variables have found it difficult to fit such
models even to predictions with strong theoretical support. As a result, the elimination
of the least correlated items is recommended to obtain an acceptable model (Arbuckle,
1997).
The indicators that do not have a strong correlation with their respective constructs and
had to be removed are 1.3 “Team members’ individual objectives and targets are
linked to GAM team objectives”, 2.3 “Team members have complementary skills and
abilities”, 2.6 “The account/sales managers on our team have a good understanding of
our business and the internal capabilities of our company”, 2.8 “The account/sales
managers on our team are able to coordinate complex networks and activities”, 2.15
“Our team leader is able to motivate team members and create synergies within the
team”. Surprisingly, the size indicator does not load well on the second-order factor
and is not included in subsequent analysis either.
Table 9 presents the results of the second-order CFA of all domains. Because the
results of the first-order factors to a large extent confirm the EFA results, with the
exceptions described above, they are reported in Appendix H to avoid a lengthy and
repetitive discussion here. It suffices to say that all indicators have positive and

137
significant loadings on their posited constructs. The two performance constructs are
not pooled in a second-order factor because the goal is to understand the impact of the
team dimensions on each of these two distinct types of performance (Hypotheses 3 and
4) as well as their interrelation (Hypothesis 5). The results also show that the two
factors have covariance of only .28, indicating that a second-order factor should not be
extracted (Thompson, 2004: 145).
Table 9: Results of the second-order confirmatory factor analysis
Variables Standardizedloading t-value Fit statistics
Team design Goals and roles Customer coverage Empowerment Heterogeneity Adequate skills Leadership
Organizational Context
Top management support Rewards and incentives Training
Team processes
Communication and collaboration Conflict management Proactiveness
Performance Relational performance
5.1 Long-term relationships 5.2 Customer satisfaction 5.3 Customer value 5.4 Learning 5.5 Competitive position
Financial performance 5.7 Sales growth 5.8 Profitability 5.9 Share of wallet growth
.660 .690 .710 .273 .621 .515
.746
.938
.486
.836
.750
.813
.737
.763
.778
.673
.672
.849 .726 .739
5.731 6.393
- 2.534 6.007 5.855
5.207 4.641
-
5.818 5.433
- -
11.73511.95310.39010.371
-
11.74411.930
χ²/df RMSEA RMR CFI NFI
χ²/df RMSEA RMR CFI NFI
χ²/df RMSEA RMR CFI NFI
χ²/df RMSEA RMR CFI NFI
1.587 .046 .037 .952 .883
1.745 .052 .038 .980
.955
1.356 .036 .029 .980 .929
1.158 .024 .016 .997 .976
Notes: All factor loadings are significant at the .01 confidence level. - indicates a fixed parameter.

138
The fit statistics of the models of all four domains indicate a very good fit with the
data. The first assessed fit indicator is the chi-square/ degrees of freedom ratio (χ²/df)
and all models have values below the maximum acceptable cutoff point of 2.0.
Although the χ² and the χ²/df statistics are frequently reported in academic
publications, they have often been criticized for using the unrealistic hypothesis-
testing assumption that a model fits exactly the data (Cudeck and Browne, 1983) and
for their dependence on the sample size (Bentler and Bonnett, 1980). Therefore, four
other indexes are considered of higher importance and examined thoroughly – the
root-mean-square error of approximation RMSEA (Steiger, 1990), the root-mean-
square residual RMR (Jöreskog and Sörbom, 1981), the comparative fit index CFI
(Bentler, 1990) and the normed fit index NFI (Bentler and Bonnett, 1980). The
RMSEA indexes for the four models equal .046, .052, .036 and .024 respectively, and
therefore, meet the criteria of Browne and Cudeck (1993) who suggest that a value
below .05 indicates close fit and that values up to .08 are reasonable. The RMR values
are respectively .037, .038, .029 and .016 and below the maximum tolerable level of
.08. CFI equals .952, .980, .980 and .997, which is well above the recommended
minimum value of .90. Finally, the NFI indexes are equal to .883, .955, .929 and .976
respectively and compare well to the recommended minimum value of .90 for a good
model fit.
Next, the convergent validity, or the extent to which the factors within a domain are
correlated, was assessed by checking the internal structure of the models, i.e. factor
loadings, variances and modification coefficients. Appendix H and Table 9 show that
the coefficients linking the indicators with their latent constructs are all significant at
the .01 level (t-values ranging from 3.376 to 12.815). In addition, the variance
estimates are all significantly greater than zero. Similarly, the loadings of all first-order
constructs on the second-order factors are also positive and significant at the .01
significance level (t-values from 2.534 to 6.393). Also, with the exception of
heterogeneity, all loadings are high in magnitude. The modification indexes did not
indicate that any respecifications are needed. As a result, the CFA models of the four
domains present satisfactory convergent validity (Anderson, 1987).

139
Finally, the discriminant validity was tested to assess to what extent the factors are
unique. The analysis follows the procedure described by Bagozzi and Phillips (1982)
and Bagozzi et al. (1991). The correlations between each pair of first-order factors
within each domain were constrained to equal 1 in a series of consecutive CFAs. In
each case, the χ2 statistic of the constrained model was compared to the χ2 of the initial
model with no constraints. The premise is that a better fit (i.e., significantly lower χ2
value) for the unconstrained model would indicate that the constructs whose
correlations are constrained to unity are not perfectly correlated. Therefore,
discriminant validity is achieved and these constructs can be considered distinct, or
unique.
Table 10 presents the results of this analysis, indicating the χ2 value for the
unconstrained model and the models of each constrained pair. In all cases, the χ2 value
increases significantly when factors are constrained suggesting that all measures
possess discriminant validity. Moreover, whereas in most of the unconstrained models
the χ2 statistic is not significant at the .01 level, in all constrained models the p-value is
below .01 indicating a less than adequate model fit. In summary, the CFA models fit
the data adequately and there is evidence that all factors possess sufficient convergent
and discriminant validity.

140
Table 10: Results of discriminant validity tests
Models χ2 p-value Team design
Unconstrained model Goals and roles ↔ Customer coverage Goals and roles ↔ Empowerment Goals and roles ↔ Heterogeneity Goals and roles ↔ Skills Goals and roles ↔ Leadership Customer coverage ↔ Empowerment Customer coverage ↔ Heterogeneity Customer coverage ↔ Skills Customer coverage ↔ Leadership Empowerment ↔ Heterogeneity Empowerment ↔ Skills Empowerment ↔ Leadership Heterogeneity ↔ Skills Heterogeneity ↔ Leadership Skills ↔ Leadership
Organizational context
Unconstrained model Top management support ↔ Rewards/incentives Top management support ↔ Training Rewards/incentives ↔ Training
Team processes
Unconstrained model Communication/collaboration ↔ Conflict management Communication/collaboration ↔ Proactiveness Conflict management ↔ Proactiveness
Team performance
Unconstrained model Relational performance ↔ Financial performance
285.67 444.33 441.20 419.75 473.95 367.87 338.67 416.78 403.32 377.99 412.49 402.30 350.14 448.33 396.48 397.30
41.87 103.20 170.12 153.64
66.47 224.83 162.26 183.50
22.01 114.65
.000 .000 .000 .000 .000 .000 .000 .000 .000 .000 .000 .000 .000 .000 .000 .000
.013
.000
.000
.000
.049
.000
.000
.000
.284
.000
Note: ↔ indicates the pair of factors whose correlation was constrained to equal 1

141
5.7. Test of the structural path model
Structural equation modeling (SEM) has been widely used in the marketing and
consumer behavior research because it offers a number of advantages over other
methods. First, by explicitly taking into account the inherent imperfections of
behavioral science data, SEM allows to assess and correct unreliable measures when
multiple indicators of each construct are available. Second, the key advantage of SEM
is that it makes it possible to investigate comprehensive theoretical frameworks in
which the effects of constructs are manifested across multiple levels of variables
through direct, indirect and bi-directional paths of influence (Baumgartner and
Homburg, 1996). Because the model involves a number of such relations, which
would be hard to test with other methods such as regressions or correlations, this
method was selected for testing the hypothesized links. This approach is consistent
also with a wide range of studies that have tested various teamwork models (e.g.,
Ancona and Caldwell, 1992b; Gladstein, 1984; Mathieu et al., 2006).
5.7.1. Results of the model test
Following the purification of the measurement model through CFA, the complete
structural path model was tested using the maximum likelihood procedure in AMOS.
The full model included the structural model as well as the multiple indicators of all
first- and second-order constructs obtained in the previous stages. In addition, an
attempt was made to model the control variables in order to account for the differences
among the six companies and among the respondents. However, the employed method
of structural equation modeling and the AMOS software do not allow for the
introduction of control variables, and therefore, these variables were not included in
the analysis. This represents a trade-off that had to be accepted in order to benefit from
the significant advantages of the SEM method.
In the first step, the model with the initially posited relationships among the domains
(Figure 5) was tested. Although the coefficients were positive and significant, with the
exception of the processes - financial performance link, the fit statistics (χ²/df = 1.575,
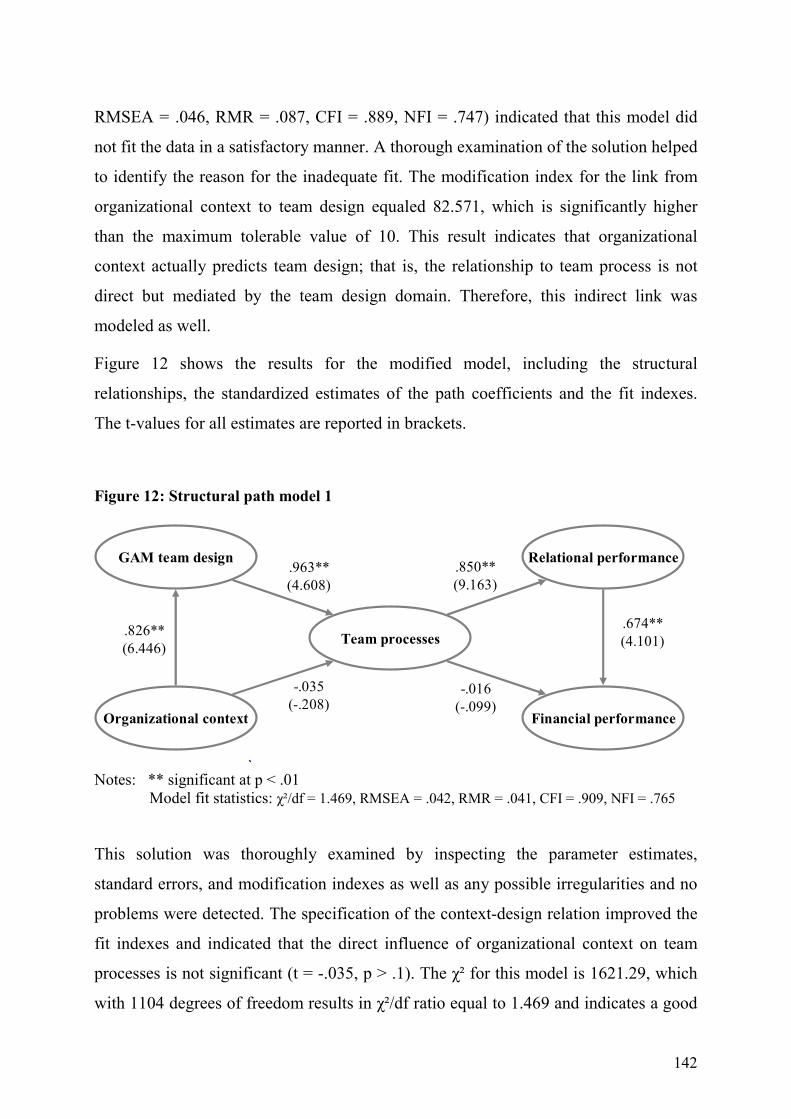
142
RMSEA = .046, RMR = .087, CFI = .889, NFI = .747) indicated that this model did
not fit the data in a satisfactory manner. A thorough examination of the solution helped
to identify the reason for the inadequate fit. The modification index for the link from
organizational context to team design equaled 82.571, which is significantly higher
than the maximum tolerable value of 10. This result indicates that organizational
context actually predicts team design; that is, the relationship to team process is not
direct but mediated by the team design domain. Therefore, this indirect link was
modeled as well.
Figure 12 shows the results for the modified model, including the structural
relationships, the standardized estimates of the path coefficients and the fit indexes.
The t-values for all estimates are reported in brackets.
Figure 12: Structural path model 1
Notes: ** significant at p < .01 Model fit statistics: χ²/df = 1.469, RMSEA = .042, RMR = .041, CFI = .909, NFI = .765
This solution was thoroughly examined by inspecting the parameter estimates,
standard errors, and modification indexes as well as any possible irregularities and no
problems were detected. The specification of the context-design relation improved the
fit indexes and indicated that the direct influence of organizational context on team
processes is not significant (t = -.035, p > .1). The χ² for this model is 1621.29, which
with 1104 degrees of freedom results in χ²/df ratio equal to 1.469 and indicates a good
.826**(6.446)
Organizational context
GAM team design
Team processes
Relational performance
Financial performance
-.035(-.208)
.963**(4.608)
.850**(9.163)
-.016(-.099)
.674**(4.101)

143
fit. The other fit indexes are respectively RMSEA = .042, RMR = .041, CFI = .909,
NFI = .765. Given the relatively complex nature of the model, which includes a large
number of indicators and three second-order factors, these indexes suggest a
satisfactory fit (Bollen, 1989).
One surprising result is the insignificant effect of team processes on financial
performance. In order to further analyze this result and to ensure that all potentially
important paths among the domains are captured, a number of alternative models were
tested. Thus, models incorporating the direct links from team design and
organizational context to the two performance variables were also tested but they did
not yield significant results, and therefore, provided support for the mediating role of
team processes. An interesting result emerges when a model without the path of
influence between relational performance and financial performance is analyzed.
Figure 13 reports the results for this model.
Figure 13: Structural path model 2
Notes: ** significant at p < .01 Model fit statistics: χ²/df = 1.482, RMSEA = .042, RMR = .041, CFI = .907, NFI = .762
The fit indexes demonstrate an adequate fit (χ²/df = 1.482, RMSEA = .042, RMR =
.041, CFI = .907, NFI = .762). The direct influence of organizational context on team
processes is not significant again (t = -.063, p > .1). All other coefficients are positive,
significant and high in magnitude, indicating that when the link between the relational
.827**(6.448)
Organizational context
GAM team design
Team processes
Relational performance
Financial performance
-.010(-.063)
.921**(4.524)
.882**(9.527)
.618**(7.956)

144
and financial performance is not taken into account, the direct influence of team
processes on financial performance becomes significant.
These results confirm the positive effect of the process domain on both types of
performance. The comparison of model 1 and model 2 indicates that their fit
characteristics are equally good. However, model 2 is less preferable than model 1
because it is less informative and inclusive. It fails to capture one important
relationship that elucidates better the underlying links. If we take model 2 and do not
recognize the link between relational and financial performance, we may conclude that
team processes lead directly to financial results whereas in fact this relationship is less
straightforward with a number of intermediate outcomes playing a role. As a result,
model 1 was considered a more appropriate solution and is discussed in more detail
below. The full model is presented in Appendix I.
In summary, the estimates of the path coefficients of model 1 show the following
results in relation to the hypothesized relationships. Hypothesis 1 states that GAM
team design will have a positive effect on team processes and it is supported. Figure 12
shows that the standardized regression coefficient from GAM team design to team
processes equals .963, which indicates a positive and significant link (t = 4.608, p <
.01).
Hypothesis 2 posits that the organizational context will have a positive effect on team
processes. As discussed, this hypothesis is not supported. The path coefficient is
insignificant (t = -.208, p > .1). However, although no direct link is detected, another
path of influence through which organizational context impacts the performance of
GAM teams is identified. As the coefficients in Figure 12 show, organizational context
has a positive and significant effect on team design (t = 6.446, p < .01), which supports
the importance of the context construct.
Hypothesis 3 predicts that team processes will have a positive influence on team
relational performance. The path coefficient of .850 indicates that in fact relational
performance is positively and significantly influenced by team processes (t = 9.163, p
< .01), which provides support for this hypothesis.
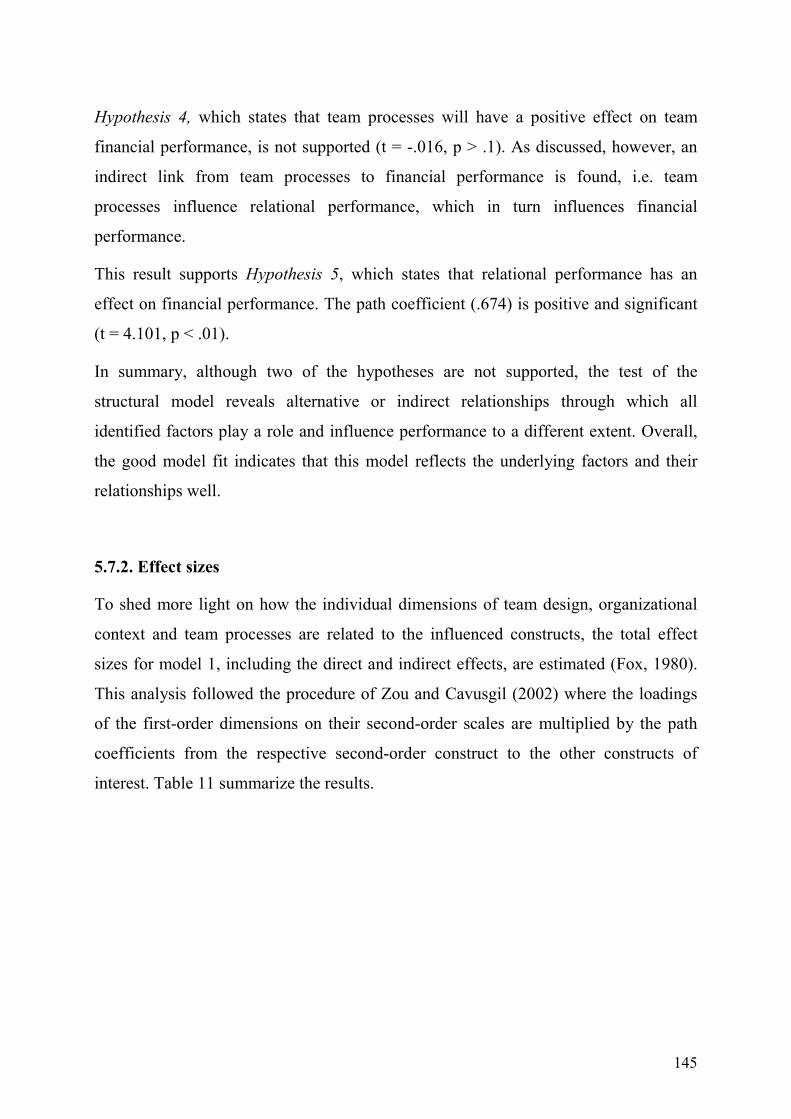
145
Hypothesis 4, which states that team processes will have a positive effect on team
financial performance, is not supported (t = -.016, p > .1). As discussed, however, an
indirect link from team processes to financial performance is found, i.e. team
processes influence relational performance, which in turn influences financial
performance.
This result supports Hypothesis 5, which states that relational performance has an
effect on financial performance. The path coefficient (.674) is positive and significant
(t = 4.101, p < .01).
In summary, although two of the hypotheses are not supported, the test of the
structural model reveals alternative or indirect relationships through which all
identified factors play a role and influence performance to a different extent. Overall,
the good model fit indicates that this model reflects the underlying factors and their
relationships well.
5.7.2. Effect sizes
To shed more light on how the individual dimensions of team design, organizational
context and team processes are related to the influenced constructs, the total effect
sizes for model 1, including the direct and indirect effects, are estimated (Fox, 1980).
This analysis followed the procedure of Zou and Cavusgil (2002) where the loadings
of the first-order dimensions on their second-order scales are multiplied by the path
coefficients from the respective second-order construct to the other constructs of
interest. Table 11 summarize the results.
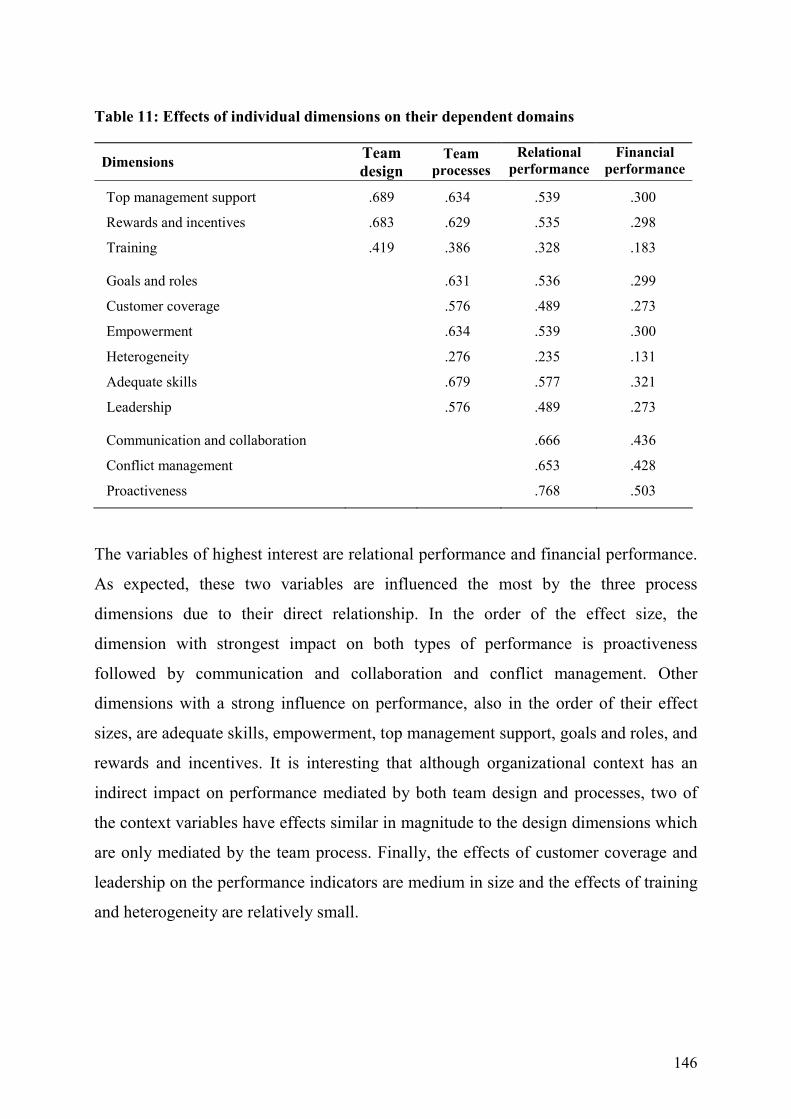
146
Table 11: Effects of individual dimensions on their dependent domains
Dimensions Team design
Team processes
Relational performance
Financial performance
Top management support
Rewards and incentives
Training
Goals and roles
Customer coverage
Empowerment
Heterogeneity
Adequate skills
Leadership
Communication and collaboration
Conflict management
Proactiveness
.689
.683
.419
.634
.629
.386
.631
.576
.634
.276
.679
.576
.539
.535
.328
.536
.489
.539
.235
.577
.489
.666
.653
.768
.300
.298
.183
.299
.273
.300
.131
.321
.273
.436
.428
.503
The variables of highest interest are relational performance and financial performance.
As expected, these two variables are influenced the most by the three process
dimensions due to their direct relationship. In the order of the effect size, the
dimension with strongest impact on both types of performance is proactiveness
followed by communication and collaboration and conflict management. Other
dimensions with a strong influence on performance, also in the order of their effect
sizes, are adequate skills, empowerment, top management support, goals and roles, and
rewards and incentives. It is interesting that although organizational context has an
indirect impact on performance mediated by both team design and processes, two of
the context variables have effects similar in magnitude to the design dimensions which
are only mediated by the team process. Finally, the effects of customer coverage and
leadership on the performance indicators are medium in size and the effects of training
and heterogeneity are relatively small.
147
5.8. Comparison among performance groups
As a final assessment of the importance of the identified team characteristics and their
relationship to performance, I compared the high-performance and the low-
performance teams along the 12 design, context and process dimensions that emerged
from the exploratory and confirmatory factor analyses. For that purpose, in the first
step I compared groups based on individual scores and then in a second step based on
team scores. In the first step, the sample was divided into three groups according to the
average scores of the five team relational performance measures and the three financial
performance measures. Average scores of between 4 and 5 on the five-point Likert
scale are classified as high-performing teams. Out of the 273 data points, 82 responses,
or 30% of the sample, are in this category. The next category, mid-performance teams,
includes the responses with an average score of more than 3 and less than 4. The total
number of responses in this group is 111, which represents 41% of the sample. The
remaining 80 responses (29% of the sample) that have average scores below or equal
to 3 are classified as low-performers.
One-way analysis of variance (ANOVA) tests were performed to compare the mean
scores of the high-performance, mid-performance and low-performance groups on the
12 variables from the design, context and process domains. The mean scores and the
F-values are presented in Table 12.
The findings show that the mean scores on 11 out of the 12 characteristics are
significantly different among the three groups. Furthermore, the high-performance
group has higher ratings on all dimensions than the mid-performance group and the
mid-performance group has higher ratings than the low-performance group. The only
dimension for which the difference is not significant is heterogeneity (F = 2.184, p =
.067). To identify the source of this result, I conducted independent samples t-tests for
each pair of performance groups. The results indicated that the difference in
heterogeneity between the high-performance and the mid-performance groups is not
significant (t = 1.181, p = .239) as is not the difference between the mid-performance
and low-performance teams (t = 1.344, p = .181). However, the high-performance and

148
the low-performance groups are significantly different at the .05 level (t = 2.280, p =
.024).
Table 12: Comparison among performance groups based on individual scores
Mean scores Variable High
(n = 82) Medium (n = 111)
Low (n = 80)
F-value Sig. level
Goals and roles 4.05 3.73 3.33 27.464 .000
Customer coverage 3.86 3.47 3.19 16.389 .000
Empowerment 3.44 3.05 2.77 13.090 .000
Heterogeneity 3.99 3.86 3.74 2.724 .067
Adequate skills 4.21 3.82 3.57 33.934 .000
Leadership 4.24 3.73 3.41 27.092 .000
Top management support 3.95 3.59 3.16 25.263 .000
Rewards and incentives 3.08 2.55 2.34 20.241 .000
Training 3.65 3.29 3.21 8.271 .000
Communication and collaboration 3.79 3.56 3.12 33.722 .000
Conflict management 3.95 3.62 3.39 20.013 .000
Proactiveness 4.19 3.63 3.18 70.282 .000
In order to assess the differences between the three groups in more detail, the same
type of one-way ANOVA tests were conducted for the individual items. With the
exception of the two heterogeneity items where insignificant differences were to be
expected given the results above and item 3.7 which is significant at the .05 level (F =
4.291, p = .015), in all cases the mean ratings of the three groups are significantly
different at the .01 level (F-values ranging from 5.102 to 58.292). Moreover, the
directions of the differences are as predicted, i.e. the scores of the high-performance
group are higher that those of the mid-performance group and the mid-performance
group scores are higher than the group with low performance ratings.
In the second step, the same procedure was conducted but the delineation was made
based on the average team scores. The sample of 113 teams was divided into three
groups according to the each team’s average score of the five team relational

149
performance measures and the three financial performance measures. The same
grouping criteria were applied and resulted in the following split. The number of high-
performing teams (average scores between 4 and 5 on the five-point Likert scale) was
36, or 32% of all teams. The number of mid-performance teams (average scores
between 3 and 4) was 47, which represents 42% of the sample. The remaining 30
teams (26% of the sample) are low-performing. Table 13 presents the results of the
ANOVA tests that compare the mean results among the three groups.
Table 13: Comparison among performance groups based on team scores
Mean scores Variable High
(n = 36) Medium (n = 47)
Low (n = 30)
F-value Sig. level
Goals and roles 4.07 3.76 3.45 7.724 .001
Customer coverage 3.11 3.32 3.30 13.435 .000
Empowerment 3.67 3.15 2.73 13.100 .000
Heterogeneity 4.14 3.95 3.93 1.193 .307
Adequate skills 4.23 3.90 3.48 13.286 .000
Leadership 4.43 3.85 3.40 27.862 .000
Top management support 4.17 3.52 3.34 16.367 .000
Rewards and incentives 3.13 2.58 2.36 10.829 .000
Training 3.68 3.29 3.28 3.578 .031
Communication and collaboration 3.96 3.52 3.25 15.688 .000
Conflict management 4.10 3.61 3.42 13.279 .000
Proactiveness 4.25 3.68 3.10 41.100 .000
The results largely confirm the findings based on individual results, indicating that the
scores along all variables except heterogeneity differ significantly among high-, mid-
and low-performing groups. The differences between mid- and low-performance teams
in the area of training seem to be small but still significant at the .05 level. Overall, the
results provide support for the proposition that high-performing teams are
characterized by significantly higher ratings in all critical team areas.

150
6. Discussion and conclusions
Global account management teams represent an important part of many GAM
programs, but existing research has provided few directions for clarifying their
formation, structure, composition, interaction processes, and performance.
Furthermore, GAM teams differ from other forms of group work because of their
complexity in terms of their cross-regional, cross-functional, and cross-divisional
span; blurred responsibilities and lines of authority; heightened external activity
requirements; and long-term tasks. This further complicates the managerial task of
building and managing high-performance customer teams. Consequently, this study
aimed to examine what determines the performance of GAM teams by developing and
empirically testing an integrative model of team composition, interaction and
performance.
Based on the comprehensive literature review, the exploratory interview research and
the analysis of survey data from six multinational companies, 12 determinants of team
performance in three broad domains were identified. They were then evaluated against
both qualitative and quantitative performance criteria. The findings can be summarized
as follows:
First, the empirical results indicate that GAM team design is a complex,
multifaceted construct that encompasses six key dimensions: role and goal
definition, customer coverage, empowerment, heterogeneity, adequate skills, and
leadership.
Second, these structural and composition dimensions influence team performance
through the mediating role of three key processes: communication and
collaboration, conflict management, and proactiveness.
Third, three key elements of the organizational context of GAM teams – top
management support, rewards and incentives, and training – are positively
associated with team design and therefore have an indirect influence on team
performance.

151
Fourth, GAM team performance has two associated components, relational and
financial performance. The empirical results show that relational performance is
an intermediate outcome that leads to improved financial performance in terms of
sales growth, profitability and growth in the customer’s share of wallet.
Fifth, and most important, all design, process and context dimensions have either
direct or indirect positive influence on performance. Therefore, companies may
improve their relational and financial outcomes with global customers by
improving their performance in these areas of team functioning.
This chapter discusses the major findings and their implications for theory and practice
in more detail. The discussion is organized around the three research questions that
guides the study. It is then followed by a summary of the contributions to theory,
managerial implication, limitations and directions for further research.
6.1 Key findings: What are the key elements of GAM team design?
This research question aimed to conceptualize and delineate the specific aspects of
team structure and composition that may have an impact on team performance. The
literature review and the qualitative findings pointed to seven key dimensions: role and
goal definition, structure, empowerment, size adequacy, heterogeneity, adequate skills,
and leadership. Although some studies distinguish between team structure and team
composition (Gladstein, 1984; Smith and Barclay, 1993) as two distinct sub-
components of team design, the results did not provide support for the split of the
identified dimensions in these two groups. This result is not surprising in light of the
lack of agreement in literature on what constitutes structure and composition. For
example, abilities are a part of the composition domains of Gladstein (1984) and
Cohen et al. (1996) whereas Gist et al. (1987) refer to them as an aspect of group
structure. Therefore, the identified seven dimensions were kept within one single
second-order construct.
The exploratory and confirmatory factor analyses confirmed the validity of six of the
design aspects but indicated that size adequacy does not correlate well with the design

152
domain. Thus, this variable was not analyzed further in order to avoid incorrect
conclusions. One possible explanation is that the measure of size adequacy lacked a
certain degree of reliability. The measure was adopted from prior studies (Campion et
al., 1993; Cohen et al., 1996) and contained only one item that asked whether the
number of people on the team is sufficient for the team to develop its customer
business. However, these studies examined small organizational groups with clear
membership and predominantly full-time members so the measure may have failed to
capture all aspects pertinent to team size in GAM teams where membership is often
fluid and virtual. For example, many GAM team members participate on a part-time
basis and the percentage of time dedicated to the team may be an additional indicator
of human resource availability along with the number of people. This result indicates
that the issue of GAM team size is more complex than predicted. The implication is a
need for the development of more detailed scales and a more thorough investigation
into related concepts such as time dedication or the number of full-time and part-time
members.
Five of the remaining six dimensions – roles and goals, customer coverage,
empowerment, skills and leadership – loaded very well on the design domain and, as
demonstrated by their effect sizes, have a strong influence on team processes and
hence indirectly on team performance. The implication is that building high-
performance GAM teams starts with a clear specification of their objectives in relation
to the customer and to the overall corporate goals and delineation of the roles and
responsibilities that team members are expected to fulfill. This is important because
GAM team members often have other responsibilities in addition to their involvement
with global customers. Furthermore, the composition of the team should be given
sufficient attention in order to identify individuals with adequate skills who are
capable of developing relationships and navigating the interface between two global
organizations. Team performance may be further enhanced if these arrangements are
accompanied by a leader with a strong presence and influence in the organization and
the provision of sufficient resources and authority to the team.
153
These findings are largely consistent with organizational behavior literature. However,
a contribution of this study is the identification of specific skills required for GAM
team members. Support was found for seven out of the nine initial skills indicators and
the results showed that adequate skills is the design dimension with the strongest
impact on team processes. These results extend previous research in GAM that has
identified critical account manager skills but has not tested the skills-performance
relationship empirically (Harvey et al., 2003a; Millman, 1996).
Another novel dimension identified in this study is customer coverage. Following the
purification of the team structure construct, customer coverage emerged as the most
relevant aspect of team structure. This result is not surprising because the key role of a
GAM team is to provide the required services and support to its global customer,
which demands an appropriate cross-geographical, cross-functional and cross-
divisional representation on the team. Although some GAM studies have referred to
the need for a structural fit with the customer (Shi et al., 2004) and team selling
literature has discussed ways to achieve better alignment between buying and selling
teams (Puri and Korgaonkar, 1991), no aspect similar to customer coverage within a
GAM team context has been studied from an empirical perspective before. Therefore,
the identification of a link between this factor and team process and performance is an
important extension of existing research in GAM and team selling.
Finally, one key design dimension – heterogeneity in terms of experience and
expertise – did not yield unequivocal results, and therefore, needs further clarification.
The results of the literature review and the qualitative research indicated that expertise
diversity is desirable in teams with complex and uncertain tasks because it enhances
creativity and facilitates problem-solving. Consequently, it was predicted that the
variety in backgrounds and skills will facilitate the work of the GAM team. The
empirical results showed that this factor indeed had a significant and positive loading
on team design, and hence a positive effect on team processes, but these effects were
relatively small in size. Furthermore, the comparison of the three performance groups
did not detect substantial differences in this aspect. Thus, these findings provided
support for the positive consequences of expertise heterogeneity in dynamic and
154
demanding environments and yet raised questions about its predictive power and
importance relative to the other design elements.
A number of arguments can explain these moderate results. First, as already discussed
in Section 3.2.1 in a GAM context various types of diversity are often a given because
of the multicultural and multifunctional nature of GAM teams. The expertise
heterogeneity variable (M = 3.86, SD = .61) provided some evidence of this; it had one
of the highest mean scores and one of the lowest standard deviations of all variables,
implying that a high degree of expertise diversity was present in all studied teams. The
low variance among teams might explain the low predictive power of this variable and
the heightened relative importance of other factors such as communication skills,
leadership and empowerment. Second, a potential explanation can be the existence of
negative consequences that outweigh the benefits of expertise diversity but are not
captured in the model, or any alternative relations also not reflected in the model. Most
types of heterogeneity are complex phenomena that may have contradictory effects
depending on the contextual moderators and the types of processes studied (Milliken
and Martins, 1996; Pelled et al., 1999). Although an attempt was made to maximize
precision by focusing on the most relevant type of diversity, delving into its
multidimensional consequences was outside the scope of this exploratory study. The
objective was to create a holistic model of GAM team performance determinants
rather than focus on specific elements so this result is satisfactory. In general, the
results provided evidence for the conceptualization of these six characteristics as the
key elements of GAM team design.
6.2 Key findings: How does GAM team design influence team
performance?
This second research question sought to analyze if there is a relationship between team
design and performance and to investigate the mechanisms through which they are
linked. To that end, three hypotheses were formulated. Hypothesis 1 stated that team
design will have a positive influence on team processes. Hypothesis 3 and 4 posited

155
that team processes will have a positive influence on team relational performance and
on team financial performance.
The first key finding is that team design has an indirect link to performance mediated
by team processes. The test of the structural path model provided support for
Hypothesis 1 and did not indicate a significant direct relationship between design and
performance. This result is in line with studies that call for opening the “black box” of
team interactions (Lawrence, 1997) as a way to explain how demographic
characteristics influence outcomes. By including team processes in the model, this
study managed to avoid the pitfall of earlier research that has omitted this vital link,
and therefore, failed to reach conclusive results (e.g. Campion et al., 1993; Cohen et
al., 1996). The implication is that decisions in relation to a team’s structure and
composition should be based on a careful assessment of their potential consequences
on the way team members interact within the team and with their environment.
An important related finding is the identification of three distinct GAM team
processes. The empirical results reported that communication and collaboration,
conflict management, and proactiveness are all useful predictors of team performance.
Whereas communication and collaboration (Ancona and Caldwell, 1992a; Bunderson
and Sutcliffe, 2002) and conflict (Amason, 1996; Jehn, 1995) have been more
extensively researched in the context of organizational groups, proactiveness is a less
understood concept. In GAM teams, however, proactiveness had the strongest
influence on performance, as indicated by its effect size and the largest mean
difference across the three performance groups. Thus, this study makes a contribution
by providing further evidence for its relevance and identifying its relation to structural
elements and performance outcomes on the team level.
A novel result is that the findings failed to draw an explicit delineation line between
internal and external communication and collaboration. Although the distinction
between internal and external team activity has traditionally been accepted as a norm
in group research, this research brought some new insights. All communication and
collaboration indicators formed a single factor including both internal and external
aspects. This can be explained by the blurred GAM team boundaries and the need for

156
team members to build multilateral relationships in a complex network within the
supplier and the customer organization. Therefore, it is often difficult, and not
necessary, to determine what part of the ongoing information exchange and
collaboration efforts take place among team members and what part may be defined as
external. The implications are primarily theoretical. They suggest that the examination
of teams with less structured boundaries and more complex interactions with the
environment may require a modified multidimensional definition of communication
and collaboration that accounts for the differences from more conventional and
isolated teams.
The second key finding concerns the relationship between team processes and
performance. This study identified two distinct types of team performance – relational
and financial, whereby relational performance refers to the development of long-term
customer relationships and outcomes such as customer satisfaction, customer value
and learning from the customer, and financial performance involves sales growth,
profitability and growth in the share of the customer’s wallet. Team processes related
significantly to the relational performance criteria, providing support for Hypothesis 3.
However, the direct link to financial performance (Hypothesis 4) was confirmed only
when no link between the two types of performance was assumed. When the influence
of relational on financial performance is introduced (Hypothesis 5), Hypothesis 4 is no
longer substantiated. This result suggests that relational performance is only an
intermediate outcome that ultimately enhances financial results.
Hypothesis 4 was formulated on the basis of prior studies that have found a direct
influence of GAM processes such as communication and coordination on financial
measures of profitability and sales growth (Birkinshaw et al., 2001; Shi et al., 2005).
Therefore, the findings of this dissertation are a valuable contribution that provides
one missing link in prior research in this area. It was outside the scope of this
exploratory inquiry to investigate each performance element separately. However, in
light of individual influences of the relational performance components such as
customer satisfaction and customer value, it is not surprising that relational
performance plays a mediating role between processes and financial results.
157
This finding has also implications for organizational behavior research. The majority
of studies in this research stream distinguish between performance outcomes such as
goal achievement, productivity or other relevant criteria and attitudinal outcomes in
terms of team satisfaction, commitment and trust. However, these two performance
groups are usually treated as ultimate outcomes of effective teamwork with no explicit
interrelation. The findings in this study imply that the relationship between the two
may require a more close consideration.
6.3 Key findings: What other factors have an influence on GAM team
performance?
The third research question helped to investigate if there are additional factors from
the team’s environment that influence team performance. The literature review and the
interview research led to the discovery of three such factors – top management
support, rewards and incentives, and training. The empirical results indicated that these
factors explain a large portion of the variance in environmental factors (73%) and
therefore capture well the influence of the organizational context. The implication is
that the development of high-performance GAM teams is unlikely to succeed if it is
not accompanied by genuine support from senior managers as well as proper
incentives that encourage contributions to the team and stimulate global thinking
throughout the organization. Furthermore, building well-functioning teams requires
that team members are offered well-rounded training opportunities to develop the
relevant selling, interpersonal and technical skills.
In contrast to prior studies that have posited a direct path of influence from
organizational context to team processes (e.g., Hackman, 1987), I did not find support
for such a link. However, organizational context proved to be a significant predictor
of team design, which represents a worthwhile contribution to the team literature
where this relationship has not been widely recognized. An examination of each of the
three context dimensions may help uncover an explanation for this finding. Top
management support was predicted to influence team processes by helping the team in

158
its work with the customer, and more importantly, by creating a more cooperative and
customer-oriented organizational environment. However, some other aspects of top
management activities, which have possibly been overlooked, may explain the link to
team design. For example, in some cases senior management support may take the
form of involvement in the goal and role setting process or in the appointment of a
team leader and members, thus influencing all team composition elements. In addition,
top management support can be a direct predictor of team empowerment (Kirkman and
Rosen, 1999). Similarly, the indirect relationship between training and processes can
be explained by the mediating role of skills. The only aspect in which the context-
design link remains hard to explain is rewards and incentives. Clearly, the reward and
compensation practices are related to behavioral and attitudinal outcomes such as the
efforts applied to the team tasks and the degree of collaboration (Hackman, 1987),
which belong in the process domain rather than the design area. This suggests that the
results may have been primarily driven by the effects of top management support and
training or that there are other aspects that remain implicit in this study. In any case,
these findings prompt further investigation of the specific elements of the context
domain.
6.4 Contributions to theory
The major contribution of the study is the development and empirical validation of an
integrative model that sheds light on the performance determinants of a relatively new
and underresearched phenomenon – GAM teams. The novel approach lies in the
combination of concepts from the account management and organizational behavior
research streams. To my knowledge, this is the first study to conduct such an
interdisciplinary research. Thus, it makes contributions to both of these academic
areas.
First, the focus was on the team level which has not been sufficiently investigated
within the GAM or customer management literature. Second, the detailed delineation
of domains of team functioning with their specific dimensions extends prior research
159
on the GAM team that has addressed only the fundamental organizational decisions
(Kempeners and van der Hart, 1999). The introduction of concepts from research on
organizational groups and cross-functional teams broadened the understanding of
GAM teamwork by taking a step further from purely structural issues. Thus, a more
complete set of performance determinants including a number of processual and
behavioral aspects were identified. Moreover, I suggested and inspected variables that
have never been empirically tested in a GAM context, such as empowerment,
leadership, conflict management and training.
Third, this study makes a contribution to the organizational behavior field by
identifying factors that gain increased importance in teams with more complex and
dynamic structures, tasks and environments. For example, constructs such as
proactiveness, top management support, skills and rewards have not been broadly
emphasized or have produced inconclusive results in studies of teams with more
structured and stable settings. However, they received a strong confirmation in this
study implying a distinctive set of individual, team and organizational capabilities that
can be generalizable to teams of similarly dynamic nature.
Fourth, I examined a number of alternative relationships among all domains and
detected important intermediating influences. Thus, the analysis provided a more
realistic and informative picture of the existing interrelations than the approach of
directly linking input variables to outcomes. This led to some novel findings such as
the intermediate role of relational performance.
Fifth, a key strength is the empirical validation of the model with a relatively large
data sample from truly global companies. Following the solid grounding in literature
and exploratory interview research, the model was tested in six companies where
GAM teams represent a core element of global customer operations. The results
indicated that it reflects well the realities of such teams.
160
6.5 Managerial implications
From a managerial viewpoint, this study highlights, in the first place, the importance
of adopting a holistic approach to the composition and management of GAM teams.
As the results point out, all team characteristics as well as the context in which the
teams work have important performance implications. Consequently, neglecting some
or all of these issues will represent a key barrier to team effectiveness and to the
overall GAM operations of the supplier.
More importantly, I developed a comprehensive model that can guide companies in
their implementation of customer teams and GAM programs and help them improve
their global customer relationships. First, the model has a practical value because of its
focus on dimensions that management can influence. Many of the design elements are
directly within the control of the senior managers responsible for global sales and
teams. The context and process attributes may be less directly controllable but
management can influence them through encouragement, reinforcement and internal
negotiation. Although the degree of control may vary, all of these characteristics offer
a valuable direction for management in learning how to build and manage high-
performance GAM teams. Thus, even if some of these parameters cannot be changed
in the short term, they represent a useful foundation for creating a clear vision and
strategies for the longer run.
Second, the complete set of 12 team characteristics and their corresponding 42
questionnaire items (after scale optimization) along with the 9 performance indicators
can be used as a practical tool for designing new GAM teams or enhancing the
effectiveness of existing ones. With due consideration of the limitations of the
research, this set can be converted into a checklist for optimizing GAM team
performance and assist companies in assessing current performance, mapping out
areas for improvement, developing courses of action and tracking the progress along
each dimension.

161
Third, the tested linkages among the variables illustrate the mechanisms through which
different aspects of GAM teamwork are interrelated. This can help managers better
understand and foresee the potential consequences of their actions in each domain.
Fourth, the model has practical implication for human resource (HR) practices. Many
of the team dimensions (e.g., skills, training, leadership, rewards) relate to HR
activities performed by line managers or HR managers. Thus, by calling attention to
the need for appropriate GAM team-related recruitment, training and compensation
practices at various levels in the organization, the model might enhance awareness of
this aspect and help to embed a global market-oriented approach in the organization.
More specifically, managers can take several key points from this study and
implement them immediately to create new teams or optimize the performance of
existing ones:
Situation analysis
In the first place, the findings indicate that it is important to understand very well all
factors underlying team performance. All observable behaviors and results are
determined by factors that are more subtle and difficult to control. Therefore, GAM
team improvements should start with a profound analysis of the current situation along
the groups of factors in the design and context domains. Managers need to assess
where potential blockages or outright problems lie and address them in the most
efficient manner. This study assists them in this process by providing a framework and
diagnostic questions to conduct this assessment.
Holistic approach
A common mistake in the implementation of teams is to focus resources and efforts
primarily on the team design and neglect the larger settting in which it works. As the
results show, the team cannot be isolated from the rest of the organization and the
creation of an environment that fosters GAM cooperation and supports teamwork is a
critical success factor. Managers should, therefore, take a more comprehensive view
and try to understand what factors from the internal and external team environment are

162
important in their companies. The three factors that they can more easily influence,
and hence, should concentrate on are top management support, rewards and incentives,
and training. By continuously seeking support from and involving top management,
managers responsible for GAM can benefit from increasing support in the organization
and leverage with the customer. On the other hand, developing appropriate incentive
plans and training schemes looks rather inside the team and ensures that team
members are, first, more capable of fulfilling their goals and, second, more motivated
to overcome hurdles and excel in their jobs.
Quick wins
The results indicated that five factors – adequate skills, goal and role definition,
empowerment, top management support, rewards and incentives – have a stronger
impact on the way teams work and perform than others. These are the areas which
could lead to larger performance improvements, and therefore, should be the main
focal point for managers who seek to achieve such “quick wins” or to start
implementation/ optimization programs with only a few key elements before rolling
them out to all elements. The implication is that one of the starting points for building
and improving GAM teams is the question “Do we have the right people for this job?”
Team members’ skills are a crucial factor implying that the recruitment and training of
account managers should be done with great care. Simply promoting sales people into
global account managers is unlikely to succeed if they do not possess a broader skill
set including managerial skills, strategic thinking and ability to work in a
multidisciplinary way and multicultural surroundings. As discussed above, stringent
selection and hiring processes should be also accompanied by well-designed
compensation systems and appropriate training to develop the required selling, team
working and technical skills.
Similarly, the results suggest that managers could achieve larger performance
improvements by optimizing the teams’ goal and role structure. Many teams operate in
settings where individual, team and company goals contradict with each other and

163
expectations about members’ roles and responsibilities are unclear. Changing such
established organizational arrangements could be one of the most difficult managerial
tasks but it is an absolute prerequisite for creating a functioning and collaborative
team. Setting the right objectives and role expectations could relatively quickly
improve results by increasing the level of motivation, efforts and time dedicated to the
team.
Finally, among the top critical areas that should be tackled first are team empowerment
and top management support. Providing GAM teams with sufficient resources,
decision-making power and support from senior management means that they would
be able to make fast and efficient decisions and take courses of action that are in the
best interest of the customer but may be unpopular or face opposition within the
supplier organization. As a result, teams will experience fewer conflicts and higher
levels of collaboration and proactive behavior. As the experience of the interviewed
companies shows, these two factors may be also difficult to implement but in all cases
the payoff could be significant. The key instrument for managers to achieve this is
what interviewees defined as internal selling, i.e. continuous communication with top
management and other key people in the organization to clearly demonstrate the
benefits of empowered GAM teams and highlight specific success stories of the teams
that contributed to the success of the entire company.
6.6 Limitations and suggestions for further research
Potential limitations of the dissertation can be outlined from both a methodological
and conceptual point of view. First, the quantitative research was conducted in six
companies. The small number of study companies has been consistently justified in
previous team studies and larger samples have hardly ever been used in this type of
research. Moreover, the companies were carefully selected to be representative of the
population of multinational companies that use global or international customer teams.
Nevertheless, it must be recognized that this approach may raise some generalizability
issues. To confirm the generalizability of the model to other settings, future studies

164
may build on this initial research through replication and extension, which are
effective methods for research enhancement (Easley and Madden, 2000).
Another limitation is the use of subjective performance ratings. This approach was
justified by the lack of objective measures in some of the study companies as well as
the unwillingness of others to share them. Further research, however, should seek to
test the effect of the identified independent variables on objective measures like actual
sales growth, profitability, share of wallet or customer satisfaction ratings obtained in
customer surveys. For the measures which are rather subjective by nature (e.g.,
relationship building, customer value, learning and competitive position), a more
unbiased rating can be obtained through managerial or customer assessments of these
indicators. To ensure independence, these ratings should be collected separately from
the assessments of team members who complete the questionnaire.
Finally, a worthwhile extension from a methodological perspective could be obtain
also data from the customer. Although some dimensions may be less visible and
difficult to evaluate from the customer side, testing the model with a sample of
members from the customers' buying teams who work with the GAM teams could add
some insights.
From a conceptual point of view, the exploratory nature of the study did not provide
for a really profound exploration of each variable. The goal was to develop a broad
framework of performance determinants and gain understanding of the key paths of
influence. Therefore, future studies may identify the individual antecedents and
consequences of each team characteristic. This could help to better explain the
unpredicted results like the influence of organizational context on team design or the
low predictive power of team size and heterogeneity. Furthermore, additional research
could build on the model to identify other dimensions and measure their performance
outcomes, or study the effects of other facilitating or moderating conditions.
Finally, another interesting avenue for further research is to conduct a multi-level
analysis to better understand the individual-, group- and organization-level variables
that impact team performance. This will require a slightly different approach to
165
sampling and variable conceptualization to ensure that variables are correctly defined
at the corresponding hierarchical levels (Hox, 2002).
6.7 Concluding remarks
Designing and implementing global account management teams represents a critical
task for suppliers that are expanding the scope of their relationships with global
customers. However, to date, research had not provided an explanation of how these
teams should be built and what determines their performance. The objective of this
study was to fill this research gap by identifying key critical success factors and
linking them in a holistic model. I hope that the findings shed some light on these
interesting issues and have a practical value for companies that strive for improving
their strategic customer relationships. Finally, I hope that this study spurs future
research that will further enhance our understanding in this emerging field of inquiry.

166
Bibliography Alderfer, C.P. (1977) ‘Group and intergroup relations’, in Hackman J.R., Suttle, J.L. (eds.) Improving Life at Work: Behavioral Science Approaches to Organizational Change, p. 227-246, Santa Monica, CA: Goodyear. Alderfer, C.P. (1987) ‘An intergroup perspective of group dynamics’ in Lorsch J.W. (ed.): Handbook of Organizational Behavior, p. 190-222, Englewood Cliffs, NJ: Prentice-Hall. Allen, T.J. (1984): Managing the Flow of Technology: Technology Transfer and the Dissemination of Technological Information within the R&D Organization, Cambridge, MA: MIT Press. Amason, A.C. (1996) ‘Distinguishing the effects of functional and dysfunctional conflict on strategic decision making: Resolving a paradox for top management teams’, Academy of Management Journal, 39(1): 123-148. Amason, A.C. and Sapienza, H.J. (1997) ‘The effects of top management team size and interaction norms on cognitive and affective conflict’, Journal of Management, vol. 23, no. 4, p. 495-516. Ancona, D.G. (1987) ‘Groups in organization: Extending laboratory models’ in Hendrick, C. (eds.) Annual Review of Personality and Social Psychology: Group Processes and Intergroup Processes, p. 207-231, Beverly Hills, CA: Sage. Ancona, D.G. (1990) ‘Outward bound: Strategies for team survival in an organization’, Academy of Management Journal, 33(2): 334-365. Ancona, D.G. and Caldwell, D.F. (1988) ‘Beyond task and maintenance: Defining external functions in groups’, Group and Organization Studies, 13(4): 468-494. Ancona, D.G. and Caldwell, D.F. (1992a) ‘Bridging the boundary: External activity and performance in organizational teams’, Administrative Science Quarterly 37(4): 634-665. Ancona, D.G. and Caldwell, D.F. (1992b) ‘Demography and design: Predictors of new product team performance’, Organization Science 3(3): 321-341. Ancona, D.G. and Caldwell, D.F. (1992c) ‘Cross-functional teams: Blessing or curse for new product development’, in Kochan, T.A., Useem, M. (eds.) Transforming Organizations, p. 154-166, New York: Oxford University Press.
167
Ancona, D.G. and Caldwell, D.F. (2000) ‘Compose teams to assure successful boundary activity’, in Locke, E.A. Blackwell Handbook of Principles of Organizational Behaviour, p. 199-210, Oxford: Blackwell. Anderson, J.C. (1987) ‘An approach for confirmatory measurement and structural equation modeling of organizational properties’, Management Science 33(4): 525-524. Anderson, E.W., Fornell, C. and Rust, R.T. (1997) ‘Customer satisfaction, productivity, and profitability: Differences between goods and services’, Marketing Science 16 (2): 129–45. Anderson, E.W. and Weitz, B. (1992) ‘The use of pledges to build and sustain commitment in distribution channels’, Journal of Marketing Research 29(1): 18-34. Anderson, J.C. and Gerbing, D.W. (1988) ‘Structural equations modeling in practice: A review and recommended two-step approach’, Psychological Bulletin 103(3): 411-423. Arbuckle, J.L. (1997) Amos Users’ Guide, Version 3.6. Chicago: SPSS. Armstrong, J.S. and Overton, T.S. (1977) ‘Estimating nonresponse bias in mail surveys’, Journal of Marketing Research 14: 396-402. Arnold, M., Belz, C. and Senn, C. (2001) ‘Leveraging knowledge in global key account management: findings from a benchlearning group project in the industry’, Thexis Research Report for Marketing no. 2001/1. Arnold, D., Birkinshaw, J. and Toulan, O. (1999) ‘Implementing global account management in multinational corporations’, Thexis 4: 14-17. Arnold, D., Birkinshaw, J. and Toulan, O. (2001) ‘Can selling be globalized? The pitfalls of global account management’, California Management Review 44(1): 8-20. Ashby, W.R. (1952) Design for a Brain. London: Chapman & Hall. Babbie, E. (1990) Survey Research Methods. 2nd edition, Belmont, CA: Wadsworth Publishing. Bagozzi, R.P. and Phillips, L.W. (1982) ‘Representing and testing organizational theories: A holistic construal’, Administrative Science Quarterly 27: 459-489. Bagozzi, R.R. and Yi, Y. (1988) ‘On the evaluation of structural equation models’, Journal of the Academy of Marketing Science 16: 74-94. Bagozzi, R.P., Yi, Y. and Phillips, L.W. (1991) ‘Assessing construct validity in organizational research’, Administrative Science Quarterly 36: 421-458.
168
Bantel, K.A. (1993) ‘Strategic clarity in banking: Role of top management-team demography’, Psychological Reports 73: 1187-1201. Bantel, K.A. and Jackson, S.E. (1989) ‘Top management and innovations in banking: Does the demography of the top team make a difference?’, Strategic Management Journal 10: 107-124. Barney, J. (1991) ‘Firm resources and sustained competitive advantage’, Journal of Management 17(1): 99–120. Barrick, M.R., Stewart, G.L., Neubert, M.J. and Mount, M.K. (1998) ‘Relating member ability and personality to work-team processes and team effectiveness’, Journal of Applied Psychology 83: 377-391. Bateman, T.S. and Crant, J.M. (1993) ‘The proactive component of organizational behavior: A measure and correlates’, Journal of Organizational Behavior 14(2): 103-118. Baumgartner, H. and Homburg, C. (1996) ‘Applications of structural equation modeling in marketing and consumer research: A review’, International Journal of Research in Marketing 13: 139-161. Bentler, P.M. (1990) ‘Comparative fit indexes in structural models’, Psychological Bulletin 107: 238-246. Bentler, P.M. and Bonnett, D.G. (1980) ‘Significance tests and goodness of fit in the analysis of covariance structures’, Psychological Bulletin 88: 588-606. Bentler, P.M. and Chou, C.P. (1987) ‘Practical issues in structural modeling’, Sociological Methods and Research 15: 78-117 Bentz, V.M. and Shapiro, J.J. (1998) Mindful Inquiry in Social Research. Thousand Oaks: Sage. Bettenhausen, K.L. (1991) ‘Five years of groups research: What we have learned and what needs to be addressed’, Journal of Management 17(2): 345-381. Birkinshaw, J., Arnold, D. and Toulan, O. (2001) ‘Global account management in multinational corporations: Theory and evidence’, Journal of International Business Studies 32(2): 231-248. Birkinshaw, J. and Terjesen, S. (2002) ‘The customer-focused multinational: Revisiting the Stopford and Wells model in an era of global customers’. London Business School Paper, presented at the Symposium in honour of John Stopford, June 16-17, 2002.
169
Black, T.R. (1999) Doing Quantitative Research in the Social Sciences: An Integrated Approach to Research Design, Measurement and Statistics. London: Sage. Bollen, K.A. (1989) Structural Equations with Latent Variables. New York: John Wiley & Sons. Brown, S.L. and Eisenhardt, K.M. (1995) ‘Product development: Past research, present findings and future directions’, Academy of Management Journal 20(2): 343-378. Browne, M.W. and Cudeck, R. (1993) ‘Alternative ways of assessing model fit’ in Bollen, K.A. and Long, J.S. (eds.) Testing Structural Equation Models, p. 136-162, Newbury Park CA: Sage. Bunderson, J.S. and Sutcliffe, K.M. (2002) ‘Comparing alternative conceptualizations of functional diversity in management teams: Process and performance effects’, Academy of Management Journal 45(5): 875-893. Bunn, M.D. (1993) ‘Taxonomy of buying decision approaches’, Journal of Marketing 57: 38-56. Buvik, A. and John, G. (2000) ‘When does vertical coordination improve industrial purchasing relationships?’, Journal of Marketing 64(3): 52-64. Campbell, D.T. and Fiske, D.W. ‘Convergent and discriminant validation by the multitrait-multimethod matrix’, Psychological Bulletin 56: 81-105. Campion, M.A., Medsker, G.J. and Higgs, A.C. (1993) ‘Relations between work group characteristics and effectiveness: implications for designing effective work groups’, Personnel Psychology 46: 823-850. Cannon, J.P. and Perreault, W.D. (1999) ‘Buyer-seller relationships in business markets’, Journal of Marketing Research 36(4): 439–460. Capon, N. (2001) Key Account Management and Planning: The Comprehensive Handbook for Managing Your Company’s Most Important Strategic Asset. New York: The Free Press. Cespedes, F.V., Doyle, S.X. and Freedman, R.J. (1989) ‘Teamwork for today’s selling’, Harvard Business Review 67: 44-55. Charmaz, K. (2002) ‘Qualitative interviewing and grounded theory analysis’ in Gubrium, J.F. and Holstein, J.A. (eds.) Handbook of Interview Research: Context and Method, p. 675-694 Thousand Oaks: Sage.

170
Churchill, G.A. (1979) ‘A paradigm for developing better measures of marketing constructs’, Journal of Marketing Research 16(1): 64-73. Churchill, G.A. and Peter, J.P. (1984) ‘Research design effects on the reliability of rating scales: A meta-analysis’, Journal of Marketing Research 21: 360-375. Cohen, J. (1977) Statistical Power Analysis for the Behavioral Sciences. New York: Academic Press. Cohen, M.A. and Huchzermeier, A. (1999) ‘Global supply chain management: A survey of research and applications’, in Tayur, S., Ganeshan, R., Magazine, M. (eds.) Quantitative Models for Supply Chain Management. Boston, MA: Kluwer Academic Publishers. Cohen, S.G. and Bailey, D.E. (1997) ‘What makes teams work: Group effectiveness research from the shop floor to the executive suite’, Journal of Management 23(3): 239-290. Cohen, S.G. and Ledford, G.E. (1994) ‘The effectiveness of self-managing teams: A quasi-experiment’, Human Relations 47(1): 13-43. Cohen, S.G., Ledford, G.E. and Spreitzer, G.M. (1996) ‘A predictive model of self-managing work team effectiveness’, Human Relations 49(5): 643-676. Colletti, J. and Tubridy, G. (1987) ‘Effective major account sales management’, Journal of Personal Selling and Sales Management 7: 1-10. Collis, J. and Hussey, R. (2003) Business Research: A Practical Guide for Undergraduate and Postgraduate Students. 2nd edition, Basingstoke: Palgrave Macmillan. Crant, J.M. and Bateman, T.S. (2000) ‘Charismatic leadership viewed from above: The impact of proactive personality’, Journal of Organizational Behavior 21(1): 63-75. Cronbach, L. (1951) ‘Coefficient alpha and the internal structure of tests’, Psychometrika 16: 297-334. Croom, S., Wilson, K., Millman, T., Senn, C. and Weilbaker, D. (1999) ‘How to meet the challenge of managing global customers’, Velocity 1(4): 33-34, 44-46. Cudeck, R. and Browne, M.W. (1983) ‘Cross-validation of covariance structures’, Multivariate Behavioral Research 18: 147-167. Cummings, T.G. (1978) ‘Self-regulating work groups: a socio-technical synthesis’, Academy of Management Review 3: 625-634.

171
Davis, L.E. and Wacker, G.L. (1987) ‘Job design’, in Nystrom, P.C., Starbuck, W.H. (eds.) Handbook of Organization Design, vol. 2, p. 250-271. New York: Oxford University Press. Deavenport, E.W. (1999) ‘The formula for global account management success: The CEO must champion strategic accounts to build a firm’s global business’, Velocity 1(3): 14-17. De Dreu, C.K. and Van Vianen, A.E. (2001) ‘Managing relationship conflict and the effectiveness of organizational teams’, Journal of Organizational Behavior 22(3): 309-328. Deeter-Schmelz, D.R. and Ramsey, R. (1995) ‘A conceptualization of the functions and roles of formalized selling and buying teams’, Journal of Personal Selling and Sales Management 15(2): 47-60. Denison, D.R., Hart, S.L. and Kahn, J.A. (1996) ‘From chimneys to cross-functional teams: Developing and validating a diagnostic model’, Academy of Management Journal 39(4): 1005-1023. Denzin, N.K. (1970) The Research Act: A Theoretical Introduction to Sociological Methods. New York: McGraw Hill. DeVellis, R.F. (1991) Scale Development: Theory and Applications. Thousand Oaks, CA: Sage Publications. Dillman, D.A. (1991) ‘The design and administration of mail surveys’, Annual Review of Sociology 17: 225-249. Dillman, D.A. (2000) Mail and Internet Surveys: The Tailored Design Method. New York: John Wiley & Sons, Inc. Dishman, P. and Nitse, P. (1998) ‘National accounts revisited: new lessons from recent invetigations’, Industrial Marketing Management (27): 1-9. Donnellon, A. (1993) ‘Crossfunctional teams in product development: Accommodating the structure to the process’, Journal of Product Innovation Management 10: 377-392. Durgee, J.F. (1986) ‘Depth-interview techniques for creative advertising’, Journal of Advertising Research 26: 29-37. Dwyer, F., Schurr, P. and Oh, S. (1987) ‘Developing buyer-seller relationships’, Journal of Marketing 51: 11-27.

172
Dyer, J.H. (1997) ‘Effective interfirm collaboration: how firms minimize transaction costs and maximize transaction value’, Strategic Management Journal 18(7): 535–556. Easley, R.W. and Madden, C.S. (2000) ‘Replications and extensions in marketing and management research’, Journal of Business Research 48(1): 1-3. Egelhoff, W.G. (1982) ‘Strategy and structure in multinational corporations: an information processing approach’, Administrative Science Quarterly 27(3): 435-458. Eisenhardt, K.M. (1989) ‘Building theories from case study research’, Academy of Management Review 14(4): 532-550. Ellram, L. and Carr, A. (1994) ‘Strategic purchasing: a history and review of the literature’, International Journal of Purchasing and Materials Management 30(2): 10-18. Ford, R.C. and Randolph, W.A. (1992) ‘Cross-functional structures: A review and integration of matrix organization and project management’, Journal of Management 18: 267-294. Fornell, C. and Yi, Y. (1992) ‘Assumptions of the two-step approach to latent variable modeling’, Sociological Methods and Research 20: 291-320. Fox, J. (1980) ‘Effect analysis in structural equation models’, Sociological Methods and Research 9: 3-28. Fruin, M. (1996) Knowledge Works. New York: Oxford University Press. Galbraith, J. (1973) Designing Complex Organizations. Reading, MA: Addison-Wesley. Galbraith, J. (1977) Organizational Design. Reading, MA: Addison-Wesley. Galbraith, J. (2001) ‘Building organizations around the global customer’, Ivey Business Journal 66(1): 17-24. George, J.M. (1995) ‘Leader positive mood and group performance: The case of customer service’, Journal of Applied Social Psychology 25(9): 778-794. George, J.M. and Bettenhausen, K. (1990) ‘Understanding prosocial behavior, sales, performance, and turnover: a group-level analysis in a service context’, Journal of Applied Psychology 75(6): 698-709. Gersick, C.J.G. (1988) ‘Time and transition in work teams: Toward a new model of group development’, Academy of Management Journal 31: 9-41.

173
Gersick, C.J.G. (1989) ‘Marking time: Predictable transitions in task groups’, Academy of Management Journal 32: 274-309. Gist, M.E., Locke, E.A. and Taylor, M.S. (1987) ‘Organizational behavior: Group structure, process, and effectiveness’, Journal of Management 13(2): 237-257. Gladstein, D.L. (1984) ‘Groups in context: a model of task group effectiveness’, Administrative Science Quarterly 29: 499-517. Glaser, B. and Strauss, A. (1967) The Discovery of Grounded Theory. Chicago: Aldine. Glick, W., Miller, C. and Huber, G. (1993) ‘The impact of upper echelon diversity on organizational performance’, in Huber, G., Glick, W. (eds.) Organizational Change and Redesign, p. 176-224, New York: Oxford University Press. Goodman, P.S., Devadas, R. and Hughson, T.L.G. (1988) ‘Groups and productivity: Analyzing the effectiveness of self-managing teams’, in Campbell, J.P., Campbell, R.J. (eds.) Productivity in Organizations, p. 295-327, San Francisco: Jossey-Bass. Goodman, P.S., Ravlin, E.C. and Argote, L. (1986) ‘Current thinking about groups: Setting the stage for new ideas’, in Goodman, P.S. (eds.) Designing Effective Work Groups, p. 1-33, San Francisco, CA: Jossey-Bass. Gorsuch, R.L. (1983) Factor analysis. 2nd edition, Hillsdale, NJ: Erlbaum. Gosselin, D.P. and Heene, A. (2005) ‘Strategic implications of a competence-based management approach to account management’, in Sanchez, R., Freiling, J. (eds.) Research in Competence-Based Management, Vol. 1 ‘A Focused Issue on the Marketing Process in Organizational Competence’, p. 177-200, Oxford: Elsevier Science. Gowen, C.R. (1986) ‘Managing work group performance by individual goals and groups goals for an interdependent group task’, Journal of Organizational Behavior Management 7: 5-27. Green, S.B. and Salkind, N.J. (2005) Using SPSS for Windows and Macintosh: Analyzing and Understanding Data. Upper Saddle River, NJ: Pearson/ Prentice-Hall. Greene, J.C., Caracelli, V.J. and Graham, W.F. (1989) ‘Towards a conceptual framework for mixed-method evaluation designs’, Educational Evaluation and Policy Analysis 11(3): 255-274. Gresov, C. (1989) ‘Exploring fit and misfit with multiple contingencies’, Administrative Science Quarterly 34(3): 431-453.

174
Grönroos, C. (1994) ‘Quo vadis, marketing? Toward a relationship marketing paradigm’, Journal of Marketing Management 10(5): 347–360. Guzzo, R.A. and Shea, G.P. (1992) ‘Group performance and intergroup relations in organizations’, in Dunnette, M.D., Hough, L.M. (eds.) Handbook of Industrial and Organizational Psychology, vol. 3, p. 269-313, Palo Alto: Consulting Psychologists Press. Hackman, J.R. (1987) ‘The design of work teams’, in Lorsch J.W. (eds.) Handbook of Organizational Behavior, p. 315-342, Englewood Cliffs, NJ: Prentice-Hall. Hackman, J.R. and Morris, C.G. (1975) ‘Group tasks, group interaction process and group performance effectiveness: A review and proposed integration’, in Berkowitz, L. (ed.) Advances in Experimental Social Psychology, vol. 8, p. 45-99, New York: Academic Press. Hackman, J.R. and Walton, R.E. (1985) The Leadership of Groups in Organizations. New Haven, CT: Yale University Press. Hambrick, D.C., Cho, T. and Chen, M. (1996) ‘The influence of top management team heterogeneity on firms’ competitive moves’, Administrative Science Quarterly 41: 659-684. Hansen, C.J. (1995) ‘Writing the project team: Authority and intertextuality in a corporate setting’, The Journal of Business Communication 32(2): 103-122. Harman, H.H. (1967) Modern Factor Analysis. Chicago: University of Chicago Press. Harvey, M., Myers, M. and Novicevic, M. (2003a) ‘The managerial issues associated with global account management: A relational contract perspective’, Journal of Management Development 22(2): 103-129. Harvey, M., Novicevic, M., Hench, T. and Myers, M. (2003b) ‘Global account management: a supply-side managerial view’, Industrial Marketing Management 32: 563-571. Heberlein, T.A. and Baumgartner, R. (1978) ‘Factors affecting response rates to mailed questionnaires: A quantitative analysis of the published literature’, American Sociological Review 43: 447-462. Heide, J.B. and John, G. (1990) ‘Alliances in industrial purchasing: The determinants of joint action in buyer-supplier relationships’, Journal of Marketing Research 27: 24-36.
175
Henke, J.W., Krachenberg, A.R. and Lyons, T.F. (1993) ‘Cross-functional teams: Good concept, poor implementation’, Journal of Product Innovation Management 10(3): 216-229. Hennessey, H.D. and Jeannet, J.-P. (2003) Global Account Management: Creating Value. Chichester: John Wiley & Sons. Hershock, R.J., Cowman, C.D. and Peters, D. (1994) ‘From experience: Action teams that work’, Journal of Product Innovation Management 11: 95-104. Hitt, M.A., Hoskisson, R.E. and Nixon, R.D. (1993) ‘A mid-range theory of interfunctional integration, its antecedents, and outcomes’, Journal of Engineering and Technology Management 10: 161-185. Holland, S., Gaston, K. and Gomes, J. (2000) ‘Critical success factors for cross-functional teamwork in new product development’, International Journal of Management Reviews 2(3): 231-259. Hollenbeck, J.R., Ilgen, D.R., LePine, J.A., Colquitt, J.A. and Hedlund, J. (1998) ‘Extending the multilevel theory of team decision making: Effects of feedback and experience in hierarchical teams’, Academy of Management Journal 41: 269-282. Homburg, C., Koschate, N. and Hoyer, W.D. (2005) ‘Do satisfied customers really pay more? A study of the relationship between customer satisfaction and willingness to pay’, Journal of Marketing 69: 84-96. Homburg, C., Workman, J. and Jensen, O. (2000) ‘Fundamental changes in the marketing organization: The movement toward a customer-focused organizational structure’, Journal of the Academy of Marketing Science 28(4): 459-478. Homburg, C., Workman, J. and Jensen, O. (2002) ‘A configurational perspective on key account management’, Journal of Marketing 66: 38-60. Hox, J. (2002) Multilevel analysis: Techniques and applications, Mahwah, NJ: Erlbaum. Hu, L. and Bentler, P.M. (1999) ‘Cutoff criteria for fit indexes in covariance structure analysis: Conventional criteria versus new alternatives’, Structural Equation Modeling 6: 1-55. Hutt, M.D., Johnston, W.J. and Ronchetto, J.R. (1985) ‘Selling centers and buying centers: Formulating strategic exchange patterns’, Journal of Personal Selling and Sales Management 5(1): 33-40.

176
Hyatt, D.E. and Ruddy, T.M. (1997) ‘An examination of the relationship between work group characteristics and performance: Once more into the breech’, Personnel Psychology 50(3): 553-585. Jackson, D.L. (2001) ‘Sample size and number of parameter estimates in maximum likelihood confirmatory factor analysis: a Monte Carlo investigation’, Structural Equation Modeling 8(2): 205-223. Janis, I.L. (1972) Victims of Groupthink: A Psychological Study of Foreign-Policy Decisions and Fiascos. Boston: Houghton Mifflin. Jaworski, B.J. and Kohli, A.K. (1993) ’Market orientation: Antecedents and consequences, Journal of Marketing 57(3): 53-70. Jehn, K.A. (1995) ‘A multimethod examination of the benefits and detriments of intragroup conflict’, Administrative Science Quarterly 44(4): 256-282. Jehn, K.A. and Mannix, E.A. (2001) ‘The dynamic nature of conflict: A longitudinal study of intragroup conflict and group performance’, Academy of Management Journal 44(2): 238-251. Jehn, K.E., Northcraft, G.B. and Neale, M.A. (1999) ‘Why differences make a difference: A field study of diversity, conflict, and performance in work groups’, Administrative Science Quarterly 44: 741-763. Johnston, W.J. and Bonoma, T.V. (1981) ‘The buying center: Structure and interaction patterns’, Journal of Marketing 45: 143-156. Jones, E., Dixon, A.L., Chonko, L.B. and Cannon, J.P. (2005) ‘Key accounts and team selling: A review, framework, and research agenda’, Journal of Personal Selling and Sales Management 25(2): 181-198. Jones, T.O. and Sasser, W.E. (1995) ‘Why satisfied customers defect’, Harvard Business Review 73: 88-99. Jöreskog, K.G. and Sörbom, D. (1981) LISREL V: Analysis of linear structural relations by the method of maximum likelihood. Chicago: International Educational Services. Kaiser, H.F. (1958) ‘The varimax criterion for analytic rotation in factor analysis’, Psychometrika 23: 187-200. Katz, R. and Allen, T.J. (1985) ‘Project performance and the locus of influence in the R&D matrix’, Academy of Management Journal 28: 67-87.
177
Katzenbach, J.R. (1987) The Work of Teams. Boston: Harvard Business School Publishing. Katzenbach, J.R. and Smith, D.K. (1993) The Wisdom of Teams: Creating the High Performance Organization. Boston: Harvard Business School Press. Keck, S. and Tushman, M. (1993) ‘Environmental and organizational context and executive team structure’, Academy of Management Journal 36: 1314-1344. Keller, R.T. (1994) ‘Technology-information processing fit and the performance of R&D project groups: A test of contingency theory’, Academy of Management Journal 37(1): 167-179. Keller, R.T. (2001) ‘Cross-functional project groups in research and new product development: Diversity, communication, job stress, and outcomes’, Academy of Management Journal 44(3): 547-555. Kelly, J. and McGrath, J. (1985) ‘Effects of time limits and task types on task performance and interaction on four-person groups’, Journal of Personality and Social Psychology 49: 395-407. Kempeners, M. and van der Hart, H. (1999) ‘Designing account management organizations’, Journal of Business and Industrial Marketing 14(4): 310-327. Kim, Y. and Lee, B. (1995) ‘R&D project team climate and team performance in Korea: A multidimensional approach’, R&D Management 25(2): 179-196. Kirkman, B.L. and Rosen, B. (1999) ‘Beyond self-management: Antecedents and consequences of team empowerment’ Academy of Management Journal 42: 58-74. Kirkman, B.L., Rosen, B., Tesluk, T. and Gibson, C. (2004) ‘The impact of team empowerment on virtual team performance: The moderating role of face-to-face interaction’, Academy of Management Journal 47: 175-192. Kirkman, B.L. and Shapiro, D.L. (2001) ‘The impact of team members’ cultural values on productivity, cooperation, and empowerment in self-managing work teams’, Journal of Cross-Cultural Psychology 32: 597-617. Knight, D., Pearce, C.L., Smith, K.G., Olian, J.D., Sims, H.P., Smith, K.A. and Flood, P. (1999) ‘Top management team diversity, group process, and strategic consensus’, Strategic Management Journal 20: 445-465. Kozlowski, S.W.J., Gully, S.M., Nason, E.R. and Smith, E.M. (1999) ‘Developing adaptive teams: A theory of compilation and performance across levels and time’, in Ilgen, D.R., Pulakos, E.D. (eds.) The changing nature of work performance:

178
Implications for staffing, personnel actions, and development, p. 240-292, San Francisco, CA: Jossey-Bass. Lambe, C. and Spekman, R. (1997) ‘National account management: large account selling or buyer-supplier alliance?’, Journal of Personal Selling and Sales Management 17(4): 61-74. Lau, G., Goh, M. and Phua, S.L. (1999) ‘Purchase-related factors and buying center structure: An empirical assessment’, Industrial Marketing Management 28: 573-587. Lawrence, B.S. (1997) ‘The black box of organizational demography’, Organization Science 8(1): 1-22. Lawrence, P. and Lorsch, J. (1967) ‘Differentiation and integration in complex organizations’, Administrative Science Quarterly 12: 1-47. LePine, J.A., Hollenbeck, J.R. and Ilgen, D.R. (1997) ‘Effects of individual differences on the performance of hierarchical decision making teams: Much more than g’, Journal of Applied Psychology 82(5): 803-811. Lewis, M.W., Welsh, M.A., Dehler, G.E. and Green, S.G. (2002) ‘Product development tensions: Exploring contrasting styles of product management’, Academy of Management Journal 45(3): 546-564. Linsky, A.S. (1975) ‘Stimulating responses to mailed questionnaires: A review’, Public Opinion Quarterly 39: 82-101. MacCallum, R.C., Browne, M.W. and Sugawara, H.M. (1996) ‘Power analysis and determination of sample size for covariance structural modeling’, Psychological Methods 1(2): 130-149. Magjuka, R.J. and Baldwin, T.T. (1991) ‘Team-based employee involvement programs: Effects of design and administration’, Personnel Psychology 44(4): 793-812. Marks, M.A., Mathieu, J.E. and Zaccaro, S.J. (2001) ‘A temporally based framework and taxonomy of team processes’, Academy of Management Review 26(3): 356-376. Mathieu, J.E., Gilson, L.L. and Ruddy, T.M. (2006) ‘Empowerment and team effectiveness: An empirical test of an integrated model’, Journal of Applied Psychology 91(1): 97-108. Matsui, T., Kakuyama, T. and Onglatco, M.U. (1987) ‘Effects of goals and feedback on performance in groups’, Journal of Applied Psychology 72(3): 407-415.
179
McCann, J.E. and Galbraith, J.R. (1981) ‘Interdepartmental relations’, in Nystrom, P.C., Starbuck, W.H. (eds.) Handbook of Organizational Design, vol. 2, p. 60-84, Oxford: Oxford University Press. McCullough, J. and Best, R. (1979) ‘Conjoint measurement: Temporal stability and structural reliability’, Journal of Marketing Research 16(1): 26-31. McDonald, M., Millman, T. and Rogers, B. (1997) ‘Key account management: Theory, practice and challenges’, Journal of Marketing Management 13(8): 737-757. McGrath, J.E. (1964) Social Psychology: A Brief Introduction. Holt, Rinehart and Winston. McGrath, J.E. (1984) Groups: Interaction and Performance. Englewood Cliffs, NJ: Prentice-Hall. McGrath, J.E. (1991) ‘Time, interaction, and performance (TIP): A theory of groups’, Small Group Research 24: 285-306. McGrath, J.E. and Kravitz, D. (1982) ‘Group research’, Annual Review of Psychology 33:195-230. Menon, S.T. (2001) ‘Employee empowerment: An integrative psychological approach’, Applied Psychology: An International Review 50: 153-180. Meyer, A., Tsui, A. and Hinings, C. (1993) ‘Configurational approaches to organizational analysis’, Academy of Management Journal 36(6): 1175-1195. Miles, M.B. and Huberman, A.M. (1994) Qualitative Data Analysis: An Expanded Source Book. Thousand Oaks, CA: Sage. Milliken, F. and Martins, L. (1996) ‘Searching for common threads: Understanding the multiple effects of diversity in organizational groups’, Academy of Management Review 21(2): 402-433. Millman, T. (1996) ‘Global key account management and system selling’, International Business Review 5(6): 631-645. Millman, T. (1999) ‘From national account management to global account management in business-to-business markets’, Thexis 16(4): 2-9. Millman, T. and Wilson, K. (1994) ‘From key account selling to key account management’, Proceedings of the 10th Annual IMP Conference, University of Groningen, The Netherlands, September.

180
Millman, T. and Wilson, K. (1999a) ‘Processual issues in key account management: Underpinning the customer-facing organization’, Journal of Business and Industrial Marketing 14(4): 328-337. Millman, T. and Wilson, K. (1999b) ‘Developing global account management competencies’, Proceedings of the 15th Annual IMP Conference, University College Dublin, September. Mills, P.K. and Ungson, G.R. (2003) ‘Reassessing the limits of structural empowerment: Organizational constitution and trust as controls’, Academy of Management Review 28(1): 143-153. Mishler, E.G. (1986) Research Interviewing: Context and Narrative. Cambridge, MA: Harvard University Press. Moenaert, R.K. and Souder, W.E. (1990) ‘An information transfer model for integrating marketing and R&D personnel in new product development projects’, Journal of Product Innovation Management 7(2): 91-107. Mohr, J. and Spekman, R. (1994) ‘Characteristics of partnership success: Partnership attributes, communication behavior, and conflict resolution’, Strategic Management Journal 15(2): 135-152. Mohrman, S.A., Cohen, S.G. and Mohrman, A.M. (1995) Designing Team-Based Organizations: New Forms for Knowledge Work. San Francisco: Jossey-Bass. Montgomery, D.B. and Yip, G.S. (1999) ‘Statistical evidence on global account management programs’, Thexis 4: 10-13. Montgomery, D.B. and Yip, G.S. (2000) ‘The challenge of global customer management’, Marketing Management 9(4): 22-29. Montgomery, D.B., Yip, G.S. and Villalonga, B. (1998a) ‘The use and performance effect of global account management: An empirical analysis using structural equations modeling’, Research paper No 1481, Graduate School of Business, Stanford University. Montgomery, D.B., Yip, G.S. and Villalonga, B. (1998b) ‘Demand for and use of global account management’, Research paper No 1520, Graduate School of Business, Stanford University. Montgomery, D.B., Yip, G.S. and Villalonga, B. (2001) ‘An industry explanation of global account management’, Research paper No 1724, Graduate School of Business, Stanford University.

181
Montgomery, D.B., Yip, G.S. and Villalonga, B. (2002) ‘Explaining supplier behavior on global account management’, Research paper No 1767, Graduate School of Business, Stanford University. Moon, M.A. and Armstrong, G.M. (1994) ‘Selling teams: A conceptual framework and research agenda’, Journal of Personal Selling and Sales Management 14(1): 17-30. Moon, M.A., Gupta, S.F. (1997) ‘Examining the formation of selling centers: A conceptual framework’, Journal of Personal Selling and Sales Management, vol. 17, no. 2, p. 31-41. Morgan, R. and Hunt, S. (1994) ‘The commitment-trust theory of relationship marketing’, Journal of Marketing 58(3): 20-38. Murray, A.I. (1989) ‘Top management group heterogeneity and firm performance’, Strategic Management Journal 10: 125-141. Nadler, D.A. and Tushman, M.L. (1988) Strategic Organization Design: Concepts, Tools and Processes. Glenview, IL: Scott, Foresman. Napolitano, L. (1997) ‘Customer-supplier partnering: A strategy whose time has come’, Journal of Personal Selling and Sales Management 17(4): 1-8. Narayandas, D., Quelch, J. and Swartz, G. (2000) ‘Prepare your company for global pricing’, Sloan Management Review 42(1): 61-70. Narayandas, D. and Rangan, V.K. (2004) ‘Building and sustaining buyer–seller relationships in mature industrial markets’, Journal of Marketing 68(3): 63–77. Naumann, E. (1995) Creating Customer Value. Cincinnati: Thompson Executive Press. Neumann, G.A. and Wright, J. (1999) ‘Team effectiveness: Beyond skills and cognitive ability’, Journal of Applied Psychology 84: 376-389. Nunnally, J.C. and Bernstein, I.H. (1994) Psychometric Theory. 3rd edition, New York: McGraw-Hill. Olsen, R.F. and Ellram, L.M. (1997) ‘A portfolio approach to supplier relationships’, Industrial Marketing Management 26(2): 101–113. O’Reilly, C. and Roberts, K. (1977) ‘Task group structure, communication, and effectiveness in three organizations’, Journal of Applied Psychology 62: 674-681.

182
O’Reilly, C.A., Caldwell, D.F. and Barnett, W.P. (1989) ‘Work group demography, social integration, and turnover’, Administrative Science Quarterly 34: 21-37. Pardo, C. (1997) ‘Key account management in the business to business field: The key account’s point of view’, Journal of Personal Selling and Sales Management 17(4): 17-26. Pardo, C., Salle, R. and Spencer, R. (1995) ‘The key accountization of the firm: A case study’, Industrial Marketing Management 22: 123-134. Parker, G.M. (1994) Cross-Functional Teams: Working with Allies, Enemies, and Other Strangers. San Francisco: Jossey-Bass. Pasmore, W., Francis, C. and Haldeman, J. (1982) ‘Sociotechnical systems: A North American reflection on empirical studies of the seventies’, Human Relations 35: 1179-1204. Pearce, J.A. and David, F.R. (1983) ‘A social network approach to organizational design-performance’, Academy of Management Review 8: 436-444. Pearson, C. (1992) ‘Autonomous workgroups: An evaluation at an industrial site’, Human Relations 45(9): 905-936. Pelled, L.H., Eisenhardt, K.M. and Xin, K.R. (1999) ‘Exploring the black box: An analysis of work group diversity, conflict, and performance’, Administrative Science Quarterly 44: 1-28. Perry, M.L, Pearce, C.L. and Sims, H.P. (1999) ‘Empowered selling teams: How shared leadership can contribute to selling team outcomes’, Journal of Personal Selling and Sales Management 19(3): 35-51. Peter, J.P. (1979) ‘Reliability: A review of psychometric basics and recent marketing practices’, Journal of Marketing Research 16(1): 6-17. Pfeffer, J. (1983) ‘Organizational demography’, Research in Organizational Behaviour 5: 299-357. Pfeffer, J. (1986) ‘A resource dependence perspective on intercorporate relations’, in Mizruchi, M.S., Schwartz, M. (eds.) Structural Analysis of Business, p. 117-132, New York: Academic Press. Pinto, M.B. and Pinto, J.K. (1990) ‘Project team communication and cross-functional cooperation in new product development’, Journal of Product Innovation Management 7: 200-212.

183
Pinto, M.B., Pinto, J.K. and Prescott, J.E. (1993) ‘Antecedents and consequences of project team cross-functional cooperation’, Management Science 39(10): 1281-1297. Podsakoff, P.M. and Organ, D.W. (1986) ‘Self-reports in organizational research: Problems and prospects’, Journal of Management 12(4): 531-544. Pritchard, R.D., Jones, S., Roth, P., Stuebing, K. and Ekeberg, S. (1988) ‘Effects of group feedback, goal setting, and incentives on organizational productivity’, Journal of Applied Psychology 73(2): 337-358. Puri, S.J. and Korgaonkar, P. (1991) ‘Couple the buying and selling teams’, Industrial Marketing Management 20: 311-317. Robinson, P.J., Faris, C.W. and Wind, Y. (1967) Industrial Buying and Creative Marketing. Boston: Allyn and Bacon, Inc. Rossman, G.B. and Wilson, B.L. (1985) ‘Numbers and words: Combining quantitative and qualitative methods in a single large-scale evaluation study’, Evaluation Review 9(5): 627-643. Ruekert, R.W. and Walker, O.C. (1987) ‘Marketing’s interaction with other functional units: A conceptual framework and empirical evidence’, Journal of Marketing 51: 1-19. Rust, R.T. and Zahorik, A.J. (1993) ‘Customer satisfaction, customer retention, and market share’, Journal of Retailing, 69: 193–215. Salancik, G.R. and Pfeffer, J. (1977) ‘An examination of need-satisfaction models of job attitudes’, Administrative Science Quarterly 22: 427-456. Salas, E, Dickinson, T.L., Converse, S.A. and Tannenbaum, S.I. (1992) ‘Toward an understanding of team performance and training’, in Swezey, R.W., Salas, E. (eds.) Teams: Their Training and Performance, p. 3-29, Norwood, NJ: ABLEX. Scandura, T.A. and Williams, E.A. (2000) ‘Research methodology in management: Current practices, trends, and implications for future research’, Academy of Management Journal 43(6): 1248-1264. Schaefer, D. and Dillman, D.A. (1998) ‘Development of a standard e-mail methodology: Results of an experiment’, Public Opinion Quarterly 62: 378-397. Schultz, R.J. and Evans, K.R. (2002) ‘Strategic collaborative communication by key account representatives’, Journal of Personal Selling and Sales Management 22(1): 23-31.

184
Scott, S.G. (1997) ‘Social identification effects in product and process development teams’, Journal of Engineering and Technology Management 14: 97-127. Seers, A., Petty, M.M. and Cashman, J.F. (1995) ‘Team member exchange under team and traditional management: A naturally occurring quasi-experiment’, Group and Organization Management 20(1): 18-38. Sengupta, S., Krapfel, R. and Pusateri, M. (1997) ‘Switching costs in key account relationships’, Journal of Personal Selling and Sales Management 17(4): 9-16. Senn, C. (1999) ‘Implementing global account management – a process oriented approach’, Journal of Selling and Major Account Management 1(3): 10-19. Senn, C. (2006) ‘The executive growth factor: How Siemens invigorated its customer relationships’, Journal of Business Strategy 27(1): 27-34. Senn, C., Arnold, M. (1999) ‘Managing global customers – benchmarks from an international research project’, Thexis 4: 36-40. Seta, J. (1982) ‘The impact of comparison processes on coactors’ task performance’, Journal of Personality and Social Psychology 42: 281-291. Shapiro, B. and Moriarty, R. (1984) ‘Organizing the national account force’, Marketing Science Institute Working Paper No. 84-101. Cambridge, MA. Sharma, A. (1997) ‘Who prefers key account management programs? An investigation of business buying behavior and buying firm characteristics’, Journal of Personal Selling and Sales Management 17(4): 27-39. Shea, G.P. and Guzzo, R.A. (1987) ‘Group effectiveness: what really matters?’, Sloan Management Review 3: 25-31. Sheth, J.N., Sharma, A. (1997) ‘Supplier relationships: Emerging issues and challenges’, Industrial Marketing Management 26: 91-100. Shi, L.H., Zou, S. and Cavusgil, S. (2004) ‘A conceptual framework of global account management capabilities and firm performance’, International Business Review 13: 539-553. Shi, L.H., Zou, S., White, J.C., McNally, R.C. and Cavusgil, S.T. (2005) ‘Executive insights: global account management capability: insights from leading suppliers’, Journal of International Marketing 13(2): 93–113. Sills, S.J. and Song, C. (2002) ‘Innovations in survey research: An application of web-based surveys’, Social Science Computer Review 20(1): 22-30.

185
Simons, T., Pelled, L.H. and Smith, K.A. (1999) ‘Making use of difference: Diversity, debate, and decision comprehensiveness in top management teams’, Academy of Management Journal 42: 662-673. Simsek, Z., Veiga, J.F. (2001) ‘A primer on internet organizational surveys’, Organizational Research methods 4(3): 218-235. Smith, J.B. and Barclay, D.W. (1990) ‘Theoretical perspectives on selling center research’, in Lichtenthal, D. et al., (eds.) Proceedings of the 1990 AMA Winter Educators’ Conference: Marketing Theory and Applications. Chicago: American Marketing Association. Smith, J.B. and Barclay, D.W. (1993) ‘Team selling effectiveness: A small group perspective’, Journal of Business-to-Business Marketing 1(2): 3-32. Smith, K.G., Smith, K.A., Olian, J.D., Sims, H.P., O’Bannon, D.P. and Scully, J.A. (1994) ‘Top management team demography and process: The role of social integration and communication’, Administrative Science Quarterly (39): 412-438. Snow, C.C. and Thomas, J.B. (1994) ‘Field research methods in strategic management: contributions to theory building and testing’, Journal of Management Studies 31(4): 457-480. Somech, A. (2006) ‘The effects of leadership style and team process on performance and innovation in functionally heterogeneous teams’, Journal of Management 32(1): 132-157. Souder, W. (1987) Managing New Product Innovations. Lexington, MA: Lexington Books. Spekman, R.E. and Johnston, W.J. (1986) ‘Relationship management: Managing the selling and the buying interface’, Journal of Business Research 14: 514-531. Spekman, R.E. and Stern, L.W. (1979) ‘Environmental uncertainty and buying group structure: An empirical investigation’, Journal of Marketing 43: 54-64. Sperry, J.P. (2000) ‘Giant companies, small details: 3M and IBM co-creating value at all levels’, Velocity 2(3): 16-17. Spreitzer, G.M. (1995) ‘Psychological empowerment in the workplace: Dimensions, measurement, and validation’, Academy of Management Journal 38: 1442-1465. Spreitzer, G.M. (1996) ‘Social structural characteristics of psychological empowerment’, Academy of Management Journal 39: 483-504.

186
Srivastava, R.K., Shervani, T.A. and Fahey, L. (1999) ‘Marketing, business processes, and shareholder value: an organizationally embedded view of marketing activities and the discipline of marketing’, Journal of Marketing 63 (Special issue): 168-179. Steiger, J.H. (1990) ‘Structural model evaluation and modification: An interval estimation approach’, Multivariate Behavioral Research 21: 309-331. Steiner, I.D. (1972) Group Process and Productivity. New York: Academic Press. Stevenson, T. (1981) ‘Payoffs from national account management’, Industrial Marketing Management 10: 119-124. Stevenson, T. and Page, A.L. (1979) ‘The adoption of national account marketing by industrial firms’, Industrial Marketing Management 8: 94-100. Stewart, G.L. (2006) ‘A meta-analytic review of relationships between team design features and team performance’, Journal of Management 32(1): 29-54. Strauss, A. and Corbin, J. (1990) Basics of Qualitative Research: Grounded Theory Procedures and Techniques. Newbury Park: Sage. Subramani, M.R. and Venkatraman, N. (2003) ‘Safeguarding investments in asymmetric interorganizational relationships: theory and evidence’, Academy of Management Journal 46(1): 46–62. Sundstrom, E., De Meuse, K.P. and Futrell, D. (1990) ‘Work teams: Applications and effectiveness’, American Psychologist 45: 120-133. Teece, D.J., Pisano, G. and Shuen, A. (1997) ‘Dynamic capabilities and strategic management’, Strategic Management Journal 18(7): 509–533. Thompson, B. (2004) Exploratory and Confirmatory Factor Analysis. Washington DC: American Psychological Association. Tjosvold, D. (1988) ‘Cooperative and competitive interdependence: Collaboration between departments to serve customers’, Group and Organization Studies 13: 274-289. Toulan, O., Birkinshaw, J. and Arnold, D. (2002) ‘The role of inter-organizational fit in global account management’, The Marketing Science Institute Paper. Townsend, J., Yeniyurt, S., Deligonul, S. and Cavusgil, S.T. (2004) ‘Exploring the marketing program antecedents of performance in a global company’, Journal of International Marketing 12(4): 1-24.

187
Tushman, M. (1977) ‘Special boundary roles in the innovation process’, Administrative Science Quarterly 22: 587-605. Tushman, M. (1979) ‘Work characteristics and subunit communication structure: A contingency analysis’, Administrative Science Quarterly 29: 82-98. Tushman, M.L. and Katz, R. (1980) ‘External communication and project performance: An investigation into the role of gatekeepers’, Management Science 26(11): 1071-1085. Van de Ven, A.H. (1976) ‘On the nature, formation and maintenance of relations among organizations’, Academy of Management Review 1(4): 24-36. Van de Ven, A.H. and Drazin, R. (1985) ‘The concept of fit in contingency theory’, in Cummings, L.L. and Staw, B.M. (eds.) Research in Organizational Behavior, p. 333-366, Greenwich, CT: JAI Press. Van der Vegt, G.S. and Bunderson, J.S. (2005) ‘Learning and performance in multidisciplinary teams: the importance of collective team identification’, Academy of Management Journal 48(3): 532-547. Venkatraman, N. and Grant, J.H. (1986) ‘Construct measurement in organizational strategy research: A critique and proposal’, Academy of Management Review 11(1): 71-87. Vinokur-Kaplan, D. (1995) ‘Treatment teams that work (and those that don’t): An application of Hackman’s group effectiveness model to interdisciplinary teams in psychiatric hospitals’, Journal of Applied Behavioral Science 31(3): 303-327. Wagner, W.G., Pfeffer, J. and O’Reilly, C.A. (1984) ‘Organizational demography and turnover in top-management groups’, Administrative Science Quarterly 29: 74-92. Wall, T.D., Kemp, N.J., Jackson, P.R. and Clegg, C.W. (1986) ‘Outcomes of autonomous workgroups: A long-term field experiment’, Academy of Management Journal 29: 281-304. Wall, V.D. and Nolan, L.L. (1986) ‘Perceptions of inequity, satisfaction, and conflict in task-oriented groups’, Human Relations 39: 1033-1051. Watson, W.E., Kumar, K. and Michaelsen, L.K. (1993) ‘Cultural diversity’s impact on interaction process and performance: Comparing homogeneous and diverse task groups’, Academy of Management Journal 36: 590-602. Webber, S.S. and Donahue, L.M. (2001) ‘Impact of highly or less job-related diversity on work group cohesion and performance: A meta-analysis’, Journal of Management 27: 141-162.
188
Webster, F.E. (1992) ‘The changing role of marketing in the corporation’, Journal of Marketing 56(4): 1-17. Weeks, W. and Stevens, C. (1997) ‘National account management sales training and directions for improvement’, Industrial Marketing Management 26: 423-431. Weilbaker, D. and Weeks, W. (1997) ‘The evolution of national account management: A literature perspective’, Journal of Personal Selling and Sales Management 17(4): 49-59. Weldon, E. and Weingart, L.R. (1993) ‘Group goals and group performance’, British Journal of Social Psychology 32: 307-334. Wellins, R.S., Byham, W. and Wilson, J. (1991) Empowered Teams: Creating Self-Directed Work Groups That Improve Quality, Productivity, and Participation. San Francisco: Jossey-Bass. Williams, K.Y. and O’Reilly, C.A. (1998) ‘Demography and diversity in organizations: A review of 40 years of research’, in Staw, B.M., Cummings, L.L. (eds.) Research in Organizational Behavior, vol. 20, p. 77-140, Greenwich, CT: JAI Press. Williams, R.J., Hoffman, J.J. and Lamont, B.T. (1995) ‘The influence of top management team characteristics on M-form implementation time’, Journal of Management Issues 7: 466-480. Wilson, D.T. (1995) ‘An integrated model of buyer-supplier relationships’, Journal of the Academy of Marketing Science 23: 335-345. Wilson, E.J., Lilien, G.L. and Wilson, D.T. (1991) ‘Developing and testing a contingency paradigm of group choice in organizational buying’, Journal of Marketing Research 28: 452-466. Wilson, K. (1999) ‘Developing global account management programmes: Observations from a GAM panel presentation’, Thexis 4: 30-35. Wilson, K. and Croom, S. (1999) ‘Defining global account attractiveness’, Velocity 1(2): 25-28, 33, 48. Wilson, K., Croom, S., Millman, T. and Weilbaker, D. (2000) The Global Account Management Study Research Report. Southampton, UK: The Sales Research Trust. Wilson, K. and Millman, T. (2003) ‘The global account manager as political entrepreneur’, Industrial Marketing Management 32: 151-158.

189
Wilson, K., Speare, N. and Reese, S. (2002) Successful Global Account Management: Key Strategies and Tools for Managing Global Customers. Kogan Page. Woodruff, R.B. (1997) ‘Customer value: the next source of competitive advantage’, Journal of the Academy of Marketing Science 25(2): 139–153. Workman, J., Homburg, C. and Jensen, O. (2003) ‘Intraorganizational determinants of key account management effectiveness’, Journal of the Academy of Marketing Science 31(1): 3-21. Wotruba, T. and Castleberry, S. (1993) ‘Job analysis and hiring practices for national account marketing positions’, Journal of Personal Selling and Sales Management 13(3): 49-65. Yip, G.S. (1989) ‘Global strategy… in a world of nations?’, Sloan Management Review 31(1): 29-41. Yip, G.S. and Madsen, T.L. (1996) ‘Global account management: The new frontier in relationship marketing’, International Marketing Review 13(3): 24-42. Zerbe, W.J. and Paulhus, D.L. (1987) ‘Socially desirable responding in organizational behaviour: A reconception’, Academy of Management Review 12(2): 250-264. Zhang, Y. (2000) ‘Using the internet for survey research: A case study’, American Society for Information Science 51: 57-68. Zirger, B.J. and Maidique, M.A. (1990) ‘A model of new product development: An empirical test’, Management Science 36(7): 867-883. Zou, S. and Cavusgil, S.T. (2002) ‘The GMS: A broad conceptualization of global marketing strategy and its effect on firm performance’, Journal of Marketing 66(4): 40-56.

19
0
App
endi
x A
: Acc
ount
Man
agem
ent L
itera
ture
G
loba
l Acc
ount
Man
agem
ent
Aut
hors
Fo
cus
Met
hod
and
Sam
ple
Find
ings
C
ontr
ibut
ions
L
imita
tions
Mill
man
(199
6)
Org
aniz
atio
n,
syst
ems
inte
grat
ion,
role
of
the
glob
al
acco
unt
man
ager
, im
plem
enta
tion
Des
crip
tive,
cas
e st
udie
s •
GA
M ro
le re
quire
men
ts fo
r suc
cess
ful s
yste
ms
selli
ng in
clud
e co
ordi
natio
n, k
ey a
ccou
nt p
lann
ing,
ex
tern
al a
nd in
tern
al re
latio
nshi
p m
anag
emen
t, sa
les a
nd p
rofit
resp
onsi
bilit
y, n
egot
iatio
n,
mul
ticul
tura
l tea
mw
ork
One
of t
he fi
rst a
rticl
es to
st
udy
vario
us G
AM
as
pect
s
Yip
and
Mad
sen
(199
6)
Glo
baliz
atio
n,
glob
al st
rate
gy
of G
AM
Cas
e st
udie
s •
The
use
and
perf
orm
ance
eff
ects
of G
AM
are
co
ntin
gent
on
indu
stry
- and
firm
-spe
cific
fact
ors.
•
GA
M su
cces
s fac
tors
: con
sist
ent w
orld
wid
e se
rvic
e, o
ne p
oint
of c
onta
ct, p
artn
erin
g w
ith th
e cu
stom
er, o
utso
urci
ng, c
oord
inat
ion
acro
ss re
gion
s.
Dev
elop
s a fr
amew
ork
linki
ng g
loba
lizat
ion
driv
ers a
nd n
eed
for G
AM
w
ith o
rgan
izat
ion
resp
onse
, stra
tegy
, and
im
plem
enta
tion
Mai
nly
qual
itativ
e an
d de
scrip
tive.
Arn
old,
B
irkin
shaw
, and
To
ulan
(199
9)
Org
aniz
atio
n an
d co
ordi
natio
n of
ac
tiviti
es
Expl
orat
ory
field
re
sear
ch, 5
0+ in
terv
iew
s w
ith e
xecu
tives
from
15
com
pani
es in
Eur
ope
and
Nor
th A
mer
ica
• G
AM
stru
ctur
es a
re c
ostly
to im
plem
ent.
• M
ain
obst
acle
s: d
iffic
ultie
s to
alig
n lo
cal a
nd g
loba
l or
gani
zatio
ns, G
AM
as a
pro
cess
dev
elop
s fas
ter
than
GA
M a
s a fo
rm. G
AM
stru
ctur
es a
re m
ainl
y ex
perim
enta
l and
subj
ect t
o re
-des
ign.
Sugg
ests
an
agen
da fo
r im
plem
entin
g G
AM
st
ruct
ures
, add
ress
ing
thre
e le
vels
of i
ssue
s:
stra
tegi
c, o
rgan
izat
iona
l ,a
nd m
arke
ting.
Qua
litat
ive
rese
arch
w
ith a
rela
tivel
y sm
all
sam
ple
size
.
Mon
tgom
ery,
Y
ip, a
nd
Vill
alon
ga
(199
8a, 1
998b
);
Mon
tgom
ery
and
Yip
(199
9,
2000
)
Driv
ers o
f G
AM
, m
anag
ers,
info
rmat
ion,
pe
rfor
man
ce
Surv
ey re
spon
ses o
f 191
ex
ecut
ives
from
165
co
mpa
nies
from
four
so
urce
s: m
ail s
urve
y an
d th
ree
conv
enie
nce
sam
ples
from
exe
cutiv
e ed
ucat
ion
prog
ram
s
• Si
gnifi
cant
rela
tions
hip
betw
een
cust
omer
gl
obal
izat
ion
and
dem
and
for G
AM
. •
Dem
and
for G
AM
is in
crea
sing
, and
supp
liers
will
m
ake
grea
ter u
se o
f it i
n th
e fu
ture
. •
Glo
bal p
rices
not
the
mos
t dem
ande
d as
pect
; rat
her,
cons
iste
ncy
in se
rvic
e is
. •
The
grea
ter t
he c
usto
mer
dem
and,
the
grea
ter i
ts
use
by th
e su
pplie
r.
• Su
pplie
rs p
rovi
de a
lagg
ed re
spon
se to
GA
M
dem
and.
•
The
mos
t use
d to
ols o
f GA
M a
re a
ccou
nt m
anag
ers
and
supp
ort t
eam
s.
• Th
e be
tter t
he re
spon
se to
dem
and,
the
grea
ter i
ts
effe
ct o
n su
pplie
r per
form
ance
.
Firs
t em
piric
al m
easu
res
and
test
s of G
AM
.
Prov
ides
evi
denc
e of
pe
rfor
man
ce
impr
ovem
ents
.
Test
s the
fram
ewor
k of
Y
ip a
nd M
adse
n (1
996)
an
d de
velo
ps a
mod
el o
f G
AM
link
ing
cust
omer
s’
dem
and
for G
AM
and
su
pplie
rs’ r
espo
nses
.
Poss
ible
bia
ses d
ue to
th
e ch
oice
of s
ampl
es.

19
1
A
utho
rs
Focu
s M
etho
d an
d Sa
mpl
e Fi
ndin
gs
Con
trib
utio
ns
Lim
itatio
ns
Senn
(199
9)
GA
M
impl
emen
tatio
n pr
oces
s
Fram
ewor
k de
velo
pmen
t : s
urve
y of
87
Swis
s bu
sine
ss-to
-bus
ines
s co
mpa
nies
, 10
impl
emen
tatio
n pr
ojec
ts.
Firs
t tes
t: su
rvey
re
spon
ses f
rom
18
man
ager
s of a
Sw
iss
man
ufac
turin
g co
mpa
ny.
• G
AM
impl
emen
tatio
n pa
sses
thro
ugh
thre
e st
eps
each
incl
udin
g th
ree
key
deci
sion
s: d
efin
ing
goal
s (b
usin
ess p
artn
ers,
prod
ucts
and
serv
ices
, peo
ple)
, al
igni
ng b
usin
ess p
roce
sses
(rel
atio
nshi
p m
anag
emen
t, ta
sk m
anag
emen
t, m
anag
emen
t st
ruct
ures
), an
d in
stal
ling
lear
ning
pro
cess
es
(lear
ning
pro
cess
es, s
ucce
ss m
easu
rem
ent,
info
rmat
ion
man
agem
ent).
Com
bine
s tw
o pe
rspe
ctiv
es o
f GA
M, t
he
wor
king
leve
ls a
nd th
e w
orki
ng p
roce
ss, t
o cr
eate
a
dyna
mic
and
hol
istic
fr
amew
ork
for G
AM
im
plem
enta
tion.
Dev
elop
men
t of t
he
fram
ewor
k is
at a
n ea
rly
stag
e. F
urth
er
poss
ibili
ties t
o te
st a
nd
valid
ate
it.
Senn
and
A
rnol
d (1
999)
G
AM
im
plem
enta
tion
proc
ess
Surv
ey re
spon
ses f
rom
20
0 m
anag
ers i
n 6
com
pani
es; i
nter
view
s an
d fo
cus g
roup
s
• C
usto
mer
satis
fact
ion
is p
ositi
vely
rela
ted
to n
ine
field
s on
thre
e le
vels
(stra
tegi
c, o
pera
tiona
l, an
d ta
ctic
al).
•
Seve
n of
the
field
s hav
e a
sign
ifica
nt im
pact
.
Empi
rical
ly te
sts a
nd
valid
ates
a m
odel
that
al
low
s tak
ing
an
inte
grat
ed a
ppro
ach
to
GA
M im
plem
enta
tion
cove
ring
thre
e pr
oces
s le
vels
of i
mpo
rtanc
e.
Wils
on (1
999)
G
AM
pro
gram
in
trodu
ctio
n,
capa
bilit
y de
velo
pmen
t, su
stai
ning
the
effo
rt
Pane
l pre
sent
atio
n in
clud
ing
shor
t cas
e st
udie
s of f
ive
com
pani
es.
• Id
entif
ies p
robl
ems o
f ini
tiatin
g G
AM
pro
gram
. •
The
mai
n su
cces
s fac
tors
are
seni
or m
anag
emen
t co
mm
itmen
t, go
ing
beyo
nd p
rodu
ct-r
elat
ed is
sues
, sk
illed
peo
ple.
Des
crib
es b
est p
ract
ices
. R
elat
es c
usto
mer
se
lect
ion
crite
ria to
the
stag
es o
f GA
M
deve
lopm
ent.
Stud
ies a
sm
all n
umbe
r of
com
pani
es.
Rel
ativ
ely
inco
nclu
sive
fin
ding
s tha
t do
not
allo
w fo
r ge
nera
lizat
ions
.
Nar
ayan
das,
Que
lch,
and
Sw
artz
(200
0)
Glo
bal p
ricin
g co
ntra
cts
Fiel
d re
sear
ch, 5
0+ in
-de
pth
inte
rvie
ws w
ith
seni
or G
AM
exe
cutiv
es
• Id
entif
ies s
ix so
urce
s of v
aria
nce
acro
ss m
arke
ts.
• Su
cces
s of g
loba
l pric
ing
cont
ract
dep
ends
on
cust
omer
’s to
p m
anag
emen
t sup
port,
syst
emat
ic
impl
emen
tatio
n at
all
leve
ls, s
imila
r loc
al m
arke
ts,
cust
omer
focu
s on
valu
e en
hanc
emen
t, sh
are
of
purc
hase
s, re
latio
nshi
ps w
ith lo
cal m
anag
ers.
Ove
rvie
w o
f the
mai
n ch
alle
nges
and
risk
s of
glob
al p
ricin
g co
ntra
cts.
A c
heck
list f
or su
pplie
rs.
Wils
on, C
room
, M
illm
an, a
nd
Wei
lbak
er
(200
0)
Glo
bal a
ccou
nt
sele
ctio
n, G
AM
co
mpe
tenc
ies,
stra
tegi
c ap
proa
ches
to
GA
M, b
arrie
rs
to
impl
emen
tatio
n
159
resp
onse
s fro
m a
qu
antit
ativ
e po
stal
su
rvey
, 21
in-d
epth
st
ruct
ured
inte
rvie
ws,
stru
ctur
ed w
orks
hops
, se
cond
ary
data
ana
lysi
s, 5
long
itudi
nal c
ase
stud
ies
• Fi
ndin
gs c
over
driv
ers o
f glo
baliz
atio
n, a
ccou
nt
sele
ctio
n, o
rgan
izat
iona
l sup
port,
GA
M
com
pete
ncie
s, G
AM
stra
tegi
es, r
ole
of th
e gl
obal
ac
coun
t man
ager
, blo
cks t
o G
AM
.
Ana
lyze
s a b
road
rang
e of
is
sues
. Pro
vide
s a
fram
ewor
k fo
r ana
lyzi
ng
the
role
of t
he g
loba
l ac
coun
t man
ager
.
Des
crip
tive
rese
arch
, la
ck o
f mor
e ad
vanc
ed
quan
titat
ive
supp
ort.

19
2
A
utho
rs
Focu
s M
etho
d an
d Sa
mpl
e Fi
ndin
gs
Con
trib
utio
ns
Lim
itatio
ns
Arn
old,
Bel
z,
and
Senn
(200
1)
GA
M
know
ledg
e m
anag
emen
t
Expl
orat
ory,
4 c
ase
stud
ies b
ased
on
wor
ksho
ps a
nd 7
0 in
terv
iew
s
• G
AM
driv
es k
now
ledg
e tra
nsfe
rs.
• K
now
ledg
e m
anag
emen
t is p
artly
dev
elop
ed. M
ain
obst
acle
s: in
suff
icie
nt u
se o
f com
mon
IT p
latfo
rms
wor
ldw
ide,
mar
ketin
g in
form
atio
n sy
stem
s, an
d m
arke
ting
know
-how
.
Gui
delin
es fo
r im
plem
entin
g th
e th
ree
know
ledg
e pr
oces
ses:
ge
nera
tion,
dis
sem
inat
ion,
re
spon
sive
ness
.
Smal
l sam
ple
of
com
pani
es.
Arn
old,
B
irkin
shaw
, and
To
ulan
(200
1)
Stra
tegy
and
im
plem
enta
tion
of G
AM
; cu
stom
er
asse
ssm
ent.
Stag
e I:
face
-to-f
ace
inte
rvie
ws w
ith 3
5 m
anag
ers i
n 10
co
mpa
nies
. St
age
II: S
urve
y re
spon
ses f
rom
107
gl
obal
acc
ount
m
anag
ers,
55 n
atio
nal
sale
s man
ager
s, an
d 10
ex
ecut
ives
in 1
6 co
mpa
nies
.
• G
AM
lead
s to
cent
raliz
atio
n of
act
iviti
es a
nd
dow
nwar
d pr
essu
re o
n pr
ices
and
has
no
sign
ifica
nt
impa
ct o
n sa
les g
row
th.
• It
is im
porta
nt to
cla
rify
the
role
of t
he G
AM
team
, in
trodu
ce a
real
istic
ince
ntiv
e st
ruct
ure,
pic
k th
e rig
ht G
AM
, cre
ate
a st
rong
supp
ort n
etw
ork,
and
bu
ild c
usto
mer
rela
tions
hips
on
mor
e th
an o
ne
leve
l.
• A
mod
el to
ass
ess
bala
nce
of p
ower
and
ap
prop
riate
type
of
rela
tions
hip.
•
Five
less
ons f
or
GA
M im
plem
enta
tion
succ
ess.
Doe
s not
pro
vide
co
mpl
ete
rese
arch
m
etho
dolo
gy a
nd
resu
lts.
Birk
insh
aw,
Toul
an, a
nd
Arn
old
(200
1)
Fact
ors
dete
rmin
ing
acco
unt
perf
orm
ance
Surv
ey re
spon
ses f
rom
10
6 gl
obal
acc
ount
m
anag
ers f
rom
16
com
pani
es.
• Ef
ficie
ncy
and
sale
s gro
wth
pre
dict
ed b
y bo
th
info
rmat
ion-
proc
essi
ng a
nd re
sour
ce-d
epen
denc
y va
riabl
es (s
cope
of a
ccou
nt, s
uppo
rt sy
stem
s, co
mm
unic
atio
n, a
ccou
nt c
entra
lizat
ion,
cus
tom
er
depe
nden
ce).
• Pa
rtner
ship
with
cus
tom
er is
pre
dict
ed b
y cu
stom
er
depe
nden
ce a
nd c
ontro
l var
iabl
es (e
xper
ienc
e of
ac
coun
t man
ager
and
firm
dum
my
varia
bles
).
Take
s a n
ew a
ppro
ach
to
GA
M b
y lin
king
it to
two
orga
niza
tion
theo
ries—
info
rmat
ion
proc
essi
ng
and
reso
urce
dep
ende
ncy.
All
data
col
lect
ed fr
om
the
sam
e so
urce
(c
omm
on-m
etho
d bi
as).
Onl
y 16
com
pani
es;
risk
that
resp
onse
s are
no
t ind
epen
dent
.
Mon
tgom
ery,
Y
ip, a
nd
Vill
alon
ga
(200
1, 2
002)
Dem
and
and
supp
ly o
f GA
M
Surv
ey re
spon
ses o
f 191
ex
ecut
ives
from
165
co
mpa
nies
from
four
so
urce
s: m
ail s
urve
y an
d th
ree
conv
enie
nce
sam
ples
from
exe
cutiv
e ed
ucat
ion
prog
ram
s
• Su
pplie
r’s i
ndus
try g
loba
lizat
ion
driv
ers d
eter
min
e cu
stom
er’s
deg
ree
of g
loba
l pur
chas
ing.
•
Supp
lier’
s ind
ustry
glo
baliz
atio
n dr
iver
s det
erm
ine
cust
omer
dem
and
for G
AM
. •
Sign
ifica
nt re
latio
nshi
p be
twee
n cu
stom
er’s
deg
ree
of g
loba
l pur
chas
ing
and
dem
and
for G
AM
. •
The
grea
ter t
he c
usto
mer
dem
and,
the
grea
ter t
he
use
by th
e su
pplie
r.
• Th
e be
tter t
he re
spon
se to
dem
and,
the
grea
ter t
he
effe
ct o
n su
pplie
r per
form
ance
.
Add
s to
earli
er
fram
ewor
ks. P
rovi
des
quan
titat
ive
evid
ence
for
perf
orm
ance
im
prov
emen
ts.
Poss
ible
bia
ses d
ue to
th
e ch
oice
of s
ampl
es.
Use
of t
he sa
me
data
as
prev
ious
stud
ies.

19
3
A
utho
rs
Focu
s M
etho
d an
d Sa
mpl
e Fi
ndin
gs
Con
trib
utio
ns
Lim
itatio
ns
Birk
insh
aw a
nd
Terje
sen
(200
2)
Org
aniz
atio
n de
sign
/stru
ctur
e C
ase
stud
ies
• C
usto
mer
-foc
used
org
aniz
atio
nal s
truct
ures
are
co
mpe
ting
with
and
repl
acin
g tra
ditio
nal s
truct
ures
su
ch a
s pro
duct
div
isio
n, a
rea
divi
sion
, or p
rodu
ct-
area
mat
rix.
An
over
view
of t
he
vario
us ty
pes o
f cu
stom
er-f
ocus
ed
stru
ctur
es w
ith th
eir p
ros
and
cons
.
Insu
ffic
ient
em
piric
al
supp
ort.
Hom
burg
, W
orkm
an, a
nd
Jens
en (2
002)
Act
iviti
es,
man
ager
s, re
sour
ces,
stru
ctur
e
Num
eric
al ta
xono
my
base
d on
surv
ey
resp
onse
s fro
m 2
64
Ger
man
firm
s and
121
U
.S. f
irms
• Th
e m
ain
KA
M d
imen
sion
s are
act
iviti
es, a
ctor
s, re
sour
ces,
and
appr
oach
form
aliz
atio
n.
• Th
ere
are
eigh
t KA
M a
ppro
ache
s: to
p-m
anag
emen
t K
AM
, mid
dle-
man
agem
ent K
AM
, ope
ratin
g-le
vel
KA
M, c
ross
-fun
ctio
nal d
omin
ant K
AM
, un
stru
ctur
ed K
AM
, iso
late
d K
AM
, cou
ntry
-clu
b K
AM
, and
no
KA
M.
• Th
ere
are
sign
ifica
nt p
erfo
rman
ce d
iffer
ence
s am
ong
the
appr
oach
es w
ith c
ross
-fun
ctio
nal
dom
inan
t KA
M sh
owin
g th
e hi
ghes
t val
ues f
or
alm
ost a
ll va
riabl
es.
• C
onso
lidat
es p
revi
ous
rese
arch
usi
ng a
co
nfig
urat
iona
l pe
rspe
ctiv
e.
• Ex
tend
s res
earc
h to
co
mpa
nies
with
out
form
aliz
ed K
AM
pr
ogra
ms.
• Th
e fir
st st
udy
to
empi
rical
ly c
lass
ify
orga
niza
tiona
l ap
proa
ches
to se
lling
.
Stat
ic si
ngle
-info
rman
t re
sear
ch d
esig
n, w
hich
fo
cuse
s on
only
one
si
de o
f the
selle
r–bu
yer
dyad
.
Toul
an,
Birk
insh
aw, a
nd
Arn
old
(200
2)
Cus
tom
er–
supp
lier m
atch
Su
rvey
resp
onse
s fro
m
106
glob
al a
ccou
nt
man
ager
s fro
m 1
6 co
mpa
nies
.
• Ef
ficie
ncy
and
sale
s gro
wth
are
pre
dict
ed b
y st
rate
gic
impo
rtanc
e, a
ctiv
ity c
onfig
urat
ion,
and
ex
ecut
ive
supp
ort f
it.
• Pa
rtner
ship
s with
cus
tom
ers a
re p
redi
cted
by
mar
ketin
g st
rate
gy a
nd e
xecu
tive
supp
ort f
it.
App
lies c
once
pts t
hat
have
not
bee
n st
udie
d in
re
latio
n to
GA
M b
efor
e.
Doe
s not
con
side
r the
cu
stom
er p
ersp
ectiv
e.
Ana
lyze
s a li
mite
d nu
mbe
r of f
it as
pect
s.
Har
vey,
Mye
rs,
and
Nov
icev
ic
(200
3a)
GA
M
rela
tions
hips
C
once
ptua
l •
Use
s rel
atio
nal c
ontra
ctin
g th
eory
to st
udy
the
ratio
nale
and
cha
lleng
es o
f dev
elop
ing
GA
M
rela
tions
hips
.
Dev
elop
s a st
ep-b
y-st
ep
GA
M im
plem
enta
tion
plan
.
Entir
ely
liter
atur
e ba
sed.
Har
vey,
N
ovic
evic
, H
ench
, and
M
yers
(200
3b)
Supp
ly
man
ager
s’ ro
le
adap
tatio
ns/v
ari
atio
ns
Con
cept
ual,
theo
ry-
base
d •
The
supp
ly m
anag
er’s
role
is c
hang
ing
due
to th
e de
man
ds o
f glo
bal c
usto
mer
s.
• G
AM
role
var
iatio
ns d
epen
d on
the
envi
ronm
enta
l co
nditi
ons a
nd th
e sc
ope
of th
e su
pplie
r–cu
stom
er
rela
tions
hip.
•
The
chal
leng
es fo
r GA
M te
ams a
re p
lura
lity
of
man
ager
ial a
utho
ritie
s and
mul
tiplic
ity o
f GA
M
units
, mai
ntai
ning
flex
ibili
ty to
ach
ieve
con
certe
d ef
ficie
ncy,
secu
ring
cont
inui
ng in
tern
al
orga
niza
tiona
l sup
port,
mul
tidim
ensi
onal
ity o
f tas
k m
anag
emen
t, m
ultis
kill
dem
ands
for e
ffec
tive
supp
ly m
anag
emen
t.
Firs
t stu
dy to
use
re
latio
nal c
ontra
ctin
g th
eory
and
the
know
ledg
e-ba
sed
view
in
rela
tion
to G
AM
.
Entir
ely
liter
atur
e ba
sed.

19
4
Aut
hors
Fo
cus
Met
hod
and
Sam
ple
Find
ings
C
ontr
ibut
ions
L
imita
tions
Wils
on a
nd
Mill
man
(200
3)
Glo
bal a
ccou
nt
man
ager
role
Li
tera
ture
-bas
ed
• D
epen
ding
on
the
degr
ee o
f the
glo
bal a
ccou
nt
man
ager
’s id
entif
icat
ion
with
the
acco
unt a
nd
empl
oyer
, the
re a
re fo
ur G
AM
role
s: se
lf-se
rver
, re
nega
de, p
artis
an, a
nd a
rbite
r.
• Th
e de
gree
to w
hich
the
GA
M e
xerc
ises
pol
itica
l an
d en
trepr
eneu
rial s
kills
dep
ends
on
the
leve
ls o
f or
gani
zatio
nal c
ompl
exity
and
cul
tura
l div
ersi
ty
and
the
degr
ee o
f org
aniz
atio
nal i
nter
depe
nden
ce
and
inte
grat
ion.
Bui
lds o
n th
e po
litic
al
entre
pren
eur m
odel
of
Wils
on e
t al.
(200
0) a
nd
rela
tes d
iffer
ent G
AM
ro
les t
o th
e R
elat
ions
hip
Dev
elop
men
t Mod
el o
f M
illm
an a
nd W
ilson
(1
994)
.
Con
cept
ual w
ith li
mite
d em
piric
al su
ppor
t.
Wor
kman
, H
ombu
rg, a
nd
Jens
en (2
003)
Act
iviti
es,
man
ager
s, re
sour
ces,
stru
ctur
e
Surv
ey re
spon
ses f
rom
26
4 G
erm
an fi
rms a
nd
121
U.S
. firm
s
• In
tens
ity a
nd p
roac
tiven
ess o
f KA
M a
ctiv
ities
, top
m
anag
emen
t inv
olve
men
t, an
d re
sour
ces a
re
posi
tivel
y re
late
d to
KA
M e
ffec
tiven
ess.
• K
AM
eff
ectiv
enes
s is p
ositi
vely
rela
ted
to
perf
orm
ance
in m
arke
t, w
hich
affe
cts p
rofit
abili
ty.
• K
AM
app
roac
h fo
rmal
izat
ion
is n
egat
ivel
y re
late
d to
KA
M e
ffect
iven
ess.
• Pe
rfor
man
ce e
ffec
ts a
re m
oder
ated
by
mar
ket
dyna
mis
m a
nd c
ompe
titiv
e in
tens
ity.
• D
evel
ops a
mod
el th
at
links
spec
ific
capa
bilit
ies t
o pe
rfor
man
ce.
• Te
sted
em
piric
ally
.
• Po
ssib
le b
iase
s due
to
cro
ss-s
ectio
nal
desi
gn w
ith a
sing
le
info
rman
t. •
Inte
ract
ions
bet
wee
n co
nstru
cts a
nd
mod
erat
ors a
re n
ot
cons
ider
ed.
Shi,
Zou,
and
C
avus
gil (
2004
) G
AM
ca
pabi
litie
s C
once
ptua
l •
Col
labo
ratio
n or
ient
atio
n, G
AM
stra
tegi
c fit
, and
G
AM
con
figur
atio
n ha
ve p
ositi
ve e
ffect
s on
the
dyad
ic c
ompe
titiv
e ad
vant
age
and
the
join
t pro
fit
perf
orm
ance
. •
Goa
l con
grue
nce
and
com
plem
enta
ry re
sour
ces
have
a p
ositi
ve e
ffec
t on
colla
bora
tion
orie
ntat
ion,
G
AM
stra
tegi
c fit
, and
GA
M c
onfig
urat
ion.
• B
uild
s on
earli
er
rese
arch
to d
evel
op a
br
oade
r mod
el o
f GA
M
capa
bilit
ies a
nd
perf
orm
ance
. •
Incl
udes
bot
h si
des o
f th
e bu
yer–
selle
r dya
d an
d th
eir j
oint
pe
rfor
man
ce.
Con
cept
ual,
not t
este
d em
piric
ally
.

19
5
Nat
iona
l and
Key
Acc
ount
Man
agem
ent
A
utho
rs
Focu
s M
etho
d an
d Sa
mpl
e Fi
ndin
gs
Con
trib
utio
ns
Lim
itatio
ns
Stev
enso
n (1
981)
B
enef
its o
f N
AM
In
terv
iew
s w
ith 3
4 ex
ecut
ives
in 3
3 co
mpa
nies
• Th
e m
ain
bene
fits o
f int
rodu
cing
nat
iona
l acc
ount
m
anag
emen
t are
incr
ease
d sh
are
of sa
les,
impr
oved
pr
ofita
bilit
y, a
nd im
prov
ed tw
o-w
ay b
uyer
–sel
ler
com
mun
icat
ion.
•
Add
ition
al a
dvan
tage
s inc
lude
mai
ntai
ning
pos
ition
at
the
acco
unt,
parti
cipa
ting
in p
resu
med
gro
wth
at
the
acco
unt,
and
impr
oved
new
pro
duct
acc
epta
nce.
Find
s evi
denc
e of
pos
itive
pe
rfor
man
ce e
ffect
s.
Shap
iro a
nd
Mor
iarty
(198
4)
NA
M st
ruct
ures
Fi
eld
rese
arch
of 1
9 co
mpa
nies
•
The
maj
or o
rgan
izat
iona
l opt
ions
are
no
NA
M
prog
ram
, par
t-tim
e pr
ogra
m, f
ull-t
ime
prog
ram
at
oper
atin
g un
it le
vel,
corp
orat
e-le
vel p
rogr
am, a
nd
natio
nal a
ccou
nt d
ivis
ion.
How
ever
, the
re is
no
perf
ect s
olut
ion,
and
the
mos
t app
ropr
iate
stru
ctur
e de
pend
s on
the
envi
ronm
ent.
• R
elat
ed is
sues
are
the
amou
nt o
f sup
port
by th
e sa
les f
orce
, the
inte
grat
ion
of sa
les-
rela
ted
func
tions
, loc
atio
n an
d ro
le o
f sta
ff sp
ecia
lists
, ca
reer
pat
hs, p
ower
, and
aut
horit
y.
Ver
y de
taile
d an
alys
is o
f st
ruct
ural
alte
rnat
ives
w
ith th
eir a
dvan
tage
s and
di
sadv
anta
ges.
Mos
tly c
once
ptua
l.
Col
letti
and
Tu
brid
y (1
987)
Pr
ogra
m
stru
ctur
e, th
e ac
coun
t m
anag
er,
mea
sure
men
t
Surv
ey o
f 105
NA
MA
m
embe
r com
pani
es
• Id
entif
ies t
he m
ost c
omm
on p
atte
rns i
n or
gani
zatio
n st
ruct
ure
and
job
defin
ition
, tim
e al
loca
tion,
ac
coun
t man
ager
skill
s req
uire
d, c
ompe
nsat
ion,
and
m
easu
rem
ent a
rran
gem
ents
.
Prov
ides
an
over
view
of
the
acco
unt m
anag
er ro
le
supp
orte
d by
em
piric
al
resu
lts.
Bas
ed o
n re
spon
ses
only
from
NA
MA
m
embe
rs.
Wot
ruba
and
C
astle
berr
y (1
993)
NA
M m
anag
er
107
surv
ey re
spon
ses
from
NA
MA
mem
bers
•
Mos
t firm
s con
duct
form
al jo
b an
alys
is a
nd re
crui
t N
AM
s fro
m w
ithin
thei
r ow
n fir
m.
• Pe
rfor
man
ce o
f NA
Ms i
s affe
cted
by
leng
th o
f te
nure
, age
of p
rogr
am, a
nd ti
me
devo
ted
to k
ey
acco
unts
.
Det
aile
d an
alys
is o
f all
aspe
cts o
f NA
M H
R
prac
tices
.
Serv
ice
and
cons
umer
go
ods c
ompa
nies
un
derr
epre
sent
ed in
the
sam
ple.
Pard
o, S
alle
, an
d Sp
ence
r (1
995)
Key
acc
ount
ad
apta
tion
proc
ess
Cas
e st
udy
of a
tele
com
co
mpa
ny, i
nclu
ding
10
inte
rvie
ws
• Th
e ke
y ac
coun
tizat
ion
proc
ess i
s a re
sult
of
adap
tatio
n to
var
ious
act
ors.
• Th
e ke
y ac
coun
t rel
atio
nshi
p de
velo
ps o
ver t
ime
goin
g th
roug
h fo
ur p
hase
s: n
aive
ty, a
war
enes
s, co
nsol
idat
ion,
and
fine
-tuni
ng.
Com
bine
s ele
men
ts o
f the
In
tera
ctio
n M
odel
(H
akan
sson
, 198
2) a
nd
the
netw
ork
appr
oach
to
expl
ain
the
evol
utio
n of
K
AM
rela
tions
hips
ove
r tim
e.
Sing
le c
ase
stud
y.
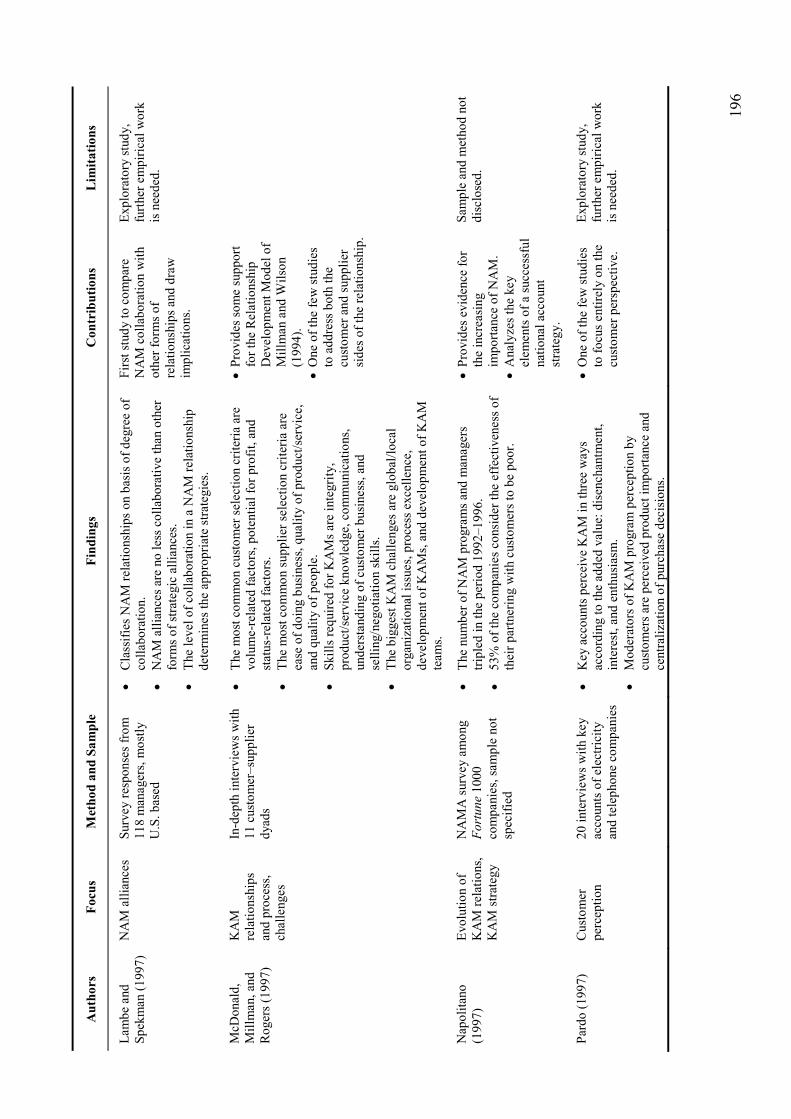
19
6
Aut
hors
Fo
cus
Met
hod
and
Sam
ple
Find
ings
C
ontr
ibut
ions
L
imita
tions
Lam
be a
nd
Spek
man
(199
7)
NA
M a
llian
ces
Surv
ey re
spon
ses f
rom
11
8 m
anag
ers,
mos
tly
U.S
. bas
ed
• C
lass
ifies
NA
M re
latio
nshi
ps o
n ba
sis o
f deg
ree
of
colla
bora
tion.
•
NA
M a
llian
ces a
re n
o le
ss c
olla
bora
tive
than
oth
er
form
s of s
trate
gic
allia
nces
. •
The
leve
l of c
olla
bora
tion
in a
NA
M re
latio
nshi
p de
term
ines
the
appr
opria
te st
rate
gies
.
Firs
t stu
dy to
com
pare
N
AM
col
labo
ratio
n w
ith
othe
r for
ms o
f re
latio
nshi
ps a
nd d
raw
im
plic
atio
ns.
Expl
orat
ory
stud
y,
furth
er e
mpi
rical
wor
k is
nee
ded.
McD
onal
d,
Mill
man
, and
R
oger
s (19
97)
KA
M
rela
tions
hips
an
d pr
oces
s, ch
alle
nges
In-d
epth
inte
rvie
ws w
ith
11 c
usto
mer
–sup
plie
r dy
ads
• Th
e m
ost c
omm
on c
usto
mer
sele
ctio
n cr
iteria
are
vo
lum
e-re
late
d fa
ctor
s, po
tent
ial f
or p
rofit
, and
st
atus
-rel
ated
fact
ors.
• Th
e m
ost c
omm
on su
pplie
r sel
ectio
n cr
iteria
are
ea
se o
f doi
ng b
usin
ess,
qual
ity o
f pro
duct
/ser
vice
, an
d qu
ality
of p
eopl
e.
• Sk
ills r
equi
red
for K
AM
s are
inte
grity
, pr
oduc
t/ser
vice
kno
wle
dge,
com
mun
icat
ions
, un
ders
tand
ing
of c
usto
mer
bus
ines
s, an
d se
lling
/neg
otia
tion
skill
s. •
The
bigg
est K
AM
cha
lleng
es a
re g
loba
l/loc
al
orga
niza
tiona
l iss
ues,
proc
ess e
xcel
lenc
e,
deve
lopm
ent o
f KA
Ms,
and
deve
lopm
ent o
f KA
M
team
s.
• Pr
ovid
es so
me
supp
ort
for t
he R
elat
ions
hip
Dev
elop
men
t Mod
el o
f M
illm
an a
nd W
ilson
(1
994)
. •
One
of t
he fe
w st
udie
s to
add
ress
bot
h th
e cu
stom
er a
nd su
pplie
r si
des o
f the
rela
tions
hip.
Nap
olita
no
(199
7)
Evol
utio
n of
K
AM
rela
tions
, K
AM
stra
tegy
NA
MA
sur
vey
amon
g Fo
rtun
e 10
00
com
pani
es, s
ampl
e no
t sp
ecifi
ed
• Th
e nu
mbe
r of N
AM
pro
gram
s and
man
ager
s tri
pled
in th
e pe
riod
1992
–199
6.
• 53
% o
f the
com
pani
es c
onsi
der t
he e
ffec
tiven
ess o
f th
eir p
artn
erin
g w
ith c
usto
mer
s to
be p
oor.
• Pr
ovid
es e
vide
nce
for
the
incr
easi
ng
impo
rtanc
e of
NA
M.
• A
naly
zes t
he k
ey
elem
ents
of a
succ
essf
ul
natio
nal a
ccou
nt
stra
tegy
.
Sam
ple
and
met
hod
not
disc
lose
d.
Pard
o (1
997)
C
usto
mer
pe
rcep
tion
20 in
terv
iew
s with
key
ac
coun
ts o
f ele
ctric
ity
and
tele
phon
e co
mpa
nies
• K
ey a
ccou
nts p
erce
ive
KA
M in
thre
e w
ays
acco
rdin
g to
the
adde
d va
lue:
dis
ench
antm
ent,
inte
rest
, and
ent
husi
asm
. •
Mod
erat
ors o
f KA
M p
rogr
am p
erce
ptio
n by
cu
stom
ers a
re p
erce
ived
pro
duct
impo
rtanc
e an
d ce
ntra
lizat
ion
of p
urch
ase
deci
sion
s.
• O
ne o
f the
few
stud
ies
to fo
cus e
ntire
ly o
n th
e cu
stom
er p
ersp
ectiv
e.
Expl
orat
ory
stud
y,
furth
er e
mpi
rical
wor
k is
nee
ded.

19
7
A
utho
rs
Focu
s M
etho
d an
d Sa
mpl
e Fi
ndin
gs
Con
trib
utio
ns
Lim
itatio
ns
Seng
upta
, K
rapf
el, a
nd
Pusa
teri
(199
7)
Switc
hing
co
sts
Surv
ey o
f 176
NA
MA
m
embe
r com
pani
es
• Th
e gr
eate
r the
ada
ptat
ion
unde
rtake
n by
the
selli
ng
firm
, the
ince
ntiv
es o
ffer
ed b
y th
e se
lling
firm
, and
th
e cu
stom
er’s
rela
tions
hip-
spec
ific
inve
stm
ent,
the
grea
ter t
he c
usto
mer
switc
hing
cos
ts.
• Th
e gr
eate
r the
cus
tom
er sw
itchi
ng c
osts
, the
hig
her
the
obje
ctiv
e an
d su
bjec
tive
perf
orm
ance
of t
he k
ey
acco
unt m
anag
er.
• D
emon
stra
tes t
he
impo
rtanc
e of
cus
tom
er
switc
hing
cos
ts in
KA
M
rela
tions
hips
.
Shar
ma
(199
7)
Buy
ing
beha
vior
10
9 te
leph
one
ques
tionn
aire
s of b
uyer
s of
tele
phon
e eq
uipm
ent
• C
usto
mer
s’ p
refe
renc
e fo
r KA
M p
rogr
ams d
epen
ds
on le
vels
invo
lved
in p
urch
asin
g, fu
nctio
ns
invo
lved
in p
urch
asin
g, a
nd ti
me
take
n fo
r pu
rcha
sing
.
• Pr
ovid
es im
plic
atio
ns fo
r ke
y ac
coun
t sel
ectio
n.
Sam
ple
cove
rs o
nly
one
supp
lier i
ndus
try
and
one
resp
onde
nt
per c
ompa
ny.
Wee
ks a
nd
Stev
ens (
1997
) N
AM
trai
ning
, N
AM
sk
ills/
abili
ties
Surv
ey o
f 133
NA
MA
m
embe
r com
pani
es
• N
AM
s are
not
satis
fied
with
NA
M sa
les t
rain
ing
prog
ram
s. •
Com
pani
es a
re n
ot a
dequ
ate
in a
ddre
ssin
g 13
out
of
21 sk
ills/
abili
ties r
equi
red
for t
he N
AM
role
.
• A
focu
sed
inve
stig
atio
n of
N
AM
trai
ning
nee
ds.
Wei
lbak
er a
nd
Wee
ks (1
997)
Ev
olut
ion
of
KA
M p
roce
ss
Con
tent
ana
lysi
s of
exis
ting
liter
atur
e •
The
evol
utio
n of
the
natio
nal a
ccou
nt m
anag
emen
t pr
oces
s clo
sely
rese
mbl
es th
e pr
oduc
t life
cyc
le
and/
or th
e ad
optio
n cu
rve.
• Ex
tens
ive
liter
atur
e re
view
.
Dis
hman
and
N
itse
(199
8)
Cha
ract
eris
tics
of n
atio
nal
acco
unts
27 in
terv
iew
s with
N
AM
A m
embe
rs
• Pr
ovid
es d
escr
iptiv
es o
f the
num
ber a
nd si
ze o
f key
ac
coun
ts a
nd sa
les f
orce
in th
e st
udie
d co
mpa
nies
. •
The
mos
t com
mon
org
aniz
atio
n m
odel
is
mul
tinat
iona
l acc
ount
s ser
vice
d by
sing
le-ti
ered
sa
les f
orce
.
• Id
entif
ies s
ome
sign
ifica
nt
diffe
renc
es to
pre
viou
s re
sear
ch.
Expl
orat
ory
stud
y.
Kem
pene
rs a
nd
van
der H
art
(199
9)
Acc
ount
m
anag
emen
t st
ruct
ures
Seve
n ca
se st
udie
s of
diffe
rent
com
pani
es
• D
esig
ning
KA
M p
rogr
ams r
equi
res 1
5 de
cisi
ons i
n th
e ar
eas o
f pos
ition
ing
of K
AM
pro
gram
, po
sitio
ning
of a
ccou
nt m
anag
ers,
leve
ls o
f acc
ount
m
anag
ers,
and
orga
niza
tion
of a
ccou
nt te
ams.
• B
uild
s on
Shap
iro a
nd
Mor
iarty
(198
4) to
cre
ate
a de
cisi
on-m
akin
g m
odel
fo
r dev
elop
ing
KA
M
stru
ctur
es.
Expl
orat
ory
stud
y.
Mill
man
and
W
ilson
(199
9a)
KA
M
proc
esse
s C
once
ptua
l, ba
sed
on
sour
ces s
uch
as fo
rmal
re
sear
ch p
roje
cts,
stud
ying
buy
er/s
elle
r dy
ads,
indu
stry
surv
eys,
and
obse
rvat
ions
from
w
orks
hops
and
con
sulti
ng
proj
ects
• Th
e K
AM
pro
cess
is u
nlik
ely
to su
ccee
d w
ithou
t se
nior
man
agem
ent i
nvol
vem
ent.
• Tr
aditi
onal
vie
ws o
n bu
yer/s
elle
r rel
atio
nshi
ps a
nd
cultu
ral b
arrie
rs m
ust b
e re
plac
ed.
• Th
e pr
oces
s inv
olve
s “to
tal”
supp
ly c
hain
m
anag
emen
t. •
The
proc
ess m
ust f
acili
tate
“re
al”
invo
lvem
ent w
ith
the
cust
omer
.
• Id
entif
ies a
nd a
naly
zes
eigh
t key
KA
M p
roce
ss
elem
ents
.
Unc
lear
dat
a so
urce
s.

198
Appendix B: Organizational Team Models Source: Gladstein (1984). Source: Hackman (1987).
PROCESS CRITERIAOF EFFECTIVENESS
• Level of effort brought to bear on the group task
• Amount of knowledge and skill applied to task work
• Appropriateness of the task performance strategies used by the group
GROUP SYNERGY
Assistance to the group by interacting in the ways that:•Reduce process•Create synergistic process gains
ORGANIZATIONAL CONTEXT
A context that supports and reinforces competent task work, via: •Reward system•Educational system•Information system
GROUP DESIGN
A design that prompts and facilitates competent work on the task, via:•Structure of the task•Composition of the group•Group norms about performance processes
GROUP EFFECTIVENESS
• Task output acceptable to those who receive or review it
• Capability of members to work together in future is maintained or strengthened
• Member’s need are more satisfied than frustrated by group experience
MATERIAL RESOURCES
Sufficiency of material resources required to accomplish the task well and on time
GROUP LEVEL
GROUP COMPOSITION
• Adequate Skills • Heterogeneity • Organization Tenure • Job Tenure
• Role & Goal Clarity • Specific Work Norms • Task Control • Size • Formal Leadership
GROUP STRUCTURE
INPUTS
RESOURCES AVAILABLE
• Training & Technical Consultation • Markets Served
• Reward for Group Performance • Supervisory Control
ORGANIZATIONAL STRUCTURE
ORGANIZATIONAL LEVEL
PROCESS OUTPUTS
GROUP PROCESS
GROUP TASK
GROUP EFFECTIVENESS
• Open Communication • Supportiveness
• Conflict
• Discussion of Strategy • Weighting Individual Inputs • Boundary Management
• Task Complexity • Environmental Uncertainty • Interdependence
Performance Satisfaction
x

199
Source: Gist, Locke, and Taylor (1987). Source: Cohen and Bailey (1997).
PROCESSES
InfluenceFacilitationSocial ImpactLoafing
DevelopmentIdentificationTeam Development
Decision MakingParticipationAlternative/InformationGenerationAlternative EvaluationConsensus BuildingTotal Process
OUTCOMES
Group Performance
Quantity
Quality
TimelinesQuality of Work Life of
Group Members
Capability of Working Independently in the
Future
Task Characteristics
INPUTS
Group Structure
SizeAbilityPersonalityGenderRace
Group StrategiesLeadershipReward Allocation
Internal Processes e.g. conflict,
communication
External Processes e.g. conflict
communication
Effectiveness
-Performance Outcomes e.g. quality productivity
-Attitudinal Outcomes e.g. job satisfaction, trust
-BehavioralOutcomes e.g. turnover absenteeism
Group Psychosocial Traits
e.g. norms, shared mental models
Task Designe.g. autonomy, interdependency
Group Composition e.g. size, tenure
Organizational Context e.g. Rewards, supervision
Environmental Factors e.g. turbulence, industry characteristics

200
Source: Campion, Medsker, and Higgs (1993).
Job DesignSelf-ManagementParticipationTask VarietyTask SignificanceTask Identity
ProcessPotencySocial SupportWorkload SharingCommunication/Cooperation Within Group
InterdependenceTask InterdependenceGoal InterdependenceInterdependence Feedback and Reward
CompositionHeterogeneityFlexibilityRelative SizePreference for Group Work
ContextTrainingManagerial SupportCommunication/Cooperation Between Group
Productivity
Satisfaction
Manager Judgment
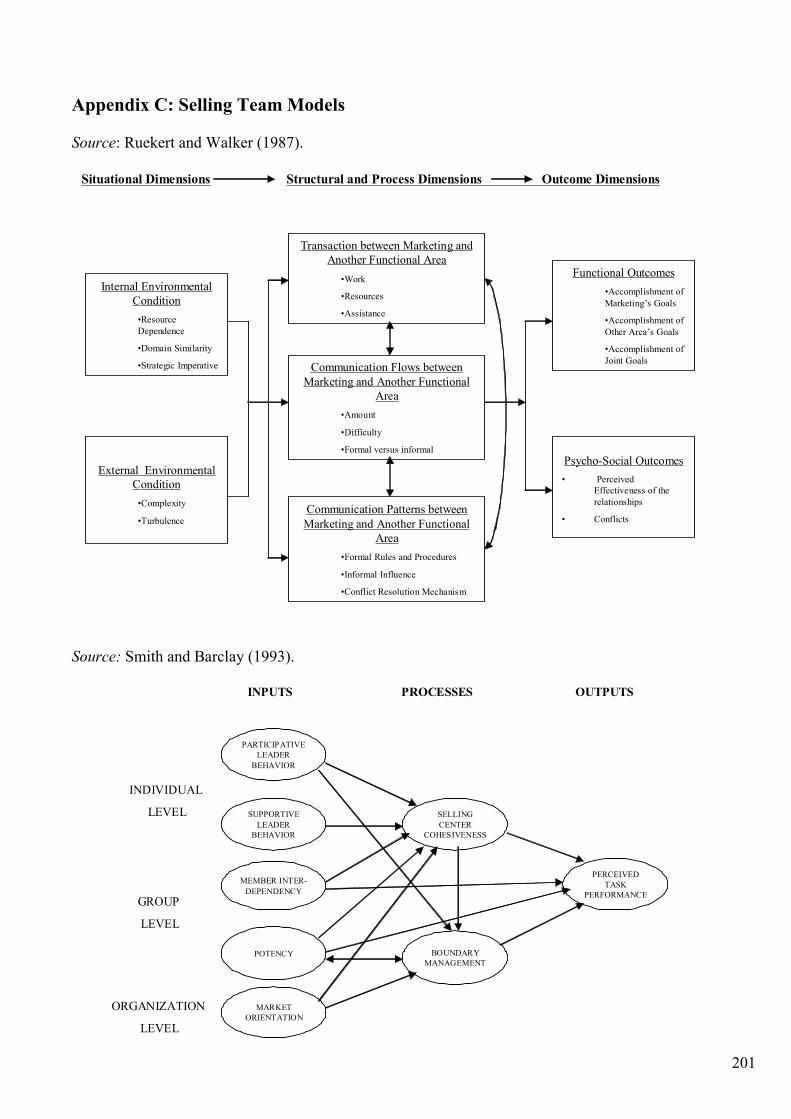
201
Appendix C: Selling Team Models Source: Ruekert and Walker (1987). Source: Smith and Barclay (1993).
Transaction between Marketing and Another Functional Area
•Work
•Resources
•Assistance
Internal Environmental Condition
•Resource Dependence
•Domain Similarity
•Strategic Imperative
External Environmental Condition
•Complexity
•Turbulence
Psycho-Social Outcomes• Perceived
Effectiveness of the relationships
• Conflicts
Functional Outcomes•Accomplishment of Marketing’s Goals
•Accomplishment of Other Area’s Goals
•Accomplishment of Joint GoalsCommunication Flows between
Marketing and Another Functional Area
•Amount
•Difficulty
•Formal versus informal
Situational Dimensions Structural and Process Dimensions Outcome Dimensions
Communication Patterns between Marketing and Another Functional
Area•Formal Rules and Procedures
•Informal Influence
•Conflict Resolution Mechanism
INPUTS PROCESSES OUTPUTS
PARTICIPATIVE LEADER
BEHAVIOR
SUPPORTIVE LEADER
BEHAVIOR
MEMBER INTER-DEPENDENCY
POTENCY
MARKET ORIENTATION
BOUNDARY MANAGEMENT
SELLING CENTER
COHESIVENESS
PERCEIVED TASK
PERFORMANCE
INDIVIDUAL
LEVEL
GROUP
LEVEL
ORGANIZATION
LEVEL

202
Source: Moon and Gupta (1997). Source: Perry, Pearce and Sims (1999).
Communication Flows Between Selling Center
Participants
ConnectednessDifficulty
Internal Environment
Market Orientation
Information Infrastructure
Size and Shape of the Selling Center
Extensivity
Vertical Involvement
Lateral Involvement
Nature of the Selling Task
Environmental Complexity
Goal Achievement
Customer Responsiveness
Perceived Effectiveness
Perceived Conflict Level
Psycho-Social Outcomes
Situational Dimensions Structural and Process Dimensions Outcome Dimensions
Shared Leadership•Transactional
• Transformational
• Directive
• Empowering
• Social Supportive
Selling Task Characteristic•Interdependence
•Complexity
Vertical Leadership Role•Team Design
•Facilitative
•Boundary Management
•Contingent
Team Characteristics•Ability
•Proximity
•Maturity
•Diversity
•Size
Behavioral Responses
• Effort
• Communication
• Citizenship Behavior
Affective/Cognitive Responses•Commitment
•Satisfaction
•Potency
•Cohesiveness
Team EffectivenessQualitative
• Team Self Ratings
• Manager Rating
• Customer Rating
Quantitative• Sales Volume
• Profitability

20
3
App
endi
x D
: Lis
t of I
nter
view
s
Inte
rvie
w d
etai
ls
Com
pany
info
rmat
ion
Com
pany
N
ame
Posi
tion
Dat
e Pl
ace
Indu
stry
T
otal
sale
s (2
005)
A
ge o
f GA
M
prog
ram
N
o. o
f glo
bal
acco
unts
Swis
s In
tern
atio
nal
Airl
ines
Ren
é K
ambe
r G
loba
l Key
Acc
ount
M
anag
er
04.0
5.20
06
Zuric
h,
Switz
erla
nd
Airl
ines
C
HF
3.6b
n 4
year
s 34
Wac
ker
Dr.
Rai
ner
Fisc
her
Key
Acc
ount
Man
ager
09
.05.
2006
M
unic
h,
Ger
man
y C
hem
ical
s €
2.8b
n 9
year
s 10
Cla
riant
M
auro
B
erga
mas
co
Hea
d G
loba
l Key
A
ccou
nt M
anag
emen
t 11
.05.
2006
B
asel
, Sw
itzer
land
C
hem
ical
s C
HF
8.2b
n 1.
5 ye
ars
11
SAP
Thom
as M
olle
t Se
nior
Glo
bal A
ccou
nt
Exec
utiv
e 17
.05.
2006
R
egen
sdor
f, Sw
itzer
land
IT
€
8.5b
n 7
year
s 50
Coc
a-C
ola
Co.
R
ober
t Le
echm
an
Hea
d G
loba
l Acc
ount
M
anag
emen
t 25
.05.
2006
Lo
ndon
, UK
C
onsu
mer
go
ods
$ 23
bn
10 y
ears
30
Citi
grou
p D
avid
Bow
erin
H
ead
of S
trate
gic
Mar
ketin
g, G
loba
l B
anki
ng
26.0
5.20
06
Lond
on, U
K
Fina
ncia
l se
rvic
es
$ 83
.6bn
20
yea
rs
1700
Siem
ens
Dav
id
Mac
aula
y Pr
esid
ent,
Cor
pora
te
Acc
ount
s Inf
orm
atio
n &
Com
mun
icat
ions
09.0
6.20
06
Mun
ich,
G
erm
any
Div
ersi
fied
€ 75
.4bn
n.
a.
30

20
4
Com
pany
N
ame
Posi
tion
Dat
e Pl
ace
Indu
stry
T
otal
sale
s (2
005)
A
ge o
f GA
M
prog
ram
N
o. o
f glo
bal
acco
unts
D
HL
Tim
Har
ford
Re
gion
al S
ales
D
irect
or, G
loba
l C
usto
mer
Sol
utio
ns
04.0
7.20
06
Hor
n/ S
t. G
alle
n,
Switz
erla
nd
Expr
ess a
nd
logi
stic
s se
rvic
es
Ca.
€ 2
5bn
12 y
ears
10
0
Coc
a-C
ola
Hel
leni
c B
ottli
ng
Com
pany
Die
ter
Kot
low
ski
Key
Acc
ount
Ser
vice
s D
irect
or
05.0
7.20
06
Hor
n/ S
t. G
alle
n,
Switz
erla
nd
Con
sum
er
good
s €
4.8b
n n.
a.
21
Hew
lett-
Pack
ard
Cha
rles
Bel
laic
he
Glo
bal S
ervi
ces
Prin
cipa
l 05
.07.
2006
H
orn/
St.
Gal
len,
Sw
itzer
land
IT
$ 86
bn
25 y
ears
10
0
IBM
C
hris
tine
Lanc
reno
n C
hate
lard
Inte
rnat
iona
l Sal
es a
nd
Ope
ratio
ns E
xecu
tive,
EM
EA
06.0
7.20
06
Hor
n/ S
t. G
alle
n,
Switz
erla
nd
IT
$ 47
.4bn
15
-20
year
s 60
Hen
kel
Fran
z Sp
eer
Dire
ctor
Inte
rnat
iona
l K
ey A
ccou
nt
Man
agem
ent
06.0
7.20
06
Hor
n/ S
t. G
alle
n,
Switz
erla
nd
Con
sum
er
good
s €
10.6
bn
8 ye
ars
12
Wac
ker
Dr.
Pete
r N
eum
ann
Pres
iden
t and
Key
A
ccou
nt M
anag
er
06.0
7.20
06
Hor
n/ S
t. G
alle
n,
Switz
erla
nd
Che
mic
als
€ 2.
8bn
9 ye
ars
10

205
Appendix E: Interview Questionnaire
Interview questionnaire
Meeting with Mr./Ms. XXXX, COMPANY, XX.XX.2006 1. Global account management activities at COMPANY Please describe briefly the current set-up of global account management at COMPANY:
• How many customers have special status as global key accounts? How many people at COMPANY are dedicated to these customers?
• What share of COMPANY’s total sales is generated by global accounts? • How is the GAM program integrated into the organization? Is it a separate organizational unit? How dispersed
is it geographically? Who has the profit-and-loss responsibility for the global account? 2. GAM team characteristics Please describe the structure and responsibilities of a typical GAM team at COMPANY:
• How many GAM teams does COMPANY have, and what is the average number of team members? • What are the key responsibilities of each team? • Where are the teams positioned in the organization? To whom do they report? • Where are the teams usually based geographically? Do team members work close to one another? • How are the teams structured? How many hierarchical levels and functions are represented? Why? • How diverse are the teams in terms of nationality, background and international experience? What is the
significance of these characteristics?
Please describe the factors that determine the structure and composition of a team: • What are the most important decisions to be made when a team is formed? What is COMPANY looking for in
a GAM team? • To what extent do the customer organization and customer requirements influence the design of the team?
Does the team structure reflect the customer organization? • To what extent do the existing organizational arrangements at COMPANY influence the design of the team?
3. GAM team processes Please describe the most important aspects of teamwork and the factors that facilitate and hinder it:
• How do team members communicate with one another, and how often do they meet? • What mechanisms do they use to coordinate work within the team and with people outside the team? Any
support systems? • How does COMPANY ensure commitment and collaboration within the teams; between the teams and other
parts of the organization; between the teams and the customers? • What are the most common types of conflicts/problems? Why do they arise? How are they usually resolved? • How does a team’s structure and composition influence its ability to perform its tasks effectively? • What are the key factors facilitating team functioning? • What are the key factors hindering team functioning?
4. Performance criteria Please describe the most important team performance criteria:
• Does COMPANY measure team performance? How (key performance indicators)? • How are team members rewarded (incentive/remuneration systems)? • What does a high-performing team look like? • What does a low-performing team look like?
Note: We would greatly appreciate any additional soft- or hardcopy materials that would extend and inform the research process. All information provided during interviews or in any other form will be treated as strictly confidential.
Thank you for your valuable support!

206
Appendix F: Survey questionnaire
COMPANY logo
Questionnaire
High-Performance Global Account Management Teams
Dear colleagues, Thank you for taking the time to complete this survey. Your contribution is very important. The purpose of this survey As part of our commitment to continuously improving our global customer relationships, we are conducting this study, together with the University of St. Gallen (Switzerland), to evaluate the factors that can enhance the performance of global account management (GAM) teams. Benefits Your responses to this questionnaire will provide us with valuable feedback about how to optimize our GAM team processes and achieve higher levels of customer excellence. Furthermore, as you reflect on the questions, you likely will obtain new ideas to improve your own daily work with global customers.
The information you provide will be treated as strictly confidential. All analyses will be conducted on an aggregate level with no reference to individual responses. Definition For the purposes of this questionnaire, we define a global account management team as all persons involved in developing and maintaining relationships with one or a few related key customers on a worldwide basis. The team may include a core team fully dedicated to the customer as well as an extended team whose members participate on a part-time basis for specific support tasks.
Thank you for your cooperation!
NAME Yana Atanasova POSITION University of St. Gallen
Instructions Please answer all questions with reference to your own GAM team. If you are not dedicated
to a single team, please consider the team with which you work most often or are most familiar.
The whole process will take you about 15 minutes. Please note that you cannot save your answers and come back, so please be prepared to finish the survey in one sitting.
If you have any questions regarding the questionnaire, please contact Yana Atanasova (E-mail: [email protected], Phone: +41 76 389 2262, Fax: +41 71 224 2447; University of St. Gallen, FIM-HSG, Dufourstrasse 40a, 9000 St. Gallen, Switzerland).
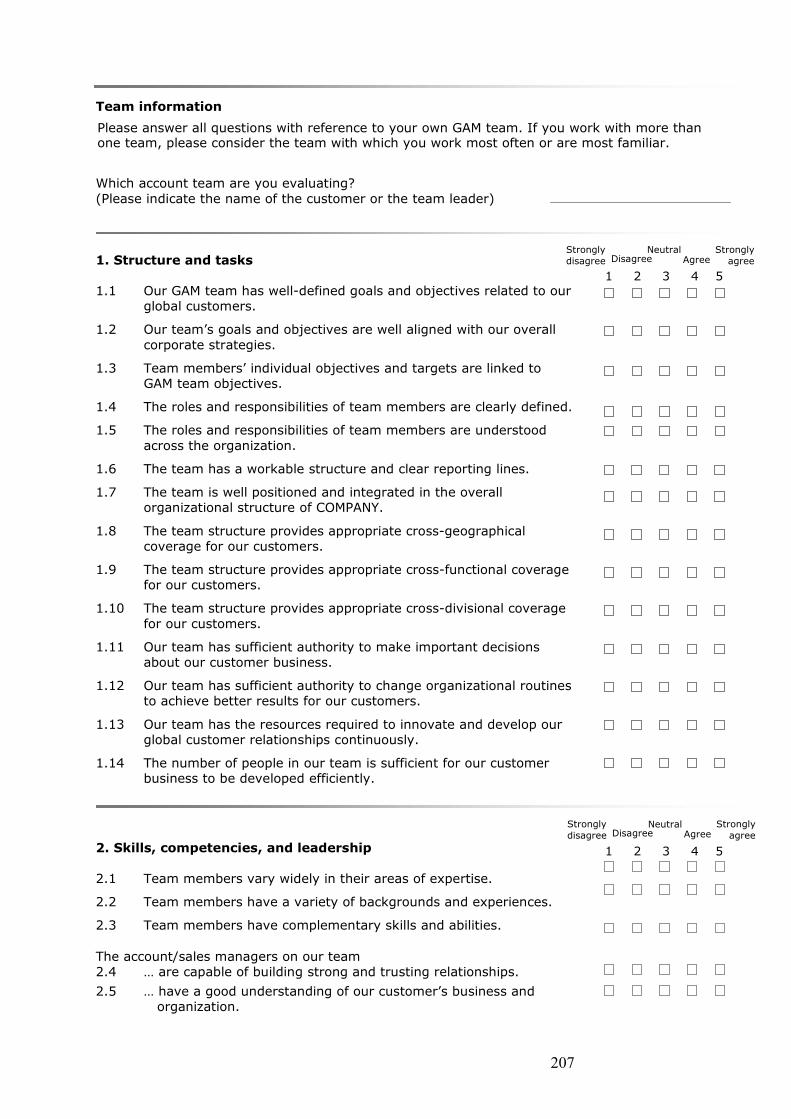
207
Team information Which account team are you evaluating? (Please indicate the name of the customer or the team leader) 1. Structure and tasks 1.1 Our GAM team has well-defined goals and objectives related to our
global customers.
1.2 Our team’s goals and objectives are well aligned with our overall corporate strategies.
1.3 Team members’ individual objectives and targets are linked to GAM team objectives.
1.4 The roles and responsibilities of team members are clearly defined.
1.5 The roles and responsibilities of team members are understood across the organization.
1.6 The team has a workable structure and clear reporting lines.
1.7 The team is well positioned and integrated in the overall organizational structure of COMPANY.
1.8 The team structure provides appropriate cross-geographical coverage for our customers.
1.9 The team structure provides appropriate cross-functional coverage for our customers.
1.10 The team structure provides appropriate cross-divisional coverage for our customers.
1.11 Our team has sufficient authority to make important decisions about our customer business.
1.12 Our team has sufficient authority to change organizational routines to achieve better results for our customers.
1.13 Our team has the resources required to innovate and develop our global customer relationships continuously.
1.14 The number of people in our team is sufficient for our customer business to be developed efficiently.
2. Skills, competencies, and leadership 2.1 Team members vary widely in their areas of expertise.
2.2 Team members have a variety of backgrounds and experiences.
2.3 Team members have complementary skills and abilities.
The account/sales managers on our team 2.4 … are capable of building strong and trusting relationships.
2.5 … have a good understanding of our customer’s business and organization.
1 2 3 4 5
1 2 3 4 5
Strongly disagree
Strongly agree Disagree Agree
Neutral
Please answer all questions with reference to your own GAM team. If you work with more than one team, please consider the team with which you work most often or are most familiar.
Strongly disagree
Strongly agree Disagree Agree
Neutral

208
2.6 … have a good understanding of our business and the internal capabilities of COMPANY.
2.7 … are able to think and work in an interdisciplinary way.
2.8 … are able to coordinate complex networks and activities.
2.9 … are able to think creatively to deliver value to the customer.
2.10 … are able to work in a diverse and multicultural environment.
2.11 … employ strategic, long-term thinking.
2.12 … possess powers of persuasion.
Our team leader 2.13 … has substantial influence in the organization (even when
he/she has no formal authority).
2.14 … has a strong relationship with top management.
2.15 … is able to motivate team members and create synergies within the team.
3. Organizational context 3.1 Our top management is actively involved in the team’s efforts to
develop profitable, long-term relationships with global customers.
3.2 Our top management is committed to deploy the necessary resources to make our global customer operations succeed.
3.3 Our top management publicly promotes our team’s GAM activities to others in the organization.
3.4 Team members’ contributions to developing global customers are measured in a systematic and transparent manner.
3.5 Our compensation system promotes a global collaboration mindset by appropriately rewarding contributions to the GAM team.
3.6 Many professional rewards (e.g., pay, promotions) are determined in large part by team members’ performance on the GAM team.
3.7 The company provides adequate global selling and negotiation training for our team.
3.8 The company provides adequate team skills training for our team (e.g., communication, organization, interpersonal).
3.9 The company provides adequate technical training for our team.
4. Processes and behaviors 4.1 Our team regularly exchanges best practices and market
knowledge with other GAM teams.
4.2 Team members communicate proactively on issues related to our GAM activities across boundaries and hierarchical levels in the entire organization.
4.3 Our team has difficulty obtaining support from other parts of the organization.
4.4 Communication in the team is effective, despite the geographical distance of team members.
4.5 Team members keep one another updated about their activities and key issues affecting the business.
4.6 Team members are good at coordinating their efforts to serve the customer efficiently.
1 2 3 4 5
1 2 3 4 5
Strongly disagree
Strongly agree Disagree
Neutral
Strongly disagree
Strongly agree Disagree Agree
Neutral
Agree

209
4.7 Team members collaborate to achieve our global goals.
4.8 Disputes between the different units represented on our team make it difficult to do our work.
4.9 Our team is able to identify and resolve conflicts in a timely and effective manner.
4.10 Our team can easily send problems up the chain of command (escalate to senior management) when they cannot be resolved within the team.
4.11 The negative politics within the team are minimal.
4.12 Team members proactively cultivate new business opportunities.
4.13 Our team is not afraid to challenge the status quo to improve our customer relationships.
4.14 The team is a powerful force for constructive change in the organization.
5. Outcomes 5.1 Our team is characterized by strong and harmonious long-term
relationships with global customers.
5.2 Our customers are satisfied with the overall performance of our team.
5.3 Our team provides real value to our customers.
5.4 Our team has successfully learned some critical skills or capabilities from our customer relationships.
5.5 COMPANY’s competitive position has been enhanced due to our team’s GAM achievements.
5.6 Our team achieves its goals and objectives.
How has your team, over the past three years, performed with respect to
5.7 … growth in sales?
5.8 … profitability?
5.9 … growth in the share of your global customers’ wallets?
1 2 3 4 5
1 2 3 4 5 Poor Outstanding
Strongly disagree
Strongly agree Disagree Agree
Neutral

210
Background information
What is your position at COMPANY?
What is your position/role within the GAM team?
How long have you been involved in this team?
How long have you been working at COMPANY (in years)?
What is your functional background?
In which country are you based?
What is your gender?
How old are you?
Additional comments/suggestions for improvement
30 or less 31-40 41-50 51-60 Above 60
Female Male
Sales
Marketing
Service
General Management
Manufacturing / Operations
Engineering
Research and Development
Finance
IT
Purchasing Other

21
1
App
endi
x G
: Mea
ns, s
tand
ard
devi
atio
ns a
nd c
orre
latio
ns
Var
iabl
eM
ean
SD1.
11.
21.
31.
41.
51.
61.
71.
81.
91.
101.
111.
121.
131.
142.
12.
22.
32.
42.
52.
62.
72.
82.
92.
102.
112.
122.
132.
142.
153.
13.
23.
33.
43.
53.
61.
1 G
oals
and
role
s 13.
93.8
71.
2 G
oals
and
role
s 24.
01.8
1.6
91.
3 G
oals
and
role
s 33.
301.
12.4
6.3
91.
4 G
oals
and
role
s 43.
63.8
8.4
4.2
7.5
11.
5 G
oals
and
role
s 53.
061.
00.2
7.2
1.3
5.4
81.
6 St
ruct
ure
13.
62.8
7.3
6.3
3.3
8.5
1.3
91.
7 St
ruct
ure
23.
36.9
9.3
8.2
7.3
5.3
8.5
7.4
51.
8 St
ruct
ure
33.
70.8
6.3
1.3
0.2
9.3
1.2
2.4
0.3
21.
9 St
ruct
ure
43.
59.8
8.2
8.2
7.2
0.2
3.2
8.2
5.3
5.5
71.
10 S
truct
ure
53.
42.9
1.1
4.2
2.1
5.2
2.2
8.2
5.3
4.5
1.6
81.
11 E
mpo
wer
men
t 13.
391.
07.3
2.3
0.2
3.2
2.4
1.2
7.4
9.2
6.3
1.3
51.
12 E
mpo
wer
men
t 22.
951.
09.1
7.1
9.2
3.1
6.4
3.1
7.4
5.2
5.2
7.3
2.7
01.
13 E
mpo
wer
men
t 33.
191.
02.2
4.1
6.3
3.1
9.2
9.2
4.4
5.2
6.3
8.3
7.4
6.5
61.
14 S
ize
adeq
uac y
3.20
1.05
.06
.17
.14
.07
.11
.16
.32
.34
.42
.42
.21
.31
.47
2.1
Het
erog
enei
ty 1
3.84
.87
.13
.12
.17
.09
-.12
.00
.01
.06
.13
.06
.06
.04
.09
.04
2.2
Het
erog
enei
ty 2
3.95
.77
.08
.08
.15
.13
-.04
.00
.06
.04
.16
.12
.06
.08
.16
.01
.75
2.3
Het
erog
enei
ty 3
3.91
.67
.20
.18
.29
.22
.20
.11
.22
.17
.26
.29
.26
.26
.31
.19
.40
.42
2.4
Skill
s 14.
03.7
8.2
8.1
1.2
5.3
0.3
6.2
2.3
6.2
6.2
1.2
0.3
0.2
9.2
7.1
7.0
9.2
0.3
22.
5 Sk
ills 2
4.06
.76
.21
.05
.18
.21
.30
.25
.34
.20
.21
.16
.23
.23
.20
.19
.13
.17
.23
.74
2.6
Skill
s 34.
08.6
0.1
7.0
5.0
8.2
2.2
6.2
7.3
6.2
7.2
5.2
5.2
4.1
9.2
0.1
9.1
3.1
1.2
3.5
3.5
32.
7 Sk
ills 4
3.86
.71
.20
.15
.04
.20
.30
.28
.31
.19
.28
.36
.24
.34
.30
.19
.12
.15
.40
.52
.51
.56
2.8
Skill
s 53.
67.8
6.2
9.1
4.1
7.1
9.3
2.2
2.3
6.2
7.2
8.3
1.3
0.3
5.3
4.2
2.1
6.2
1.3
9.6
1.6
1.5
0.6
82.
9 Sk
ills 6
3.92
.81
.23
.04
.13
.22
.31
.23
.33
.20
.22
.24
.17
.25
.20
.10
.15
.25
.32
.55
.61
.43
.56
.64
2.10
Ski
lls 7
3.88
.74
.21
.09
.14
.17
.29
.17
.28
.17
.32
.34
.24
.23
.23
.07
.17
.28
.35
.53
.47
.33
.54
.56
.55
2.11
Ski
lls 8
3.64
.93
.27
.16
.21
.24
.29
.20
.34
.19
.34
.39
.32
.37
.37
.24
.11
.18
.31
.63
.58
.34
.60
.62
.59
.53
2.12
Ski
lls 9
3.90
.74
.33
.13
.27
.32
.33
.22
.33
.20
.36
.33
.35
.39
.31
.07
.20
.29
.28
.57
.46
.31
.54
.58
.57
.54
.61
2.13
Lea
ders
hip
13.
76.9
0.3
4.2
1.2
7.2
8.2
6.2
1.4
2.3
4.2
7.2
3.4
3.4
0.3
6.1
7.2
1.2
3.2
6.4
3.2
7.2
9.2
9.3
6.2
7.3
1.2
8.3
82.
14 L
eade
rshi
p 2
3.94
.82
.22
.18
.23
.24
.18
.23
.33
.27
.18
.29
.40
.29
.26
.20
.19
.12
.16
.34
.27
.28
.17
.30
.19
.19
.26
.22
.70
2.15
Lea
ders
hip
33.
91.7
6.3
4.2
8.3
1.2
7.1
9.2
8.2
9.3
2.2
7.2
4.3
4.2
7.3
2.2
0.1
4.1
3.2
1.4
3.2
0.2
7.2
8.2
6.1
8.2
4.3
4.3
5.6
4.5
73.
1 To
p m
anag
emen
t sup
port
13.
82.8
7.4
2.4
0.3
4.3
5.3
3.2
4.4
6.3
0.3
5.3
3.3
9.4
2.4
3.3
5.1
4.1
1.2
3.2
7.1
2.1
8.2
6.2
3.0
9.1
9.3
0.2
4.3
3.3
3.3
43.
2 To
p m
anag
emen
t sup
port
23.
57.9
3.3
5.3
6.4
8.3
6.3
5.2
3.4
4.2
9.3
2.2
7.3
5.4
1.4
9.3
5.1
6.1
3.2
9.3
0.1
7.1
3.2
4.2
8.1
1.2
3.3
1.2
9.3
6.2
9.3
8.6
43.
3 To
p m
anag
emen
t sup
port
33.
441.
03.2
8.2
9.3
6.3
2.3
8.1
9.4
8.2
3.2
7.2
9.4
2.4
7.4
2.3
0.1
4.1
2.3
1.2
9.1
4.1
6.2
0.2
8.1
0.2
5.2
3.2
8.3
4.3
2.3
0.6
6.6
93.
4 R
ewar
ds a
nd in
cent
ives
13.
07.9
8.2
7.1
5.4
6.3
8.3
9.2
8.4
0.2
7.2
2.2
6.3
6.4
2.3
7.1
8.0
8.1
0.3
8.3
2.1
9.1
9.2
3.3
5.1
3.2
7.2
9.3
1.3
5.2
8.3
0.5
0.4
7.5
43.
5 R
ewar
ds a
nd in
cent
ives
22.
47.9
8.2
6.1
4.5
0.2
9.3
8.1
5.3
5.1
6.1
5.1
8.3
5.5
1.4
2.1
8.1
2.1
2.3
0.3
8.2
8.2
0.2
5.3
9.3
0.3
2.3
7.3
4.2
9.2
7.2
6.4
1.5
2.4
7.5
83.
6 R
ewar
ds a
nd in
cent
ives
32.
651.
03.3
2.2
1.4
1.2
9.3
4.1
4.4
1.2
5.2
5.1
8.3
9.4
8.3
7.2
3.2
0.1
9.3
7.3
4.2
4.2
3.2
4.3
1.2
4.2
3.2
8.4
1.4
2.3
3.3
4.4
4.4
6.4
8.5
2.6
83.
7 Tr
aini
ng 1
3.26
1.01
.24
.20
.29
.16
.20
.21
.28
.29
.19
.14
.21
.34
.27
.17
.15
.05
.22
.20
.21
.22
.28
.31
.26
.20
.29
.30
.24
.19
.19
.33
.34
.39
.42
.43
.41
3.8
Trai
ning
23.
40.8
8.2
4.2
5.2
7.2
8.1
7.2
4.2
7.2
6.2
2.2
3.2
2.3
0.2
7.2
6.1
7.1
1.2
2.1
4.1
9.1
5.1
9.2
4.2
4.2
3.2
7.2
7.2
4.2
2.2
5.3
4.3
4.3
2.3
5.3
6.3
23.
9 Tr
aini
ng 3
3.47
.84
.25
.28
.21
.24
.00
.22
.18
.28
.25
.24
.14
.11
.26
.28
.16
.13
.16
.07
.10
.23
.19
.21
.23
.03
.09
.11
.22
.22
.22
.25
.28
.20
.14
.19
.18
4.1
Exte
rnal
com
mun
icat
ion
13.
47.9
0.2
2.2
4.3
1.2
0.1
6.2
1.2
9.1
3.1
5.2
7.1
7.1
9.3
3.3
1.0
0.0
1.0
7.1
6.1
6.1
7.1
6.1
8.0
7.1
3.2
1.1
0.2
8.3
4.2
5.3
6.3
3.3
1.2
4.2
2.1
54.
2 Ex
tern
al c
omm
unic
atio
n 2
3.52
.79
.34
.18
.30
.32
.33
.25
.45
.28
.39
.37
.28
.28
.36
.29
.12
.16
.31
.30
.31
.26
.37
.47
.39
.36
.37
.34
.41
.25
.29
.37
.36
.40
.36
.27
.26
4.3
Exte
rnal
com
mun
icat
ion
32.
99.9
5.2
1.1
5.3
0.2
5.3
9.2
9.3
8.3
4.2
1.1
6.3
8.3
1.3
1.2
1.0
9.1
0.1
6.4
1.3
0.2
0.2
3.3
0.2
7.2
3.3
0.2
8.3
4.2
5.2
4.3
3.3
2.3
6.2
7.2
2.2
64.
4 In
tern
al c
omm
unic
atio
n 1
3.66
.75
.36
.31
.21
.38
.21
.23
.21
.20
.24
.18
.09
.01
.09
.10
.04
.05
.15
.29
.18
.19
.22
.19
.18
.27
.22
.24
.26
.16
.33
.27
.28
.22
.22
.11
.14
4.5
Inte
rnal
com
mun
icat
ion
23.
66.7
8.2
7.1
9.1
9.3
3.3
2.1
7.3
2.1
6.3
1.3
2.1
4.0
9.2
1.1
1.0
7.1
1.2
3.2
9.2
1.2
2.2
7.3
6.3
2.3
3.3
9.3
2.2
8.1
8.2
0.1
5.2
2.1
3.2
3.1
6.1
54.
6 In
tern
al c
omm
unic
atio
n 3
3.69
.71
.24
.10
.28
.44
.37
.26
.34
.21
.40
.28
.28
.22
.22
.15
.15
.11
.23
.36
.34
.24
.21
.34
.38
.34
.39
.35
.28
.31
.31
.26
.30
.31
.34
.24
.29
4.7
Inte
rnal
com
mun
icat
ion
43.
73.7
1.2
1.2
0.2
9.2
3.3
0.2
1.4
4.3
0.4
0.4
4.2
8.3
0.4
0.3
4.0
9.0
5.3
2.2
8.2
6.3
1.3
4.3
6.3
2.2
4.4
3.3
2.2
8.2
8.3
2.4
3.3
6.3
7.4
0.2
9.2
24.
8 C
onfli
ct re
solu
tion
13.
57.9
3.0
1-.0
4.0
4.0
1.1
7.1
9.1
8.2
2.1
8.1
2.2
5.2
0.1
8.1
0.0
3.0
7.0
8.3
1.1
6.1
0.1
5.1
3.0
4.1
3.1
1.1
3.1
7.1
0.1
8.0
7.1
3.1
5-.0
2-.0
7-.0
54.
9 C
onfli
ct re
solu
tion
23.
73.6
4.2
7.1
6.1
5.3
2.3
4.2
7.4
2.3
0.3
9.3
0.4
3.3
2.4
1.2
7.1
1.1
5.2
2.4
9.3
7.3
1.4
0.3
4.3
1.3
2.4
3.3
9.3
7.2
7.4
6.3
5.3
5.2
7.2
2.2
2.2
54.
10 C
onfli
ct re
solu
tion
33.
89.7
4.3
0.2
8.2
4.3
3.2
8.3
4.4
0.3
1.2
7.2
5.3
7.3
4.2
9.2
0.1
7.1
3.1
9.3
4.2
2.3
4.3
6.3
4.2
6.1
8.2
4.3
3.3
7.4
2.4
5.4
6.3
8.3
5.2
5.1
8.2
74.
11 C
onfli
ct re
solu
tion
43.
92.7
8.1
7.1
0.1
9.1
0.1
4.2
0.1
9.3
6.2
6.2
0.2
0.2
1.2
3.2
6.0
6.0
2.2
2.2
6.3
0.2
5.3
1.2
5.2
4.1
2.2
6.2
1.1
3.1
9.3
1.2
2.1
8.2
0.1
9.1
5.1
34.
12 P
roac
tiven
ess 1
3.87
.74
.31
.28
.25
.23
.28
.11
.22
.16
.39
.34
.29
.19
.29
.19
.20
.24
.28
.30
.35
.26
.23
.26
.36
.27
.36
.43
.22
.23
.27
.20
.23
.17
.16
.24
.24
4.13
Pro
activ
enes
s 23.
94.7
1.2
3.1
4.2
0.2
3.2
3.1
8.2
9.2
7.3
1.2
9.3
0.2
2.3
1.1
3.1
8.2
6.2
9.3
7.2
7.2
1.2
6.2
4.4
5.3
5.3
9.4
1.2
2.2
4.3
3.1
8.1
6.2
1.1
7.2
6.2
34.
14 P
roac
tiven
ess 3
3.53
.98
.28
.20
.31
.29
.33
.12
.43
.20
.24
.22
.42
.32
.36
.20
.13
.14
.31
.46
.30
.23
.32
.35
.30
.34
.40
.50
.42
.43
.40
.40
.41
.53
.35
.36
.47
5.1
Rel
atio
nal p
erfo
rman
ce 1
3.82
.87
.33
.27
.26
.30
.36
.25
.34
.34
.33
.30
.45
.41
.43
.28
.07
.10
.22
.46
.36
.26
.40
.34
.34
.36
.47
.47
.45
.48
.52
.40
.37
.37
.31
.31
.40
5.2
Rel
atio
nal p
erfo
rman
ce 2
3.85
.79
.27
.19
.19
.21
.32
.24
.34
.35
.36
.31
.41
.40
.39
.30
.11
.07
.26
.40
.33
.31
.38
.35
.31
.25
.36
.39
.37
.40
.43
.42
.38
.34
.26
.31
.33
5.3
Rel
atio
nal p
erfo
rman
ce 3
3.99
.76
.32
.24
.19
.21
.25
.22
.28
.32
.40
.33
.31
.30
.36
.26
.13
.09
.22
.31
.14
.23
.35
.25
.28
.17
.28
.47
.37
.37
.48
.42
.37
.33
.26
.22
.35
5.4
Rel
atio
nal p
erfo
rman
ce 4
4.11
.67
.28
.19
.16
.22
.26
.21
.23
.32
.41
.28
.27
.31
.32
.25
.18
.11
.27
.36
.27
.32
.39
.34
.35
.25
.31
.36
.36
.34
.45
.33
.27
.28
.27
.24
.32
5.5
Rel
atio
nal p
erfo
rman
ce 5
3.97
.89
.34
.28
.27
.23
.12
.18
.29
.35
.35
.24
.27
.21
.37
.29
.14
.12
.17
.27
.18
.27
.25
.23
.16
.16
.23
.23
.41
.45
.44
.52
.37
.38
.27
.18
.31
5.6
Rel
atio
nal p
erfo
rman
ce 6
3.81
.84
.37
.27
.30
.26
.38
.28
.40
.26
.31
.24
.31
.15
.27
.12
.12
.12
.21
.39
.34
.32
.35
.34
.37
.40
.31
.31
.36
.43
.41
.37
.29
.32
.28
.26
.28
5.7
Fina
ncia
l per
form
ance
13.
94.8
7.3
0.2
3.2
5.2
2.2
3.1
8.1
9.1
9.0
9.0
8.2
3.1
5.1
8.0
6.0
1-.0
7.0
8.3
4.2
1.1
5.1
8.1
7.2
1.2
1.2
2.2
2.3
1.3
7.2
8.2
4.2
8.3
0.2
2.1
9.3
15.
8 Fi
nanc
ial p
erfo
rman
ce 2
3.65
.84
.39
.28
.25
.20
.19
.24
.30
.25
.19
.14
.38
.19
.18
.10
.13
.07
.07
.31
.24
.15
.18
.18
.30
.24
.26
.30
.37
.43
.36
.28
.29
.25
.19
.26
.34
5.9
Fina
ncia
l per
form
ance
33.
73.8
6.2
9.2
9.2
1.1
5.1
7.2
0.1
2.2
3.2
0.1
5.2
8.1
7.2
2.1
6.1
1-.0
4.0
9.2
2.1
5.0
9.1
9.1
8.1
8.2
0.1
9.2
0.3
0.4
0.3
3.2
9.2
8.3
5.2
4.1
4.2
5
Not
e: C
orre
latio
ns o
f .16
are
sign
ifica
nt a
t the
.05
leve
l (tw
o-ta
iled)
. Lar
ge c
orre
latio
ns (>
.50)
are
indi
cate
d in
bol
d.

21
2
Mea
ns, s
tand
ard
devi
atio
ns a
nd c
orre
latio
ns (c
ontin
ued)
V
aria
ble
Mea
nSD
3.7
3.8
3.9
4.1
4.2
4.3
4.4
4.5
4.6
4.7
4.8
4.9
4.10
4.11
4.12
4.13
4.14
5.1
5.2
5.3
5.4
5.5
5.6
5.7
5.8
3.8
Trai
ning
23.
40.8
8.6
13.
9 Tr
aini
ng 3
3.47
.84
.42
.62
4.1
Exte
rnal
com
mun
icat
ion
13.
47.9
0.1
9.3
0.3
14.
2 Ex
tern
al c
omm
unic
atio
n 2
3.52
.79
.20
.31
.29
.48
4.3
Exte
rnal
com
mun
icat
ion
32.
99.9
5.1
5.1
2.0
4.0
6.3
24.
4 In
tern
al c
omm
unic
atio
n 1
3.66
.75
.19
.32
.28
.29
.38
.05
4.5
Inte
rnal
com
mun
icat
ion
23.
66.7
8.0
6.1
6.1
3.2
2.4
8.0
8.5
54.
6 In
tern
al c
omm
unic
atio
n 3
3.69
.71
.27
.32
.24
.23
.50
.20
.46
.57
4.7
Inte
rnal
com
mun
icat
ion
43.
73.7
1.2
8.3
5.2
9.3
0.5
1.1
6.3
2.4
1.4
44.
8 C
onfli
ct re
solu
tion
13.
57.9
3-.0
3-.0
8-.1
3-.0
6.0
0.5
2.0
0.0
2.1
1.1
04.
9 C
onfli
ct re
solu
tion
23.
73.6
4.1
6.2
8.2
1.2
4.3
3.3
1.3
2.3
7.4
2.3
7.3
04.
10 C
onfli
ct re
solu
tion
33.
89.7
4.2
4.3
0.2
7.3
6.3
6.2
1.2
9.2
7.3
9.3
7.2
0.4
54.
11 C
onfli
ct re
solu
tion
43.
92.7
8.3
5.3
7.2
4.0
9.2
2.2
1.1
8.1
2.3
5.4
0.2
8.4
3.3
24.
12 P
roac
tiven
ess 1
3.87
.74
.12
.30
.14
.30
.33
.15
.32
.34
.37
.33
.00
.33
.30
.37
4.13
Pro
activ
enes
s 23.
94.7
1.1
4.2
9.1
7.1
2.3
0.2
4.2
2.3
0.3
6.2
7.1
0.3
8.3
5.3
5.5
54.
14 P
roac
tiven
ess 3
3.53
.98
.21
.23
.08
.27
.40
.35
.24
.24
.35
.33
.16
.41
.38
.18
.42
.51
5.1
Rel
atio
nal p
erfo
rman
ce 1
3.82
.87
.28
.25
.10
.40
.32
.32
.29
.21
.38
.33
.23
.46
.36
.34
.45
.45
.59
5.2
Rel
atio
nal p
erfo
rman
ce 2
3.85
.79
.24
.24
.19
.36
.28
.33
.23
.12
.34
.32
.23
.53
.39
.35
.40
.38
.45
.68
5.3
Rel
atio
nal p
erfo
rman
ce 3
3.99
.76
.22
.21
.14
.19
.31
.23
.21
.15
.27
.35
.09
.44
.43
.26
.42
.42
.52
.62
.62
5.4
Rel
atio
nal p
erfo
rman
ce 4
4.11
.67
.29
.33
.21
.23
.35
.21
.27
.23
.37
.37
.12
.47
.38
.39
.40
.44
.36
.58
.56
.64
5.5
Rel
atio
nal p
erfo
rman
ce 5
3.97
.89
.20
.21
.24
.33
.36
.27
.20
.09
.30
.31
.07
.32
.37
.29
.28
.43
.48
.54
.50
.59
.53
5.6
Rel
atio
nal p
erfo
rman
ce 6
3.81
.84
.21
.18
.04
.28
.39
.34
.32
.24
.41
.42
.13
.46
.37
.30
.38
.43
.47
.53
.52
.50
.50
.57
5.7
Fina
ncia
l per
form
ance
13.
94.8
7.1
8.1
4.0
6.2
1.2
5.4
1.2
5.1
2.2
9.1
7.1
7.2
3.2
3.1
0.3
2.3
5.5
1.5
1.4
2.4
1.3
6.3
8.5
25.
8 Fi
nanc
ial p
erfo
rman
ce 2
3.65
.84
.20
.20
.17
.25
.32
.34
.24
.13
.34
.21
.13
.41
.32
.23
.34
.30
.38
.49
.48
.47
.42
.36
.53
.64
5.9
Fina
ncia
l per
form
ance
33.
73.8
6.1
9.1
6.1
1.2
3.3
2.3
3.2
0.0
8.2
7.2
4.1
3.2
4.2
7.1
5.2
4.2
9.4
7.5
0.4
3.4
7.3
9.4
0.5
7.7
4.5
6
Not
e: C
orre
latio
ns o
f .16
are
sign
ifica
nt a
t the
.05
leve
l (tw
o-ta
iled)
. Lar
ge c
orre
latio
ns (>
.50)
are
indi
cate
d in
bol
d.

21
3
App
endi
x H
: CFA
resu
lts fo
r the
firs
t-ord
er c
onst
ruct
s Fa
ctor
s and
item
s St
anda
rdiz
ed
load
ing
t-va
lue
Goa
ls a
nd r
oles
1.
1 O
ur G
AM
team
has
wel
l-def
ined
goa
ls a
nd o
bjec
tives
rela
ted
to o
ur g
loba
l cus
tom
ers.
1.2
Our
team
’s g
oals
and
obj
ectiv
es a
re w
ell a
ligne
d w
ith o
ur o
vera
ll co
rpor
ate
stra
tegi
es.
1.4
The
role
s and
resp
onsi
bilit
ies o
f tea
m m
embe
rs a
re c
lear
ly d
efin
ed.
1.6
The
team
has
a w
orka
ble
stru
ctur
e an
d cl
ear r
epor
ting
lines
. C
usto
mer
cov
erag
e 1.
8 Th
e te
am st
ruct
ure
prov
ides
app
ropr
iate
cro
ss-g
eogr
aphi
cal c
over
age
for o
ur c
usto
mer
s. 1.
9 Th
e te
am st
ruct
ure
prov
ides
app
ropr
iate
cro
ss-f
unct
iona
l cov
erag
e fo
r our
cus
tom
ers.
1.10
The
team
stru
ctur
e pr
ovid
es a
ppro
pria
te c
ross
-div
isio
nal c
over
age
for o
ur c
usto
mer
s. E
mpo
wer
men
t 1.
11 O
ur te
am h
as su
ffic
ient
aut
horit
y to
mak
e im
porta
nt d
ecis
ions
abo
ut o
ur c
usto
mer
bus
ines
s. 1.
12 O
ur te
am h
as su
ffic
ient
aut
horit
y to
cha
nge
orga
niza
tiona
l rou
tines
to a
chie
ve b
ette
r res
ults
for o
ur c
usto
mer
s.
1.13
Our
team
has
the
reso
urce
s req
uire
d to
inno
vate
and
dev
elop
our
glo
bal c
usto
mer
rela
tions
hips
con
tinuo
usly
. H
eter
ogen
eity
2.
1 Te
am m
embe
rs v
ary
wid
ely
in th
eir a
reas
of e
xper
tise.
2.
2 Te
am m
embe
rs h
ave
a va
riety
of b
ackg
roun
ds a
nd e
xper
ienc
es.
Ade
quat
e sk
ills
The
acco
unt/s
ales
man
ager
s on
our t
eam
2.
4 …
are
cap
able
of b
uild
ing
stro
ng a
nd tr
ustin
g re
latio
nshi
ps.
2.5
… h
ave
a go
od u
nder
stan
ding
of o
ur c
usto
mer
’s b
usin
ess a
nd o
rgan
izat
ion.
2.
7 …
are
abl
e to
thin
k an
d w
ork
in a
n in
terd
isci
plin
ary
way
. 2.
9 …
are
abl
e to
thin
k cr
eativ
ely
to d
eliv
er v
alue
to th
e cu
stom
er.
2.10
… a
re a
ble
to w
ork
in a
div
erse
and
mul
ticul
tura
l env
ironm
ent.
2.11
… e
mpl
oy st
rate
gic,
long
-term
thin
king
. 2.
12 …
pos
sess
pow
ers o
f per
suas
ion.
L
eade
rshi
p 2.
13 O
ur te
am le
ader
has
subs
tant
ial i
nflu
ence
in th
e or
gani
zatio
n (e
ven
whe
n he
/she
has
no
form
al a
utho
rity)
. 2.
14 O
ur te
am le
ader
has
a st
rong
rela
tions
hip
with
top
man
agem
ent.
T
op m
anag
emen
t sup
port
3.
1 O
ur to
p m
anag
emen
t is a
ctiv
ely
invo
lved
in th
e te
am’s
eff
orts
to d
evel
op p
rofit
able
, lon
g-te
rm re
latio
nshi
ps w
ith g
loba
l cus
tom
ers.
3.2
Our
top
man
agem
ent i
s com
mitt
ed to
dep
loyi
ng th
e ne
cess
ary
reso
urce
s to
mak
e ou
r glo
bal c
usto
mer
ope
ratio
ns su
ccee
d.
3.3
Our
top
man
agem
ent p
ublic
ly p
rom
otes
our
team
’s G
AM
act
iviti
es to
oth
ers i
n th
e or
gani
zatio
n.
Rew
ards
and
ince
ntiv
es
3.4
Team
mem
bers
’ con
tribu
tions
to d
evel
opin
g gl
obal
cus
tom
ers a
re m
easu
red
in a
syst
emat
ic a
nd tr
ansp
aren
t man
ner.
3.5
Our
com
pens
atio
n sy
stem
pro
mot
es g
loba
l col
labo
ratio
n by
app
ropr
iate
ly re
war
ding
con
tribu
tions
to th
e G
AM
team
. 3.
6 M
any
prof
essi
onal
rew
ards
(e.g
., pa
y, p
rom
otio
ns) a
re d
eter
min
ed in
larg
e pa
rt by
team
mem
bers
’ per
form
ance
on
the
GA
M te
am.
.5
84
.457
.6
95
.680
.671
.8
67
.787
.884
.7
66
.705
.671
.9
54
.6
95
.645
.6
76
.724
.6
22
.763
.7
12
.9
58
.722
.721
.7
62
.763
.681
.8
09
.757
7
.194
5
.854
7
.821
-
10.7
60
12.8
15
- 9
.233
8
.562
- -
3.3
76
10
.422
9
.688
10
.186
10
.868
9
.408
11
.396
- -
7.2
02
10
.570
10
.971
-
10.2
41
11.5
94
-

21
4
Tra
inin
g 3.
7 Th
e co
mpa
ny p
rovi
des a
dequ
ate
glob
al se
lling
and
neg
otia
tion
train
ing
for o
ur te
am.
3.8
The
com
pany
pro
vide
s ade
quat
e te
am sk
ills t
rain
ing
for o
ur te
am (e
.g.,
com
mun
icat
ion,
org
aniz
atio
n, in
terp
erso
nal).
3.
9 Th
e co
mpa
ny p
rovi
des a
dequ
ate
tech
nica
l tra
inin
g fo
r our
team
. C
omm
unic
atio
n an
d co
llabo
ratio
n 4.
1 O
ur te
am re
gula
rly e
xcha
nges
bes
t pra
ctic
es a
nd m
arke
t kno
wle
dge
with
oth
er G
AM
team
s. 4.
2 Te
am m
embe
rs c
omm
unic
ate
proa
ctiv
ely
on is
sues
rela
ted
to o
ur G
AM
act
iviti
es a
cros
s bou
ndar
ies a
nd h
iera
rchi
cal l
evel
s in
the
entir
e or
gani
zatio
n.
4.4
Com
mun
icat
ion
in th
e te
am is
eff
ectiv
e, d
espi
te th
e ge
ogra
phic
al d
ista
nce
of te
am m
embe
rs.
4.5
Team
mem
bers
kee
p on
e an
othe
r upd
ated
abo
ut th
eir a
ctiv
ities
and
key
issu
es a
ffec
ting
the
busi
ness
. 4.
6 Te
am m
embe
rs a
re g
ood
at c
oord
inat
ing
thei
r eff
orts
to se
rve
the
cust
omer
eff
icie
ntly
. 4.
7 Te
am m
embe
rs c
olla
bora
te to
ach
ieve
our
glo
bal g
oals
. C
onfli
ct m
anag
emen
t 4.
8 D
ispu
tes b
etw
een
the
diff
eren
t uni
ts re
pres
ente
d on
our
team
mak
e it
diff
icul
t to
do o
ur w
ork.
(rev
erse
cod
ed)
4.9
Our
team
is a
ble
to id
entif
y an
d re
solv
e co
nflic
ts in
a ti
mel
y an
d ef
fect
ive
man
ner.
4.11
The
neg
ativ
e po
litic
s with
in th
e te
am a
re m
inim
al.
Proa
ctiv
enes
s 4.
12 T
eam
mem
bers
pro
activ
ely
culti
vate
new
bus
ines
s opp
ortu
nitie
s. 4.
13 O
ur te
am is
not
afr
aid
to c
halle
nge
the
stat
us q
uo to
impr
ove
our c
usto
mer
rela
tions
hips
. 4.
14 T
he te
am is
a p
ower
ful f
orce
for c
onst
ruct
ive
chan
ge in
the
orga
niza
tion.
.7
04
.889
.6
47
.4
40
.660
.5
80
.647
.6
76
.727
.438
.6
60
.610
.664
.7
01
.652
9.51
3
9.68
3 -
6.35
3 9.
421
8.28
5 9.
204
9.62
8 -
5.24
0 6.
484
- 8.
077
8.29
4 -
Not
es: A
ll fa
ctor
load
ings
are
sign
ifica
nt a
t the
.01
leve
l.
-
indi
cate
s a fi
xed
para
met
er.
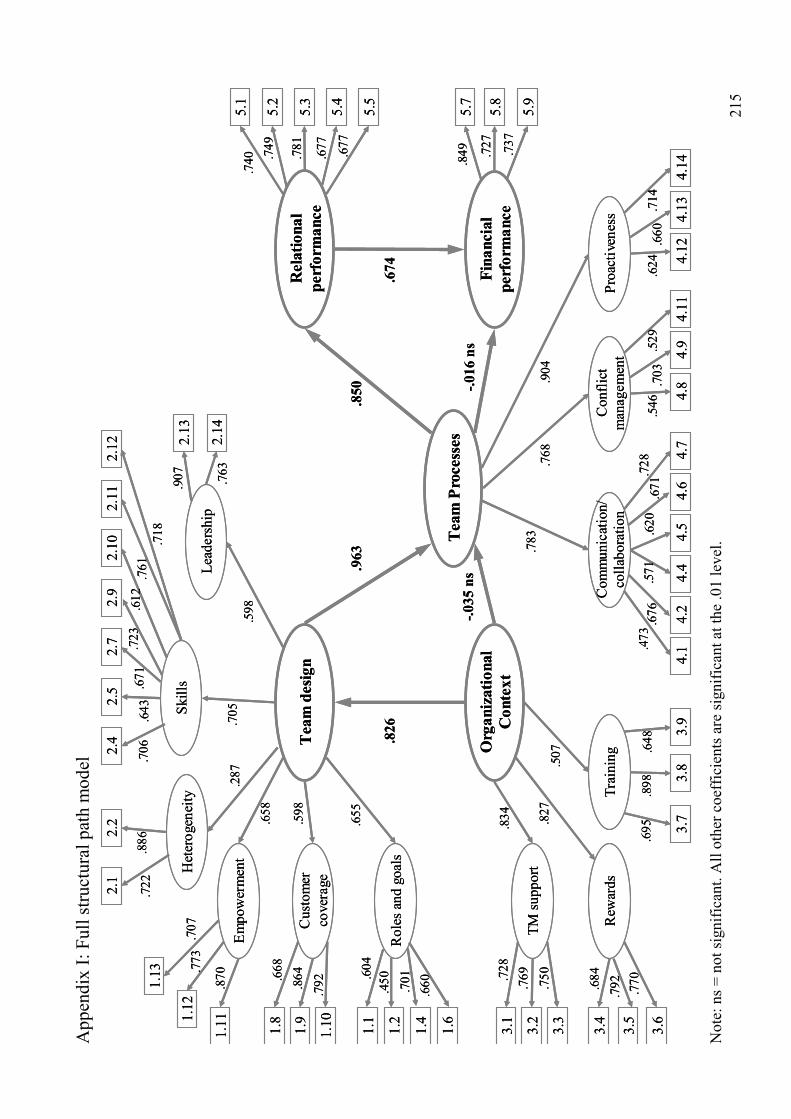
21
5
App
endi
x I:
Full
stru
ctur
al p
ath
mod
el
Not
e: n
s = n
ot si
gnifi
cant
. All
othe
r coe
ffic
ient
s are
sign
ifica
nt a
t the
.01
leve
l.
1.1
1.2
1.4
1.6
Rol
es a
nd g
oals
1.8
1.9
1.10
Cus
tom
erco
vera
ge
1.111.
12
1.13
Empo
wer
men
t
Tea
m d
esig
n
2.1
2.2
Het
erog
enei
ty
2.9
2.10
Skill
s2.
13
2.14
Lead
ersh
ip
2.4
2.5
2.7
2.11
2.12
3.1
3.2
3.3
TM su
ppor
t
3.4
3.5
3.6
Rew
ards
3.7
3.8
3.9
Trai
ningO
rgan
izat
iona
lC
onte
xt
4.1
4.2
4.4
Com
mun
icat
ion/
colla
bora
tion
4.8
4.9
4.11
Con
flict
man
agem
ent
4.12
4.13
4.14
Proa
ctiv
enes
s
Tea
m P
roce
sses
5.1
5.2
5.3
Rel
atio
nal
perf
orm
ance
5.4
5.5
5.7
5.8
Fina
ncia
lpe
rfor
man
ce5.
9
4.5
4.6
4.7
.826
.963
-.035
ns
-.016
ns
.850
.674
.604
.450 .701
.660.6
68.8
64.7
92
.707
.773
.870
.722
.886
.706
.643
.671
.723
.612
.761
.718
.907 .763
.655.598
.658
.287
.705
.598
.728
.769
.750
.684
.792 .770
.695
.898
.648
.834 .827
.507
.473
.676
.571
.620
.671
.728
.546
.703
.529
.624
.660
.714
.783
.768
.904
.740 .7
49
.781
.677 .677
.849 .7
27 .737

Curriculum Vitae Name Yana Atanasova
Date of Birth 5 January 1979
Nationality Bulgarian
Education 2003-2007 University of St. Gallen, Switzerland
Doctor of Business Administration
2001-2003 University of St. Gallen, Switzerland Master of International Management
2002 George Washington University, USA MBA Exchange Semester
1997-2001 Sofia University, Bulgaria Bachelor of Business Administration
2000 Copenhagen Business School, Denmark Academic year abroad
Work Experience 2007 – now Credit Suisse, Zurich, Switzerland
Corporate Development, Assistant Vice President
2002-2006 Account Management Center, Zurich, Switzerland Various consulting and research projects in the area of global account management, some of which in cooperation with the Research Institute for International Management, University of St. Gallen
2005-2006 Rieter AG, Winterthur, Switzerland
Corporate Development, Part-time analyst
2004 Lehman Brothers, Zurich, Switzerland Investment Banking Division, Intern
2002 George Washington University, USA Vice President and Treasurer’s Office, Intern


![ACCOUNT PLAN---TEAMS HOMEWORKING 2013--ASSIGNMENTS [Modo de compatibilidad].pdf](https://static.fdocuments.us/doc/165x107/577cd68d1a28ab9e789cace7/account-plan-teams-homeworking-2013-assignments-modo-de-compatibilidadpdf.jpg)