High Performance Computing: Blue-Gene and Road...
38
High Performance Computing: Blue-Gene and Road Runner Ravi Patel 1
Transcript of High Performance Computing: Blue-Gene and Road...

High Performance Computing:Blue-Gene and Road Runner
Ravi Patel
1
HPC General Information
2
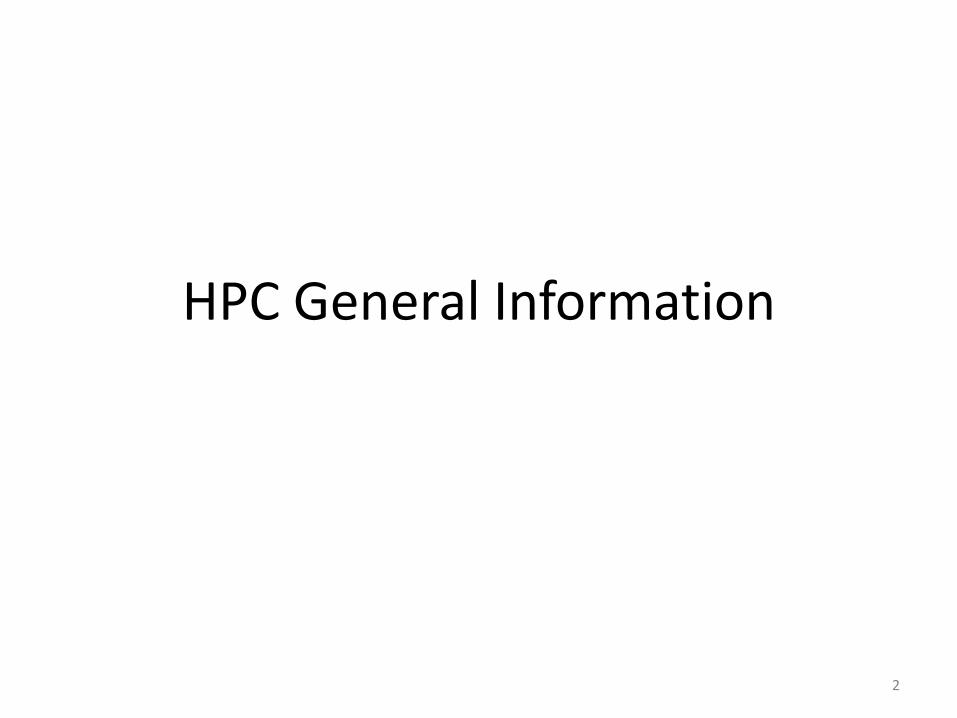
HPC Considerations
• Criterion– Performance
• Speed
• Power
– Scalability• Number of nodes
• Latency bottlenecks
– Reliability (boring)• Fault tolerance
• Fault Isolation
3
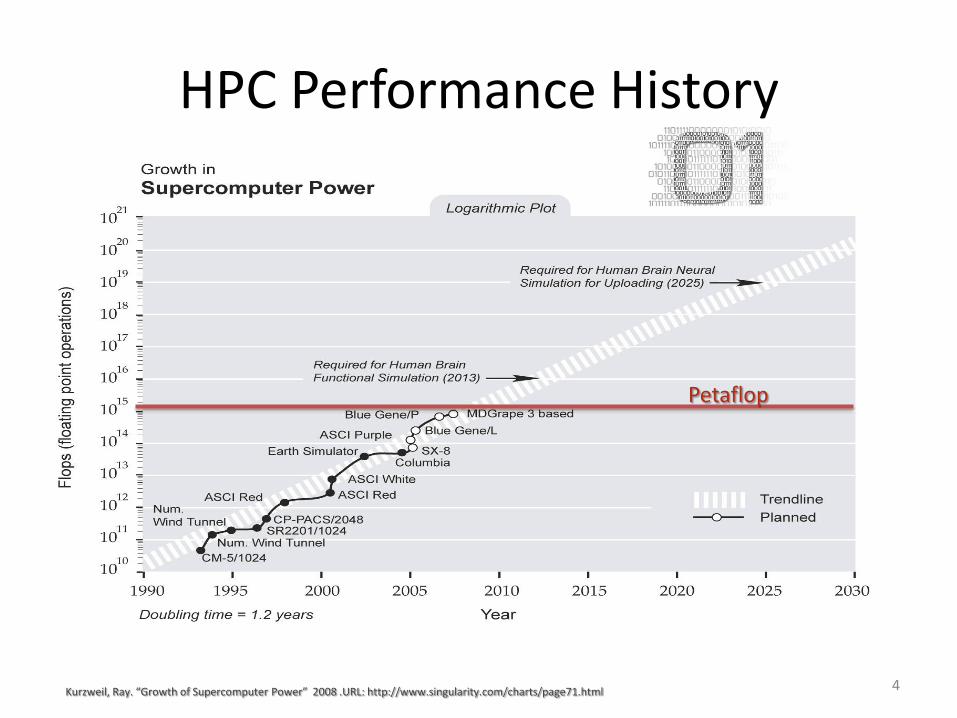
HPC Performance History
4Kurzweil, Ray. “Growth of Supercomputer Power” 2008 .URL: http://www.singularity.com/charts/page71.html
Petaflop

Server Power History
• Acquired data – Server power usage
– Server cooling and auxiliaries
• Unaccounted– Data storage power
– Network equipment
– Cooling and auxiliaries for each
– 20 to 40 % of datacenter load
5
Power Consumption for Servers
J.G. Koomey, “Estimating Total Power Consumption by Servers in the U.S. and the World”; http://enterprise.amd.com/Downloads/svrpwrusecompletefinal.pdf.

HPC Power
• Study accounts for all servers
– Not HPC
– Cheap servers have worse power performance
• Importance of low power design
– Environmental management costs
• Limits scalability
• Limits extensibility
6

HPC Scaling
• Weak Scaling:
– Global Problem size grows with number of nodes
• Strong Scaling:
– Global Problem size remains fixed with number of nodes
7

HPC Architecture
• MPP: Massively Parallel Processor
– Blue Gene and Roadrunner
• Cluster: Group of autonomous systems
– Rely on general network structure
• SMP: Single Massive System
– Looks like one giant system
• Constellation: Sun HPC System Architecture
8

HPC Architecture
9[1] TOP500 Supercomputer List – Dongarra, Meuer, et al. – November 2008 URL: http://www.top500.org

HPC History
• Performance– Add more processors
• Use Vector Processors (VLIW)
10T.H. Dunigan, Jr., J.S. Vetter et al., Performance Evaluation of the Cray X1 Distributed Shared Memory Architecture, IEEE Micro, 25(1):30-40, 2005.

HPC History
• Vector Processors:
– Secondary specialized floating point processors
• Interconnect:
– Shifted from crossbar designs to meshes and trees
• Crossbars have better bisection bandwidth
• More complex
11

Blue Gene/L
12

Blue Gene/L
• Design Goals:
– Low power
– High performance from scalability
• 65,000+ nodes
• Parallelism over speed
– Small footprint
13A. Gara, M. A. Blumrich, D. Chen, G. L.-T. Chiu, P. Coteus, M. E. Giampapa, R. A. Haring, P. Heidelberger, D. Hoenicke, G. V. Kopcsay, T. A. Liebsch, M. Ohmacht, B. D. Steinmacher-Burow, T. Takken, and P. Vranas. Overview of the Blue Gene/L System Architecture. IBMJournal of Research and Development, 49(2/3):195–212, 2005.
Gflops/W of HPCs
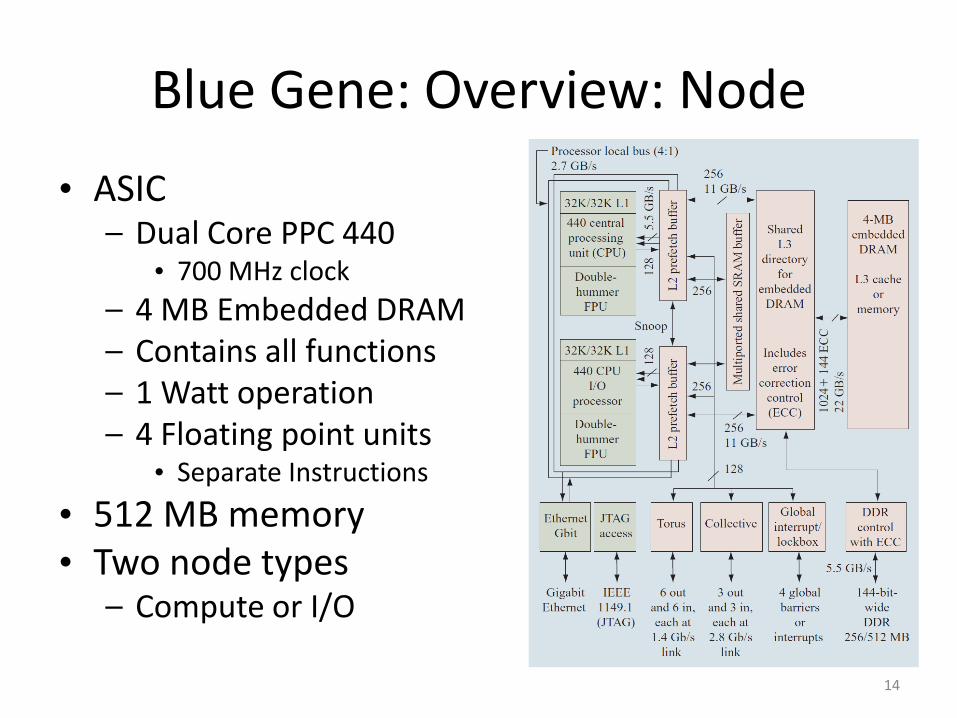
Blue Gene: Overview: Node
• ASIC– Dual Core PPC 440
• 700 MHz clock
– 4 MB Embedded DRAM– Contains all functions– 1 Watt operation– 4 Floating point units
• Separate Instructions
• 512 MB memory• Two node types
– Compute or I/O
14
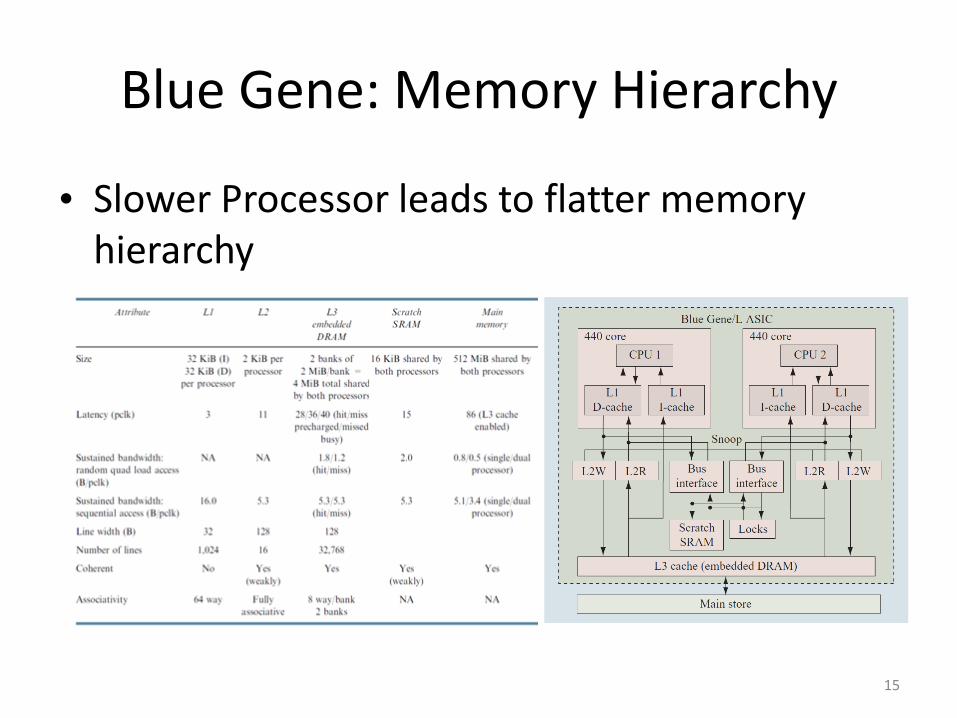
Blue Gene: Memory Hierarchy
• Slower Processor leads to flatter memory hierarchy
15
Blue Gene: Coherence
• Software managed coherence
– Communication Coprocessor Mode
• One core acts to control messaging
– Virtual Node Mode
• Divides memory in half
• Allows read only access to other processor
• L2, L3 are sequentially consistent
• Caches are not inclusive
16

Blue Gene: Interconnect
• Main 3D Torus– Point to point/multicast– 100 ns hop (worst case 64)
• Collective network– Global Reduction operations– 5 µs
• Barrier Network– Global barriers/interrupts– 1.5 µs
• Service Networks – Ethernet– JTAG– Interfaced through I/O Nodes
17
Misc. System Characteristics
• Programming Environment– C/C++, Fortran
– Optimized MPI
• Reliability– Simple components reduce complexity
– Multilevel Redundancy
– ECC memory (DDSC)
– CRC protected transfers
18

Roadrunner
19

Roadrunner
• 3,060 compute nodes
– 12,240 IBM PowerXCell 8i
– 12,240 AMD Opteron cores
• LINPAC Performance:
– 1.38 Pflops/s peak ( 1.026 sustained)
– 536 Mflops/(s-Watt)
20Kevin J. Barker , Kei Davis , Adolfy Hoisie , Darren J. Kerbyson , Mike Lang , Scott Pakin , Jose C. Sancho, Entering the petaflop era: the architecture and performance of Roadrunner, Proceedings of the 2008 ACM/IEEE conference on Supercomputing, November 15-21, 2008, Austin, Texas [doi>10.1145/1413370.1413372]

Roadrunner: Design Goals
• Paradigms:
– Heterogeneous multiprocessing
• Use accelerators for computation
– Modes of operation
• Support unmodified code from HPC environments
• Accelerate performance hotspots – Accelerator model (push computation down)
• Run all computational instructions on accelerators– SPE-Centric Model (push communication up)
21

Roadrunner: Node
• Blades
– Contain processor
– 4 GB of memory per core
• Triblade (system node)
– One Dual-Core Opteron (1.8 GHz) blade
– Two Dual PowerXCell (3.2 GHz) blades
22

Roadrunner: PowerXCell 8i
• Cell Broadband Engine based– Single PPC Core
• Handles general communication functions
– 8 Synergistic Processing Elements• Specialized for floating point
computation
– Improvements over Cell• Improved DP floating point (108.8
Gflop/s)
• DDR 2 support (up to 32 GB)
• 3.2 GHz clock frequency
23

Roadrunner: PowerXCell Cont’d
• SPE– SIMD unit that can issue 4
DP operations per cycle– 256 KB Local store Memory
• Only addressable memory• DMA transfers to access main
memory
• Interconnected by Element Interconnection Bus (EIB)– 1.6 GHz– Handles 3 operations per
concurrently
24
Road Runner: Compute Unit (Level 0 Network Hierarchy)
• 180 triblades
• 12 I/O nodes
• 288 port switch
– 192 intraCU connections
– 96 interCU connections
– 2 GBps bandwidth each
25

Roadrunner: Network Topology
• Fat-Tree hierarchy of crossbars
– Level 1: 3 crossbar plains
• Leads to predictable and small latencies
26

Roadrunner: Summary of Performance Characteristics
• Things to note:
– Still Top50 network if all PowerXCell blades not used
– PowerXCell is primary Computational engine
27

Roadrunner
Observed Performance
28

Roadrunner: Memory Performance
• Ping pong test
– Observed latency matches
– Dips caused by intra-crossbar messages every 90 nodes
29
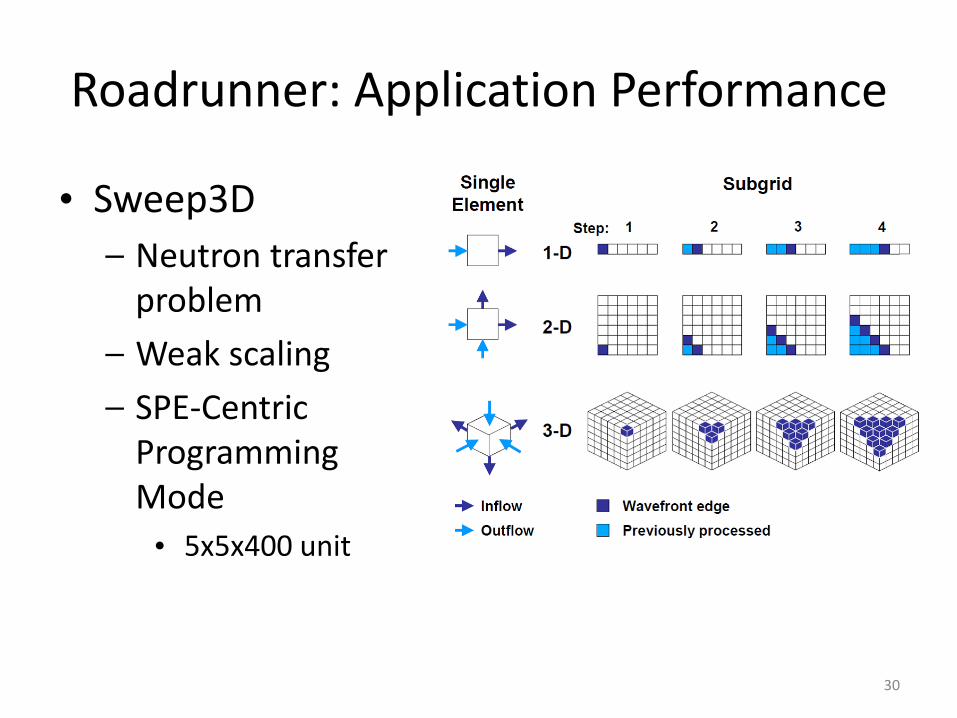
Roadrunner: Application Performance
• Sweep3D
– Neutron transfer problem
– Weak scaling
– SPE-Centric Programming Mode
• 5x5x400 unit
30

Performance Cont’d
• Notable:
– Predicted best is based on making improvements to DaCS communication library
31
Performance of Sweep3D on Roadrunner

Misc System Characteristics
• MPI based programming
– Cell Messaging Library (subset)
• Supports RPC operations which SPEs cannot do (malloc)
• Coherence not a problem
– Individual PPC/Opteron cores take care of themselves
• SPEs cannot be directly addressed
32

Roadrunner: Summary
• Operating paradigms:– Accelerator
– SPE-centric
– Simple operation• Discussion: allows for quicker porting
• Fat Tree like network– Tree of crossbars
• It’s good to be the king
33

Top500 [1]
34[1] TOP500 Supercomputer List – Dongarra, Meuer, et al. – November 2008 URL: http://www.top500.org

Green500 [2]
• PowerXCell and Blue Gene are dominant.
• Average Power Top10: [1]– June 2008:
• 1.32 MWatt
• 248 Mflop/(s-Watt)
35[1] TOP500 Supercomputer List – Dongarra, Meuer, et al. – November 2008 URL: http://www.top500.org[2] Green500 Supercomputer List – November 2008 URL: http://www.green500.org
– November 2008:• 1.08 MWatt
• 193 Mflop/(s-Watt)
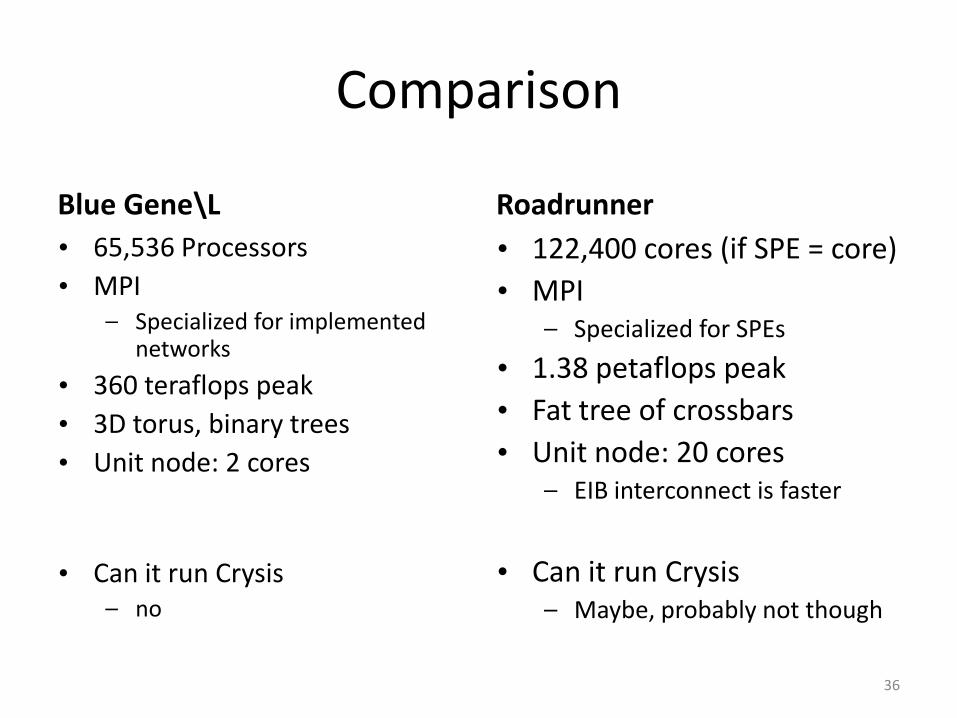
Comparison
Blue Gene\L
• 65,536 Processors
• MPI– Specialized for implemented
networks
• 360 teraflops peak
• 3D torus, binary trees
• Unit node: 2 cores
• Can it run Crysis– no
Roadrunner
• 122,400 cores (if SPE = core)
• MPI– Specialized for SPEs
• 1.38 petaflops peak
• Fat tree of crossbars
• Unit node: 20 cores– EIB interconnect is faster
• Can it run Crysis– Maybe, probably not though
36

Parting Thoughts
• General Trends:– Specialization of processing units
• More accelerator based architectures
– Move functionality on chip. • Reduction in power
• Faster networks
– Coherence is managed with the help of higher level abstractions
– More cores and memory• 48 bits of address space => 32 TB
37

References
• TOP500 Supercomputer List – Dongarra, Meuer, et al. – November 2008 URL: http://www.top500.org
• Green500 Supercomputer List – November 2008 URL: http://www.green500.org
• T.H. Dunigan, Jr., J.S. Vetter et al., Performance Evaluation of the Cray X1 Distributed Shared Memory Architecture, IEEE Micro, 25(1):30-40, 2005.
• A. Gara, M. A. Blumrich, D. Chen, G. L.-T. Chiu, P. Coteus, M. E. Giampapa, R. A. Haring, P. Heidelberger, D. Hoenicke, G. V. Kopcsay, T. A. Liebsch, M. Ohmacht, B. D. Steinmacher-Burow, T. Takken, and P. Vranas. Overview of the Blue Gene/L System Architecture. IBM
• Journal of Research and Development, 49(2/3):195–212, 2005.
• Kevin J. Barker , Kei Davis , Adolfy Hoisie , Darren J. Kerbyson , Mike Lang , Scott Pakin , Jose C. Sancho, Entering the petaflop era: the architecture and performance of
• Roadrunner, Proceedings of the 2008 ACM/IEEE conference on Supercomputing, November 15-21, 2008, Austin, Texas [doi>10.1145/1413370.1413372]
• Kurzweil, Ray. “Growth of Supercomputer Power” 2008 .URL: http://www.singularity.com/charts/page71.html
• J.G. Koomey, “Estimating Total Power Consumption by Servers in the U.S. and the World”; http://enterprise.amd.com/Downloads/svrpwrusecompletefinal.pdf.
38