HIGH-MARGIN, LIQUIDS-RICH PRODUCTION IN THE …€¦ · december 2017 high-margin, liquids-rich...
22
December 2017 HIGH-MARGIN, LIQUIDS-RICH PRODUCTION IN THE WORLD- CLASS MONTNEY BIGSTONE REGION
Transcript of HIGH-MARGIN, LIQUIDS-RICH PRODUCTION IN THE …€¦ · december 2017 high-margin, liquids-rich...
December 2017
HIGH-MARGIN, LIQUIDS-RICH
PRODUCTION IN THE WORLD-
CLASS MONTNEY BIGSTONE
REGION
WHY OWN DELPHI…….
Pure Play Montney E&P Company with WORLD
CLASS ASSETS AND A TRACK RECORD OF
SUCCESSFUL RESOURCE DEVELOPMENT
AND DELINEATION
With a premium land position in the world-class Montney Bigstone region...high
and increasing well condensate rates...robust well economics...extensive
owned infrastructure…low capital costs…ample market access and limited
commodity price risk through 2019...a solid balance sheet…and consistent
improvements in already superior well results as the drilling program expands
and moves south and west.
December 2017 2
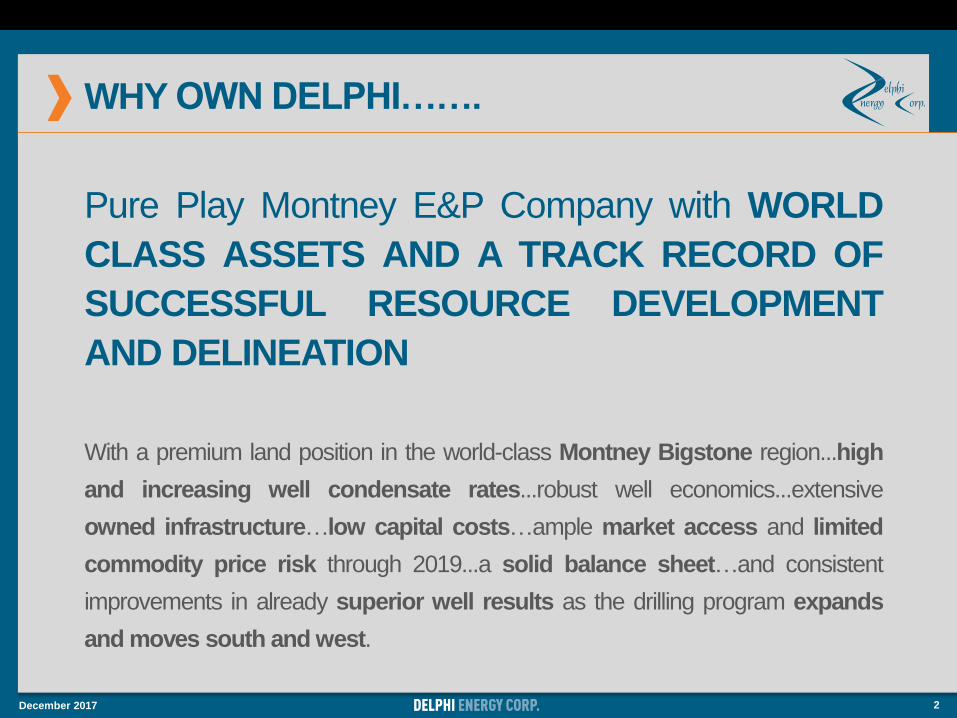
BIGSTONE – SOUTHERN END OF PROLIFIC LIQUIDS
RICH MONTNEY TREND
December 2017 3
2012 2013 2014 2015 2016 2017F
68
65
6
Delphi Bigstone Montney Wells Drilled
17
IRR
Bigstone economics rank high on the trendConsistent top tier well results
Grande Prairie
Bigstone
Montney
Edmonton
Calgary
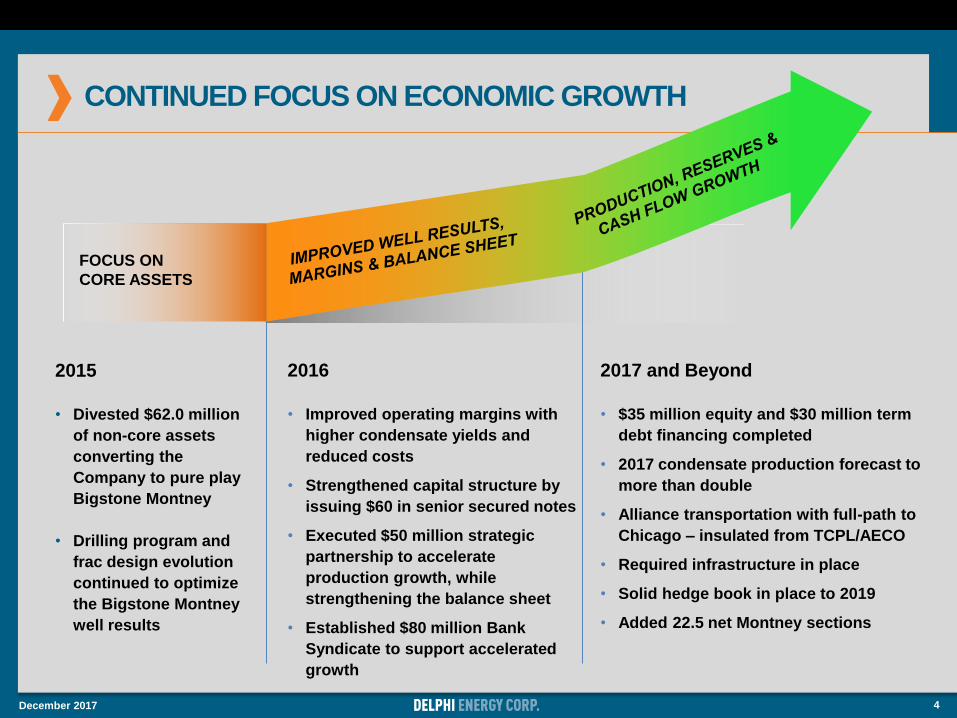
CONTINUED FOCUS ON ECONOMIC GROWTH
December 2017 4
FOCUS ON
CORE ASSETS
2015
• Divested $62.0 million
of non-core assets
converting the
Company to pure play
Bigstone Montney
• Drilling program and
frac design evolution
continued to optimize
the Bigstone Montney
well results
2016
• Improved operating margins with
higher condensate yields and
reduced costs
• Strengthened capital structure by
issuing $60 in senior secured notes
• Executed $50 million strategic
partnership to accelerate
production growth, while
strengthening the balance sheet
• Established $80 million Bank
Syndicate to support accelerated
growth
2017 and Beyond
• $35 million equity and $30 million term
debt financing completed
• 2017 condensate production forecast to
more than double
• Alliance transportation with full-path to
Chicago – insulated from TCPL/AECO
• Required infrastructure in place
• Solid hedge book in place to 2019
• Added 22.5 net Montney sections
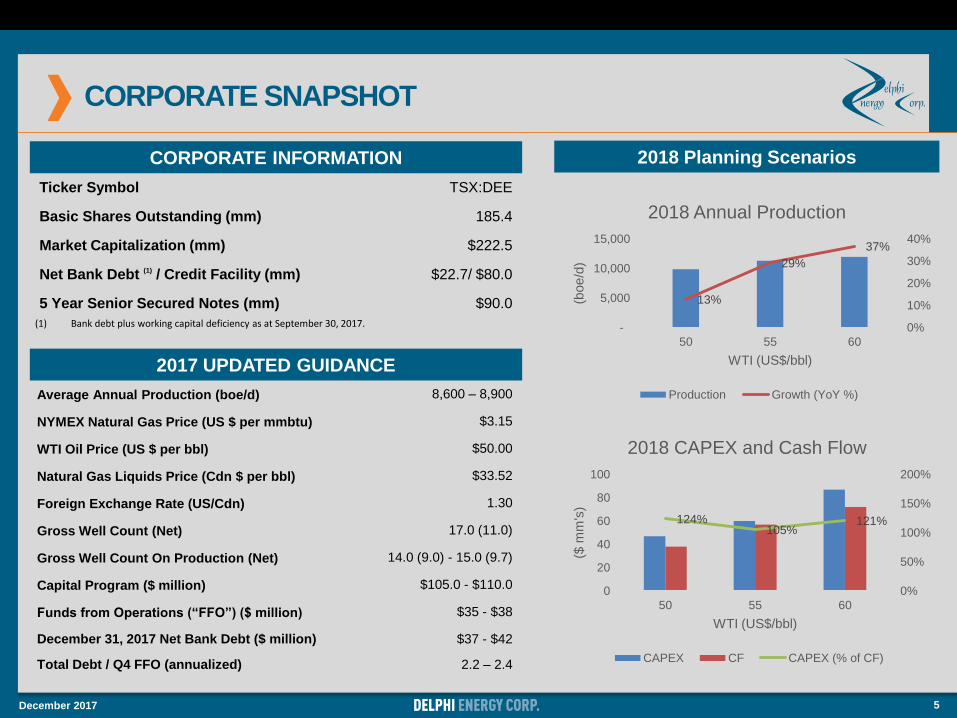
CORPORATE SNAPSHOT
2017 UPDATED GUIDANCE
Average Annual Production (boe/d) 8,600 – 8,900
NYMEX Natural Gas Price (US $ per mmbtu) $3.15
WTI Oil Price (US $ per bbl) $50.00
Natural Gas Liquids Price (Cdn $ per bbl) $33.52
Foreign Exchange Rate (US/Cdn) 1.30
Gross Well Count (Net) 17.0 (11.0)
Gross Well Count On Production (Net) 14.0 (9.0) - 15.0 (9.7)
Capital Program ($ million) $105.0 - $110.0
Funds from Operations (“FFO”) ($ million) $35 - $38
December 31, 2017 Net Bank Debt ($ million) $37 - $42
Total Debt / Q4 FFO (annualized) 2.2 – 2.4
(1) Bank debt plus working capital deficiency as at September 30, 2017.
5
CORPORATE INFORMATION
Ticker Symbol TSX:DEE
Basic Shares Outstanding (mm) 185.4
Market Capitalization (mm) $222.5
Net Bank Debt (1) / Credit Facility (mm) $22.7/ $80.0
5 Year Senior Secured Notes (mm) $90.0
December 2017
2018 Planning Scenarios
13%
29%
37%
0%
10%
20%
30%
40%
-
5,000
10,000
15,000
50 55 60
(boe/d
)
WTI (US$/bbl)
2018 Annual Production
Production Growth (YoY %)
124%105%
121%
0%
50%
100%
150%
200%
0
20
40
60
80
100
50 55 60
($ m
m's
)
WTI (US$/bbl)
2018 CAPEX and Cash Flow
CAPEX CF CAPEX (% of CF)
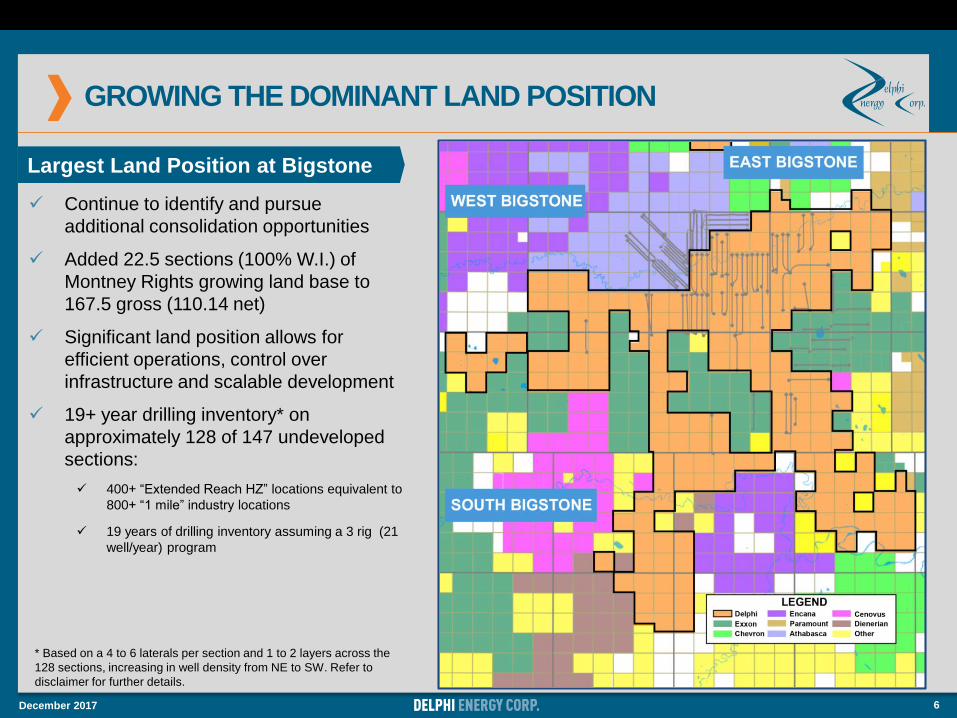
GROWING THE DOMINANT LAND POSITION
Continue to identify and pursue
additional consolidation opportunities
Added 22.5 sections (100% W.I.) of
Montney Rights growing land base to
167.5 gross (110.14 net)
Significant land position allows for
efficient operations, control over
infrastructure and scalable development
19+ year drilling inventory* on
approximately 128 of 147 undeveloped
sections:
400+ “Extended Reach HZ” locations equivalent to
800+ “1 mile” industry locations
19 years of drilling inventory assuming a 3 rig (21
well/year) program
* Based on a 4 to 6 laterals per section and 1 to 2 layers across the
128 sections, increasing in well density from NE to SW. Refer to
disclaimer for further details.
December 2017 6
Largest Land Position at Bigstone
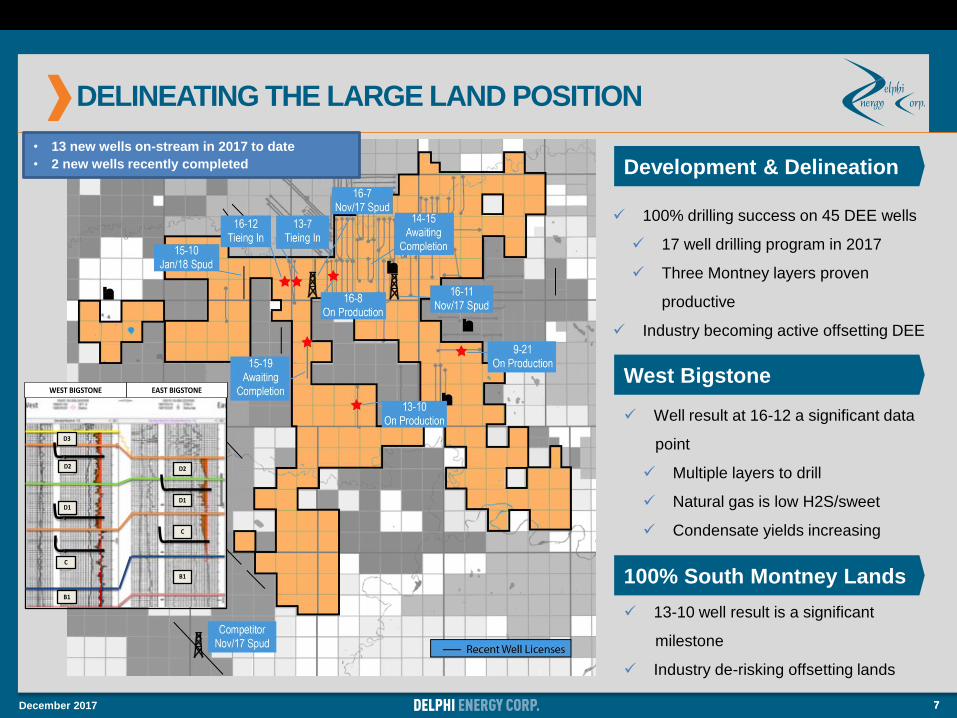
DELINEATING THE LARGE LAND POSITION
December 2017 7
• 13 new wells on-stream in 2017 to date
• 2 new wells recently completed
7
WEST BIGSTONE EAST BIGSTONE
D3
D2
D1
B1
C
D1
C
D2
B1
Development & Delineation
100% South Montney Lands
100% drilling success on 45 DEE wells
17 well drilling program in 2017
Three Montney layers proven
productive
Industry becoming active offsetting DEE
13-10 well result is a significant
milestone
Industry de-risking offsetting lands
Well result at 16-12 a significant data
point
Multiple layers to drill
Natural gas is low H2S/sweet
Condensate yields increasing
West Bigstone
December 2017 8
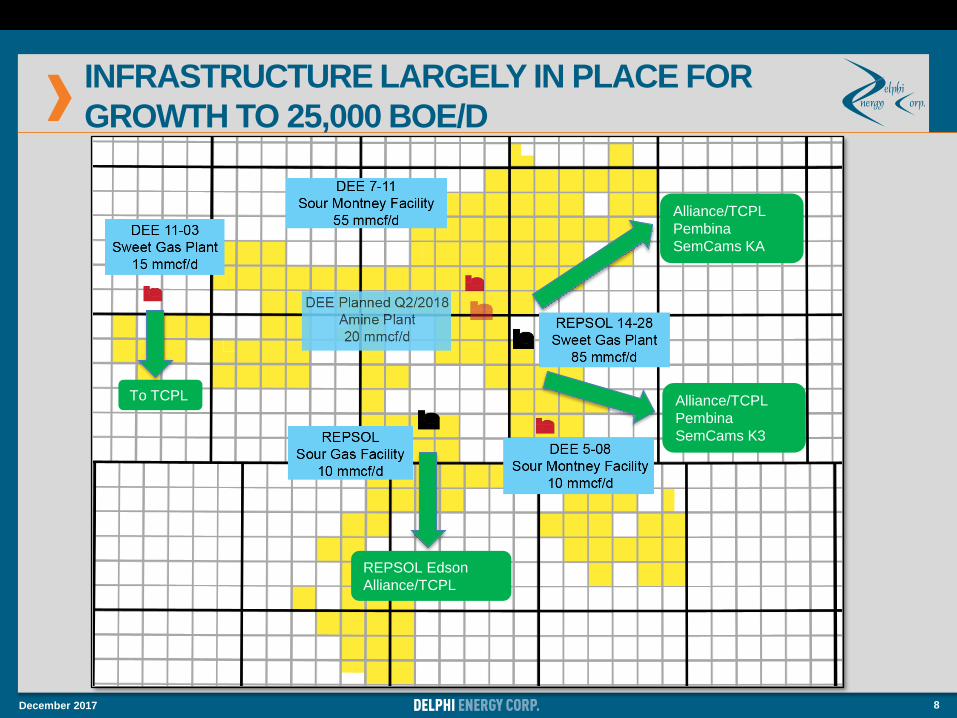
INFRASTRUCTURE LARGELY IN PLACE FOR
GROWTH TO 25,000 BOE/D
Alliance/TCPL
Pembina
SemCams KA
REPSOL Edson
Alliance/TCPL
Alliance/TCPL
Pembina
SemCams K3
To TCPL
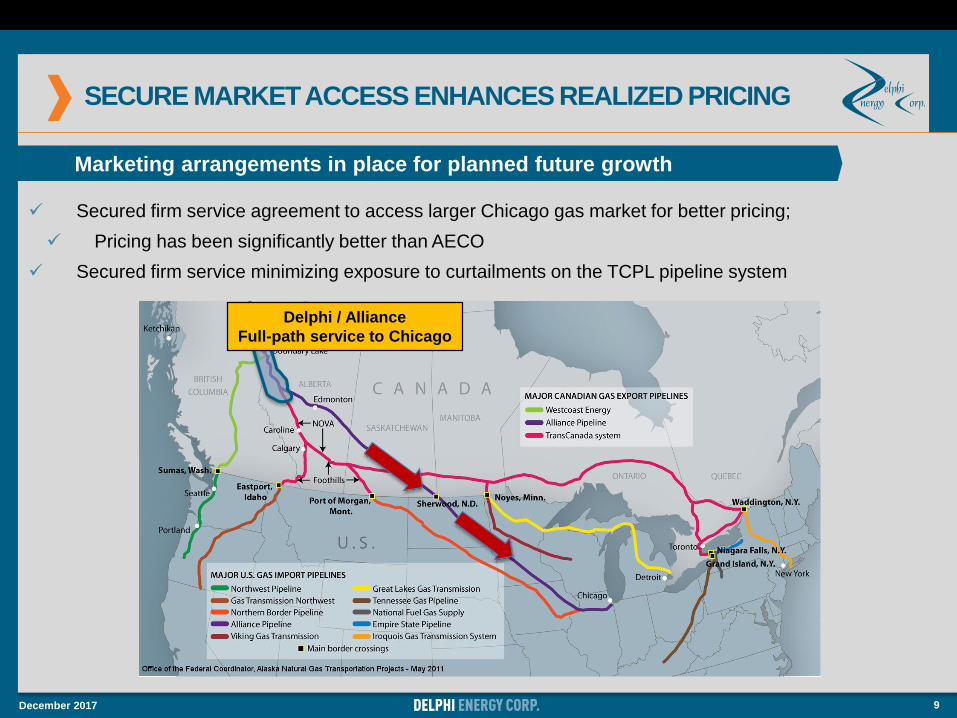
SECURE MARKET ACCESS ENHANCES REALIZED PRICING
December 2017 9
Marketing arrangements in place for planned future growth
Secured firm service agreement to access larger Chicago gas market for better pricing;
Pricing has been significantly better than AECO
Secured firm service minimizing exposure to curtailments on the TCPL pipeline system
Delphi / Alliance
Full-path service to Chicago
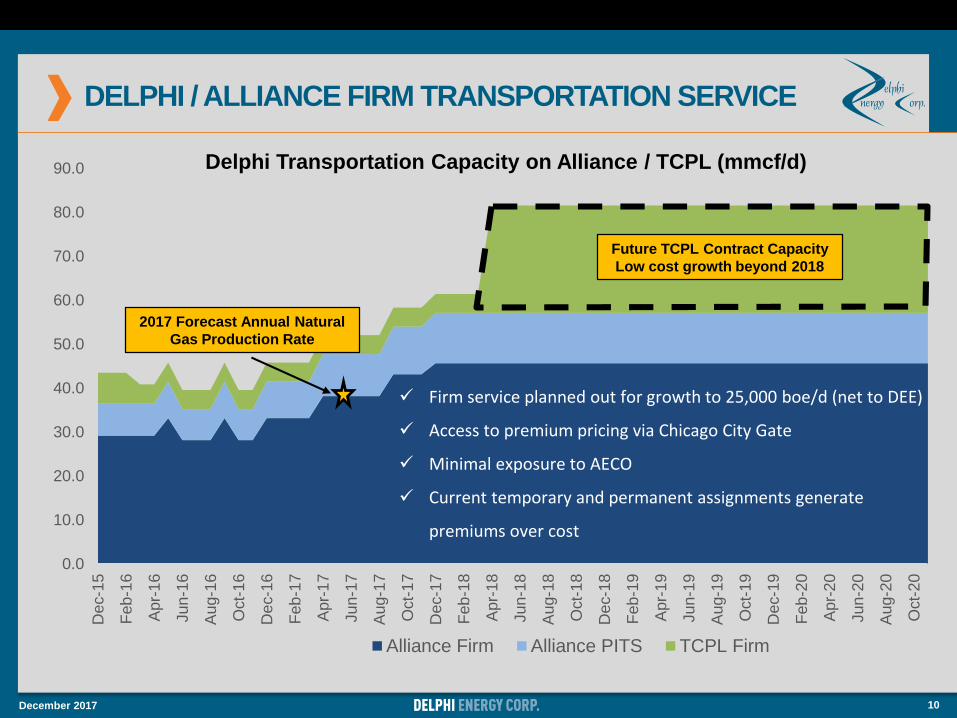
DELPHI / ALLIANCE FIRM TRANSPORTATION SERVICE
December 2017 10
0.0
10.0
20.0
30.0
40.0
50.0
60.0
70.0
80.0
90.0
Dec-1
5
Feb
-16
Apr-
16
Jun
-16
Aug-1
6
Oct-
16
Dec-1
6
Feb
-17
Apr-
17
Jun
-17
Aug-1
7
Oct-
17
Dec-1
7
Feb
-18
Apr-
18
Jun
-18
Aug-1
8
Oct-
18
Dec-1
8
Feb
-19
Apr-
19
Jun
-19
Aug-1
9
Oct-
19
Dec-1
9
Feb
-20
Apr-
20
Jun
-20
Aug-2
0
Oct-
20
Delphi Transportation Capacity on Alliance / TCPL (mmcf/d)
Alliance Firm Alliance PITS TCPL Firm
Future TCPL Contract Capacity
Low cost growth beyond 2018
2017 Forecast Annual Natural
Gas Production Rate
Firm service planned out for growth to 25,000 boe/d (net to DEE)
Access to premium pricing via Chicago City Gate
Minimal exposure to AECO
Current temporary and permanent assignments generate
premiums over cost
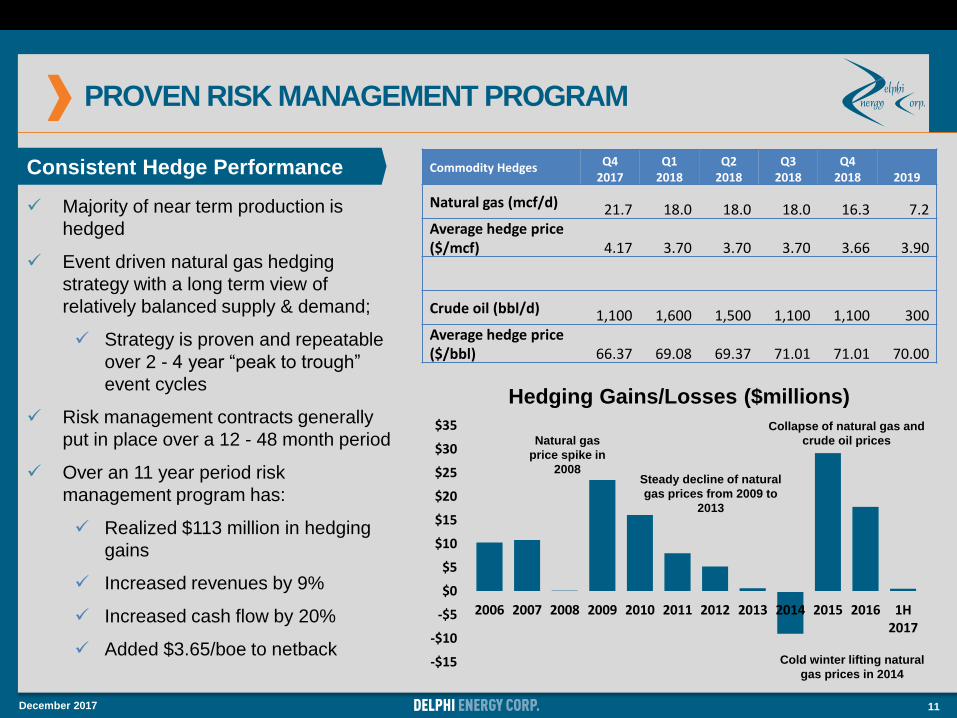
PROVEN RISK MANAGEMENT PROGRAM
Majority of near term production is
hedged
Event driven natural gas hedging
strategy with a long term view of
relatively balanced supply & demand;
Strategy is proven and repeatable
over 2 - 4 year “peak to trough”
event cycles
Risk management contracts generally
put in place over a 12 - 48 month period
Over an 11 year period risk
management program has:
Realized $113 million in hedging
gains
Increased revenues by 9%
Increased cash flow by 20%
Added $3.65/boe to netback
December 2017 11
Consistent Hedge Performance
-$15
-$10
-$5
$0
$5
$10
$15
$20
$25
$30
$35
2006 2007 2008 2009 2010 2011 2012 2013 2014 2015 2016 1H2017
Hedging Gains/Losses ($millions)
Cold winter lifting natural
gas prices in 2014
Natural gas
price spike in
2008Steady decline of natural
gas prices from 2009 to
2013
Collapse of natural gas and
crude oil prices
Commodity Hedges Q4 2017
Q1 2018
Q2 2018
Q3 2018
Q4 2018 2019
Natural gas (mcf/d) 21.7 18.0 18.0 18.0 16.3 7.2Average hedge price ($/mcf) 4.17 3.70 3.70 3.70 3.66 3.90
Crude oil (bbl/d) 1,100 1,600 1,500 1,100 1,100 300Average hedge price ($/bbl) 66.37 69.08 69.37 71.01 71.01 70.00
FRAC INNOVATIONS DRIVING PRODUCTION RATES
December 2017 12
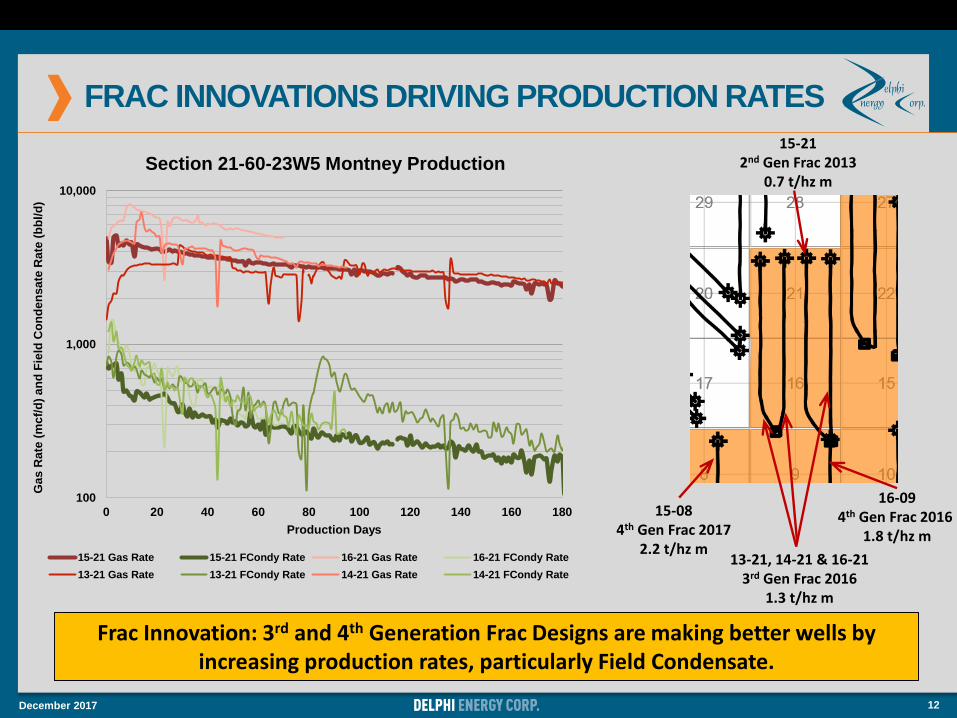
Frac Innovation: 3rd and 4th Generation Frac Designs are making better wells by increasing production rates, particularly Field Condensate.
15-212nd Gen Frac 2013
0.7 t/hz m
13-21, 14-21 & 16-213rd Gen Frac 2016
1.3 t/hz m
15-084th Gen Frac 2017
2.2 t/hz m
16-094th Gen Frac 2016
1.8 t/hz m
100
1,000
10,000
0 20 40 60 80 100 120 140 160 180
Ga
s R
ate
(m
cf/
d)
an
d F
ield
Co
nd
en
sa
te R
ate
(b
bl/
d)
Production Days
Section 21-60-23W5 Montney Production
15-21 Gas Rate 15-21 FCondy Rate 16-21 Gas Rate 16-21 FCondy Rate
13-21 Gas Rate 13-21 FCondy Rate 14-21 Gas Rate 14-21 FCondy Rate
RECENT WELL RESULTS YIELD EVEN GREATER MARGINS
December 2017 13
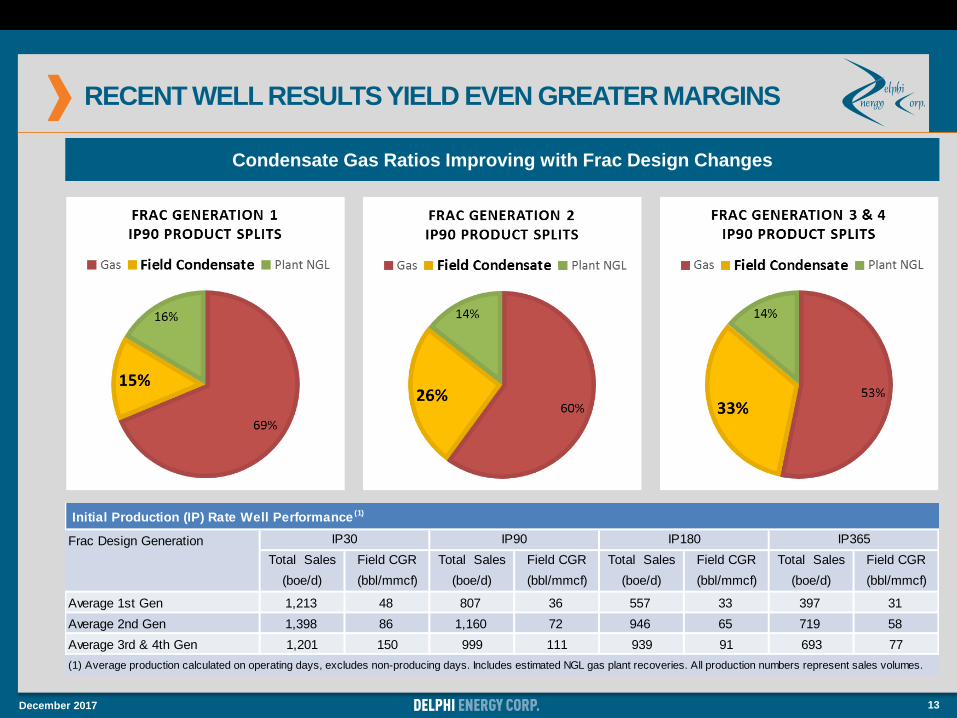
Condensate Gas Ratios Improving with Frac Design Changes
Initial Production (IP) Rate Well Performance (1)
Frac Design Generation
Total Sales Field CGR Total Sales Field CGR Total Sales Field CGR Total Sales Field CGR
(boe/d) (bbl/mmcf) (boe/d) (bbl/mmcf) (boe/d) (bbl/mmcf) (boe/d) (bbl/mmcf)
Average 1st Gen 1,213 48 807 36 557 33 397 31
Average 2nd Gen 1,398 86 1,160 72 946 65 719 58
Average 3rd & 4th Gen 1,201 150 999 111 939 91 693 77
(1) Average production calculated on operating days, excludes non-producing days. Includes estimated NGL gas plant recoveries. All production numbers represent sales volumes.
IP30 IP90 IP180 IP365
DELPHI WELL COST IMPROVEMENTS
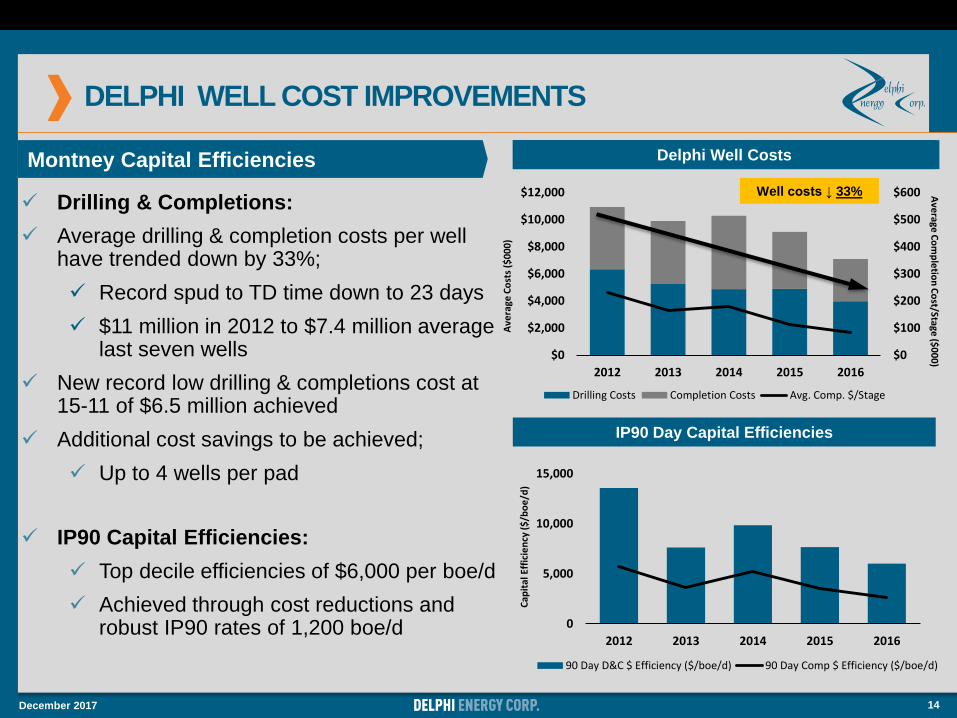
Drilling & Completions:
Average drilling & completion costs per well have trended down by 33%;
Record spud to TD time down to 23 days
$11 million in 2012 to $7.4 million average last seven wells
New record low drilling & completions cost at 15-11 of $6.5 million achieved
Additional cost savings to be achieved;
Up to 4 wells per pad
IP90 Capital Efficiencies:
Top decile efficiencies of $6,000 per boe/d
Achieved through cost reductions and robust IP90 rates of 1,200 boe/d
December 2017 14
Delphi Well CostsDelphi Well Costs
IP90 Day Capital Efficiencies
Montney Capital Efficiencies
0
5,000
10,000
15,000
2012 2013 2014 2015 2016
90 Day D&C $ Efficiency ($/boe/d) 90 Day Comp $ Efficiency ($/boe/d)
Cap
ital
Eff
icie
ncy
($
/bo
e/d
)
$0
$100
$200
$300
$400
$500
$600
$0
$2,000
$4,000
$6,000
$8,000
$10,000
$12,000
2012 2013 2014 2015 2016
Drilling Costs Completion Costs Avg. Comp. $/Stage
Ave
rage
Co
sts
($0
00
)
Ave
rage C
om
ple
tion
Co
st/Stage ($
00
0)
Well costs ↓ 33%
CONSISTENT ECONOMIC RESERVE GROWTH
December 2017 15
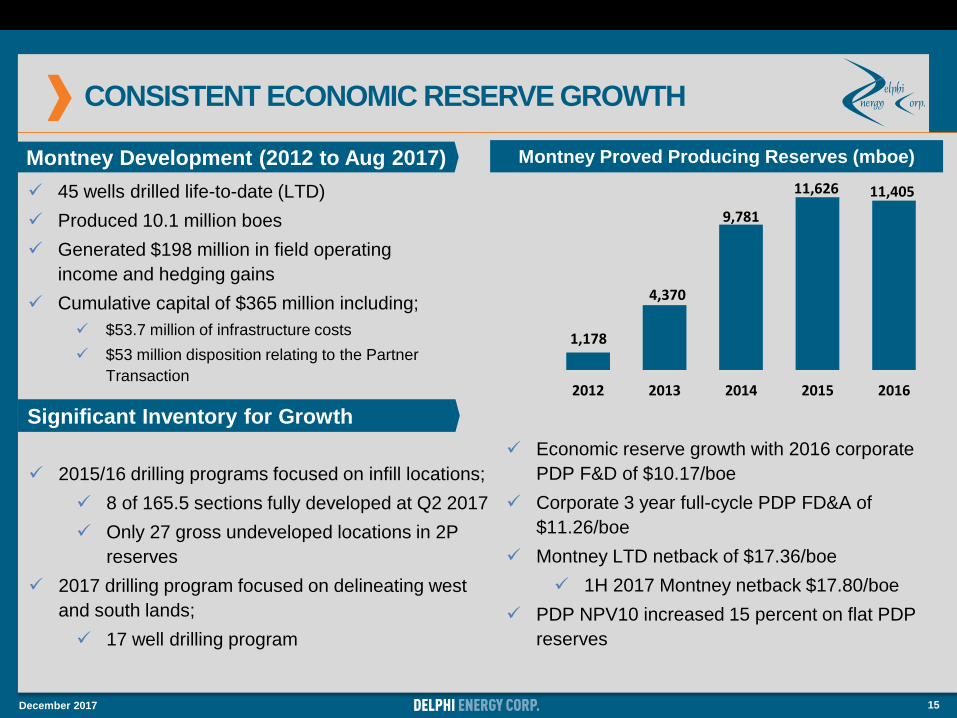
2012 2013 2014 2015 2016
11,626
9,781
4,370
1,178
Montney Proved Producing Reserves (mboe)
45 wells drilled life-to-date (LTD)
Produced 10.1 million boes
Generated $198 million in field operating
income and hedging gains
Cumulative capital of $365 million including;
$53.7 million of infrastructure costs
$53 million disposition relating to the Partner
Transaction
Significant Inventory for Growth
Montney Development (2012 to Aug 2017)
2015/16 drilling programs focused on infill locations;
8 of 165.5 sections fully developed at Q2 2017
Only 27 gross undeveloped locations in 2P
reserves
2017 drilling program focused on delineating west
and south lands;
17 well drilling program
11,405
Economic reserve growth with 2016 corporate
PDP F&D of $10.17/boe
Corporate 3 year full-cycle PDP FD&A of
$11.26/boe
Montney LTD netback of $17.36/boe
1H 2017 Montney netback $17.80/boe
PDP NPV10 increased 15 percent on flat PDP
reserves
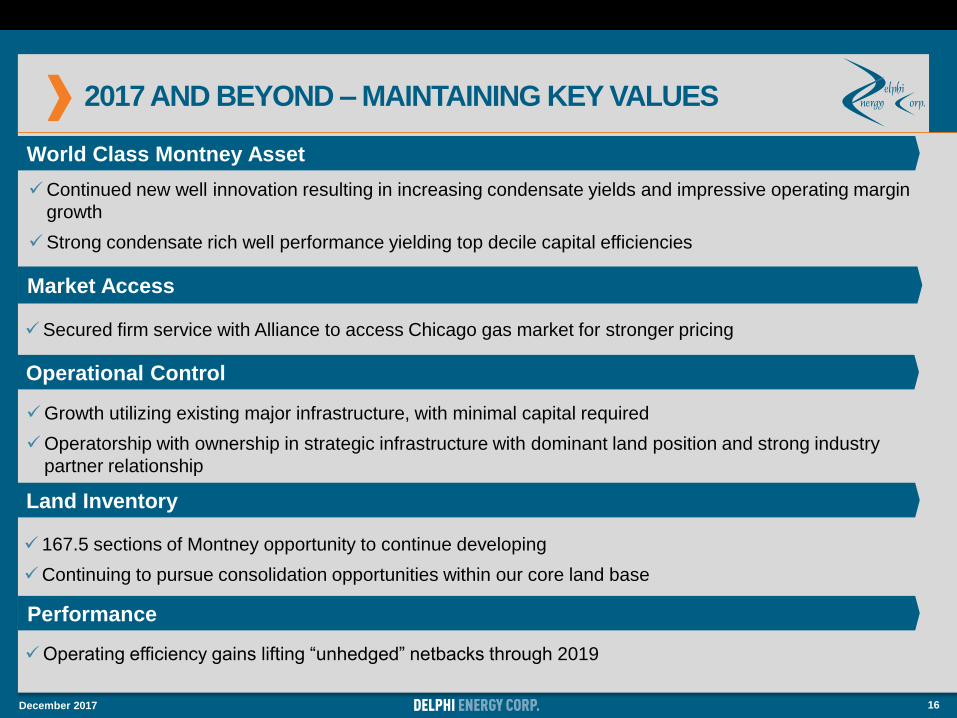
2017 AND BEYOND – MAINTAINING KEY VALUES
December 2017 16
Continued new well innovation resulting in increasing condensate yields and impressive operating margin
growth
Strong condensate rich well performance yielding top decile capital efficiencies
World Class Montney Asset
Operational Control
Land Inventory
Market Access
Performance
Growth utilizing existing major infrastructure, with minimal capital required
Operatorship with ownership in strategic infrastructure with dominant land position and strong industry
partner relationship
Operating efficiency gains lifting “unhedged” netbacks through 2019
167.5 sections of Montney opportunity to continue developing
Continuing to pursue consolidation opportunities within our core land base
Secured firm service with Alliance to access Chicago gas market for stronger pricing
FORWARD-LOOKING STATEMENTS
AND IMPORTANT NOTES
The presentation contains forward-looking statements and forward-looking information within the meaning of applicable Canadian securities laws. These statements relateto future events or the Company’s future performance and are based upon the Company’s internal assumptions and expectations. All statements other than statements ofpresent or historical fact are forward-looking statements. Forward-looking statements are often, but not always, identified by the use of any of the words “expect”,“anticipate”, “continue”, “estimate”, “may”, “will”, “should”, “believe”, "intends”, “forecast”, “plans”, “guidance”, “budget” and similar expressions. More particularly and withoutlimitation, this presentation contains forward-looking statements and information relating to petroleum and natural gas production estimates and weighting, projected crudeoil and natural gas prices, future exchange rates, expectations as to royalty rates, expectations as to transportation and operating costs, expectations as to general andadministrative costs and interest expense, expectations as to capital expenditures and net debt, planned capital spending, future liquidity and Delphi’s ability to fund ongoingcapital requirements through operating cash flows and its credit facilities, supply and demand fundamentals for oil and gas commodities, timing and success of developmentand exploitation activities, cash availability for the financing of capital expenditures, access to third-party infrastructure, treatment under governmental regulatory regimesand tax laws and future environmental regulations. Furthermore, statements relating to “reserves” are deemed to be forward-looking statements as they involve the impliedassessment, based on certain estimates and assumptions that the reserves described can be profitable in the future. The forward-looking statements and informationcontained in this presentation are based on certain key expectations and assumptions made by Delphi. The following are certain material assumptions on which theforward-looking statements and information contained in this presentation are based: the stability of the global and national economic environment, the stability of andcommercial acceptability of tax, royalty and regulatory regimes applicable to Delphi, exploitation and development activities being consistent with management’sexpectations, production levels of Delphi being consistent with management’s expectations, the absence of significant project delays, the stability of oil and gas prices, theabsence of significant fluctuations in foreign exchange rates and interest rates, the stability of costs of oil and gas development and production in Western Canada, includingoperating costs, the timing and size of development plans and capital expenditures, availability of third party infrastructure for transportation, processing or marketing of oiland natural gas volumes, prices and availability of oilfield services and equipment being consistent with management’s expectations, the availability of, and competition for,among other things, pipeline capacity, skilled personnel and drilling and related services and equipment, results of development and exploitation activities that are consistentwith management’s expectations, weather affecting Delphi’s ability to develop and produce as expected, contracted parties providing goods and services on the agreedtimeframes, Delphi’s ability to manage environmental risks and hazards and the cost of complying with environmental regulations, the accuracy of operating cost estimates,the accurate estimation of oil and gas reserves, future exploitation, development and production results and Delphi’s ability to market oil and natural gas successfully tocurrent and new customers. Additionally, estimates as to expected average annual production rates assume that no unexpected outages occur in the infrastructure that theCompany relies on to produce its wells, that existing wells continue to meet production expectations and any future wells scheduled to come on in the coming year meettiming and production expectations. Commodity prices used in the determination of forecast revenues are based upon general economic conditions, commodity supply anddemand forecasts and publicly available price forecasts. The Company continually monitors its forecast assumptions to ensure the stakeholders are informed of materialvariances from previously communicated expectations. Financial outlook information contained in this presentation about prospective results of operations, financial positionor cash flows is based on assumptions about future events, including economic conditions and proposed courses of action, based on management’s assessment of therelevant information currently available. Readers are cautioned that such financial outlook information contained in this presentation should not be used for purposes otherthan for which it is disclosed. Although the Company believes that the expectations reflected in such forward-looking statements and information are reasonable, it can giveno assurance that such expectations will prove to be correct and such forward-looking statements should not be unduly relied upon. Since forward-looking statements andinformation address future events and conditions, by their very nature they involve inherent known and unknown risks and uncertainties. Delphi’s actual results,performance or achievements could differ materially from those expressed in, or implied by, these forward-looking statements and, accordingly, no assurance can be giventhat any of the events anticipated by the forward-looking statements will transpire or occur, or if any of them do so, what benefits Delphi will derive therefrom. Should one ormore of these risks or uncertainties materialize, or should assumptions underlying forward-looking statements prove incorrect, actual results may vary materially from thosecurrently anticipated due to a number of factors and risks. These include, but are not limited to, the risks associated with the oil and gas industry in general such asoperational risks in development, exploration and production, delays or changes in plans with respect to exploration or development projects or capital expenditures, theuncertainty of estimates and projections relating to production rates, costs and expenses, commodity price and exchange rate fluctuations, marketing and transportation,environmental risks, competition from others for scarce resources, the ability to access sufficient capital from internal and external sources, changes in governmentalregulation of the oil and gas industry and changes in tax, royalty and environmental legislation. Additional information on these and other factors that could affect theCompany’s operations or financial results are included in the Company’s most recent Annual Information Form and other reports on file with the applicable securitiesregulatory authorities and may be accessed through the SEDAR website (www.sedar.com). Readers are cautioned that the foregoing list of factors is not exhaustive.Furthermore, the forward-looking statements contained in this presentation are made as of the date of this presentation for the purpose of providing the readers with theCompany’s expectations for the coming year. The forward-looking statements and information may not be appropriate for other purposes. Delphi undertakes no obligationto update publicly or revise any forward-looking statements or information, whether as a result of new information, future events or otherwise, unless so required byapplicable securities laws. The forward-looking statements contained in this presentation are expressly qualified in their entirety by this cautionary statement.
December 2017 17
FORWARD-LOOKING STATEMENTS
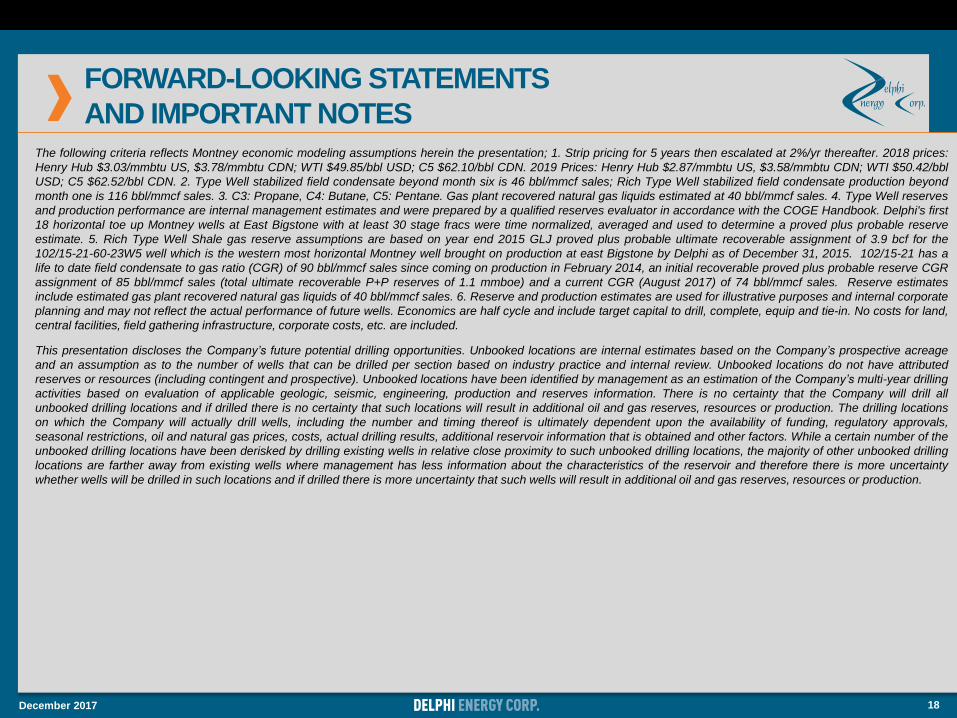
AND IMPORTANT NOTESThe following criteria reflects Montney economic modeling assumptions herein the presentation; 1. Strip pricing for 5 years then escalated at 2%/yr thereafter. 2018 prices:
Henry Hub $3.03/mmbtu US, $3.78/mmbtu CDN; WTI $49.85/bbl USD; C5 $62.10/bbl CDN. 2019 Prices: Henry Hub $2.87/mmbtu US, $3.58/mmbtu CDN; WTI $50.42/bbl
USD; C5 $62.52/bbl CDN. 2. Type Well stabilized field condensate beyond month six is 46 bbl/mmcf sales; Rich Type Well stabilized field condensate production beyond
month one is 116 bbl/mmcf sales. 3. C3: Propane, C4: Butane, C5: Pentane. Gas plant recovered natural gas liquids estimated at 40 bbl/mmcf sales. 4. Type Well reserves
and production performance are internal management estimates and were prepared by a qualified reserves evaluator in accordance with the COGE Handbook. Delphi's first
18 horizontal toe up Montney wells at East Bigstone with at least 30 stage fracs were time normalized, averaged and used to determine a proved plus probable reserve
estimate. 5. Rich Type Well Shale gas reserve assumptions are based on year end 2015 GLJ proved plus probable ultimate recoverable assignment of 3.9 bcf for the
102/15-21-60-23W5 well which is the western most horizontal Montney well brought on production at east Bigstone by Delphi as of December 31, 2015. 102/15-21 has a
life to date field condensate to gas ratio (CGR) of 90 bbl/mmcf sales since coming on production in February 2014, an initial recoverable proved plus probable reserve CGR
assignment of 85 bbl/mmcf sales (total ultimate recoverable P+P reserves of 1.1 mmboe) and a current CGR (August 2017) of 74 bbl/mmcf sales. Reserve estimates
include estimated gas plant recovered natural gas liquids of 40 bbl/mmcf sales. 6. Reserve and production estimates are used for illustrative purposes and internal corporate
planning and may not reflect the actual performance of future wells. Economics are half cycle and include target capital to drill, complete, equip and tie-in. No costs for land,
central facilities, field gathering infrastructure, corporate costs, etc. are included.
This presentation discloses the Company’s future potential drilling opportunities. Unbooked locations are internal estimates based on the Company’s prospective acreage
and an assumption as to the number of wells that can be drilled per section based on industry practice and internal review. Unbooked locations do not have attributed
reserves or resources (including contingent and prospective). Unbooked locations have been identified by management as an estimation of the Company’s multi-year drilling
activities based on evaluation of applicable geologic, seismic, engineering, production and reserves information. There is no certainty that the Company will drill all
unbooked drilling locations and if drilled there is no certainty that such locations will result in additional oil and gas reserves, resources or production. The drilling locations
on which the Company will actually drill wells, including the number and timing thereof is ultimately dependent upon the availability of funding, regulatory approvals,
seasonal restrictions, oil and natural gas prices, costs, actual drilling results, additional reservoir information that is obtained and other factors. While a certain number of the
unbooked drilling locations have been derisked by drilling existing wells in relative close proximity to such unbooked drilling locations, the majority of other unbooked drilling
locations are farther away from existing wells where management has less information about the characteristics of the reservoir and therefore there is more uncertainty
whether wells will be drilled in such locations and if drilled there is more uncertainty that such wells will result in additional oil and gas reserves, resources or production.
December 2017 18

APPENDIX
December 2017 19
INDIVIDUAL MONTNEY WELL DATA
December 2017 20
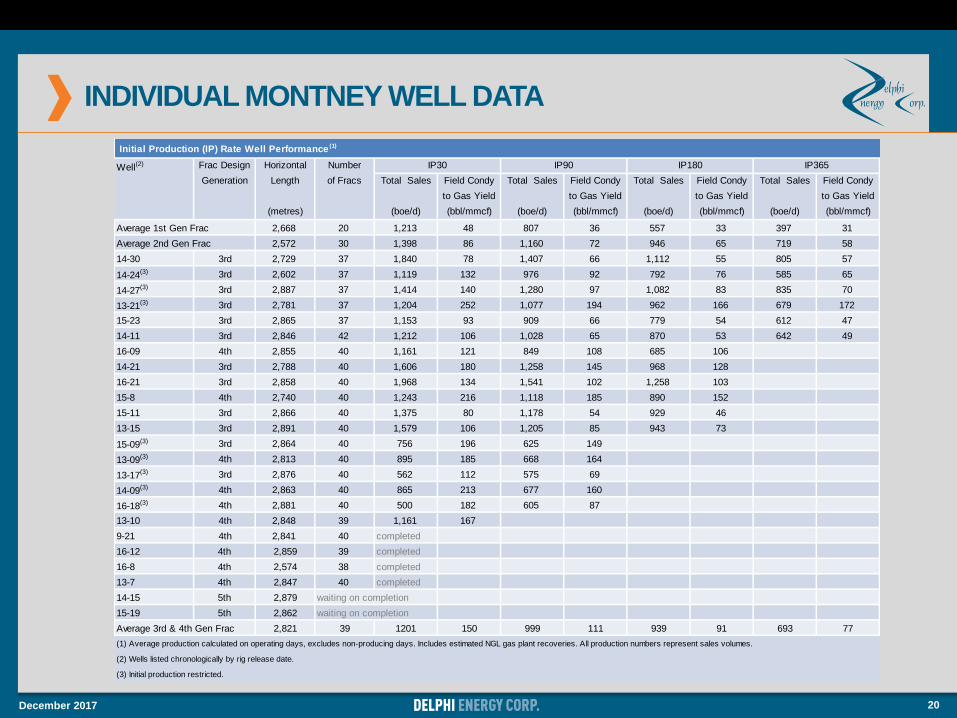
Initial Production (IP) Rate Well Performance (1)
Well(2) Frac Design Horizontal Number
Generation Length of Fracs Total Sales Field Condy Total Sales Field Condy Total Sales Field Condy Total Sales Field Condy
to Gas Yield to Gas Yield to Gas Yield to Gas Yield
(metres) (boe/d) (bbl/mmcf) (boe/d) (bbl/mmcf) (boe/d) (bbl/mmcf) (boe/d) (bbl/mmcf)
Average 1st Gen Frac 2,668 20 1,213 48 807 36 557 33 397 31
Average 2nd Gen Frac 2,572 30 1,398 86 1,160 72 946 65 719 58
14-30 3rd 2,729 37 1,840 78 1,407 66 1,112 55 805 57
14-24(3) 3rd 2,602 37 1,119 132 976 92 792 76 585 65
14-27(3) 3rd 2,887 37 1,414 140 1,280 97 1,082 83 835 70
13-21(3) 3rd 2,781 37 1,204 252 1,077 194 962 166 679 172
15-23 3rd 2,865 37 1,153 93 909 66 779 54 612 47
14-11 3rd 2,846 42 1,212 106 1,028 65 870 53 642 49
16-09 4th 2,855 40 1,161 121 849 108 685 106
14-21 3rd 2,788 40 1,606 180 1,258 145 968 128
16-21 3rd 2,858 40 1,968 134 1,541 102 1,258 103
15-8 4th 2,740 40 1,243 216 1,118 185 890 152
15-11 3rd 2,866 40 1,375 80 1,178 54 929 46
13-15 3rd 2,891 40 1,579 106 1,205 85 943 73
15-09(3) 3rd 2,864 40 756 196 625 149
13-09(3) 4th 2,813 40 895 185 668 164
13-17(3) 3rd 2,876 40 562 112 575 69
14-09(3) 4th 2,863 40 865 213 677 160
16-18(3) 4th 2,881 40 500 182 605 87
13-10 4th 2,848 39 1,161 167
9-21 4th 2,841 40 completed
16-12 4th 2,859 39 completed
16-8 4th 2,574 38 completed
13-7 4th 2,847 40 completed
14-15 5th 2,879 waiting on completion
15-19 5th 2,862 waiting on completion
Average 3rd & 4th Gen Frac 2,821 39 1201 150 999 111 939 91 693 77
(1) Average production calculated on operating days, excludes non-producing days. Includes estimated NGL gas plant recoveries. All production numbers represent sales volumes.
(2) Wells listed chronologically by rig release date.
(3) Initial production restricted.
IP30 IP90 IP180 IP365
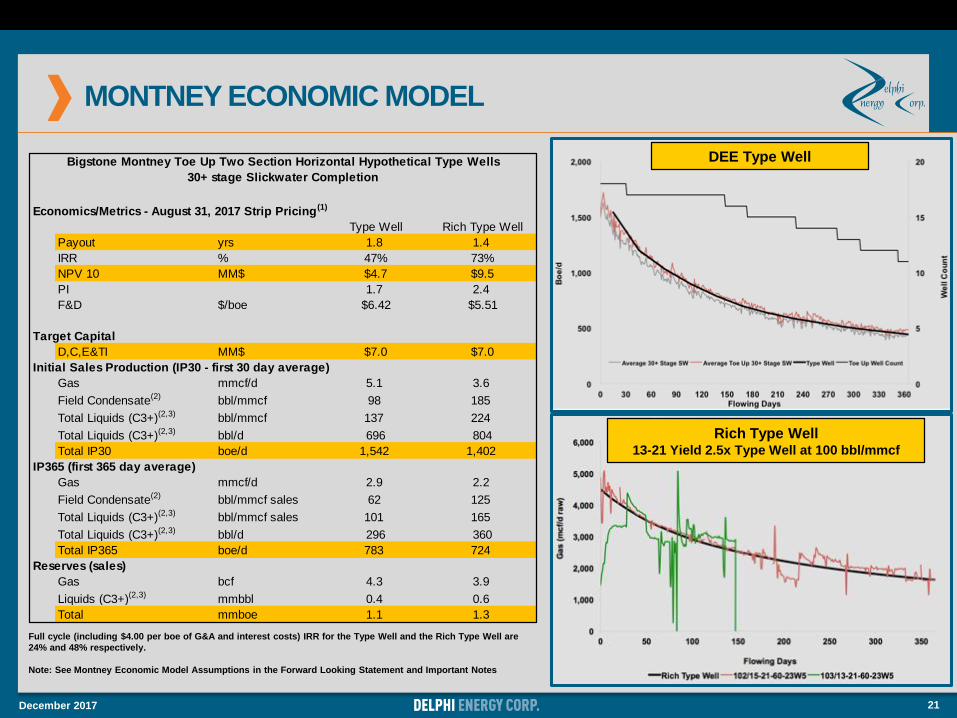
MONTNEY ECONOMIC MODEL
December 2017 21
Rich Type Well13-21 Yield 2.5x Type Well at 100 bbl/mmcf
Full cycle (including $4.00 per boe of G&A and interest costs) IRR for the Type Well and the Rich Type Well are
24% and 48% respectively.
Note: See Montney Economic Model Assumptions in the Forward Looking Statement and Important Notes
DEE Type Well
Economics/Metrics - August 31, 2017 Strip Pricing(1)
Type Well Rich Type Well
Payout yrs 1.8 1.4
IRR % 47% 73%
NPV 10 MM$ $4.7 $9.5
PI 1.7 2.4
F&D $/boe $6.42 $5.51
Target Capital
D,C,E&TI MM$ $7.0 $7.0
Initial Sales Production (IP30 - first 30 day average)
Gas mmcf/d 5.1 3.6
Field Condensate(2) bbl/mmcf 98 185
Total Liquids (C3+)(2,3) bbl/mmcf 137 224
Total Liquids (C3+)(2,3) bbl/d 696 804
Total IP30 boe/d 1,542 1,402
IP365 (first 365 day average)
Gas mmcf/d 2.9 2.2
Field Condensate(2) bbl/mmcf sales 62 125
Total Liquids (C3+)(2,3) bbl/mmcf sales 101 165
Total Liquids (C3+)(2,3) bbl/d 296 360
Total IP365 boe/d 783 724
Reserves (sales)
Gas bcf 4.3 3.9
Liquids (C3+)(2,3) mmbbl 0.4 0.6
Total mmboe 1.1 1.3
Bigstone Montney Toe Up Two Section Horizontal Hypothetical Type Wells
30+ stage Slickwater Completion

2300, 333 – 7th Avenue SW
Calgary, Alberta T2P 2Z1
P (403) 265-6171
F (403) 265-6207
www.delphienergy.ca
December 2017 24