High levels of realized dispersal and phenotypic ... · stellt das übergeordnete Ziel dieser...
129
High levels of realized dispersal and phenotypic plasticity in the polymorphic squat lobster Munida gregaria (Decapoda: Anomura: Munididae) in Patagonia and New Zealand - a multi-marker genetic and morphological approach Dissertation in partial fulfillment of the requirements for Doktor der Naturwissenschaften -Dr. rer. Nat.- in the Faculty of Biology and Chemistry (Fachbereich 2) University of Bremen, Germany Chen Wang 2016
Transcript of High levels of realized dispersal and phenotypic ... · stellt das übergeordnete Ziel dieser...
High levels of realized dispersal and phenotypic plasticity in
the polymorphic squat lobster Munida gregaria (Decapoda:
Anomura: Munididae) in Patagonia and New Zealand - a multi-marker genetic and morphological approach
Dissertation
in partial fulfillment of the requirements for
Doktor der Naturwissenschaften
-Dr. rer. Nat.-
in the Faculty of Biology and Chemistry (Fachbereich 2) University of Bremen,
Germany
Chen Wang
2016


Prüfungsausschuss
1. Gutachter: Prof. Dr. Thomas Brey Alfred-Wegener-Institut, Helmholtz-Zentrum für Polar- und Meeresforschung Funktionelle Ökologie – Bremerhaven
2. Gutachter: Prof. Dr. Martin Zimmer Leibniz-Zentrum für Marine Tropenökologie Ökologie
1. Prüfer: Prof. Dr. Kai Bischof Universität Bremen Marine Botanik
2. Prüfer: Dr. Christoph Held Alfred-Wegener-Institut, Helmholtz-Zentrum für Polar- und Meeresforschung Funktionelle Ökologie - Bremerhaven


For my wife Yameng and our son Ziyuan


Content
Table of Contents
ERKLÄRUNG ....................................................................................................................................... I ACKNOWLEDGEMENTS .................................................................................................................. II SUMMARY ......................................................................................................................................... V ZUSAMMENFASSUNG ................................................................................................................... VII ABBREVIATIONS ..............................................................................................................................IX 1. INTRODUCTION ........................................................................................................................ 1
1.1 Theory of speciation ......................................................................................................................... 1 1.2 Molecular markers in realizing speciation ..................................................................................... 4 1.3 Genetic divergence of widespread marine species ......................................................................... 7 1.4 The study case Munida gregaria ...................................................................................................... 9
2. AIMS, QUESTIONS AND OUTLINE OF THE THESIS ......................................................... 17 2.1 Aims and questions of the thesis .................................................................................................... 17 2.2 Outline of the thesis ........................................................................................................................ 19
3. LIST OF PUBLICATIONS AND DECLARATION OF CONTRIBUTION ............................. 21 4. ISOLATION AND CHARACTERIZATION OF ELEVEN MICROSATELLITE MARKERS FROM THE SQUAT LOBSTER MUNIDA GREGARIA (DECAPODA: MUNIDIDAE) AROUND THE FALKLAND ISLANDS/ISLAS MALVINAS ..................................................................................... 23
4.1 Abstract ........................................................................................................................................... 23 4.2 Methods and Results ...................................................................................................................... 23 4.3 Acknowledgments ........................................................................................................................... 24
5. DISCRETE PHENOTYPES ARE NOT UNDERPINNED BY GENOME-WIDE GENETIC DIFFERENTIATION IN THE SQUAT LOBSTER MUNIDA GREGARIA (CRUSTACEA: DECAPODA: MUNIDIDAE): A MULTI-MARKER STUDY COVERING THE PATAGONIAN SHELF ............ 27
5.1 Abstract ........................................................................................................................................... 27 5.2 Background ..................................................................................................................................... 28 5.3 Methods ........................................................................................................................................... 32 5.4 Results ............................................................................................................................................. 36 5.5 Discussion ........................................................................................................................................ 42 5.6 Conclusions ..................................................................................................................................... 45 5.7 Acknowledgments ........................................................................................................................... 45 5.8 Additional files ................................................................................................................................ 46
6. CROSSING THE IMPASSABLE: MITOCHONDRIAL AND MICROSATELLITE MARKERS CONFIRMED HIGH LEVEL OF REALIZED DISPERSAL AND GENE FLOW IN THE TRANSOCEANIC SQUAT LOBSTER MUNIDA GREGARIA (DECAPODA: MUNIDIDAE) ACROSS THE EAST PACIFIC BARRIER ....................................................................................................... 51
6.1 Abstract ........................................................................................................................................... 51 6.2 Introduction .................................................................................................................................... 51 6.3 Materials and Methods .................................................................................................................. 54 6.4 Results ............................................................................................................................................. 60 6.5 Discussion ........................................................................................................................................ 67 6.6 Conclusion ....................................................................................................................................... 71

Content
6.7 Additional files ................................................................................................................................ 71 7. SYNTHESIS .................................................................................................................................. 75
7.1 The power of combined molecular markers in evolutionary studies ......................................... 75 7.2 M. gregaria represents a single transoceanic species with discrete phenotypes ........................ 76 7.3 Possible mechanisms underlying the discrete phenotypes .......................................................... 78 7.4 Gene flow across the EPB .............................................................................................................. 81 7.5 Outstanding diversity in small lakes vs the lack of that in the ocean ........................................ 83 7.6 Concluding remarks ....................................................................................................................... 86 7.7 Future perspectives ........................................................................................................................ 87
REFERENCES ................................................................................................................................... 89

Erklärung
I
Erklärung
Chen Wang Borriesstr. 20 27570 Bremerhaven
Erklärung gemäß §6(5) der Promotionsordnung der Universität Bremen für die mathematischen, natur- und ingenieurwissenschaftlichen Fachbereiche vom 14. März 2007
Hiermit erkläre ich, Chen Wang, dass ich die Doktorarbeit mit dem Titel:
“High levels of realized dispersal and phenotypic plasticity in the polymorphic squat lobster Munida gregaria (Decapoda: Anomura: Munididae) in Patagonia and New Zealand - a multi-marker genetic and morphological approach”
selbstständig verfasst und geschrieben habe und außer den angegebenen Quellen keine weiteren Hilfsmittel verwendet habe.
---------------------------------------------

Acknowledgements
II
Acknowledgements I would like to thank so many people that helped me along over my PhD time, to some I am
especially grateful.
First of all, I would like to express my deepest gratitude to my PhD supervisor Dr. Christoph
Held for giving me the opportunity to study in his group in the past few years and to be involved
in this very exciting project. His guidance and constant inspiration teach me what a scientist
should be. His knowledge and enthusiasm for new ideas make me admire and motivated.
Learning from him I obtained skills in the molecular field, improved my English in speaking
and writing, built the ability of developing ideas independently.
I would like to thank Prof. Dr. Thomas Brey, Dr. Christoph Held, Dr. Uwe John and Dr. Bank
Beszteri for their valuable suggestions during my regular PhD committee meetings. I am
thankful to my colleague and friend Shobhit Agrawal for his help in data analyses and
developing article ideas, as well as to Meike Seefeldt for reviewing my thesis. I would like to
thank my committee members, especially Prof. Dr. Thomas Brey and Prof. Dr. Martin Zimmer
for reviewing this thesis.
I would like to give my special thanks to Dr. Jürgen Laudien for his great help in collecting
samples in Chile. I am very grateful to Dr. Vreni Häussermann and Huinay Scientific Field
Station, Felipe González and the Reserva Añihue in providing me comprehensive logistics and
infrastructure to assist my sample collection. I am very grateful to Dr. Erika Mutschke
(Universidad de Magallanes, Punta Arenas), Dr. Kareen Schnabel (NIWA, New Zealand) and
Dr. Fernando L. Mantelatto (University of São Paulo, Brazil) for providing me samples.
I appreciate my experience on RV Polarstern where I meet lovely friends and the crew, I thank
them for their kind help in the scientific work and daily life.
My most sincere gratitude and appreciation go to the AG Held family (Andrea Eschbach,
Shobhit Agrawal, Charlotte Havermans, Florian Leese, Kevin Pöhlmann, Carla de
Aranzamendi, Astrid Cornils, Meike Seefeldt, Vanessa Robitzch, Nina Hörner, Micaela Belen
Ruiz, Flavia Höring) as well as Annegret Muller, Nancy Kuhne, Petra Steffens. Not only have
I received tremendous support from everyone during my PhD study, but also I had the
opportunity to know and spend time with the most amazing individuals I have ever met, making
this one of the most impressionable life experiences to date!
Thanks to my friends Shobhit, Charlotte, Nan, Joy, Claudia, Meike, Carla and my Chinese
friends for so many unforgettable moments and delicious food which made my stay in
Bremerhaven so beautiful.

Acknowledgements
III
Finally, I want to give my greatest thanks to my family. My beloved wife gave me unceasing
understanding, motivation and support in the dim days, without her I would not finish. Our
lovely son Ziyuan fueled me tons and tons of joy and motivation. I want to thank my parents
and parents-in-law for their constant comprehension, mental and financial supports, driving me
ahead to pursue my dreams.

Summary
IV
Summary
V
Summary Successful species delimitation is of fundamental importance in understanding the process of
speciation. The tools of molecular genetics provide enormous potential for clarifying the nature
of species boundaries, which has challenged the generalization that marine species are often
associated with high dispersal and mild genetic differentiation over large spatial scales by
unravelling hidden diversity in the form of unrecognized cryptic species. The occurrence of
two or more sharply distinct morphotypes, even if currently considered a single nominal
species, can either be a case of previously overlooked genetic differentiation or it may be
caused by the expression of different morphotypes from essentially the same genetic
background.
The squat lobster Munida gregaria (Decapoda: Munididae) is a shallow-water species that is
widely distributed mainly on the continental shelf off southeastern New Zealand and Patagonia.
Its global disjunct distributions are separated by more than 7000 km’ expanse of deep Pacific
water, which is known as a major marine biogeographical barrier, the East Pacific Barrier
(EPB). Under this currently accepted species (i.e., M. gregaria sensu lato) there are two
ecotypes, gregaria sensu stricto and subrugosa that are characterized sharp differences in
morphology, ecology and behaviour. Therefore, this species provides an excellent case study
to test whether present marine major barriers and heterogeneous environmental forces would
have resulted in genetic differentiation and further speciation.
The superordinate aim of this study was to reconstruct the evolutionary history of the South
American and New Zealand squat lobster M. gregaria. The central aspects of the thesis were
investigations of i) the relationship between phenotype and genotype; ii) interaction of
emerging geographical barriers and oceanographic influence in shaping genetic structure,
biogeography of M. gregaria. In order to fulfil this task a comprehensive analytical framework
based on the combination of nuclear microsatellites and mitochondrial COI genetic markers,
as well as range-wide sampling, were applied to address these major tasks.
To avoid potential pitfalls of using a single marker especially the mitochondrial DNA barcoding
gene, such as introgression, incomplete lineage sorting and insufficient evolutionary rates to
recover recent divergence in potential cryptic speciation, a set of fast-evolving nuclear
microsatellite were newly developed for M. gregaria. These microsatellites together with
conventional DNA barcoding sensu stricto (mitochondrial COI) were firstly applied on South

Summary
VI
American samples to test whether the different ecotypes arise from differentiated genotypes.
Both data sets yielded a congruent result of an undifferentiated genetic background
corresponding to either ecotypes or geographic units across the entire South American
distribution. The gregaria s. str. and subrugosa ecotypes are not underpinned by cryptic
genotypes, instead the discrete phenotypic differentiation is a representation of environment-
driven phenotypic plasticity or developmental variation.
Morphometric analyses were performed in order to see if continental-scale sampling would
cover unsampled intermediary morphotypes and then blur the boundaries of the two ecotypes.
Results from PCA and using discriminant functions demonstrated the morphology of the two
forms remaining discrete in the context of sampling from large-scale geographic locations as
well as different ontogenetic composition. Moreover, the inclusion of different life stages of
M.gregaria demonstrates that a part of the morphometric variance is adequately explained by
an ontogenetic transition between moults.
Population genetic analyses based on global sampling of M. gregaria detected a genetic
structure across the Pacific between New Zealand and South America. But many shared alleles,
as well as testing in a Bayesian framework, confirmed gene flow at different timescales across
the open water barrier spanning more than 7000km. The dispersal of M. gregaria between New
Zealand and South America was possibly facilitated by the ACC. This study demonstrated that
the EPB is not a strict marine biogeographical barrier to gene flow.
This case study demonstrates a striking case in contrast with the mounting number of cryptic
speciation resulted from geographic separation or disruptive environmental selection. The
combination of nuclear and mitochondrial genetic markers are highly recommended in order
to improve the power of molecular data to test phylogenetic and population genetic hypotheses,
especially in the event of homogeneous genetic background that is hard to falsify with easily
obtainable but error-prone mitochondrial data alone.

Zusammenfassung
VII
Zusammenfassung Die korrekte Abgrenzung von Arten untereinander ist eine Grundvoraussetzung für ein besseres
Verständnis dafür wie Arten überhaupt entstehen. Die Werkzeuge der molekularen Genetik
haben ein enormes Potenzial, die Grenzen zwischen den Arten sichtbar zu machen. Durch den
Nachweis bisher übersehener, kryptischer Arten haben sie geholfen, pauschale
Verallgemeinerungen wie die Vorstellung, marinen Arten seien insgesamt durch ein hohes
Ausbreitungsvermögen und einer nur geringen Differenzierung auch auf großen geografischen
Skalen gekennzeichnet. Umgekehrt kann das Auftreten zweier sehr unterschiedlicher
Phänotypen entweder die Folge einer zwar erfolgten, aber bisher übersehenen genetischen
Differenzierung sein, oder aber auf die Expression zweier Phänotypen aus einem einzigen
Genotypen hindeuten.
Der Springkrebs Munida gregaria (Decapoda: Munididae) besiedelt flache Küstengewässer
vor der Südinsel Neuseelands und ganz Patagoniens. Die beiden Teile des globalen
Verbreitungsgebiets sind durch eine Lücke von mehr als 7000km unbesiedelbarer Tiefsee des
Pazifischen Ozeans voneinander getrennt, eine bedeutende biogeografische
Ausbreitungsgrenze, die als Ostpazifische Barriere (East Pacific Barrier, EPB) bekannt ist.
Innerhalb der taxonomisch akzeptierten Art Munida gregaria sensu lato werden zwei Ökotypen
(gregaria sensu strictu und subrugosa) zusammengefasst, die sich durch zwei scharf
voneinander abgegrenzte Morphotypen mit ebenso deutlichen Unterschieden in Ökologie und
Lebensweise auszeichnen. Diese Art eignet sich daher besonders, um zu untersuchen, ob und
wie das Vorhandensein von Ausbreitungsbarrieren und einer heterogenen Umwelt zu einer
genetischen Differenzierung und schließlich zur Bildung neuer Arten führen könnte.
Die Rekonstruktion der evolutiven Geschichte von M. gregaria in Südamerika und Neuseeland
stellt das übergeordnete Ziel dieser Arbeit dar. Wichtige Aspekte waren daher 1) die Beziehung
zwischen Phänotyp und Genotyp und 2) das Zusammenwirken geografischer und
ozeanografischer Faktoren bei der Herausbildung der genetischen Struktur und Biogeografie
von M. gregaria. Zu diesem Zweck wurden Mikrosatelliten als Marker aus dem Zellkern
ebenso verwendet wie mitochondriale COI Sequenzen und Proben aus dem gesamten
Verbreitungsgebiet der Art analysiert.
Um Introgression, ancestrale Polymorphismen und unzureichende Mutationsraten als
Fehlerquellen von Studien, die auf einem einzigen mitochondrialen Marker basieren,
Zusammenfassung
VIII
ausschließen zu können, wurden im Rahmen dieser Arbeit voneinander unabhängige und
hochvariabler Mikrosatelliten als molekulare Marker für M. gregaria etabliert.
Mitochondriale Daten sowie die Mikrosatelliten zeigen übereinstimmend, dass es keinen
Hinweis auf eine genetische Differenzierung der beiden Ökotypen in Südamerika gibt. Die
beiden Ökotypen gregaria s. str. und subrugosa sind daher keine kryptischen Arten, sondern
stellen alternative Phänotypen des gleichen Genotyps dar.
Unser Probenmaterial, das aus dem gesamten südamerikanischen Verbreitungsgebiet stammt,
wurde morphometrisch untersucht, um festzustellen, ob die scharfe Unterscheidbarkeit der
beschriebenen Ökotypen von M. gregaria ein Artefakt einer geografisch begrenzten
Untersuchung darstellt. Die morphometrische Analyse zeigt jedoch klar, dass die
Unterscheidbarkeit über das gesamte südamerikanische Verbreitungsgebiet hinweg stabil bleibt.
Zusätzlich zeigt die Einbeziehung verschiedener Lebensstadien eine ontogenetische
Dimension in der morphometrischen Varianz.
Populationsgenetische Analysen zeigen, dass eine schwache genetische Differenzierung
zwischen dem neuseeländischen und dem südanerikanischen Teil des Verbreitungsgebiets
nachzuweisen ist. Dennoch belegen eine Vielzahl von Allelen mit Nachweisen beiderseits des
Pazifik sowie eine genetische Modellierung, dass von einem Genfluss auf verschiedenen
Zeitebenen über die 7000km Barriere in Form von unbesiedelbarer pazifischer Tiefsee
ausgegangen werden muss. Dieser Austausch wurde wahrscheinlich durch die Verdriftung von
Organismen mit dem Antarktischen Zirkumpolarstrom (ACC) begünstigt. Diese Arbeit zeigt,
dass die EPB kein unüberwindbares Hindernis für Genfluss ist.
Diese Arbeit zeigt entgegen einem allgemeinen Trend zunehmender Nachweise kryptischer
Arten, dass in M. gregaria unterschiedliche Phänotypen aus demselben Genotypen entstehen.
Ein derartiger Nachweis kann nur mit Hilfe hinreichend variabler molekularer Marker aus dem
Kerngenom geführt werden. Die Verwendung ausschließlich mitochondrialer Marker, die
leichter zugänglich, aber deutlich fehleranfälliger sind, ist dagegen nicht möglich.

Abbreviations
IX
Abbreviations π nucleotide diversity
μl microliter
μM micromolar
ACC Antarctic Circumpolar Current
AFLP amplified fragment length polymorphism
Ar allelic richness
AMOVA analysis of molecular variance
bp Base pairs
BSC biological species concept
CCP Central Chilean Patagonia
CI confidence interval
COI cytochrome c oxidase subunit I gene
DNA deoxyribonucleic acid
DV developmental variation
EPB East Pacific Barrier
ESU Evolutionary Significant Unit
FM Falklands/Malvinas
HD haplotype diversity
HO observed heterozygosity
HE expected heterozygosity
HPD highest posterior density
HWE Hardy-Weinberg equilibrium
IBD isolation-by-distance
K number of clusters
LD linkage disequilibrium
Ma million years ago
MCMC Markov chain Monte Carlo
MdP Mar del Plata
Msats microsatellites
mtDNA mitochondrial DNA
NA number of alleles
NCP Northern Chilean Patagonia

Abbreviations
X
NZ New Zealand
PCR polymerase chain reaction
PLD pelagic larval duration
PSP paralytic shellfish poisoning
SA South America
SNP single nucleotide polymorphism
SSD sum of square deviation
STF Subtropical front
TdF Tierra del Fuego archipelago
Introduction
1
1. Introduction
1.1 Theory of speciation Understanding the processes that promote speciation is one of the foremost goals of
evolutionary biology. The prerequisite of identifying these processes is to successfully
recognize and delimit species or evolutionary significant units (ESUs) (Sites & Marshall 2004),
for which a species concept and operational criteria for diagnosing taxonomic limits are
required. New insights gained from learning the speciation process and the nature of ‘species’
in the past decades have broadcasted several species concepts with adjustments to meet
different criteria of assessing lineage separation (de Queiroz 2007; Hausdorf 2011), whereas
the most influential and broadly accepted species is still the biological species concept (BSC)
that defines species as “groups of interbreeding natural populations that are reproductively
isolated from other such groups” (Mayr 1942, 1963). However, the findings that reproductive
barriers are semipermeable to gene flow and speciation may be possible despite ongoing
interbreeding (Mallet 2005; Mallet 2008; Rieseberg 2001; Wu & Ting 2004) challenged this
delimitation criteria based on reproductive compatibility. In practice, a particular species
concept and the associated operational criteria are often adopted from the perspective of
research fields and interests (Sites & Marshall 2004). For example, morphological species
concepts (phenotypic differences: Cronquist, 1978) are central for paleontologists and museum
taxonomists, whereas genetic ones (monophyly of lineages: Donoghue, 1985; Mishler, 1985;
genotypic cluster: Mallet, 1995; Guichoux et al, 2013) are key for population geneticists and
molecular systematists. In contrast, ecologists tend to apply the ecological species concept and
niche differences for delimiting species (Andersson 1990; Van Valen 1976). Exclusive use of a
single operational criterion and an outright acceptance of one species concept (e.g., BSC) could
underestimate biodiversity by lumping together many well-differentiated and generally
accepted species that regularly hybridize (Hausdorf 2011).
Irrespective of the fuzzy nature of species boundaries, the process of speciation is a temporally
continuum whereby lineages gradually accumulate ecological, morphological and genetic
differences. The process itself is not observable and researchers can only rely on certain
evidences or inferences to dictate the evolutionary pathways. With the aid of genetic
approaches, species delimitation has been strongly fostered and the diversity of species on the
planet continues to astonish biologists. Meanwhile, numerous models of speciation were
proposed to accompany the renewed knowledge of species diversity (Coyne & Orr 2004;

Introduction
2
Gavrilets 2014). No matter under which model that speciation is designated, the beginning of
speciation must be reflected through a substantial reduction in gene flow. As argued by Mayr,
the most effective and common form to the reduction of gene flow is geographic isolation,
which constitutes the core of allopatric speciation. Physical barriers such as insurmountable
mountains, oceans or simply great distances prevent free movement and mating between
members from both sides of the barrier, resulting in a spatial separation. The next step is that
different evolutionary forces controlling the dynamics of speciation act simultaneously and
often have opposite effects. As the intrinsic evolutionary driver, mutation leaves stochastic
changes in allele frequencies in local populations and subsequently is accumulated or dropped
out through the random genetic drift process, which leads to genetic divergence between the
separated populations. As a creative force in evolution, natural selection will tend to adapt a
population to local environmental conditions and subsequently lead to genetic differentiation
between populations. On the contrary, migration of individuals or dispersal of gametes among
populations, which are collectively called gene flow, homogenise the geographic distribution
of alleles. A final step of speciation for populations in allopatry is the elimination of gene flow
and prevention of the reappearance of intermediate/hybrid genotypes. Allopatric isolation has
been well supported by most empirical species diversification and is widely acknowledged to
be a common mode of speciation. It was further subdivided into vicariant speciation and
peripatric speciation (= founder effect) (Coyne & Orr 2004; Mayr 1954). In the former, a
widespread species becomes sundered by an arising geographic barrier, reproductive isolation
occurs between the split populations that diverge independently, whereas in the latter a new
population is founded by a few individuals without any continuation of genetic exchange with
the widely distributed ancestor. Irrespective of the underlying bases for allopatric speciation,
geographic separation is the premise in leading to very low level or complete cessation of gene
flow.
In contrast with spatial segregation required in allopatric speciation, alternative speciation
concepts were developed to account for some unexpected high species richness in a randomly
mating (panmictic) population, such as the celebrated cichlids case (Barluenga et al. 2006;
Dieckmann & Doebeli 1999; Schliewen et al. 1994), which can be summarized in the term
sympatric speciation. Sympatric speciation is a process taking place in the context of high gene
flow, where physical barriers to genetic exchange between diverging populations are absent
(Fitzpatrick et al. 2008). The initial driver of sympatric speciation despite ongoing gene flow
is disruptive (diversifying) ecological selection at one or several loci at which different alleles

Introduction
3
confer adaptation to two distinct resources (Maynard Smith 1962, 1966). The difficulty of
sympatric speciation is how to establish linkage disequilibrium among a set of genes that
together confer reproductive isolation. Compared with tremendous evidences for allopatric
speciation, sympatric speciation is hard to demonstrate because evidence must show that a past
allopatric phase of genetic differentiation is hardly true (Coyne & Orr 2004). Therefore this
mode of speciation is still under debate. For example, Mayr (1942, 1963), the most vigorous
and influential critic of the sympatric speciation hypothesis, argued that many supposed cases
are rather unconvincing that the precise mechanism of sympatric speciation is a form of
microallopatry, whereas geography is of primary importance. Disagreeing with Mayr, some
argued that environmentally induced barriers to interbreeding and physical barriers to dispersal
can have equivalent effects on gene flow (Butlin et al. 2008; Coyne & Orr 2004; Fitzpatrick et
al. 2009).
Another commonly discussed speciation model that takes growing heed with experimental and
conceptual advances is ecological speciation. Ecological speciation refers to the evolution of
reproductive isolation between populations or subsets of a single population by adaptation to
different environments or ecological niches (Nosil 2012; Rundle & Nosil 2005; Schluter 2001).
Distinguished from the traditional models of allopatric and sympatric speciation that were
classified by the geographical arrangement, ecological speciation falls into a different category
that focuses on the inhibitory effects of gene flow on the evolution of reproductive isolation;
that is, it may occur in allopatry or in sympatry (Schluter 2001). Although ecology may
contribute to many mechanisms of speciation, the determinant of reproductive isolation must
be ecologically based divergent selection in the sense of ecological speciation. Distinguishing
ecological from non-ecological selections (e.g., sexual selection, or selection not divergent
between environments, see Rundel & Nosil 2005) is of primary importance to determine
whether a studied case has undergone ecological speciation, which is yet not that easy to tell
them apart because the form of reproductive isolation is usually indirectly implicated by which
type of selection (Rundle & Nosil 2005). Ecological speciation might occur indirectly as a
consequence of natural selection on morphological, physiological or behavioural traits, or it
might be resulted from direct selection on premating isolation (Reinforcement) (Schluter 2001).
So far the growing but still limited evidences implicating ecological speciation mainly relied
on observational and comparative experiments, whereas the genetic basis for the process of
ecological speciation is still underexplored (Schluter & Conte 2009). The widely
acknowledged model of ecological speciation provides the knowledge that divergent

Introduction
4
environments, such as different resources or habitats, can cause the adaptive divergence of
populations, which leads to the evolution of reproductive barriers that decrease, and ultimately
cease, gene flow.
1.2 Molecular markers in realizing speciation 1.2.1 Why use molecular tools?
In the pre-molecular era, species delimitation and description of taxonomic relationships are
mainly based on morphological characters, because the differences of morphology are
observable, discernable and available-only. A majority of taxonomic decisions (e.g., synonyms,
descriptions) to date still rest only on morphology. However, morphology is a non-neutral
marker, it may be subject to difficulties and limitations when dealing with, e.g., poorly-studied
organisms with few diagnostic characters, members of cryptic species complexes, eggs and
immature stages, damaged or incomplete specimens. Consequently it will lead to under- or
over-estimation of biodiversity (Lefébure et al. 2006). In the context of accurately identifying
a species, which is essential to the performance of ecological and evolutionary research,
molecular characters emerge as an important complement to conventional morphology.
Since the discovery of DNA (Watson & Crick 1953), molecular techniques have gone through
unprecedented revolution in only a few decades, fueled in part by the discovery of recombinant
DNA (Cohen 1993) and the polymerase chain reaction (Mullis et al. 1986). The availability of
molecular data and capability of access to the intrinsic genetic architecture raise the
fundamental question of untangling the relationship between phenotypes and the underlying
genotypes, which has been a long-standing challenge since the proposal that phenotype and
genotype form two fundamental different levels of biological abstractions (Johannsen 1911).
The innumerable molecular data have on the one hand cohered with traditional taxonomic data
and validated the systematic position. On the other hand they have challenged morphology-
based species delimitation, to which questions arise owing to discrepancies between
morphological traits and genotypic diversity: i) whether morphological differences among
populations are reflecting corresponding genetic differences, or a consequence of phenotypic
plasticity; ii) morphologically indistinguishable populations may represent genetic distinct
lineages, i.e., (pesudo)cryptic species.
1.2.2 Which molecular marker(s)?
Introduction
5
Since the first widespread use of allozymes in the 1970s, advances in DNA marker technology
including modern availability of genome-wide sequencing, have resulted in a wealth of genetic
markers with potentially broad utility in a variety of ecological and evolutionary endeavours.
Depending on their properties of evolving rates, molecular markers are designated to answer
questions at different taxonomic rank: phylogenetics and population genetics.
Sequences used in phylogenetic studies aim to deal with evolutionary relationships among
deeper clades (usually at the level of orders or families), such as the 18S subunit of eukaryotic
cytoplasmic ribosomes. When aiming to recognize divergences among populations and
possibly species-level entities, population genetic approaches with faster evolving genes and
genotypic markers are of primary importance (Knowles & Carstens 2007; Shaffer & Thomson
2007). Widely used population genetic markers include microsatellites, single nucleotide
polymorphism (SNP), and some sequences of mitochondrial markers (mtDNA; such as
mitochondrial cytochrome c oxidase subunit I (COI), control region).
DNA barcoding, which is normally referred to as a 658-bp fragment of the mitochondrial
cytochrome c oxidase subunit I (COI) gene for animals, was proposed by Hebert et al. (2003)
to serve as a rapid, efficient way to reduce the taxonomic deficit and automate taxon
determination for ecological research. Since then DNA barcoding began its golden stage and
became a prevailing choice of marker for identifying species and describing taxonomic
relationship. The outcome of pervasive utility is the well-established Consortium for the
Barcode of Life (CBOL, http://barcoding.si.edu), an international initiative supporting the
development of DNA barcoding, which in turn promotes global standards and coordinates
research in DNA barcoding. The reasons that COI is chosen over nuclear DNA include uni-
parental inheritance (in a majority of animal phyla), elevated mutation rate (an evolutionary
rate 5 to 10 times faster than the nuclear genes, Brown et al. 1979), lack of introns, large copy
numbers in every cell, and lack of recombination (but see Galtier et al. 2009). In DNA
barcoding, complete data set can be obtained from a single specimen irrespective to
morphological or life stage characters. The advent of easily obtainable and affordable DNA
barcoding has served to greatly intensify the crosstalk between molecular and taxonomic
disciplines by successfully identifying unknown specimens in terms of a preexisting
classification and uncovering a large number of previously overlooked (pseudo)cryptic
genotypes (Dasmahapatra & Mallet 2006; Frézal & Leblois 2008; Hebert & Gregory 2005;
Hebert et al. 2004).

Introduction
6
Nevertheless, due to such special biological properties of mtDNA, for example, the maternal
inheritance makes the whole genome behave as a single, non-recombining locus – all sites
share a common genealogy, it is more vulnerable to limitations such as introgressive
hybridization, sex-biased dispersal, incomplete lineage sorting and heteroplasmy (Ballard &
Whitlock 2004; Ebach & Holdrege 2005; Petit & Excoffier 2009; Rubinoff et al. 2006; Wares
2010). If one mitochondrial gene was positively biased towards an incorrect result, adding more
mitochondrial markers would likely only increase the support for this incorrect result rather
than alleviate the dependence upon the unreliable marker (e.g., Page & Hughes 2010). DNA
barcoding was also criticised for an overestimation of species numbers due to possible
inadvertent inclusion of nuclear mitochondrial pseudogenes (= non-functional copies of
mtDNA in the nucleus, or numts, Song et al. 2008). Discrepancies of genetic relationships
yielded by mtDNA and nuclear DNA (mito-nuclear discordance) are becoming prominent with
increasing utilization of molecular markers (Pons et al. 2014; Toews & Brelsford 2012).
Relatively lower success rates of identification by mtDNA genes have been reported in certain
groups of animals (Meyer & Paulay 2005; Shearer & Coffroth 2008; Vences et al. 2005;
Whitworth et al. 2007; Wiemers & Fiedler 2007). In general, single mitochondrial marker may
give first hints to cryptic species, unjustified splitting of species, or oppositely a lack of genetic
differentiation. But these results have to be verified by further comparison with multiple
independent nuclear loci, which is considered superior to single-gene approaches in removing
under- or overestimation of species as a result of incomplete lineage sorting or introgression
(Hausdorf & Hennig 2010).
Microsatellites. In order to get more in-depth understanding about the recent evolutionary
history of populations of a species, microsatellites have shown their popularity and versatility
as a satisfactory choice of nuclear marker in population genetic studies (Guichoux et al. 2011;
Selkoe & Toonen 2006b). Microsatellites, also known as simple sequence repeats (SSRs), are
stretches of DNA comprising short tandem repeats of 2-6 bp repeated up to ~100 times (Litt &
Luty 1989; Tautz 1993). These repeats are highly polymorphic due to mutation-caused
variation in the number of repeating units. Variations in tandem repeat length accumulate in
populations more rapidly than the point mutations and larger insertion/deletion events on that
sequence markers are based. The mutation rates of microsatellites are estimated at 10-2 - 10-6
per locus per generation, which is 100-1000 times faster than that of a single-copy nuclear
DNA (Ellegren 2000; Gilbert et al. 1990; Schlötterer 2004). They are furthermore biallelic,
codominant markers following Mendelian inheritance, thus are considered to be selectively

Introduction
7
neutral sequences randomly or almost randomly distributed over the euchromatic genome
(Allendorf et al. 2010; Schlötterer & Wiehe 1999; Tóth et al. 2000). A sufficient number of
selectively-neutral microsatellite loci have great potential to promise extrapolation to the entire
genome.
The high mutation rates of microsatellites come at the cost of their limited applicability outside
the taxon for which they have been established. The high cost and unpredictability of
developing microsatellites de novo for species used to prevent them from pervasive use (see
Sands et al. 2009 for a discussion; Zhang 2004). Nevertheless, recent progress of microsatellite
extraction protocols have streamlined the process of marker development considerably (Leese
2008; Nolte et al. 2005). In particular, next-generation sequencing technologies allow the
identification of large numbers of microsatellite loci at reduced cost in non-model species
(Abdelkrim et al. 2009; Malausa et al. 2011; Santana et al. 2009). Furthermore, the
improvement in methods of multiplexing PCR enables more rapid scoring and higher
throughput at low cost across larger number of loci (Ajzenberg et al. 2010; Hayden et al. 2008).
Therefore, these versatile and cost-effective microsatellites are promising in studies of kinship,
genetic structure and individual relatedness.
The combination of fast-evolving mitochondrial genes and nuclear genotypic markers (such as
microsatellites) promises intensified resolution in 1) providing information of recent
evolutionary events; 2) drawing complementary inference of genetic relationship and
population differentiation, with greatly reduced chance of biased genetic structure and
phylogenies that are not representative of the actual species tree. The combined analysis of
multiple independent loci with various evolutionary rates has demonstrated enhanced power
than that from using mitochondrial genes only (Griffiths et al. 2010; Hausdorf et al. 2011;
Latinne et al. 2012; Vanhaecke et al. 2012).
1.3 Genetic divergence of widespread marine species Over a long period of time marine ecosystems were considered relatively open, with high
connectivity among populations (Caley et al. 1996; Roughgarden et al. 1985), since barriers to
gene flow in the sea seem not as conspicuous as that in terrestrial and lacustrine ecosystems.
Additionally, most marine species have life histories that include at least one potentially widely
dispersal stage (Cowen et al. 2000), which seem to favour gene flow over large geographic
scales and retain panmixia within population (Palumbi 1994). Recent applications of molecular
methods, on the contrary, have uncovered remarkable population genetic structure or cryptic

Introduction
8
diversity in a variety of coastal taxa (Cowen & Sponaugle 2009; Hellberg et al. 2002; Palumbi
2003), indicating that marine community does not intuitively display geographical and
bathymetric uniform and continuum. For example, traditionally it has been assumed that many
Southern Ocean marine animal species have a broad circumpolar (Clarke & Johnston 2003;
Dayton et al. 1994; Knox 2006) and eurybathic (Brey et al. 1996) distribution. Yet recently it
was found that the circumpolar giant sea spider Colossendeis megalonyx comprises a complex
of as many as 15-20 cryptic species (Dietz et al. 2015). Similar cryptic speciation also exists
in the crinoid Promachocrinus kerguelensis that has a planktonic dispersal stage (Hemery et al.
2012), or several lineages occurring in sympatry (Baird et al. 2011; Wilson et al. 2013),
implicating possible role of ecological speciation.
In their pioneering work of marine biogeography, some biogeographers realized paradoxically
common distribution patterns and endemism across various distinct marine fauna that were
actually outlined by some ‘hard’ and ‘soft’ barriers (Briggs 1974; Ekman 1953; Vermeij 1978).
Hard barriers, such as Isthmus of Panama (IOP), were caused by the formation of land bridges
that physically split marine populations, while soft barriers involve different forms that impede
dispersal. The deep ocean basins with extensive distance serve as a major way for nearshore
marine species to overcome (Briggs 1974). Another form of barriers, in spite of relatively short
distance being able to cross, is a reflection of historically episodic separation due to glaciations
in Pleistocene. The best-known case of such is between the tropical Indian and Pacific Oceans
at the Sunda Shelf, aka the marine equivalent of Wallace’s Line (Barber et al. 2000; Huxley
1868; Whitmore 1981), owing to isolation resulting from Pleistocene low sea-levels. Strong
ocean currents provide another kind of barrier. They can on the one hand significantly facilitate
the transportation of pelagic propagules, on the other hand prevent dispersal across them. An
eminent example is the circum-Antarctic Polar Front that separate Antarctic and sub-Antarctic
(see Griffiths et al. 2009 for a review). These soft marine biogeographic barriers clearly act as
‘filters’ by restricting dispersal to generate and maintain biodiversity; meanwhile they are
penetrable as evidenced by the existence of transoceanic marine species, which can be recent
diverged sister taxa or truly trans-barrier species (Crandall et al. 2008; Dawson et al. 2011;
González-Wevar et al. 2010; Ilves & Taylor 2008; Leese et al. 2010; Lessios et al. 2003; Luiz
et al. 2012; Vermeij 2005).
Widespread marine organisms also exhibit high levels of morphological variation (Fowler-
Walker et al. 2006; Marchinko 2003; Sanford & Kelly 2011; Trussell 1996). Morphological
differences may be a phenotypically plastic response to variation of broad environmental
Introduction
9
gradients, e.g., environmental tolerance (Ashton et al. 2007; Sorte et al. 2010), resources and
habitat (Ewers & Didham 2006; Guisan & Thuiller 2005), but also they can be attributed to
accumulated genetic differences due to disruption of gene flow among populations. The
occurrence of two or more sharply distinct morphotypes, even if currently considered a single
nominal species, can either be a case of previously overlooked genetic differentiation or it may
be caused by the expression of different morphotypes from essentially the same genetic
background.
Hence, purportedly widespread marine species may harbour distinct species, which failed to
be discriminated or correctly reflected by conventional taxonomy based on morphology.
Comprehensive molecular-based framework that can be extrapolated to better reflect genome-
wide background is needed in an attempt to reconstruct evolutionary processes of widespread
marine species.
1.4 The study case Munida gregaria 1.4.1 Distribution and ecology of Munida gregaria
South American and New Zealand squat lobster species Munida gregaria (Decapoda:
Munididae) provides an excellent study case for research addressing ecological and
evolutionary processes on various time scales. It allows for testing whether present marine
major barrier and environmental forces would have resulted in genetic differentiation and
further speciation.

Introduction
10
Fig. 1.1: Map showing records of distribution of Munida gregaria (in light green rectangles; source: World Register of Marine Species (WoRMS), http://www.marinespecies.org/) and sampling localities in this thesis (in red dots). Photography of M. gregaria by Jürgen Laudien.
Munida squat lobster is a highly diversified and speciose genus comprising 274 species at the
time of writing (Lee et al. 2016), with potentially new endemic species being discovered
(Macpherson et al. 2010). Out of the genus or even the family Munididae, M. gregaria
(Fabricius, 1793) is the only widespread species that has a transoceanic distribution (Baba et
al. 2008; Tapella 2002). It spreads nearshore off south-eastern New Zealand and along Chilean
Patagonia from Chiloé (41° S) to Cabo de Hornos (55° S), as well as in the Atlantic shelf off
Patagonia, from Uruguay’s continental shelf waters (35°S) to Cabo de Hornos (55°S),
including Falkland Islands/Islas Malvinas (Boschi et al. 1992; Zeldis 1985). Some records
show it also occurs around Tasmania (Baba et al. 2008) and the islands nearby New Zealand
Introduction
11
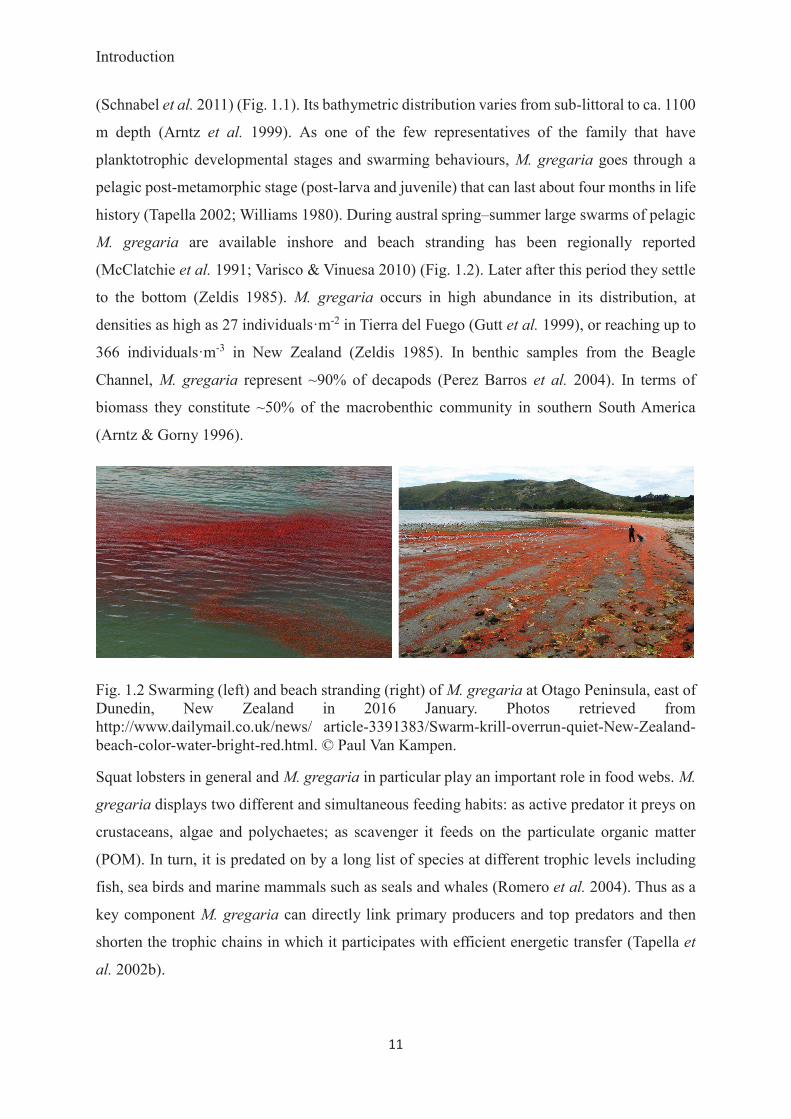
(Schnabel et al. 2011) (Fig. 1.1). Its bathymetric distribution varies from sub-littoral to ca. 1100
m depth (Arntz et al. 1999). As one of the few representatives of the family that have
planktotrophic developmental stages and swarming behaviours, M. gregaria goes through a
pelagic post-metamorphic stage (post-larva and juvenile) that can last about four months in life
history (Tapella 2002; Williams 1980). During austral spring–summer large swarms of pelagic
M. gregaria are available inshore and beach stranding has been regionally reported
(McClatchie et al. 1991; Varisco & Vinuesa 2010) (Fig. 1.2). Later after this period they settle
to the bottom (Zeldis 1985). M. gregaria occurs in high abundance in its distribution, at
densities as high as 27 individuals·m-2 in Tierra del Fuego (Gutt et al. 1999), or reaching up to
366 individuals·m-3 in New Zealand (Zeldis 1985). In benthic samples from the Beagle
Channel, M. gregaria represent ~90% of decapods (Perez Barros et al. 2004). In terms of
biomass they constitute ~50% of the macrobenthic community in southern South America
(Arntz & Gorny 1996).
Fig. 1.2 Swarming (left) and beach stranding (right) of M. gregaria at Otago Peninsula, east of Dunedin, New Zealand in 2016 January. Photos retrieved from http://www.dailymail.co.uk/news/ article-3391383/Swarm-krill-overrun-quiet-New-Zealand-beach-color-water-bright-red.html. © Paul Van Kampen.
Squat lobsters in general and M. gregaria in particular play an important role in food webs. M.
gregaria displays two different and simultaneous feeding habits: as active predator it preys on
crustaceans, algae and polychaetes; as scavenger it feeds on the particulate organic matter
(POM). In turn, it is predated on by a long list of species at different trophic levels including
fish, sea birds and marine mammals such as seals and whales (Romero et al. 2004). Thus as a
key component M. gregaria can directly link primary producers and top predators and then
shorten the trophic chains in which it participates with efficient energetic transfer (Tapella et
al. 2002b).

Introduction
12
Because of the special position of M. gregaria in the food web and life strategy, it plays an
important role in the biological CO2 pump in the continental shelf (Wada et al. 1987),
meanwhile it is a potential vector of pathogens and toxins delivery to the higher trophic level.
In New Zealand, study demonstrated that M. gregaria actively grazes on the toxic Alexandrium
catenella bloom and thus accumulates toxins such as paralytic shellfish toxin (PST) and
analogues (MacKenzie & Harwood 2014). Since June 2015, nearly 400 Sei whales were found
to be stranded and dead in the southern Chilean Patagonia, which makes it the biggest single
whale stranding event known to science (Fig. 1.3). The causes of the whales’ death are under
investigation in the Patagonia Projects: Golfo de Penas
(https://expedition2016.wordpress.com/) and remain still unclear. But stomach contents
analysis showed Sei whales in the region feeds on swarms of M. gregaria, which are suspected
to be potential vectors of toxins or pathogens causing the whales’ death (Vreni Haussermann,
personal communication, February 29, 2016).
Fig. 1.3 The first 37 beached whales, out of a total number of 337 whales died in mass stranding on Chilean Patagonian coast in 2015, found in April in Gulf of Penas by a team led by Vreni Haussermann of the Huinay Scientific Field Station. Photography by Vreni Haussermann.
Due to the prevalent abundance, M. gregaria is economically of great potential as an alternative
fishery resources to the heavily harvested squat lobsters Pleuroncodes monodon and
Cervimunida johni (Tapella et al. 2002b; Zeldis 1989). It is the main species in the bycatch of

Introduction
13
the trawling fisheries for the shrimp Pleoticus muelleri and for the king
crab Lithodes santolla (Tapella et al. 2002b; Varisco et al. 2015). Because M. gregaria is rich
in red astaxanthin pigments, it is useful for colouring the flesh in salmon farming and serving
in foodstuffs such as soups, pastes, and surimi (Lovrich et al. 1998; Zeldis 1989).
1.4.2 Taxonomic debate and biogeography of M. gregaria
The taxonomic status of M. gregaria has been long tangled with another squat lobster M.
subrugosa Dana, 1852. Both Munida squat lobsters occur in sympatry (Tapella et al. 2002a;
Vinuesa 1977) and were originally described as separate species due to some different
morphological characters (Lagerberg 1906; Matthews 1932) and supported by Boschi et al.
(1992); Hendrickx (2003); Retamal (2000); Tapellaand Lovrich (2006) (Fig. 1.4). Chilton
(1909) then later Williams (1973 and 1980) and Zeldis (1985) interpreted M. gregaria as a
transient ontogenetic phase of M. subrugosa. Apart from the diagnostic morphological
differences, both Munida squat lobsters also feature distinctive ecological and behavioural
differences at certain developmental stages. M. gregaria passes through a pelagic
postmetamophic phase, then adults settle benthic but still perform vertical migration in the
water column. By contrast, M. subrugosa lacks pelagic phase in life history and remains benthic
constantly after metamorphosis (Tapella et al. 2002a; Zeldis 1985). Specific feeding behaviours
that probably led to the morphological adaptations display that M. gregaria is a detritivore or
scavenger whilst M. subrugosa has been found to feed on algae or small crustaceans and worms
(Tapella & Lovrich 2006; Vinuesa & Varisco 2007).
Despite profound phenotypic differences, it is still unknown whether the classification of the
two different morpho- and eco-types truly reflects reproductively isolated species. A Recent
molecular examination using mitochondrial genes failed to reveal genetic differentiation
corresponding to their morphology (Pérez-Barros et al. 2008), on the grounds of which Baba
et al. (2008) synonymised M. subrugosa as a junior form of M. gregaria and in the International
Code of Zoological Nomenclature (ICZN) they are currently considered as a single species.
For brevity and clarity, in this thesis, I refer to the current recognized species as Munida
gregaria sensu lato (s. l.), whilst the two ecotypes under this species are termed gregaria sensu
stricto (s. str.) and subrugosa. Even though this molecular result may reflect a true
homogeneous genetic background of these two ecotypes, i.e., M. gregaria s. l. represents a case
of phenotypic plasticity, relying on only mitochondrial evidence and insufficient sampling of
geographic coverage can be also risky to overlook the possibilities of such as introgression,

Introduction
14
incomplete lineage sorting and heteroplasmy due to the nature of mitochondria, thus wrongly
to interpret two different species as one.
Fig. 1.4: Dorsal views (scale bar: 1 cm) and zoomed ventral views of mouth parts of A) gregaria s. str. ecotype and B) subrugosa ecotype. Arrows and numbers indicate statistically significant morphometric body parts between ecotypes. 1 - eyestalk, 2 - rostrum basis, 3 - anterior carapace, 4 - propodus of the third maxilliped, 5 - dactylus of the third maxilliped. Photo by Chen Wang.
The case of gregaria s. str. and subrugosa ecotypes provides a suitable paradigm to testify the
existence of cryptic sympatric speciation. Moreover, the widespread M. gregaria s. l. might
have undergone cryptic allopatric speciation. In its South American range, the extensive
latitudinal distribution at both sides of Patagonia and the wide bathymetry occupied by M.
gregaria s. l. (from water surface down to 1137m recorded for subrugosa (Arntz et al. 1999))
suggest that the species might be adapted to survive in diverse environmental conditions
throughout its life cycle. The Magellan Zoogeographic Province in southern Chile is an
extensive estuarine system resulted from glacial erosion during the Quaternary. Adults live
inside the fjords associated with areas of detritus accumulation, whereas the larvae reside in
the water column. Various environmental conditions (temperature, salinity, oxygen
concentration) can act as potential selection leading to local adaptation, which constitutes the
prerequisite of ecological speciation. Given the global species’ range, M. gregaria s. l. spans
over huge distances from central Pacific to eastern Pacific, which is at least a 7,000 km’
expanse of deep Pacific water. This stretch of open deep water without islands in between is
well known as the East Pacific Barrier (EPB). This major marine barrier has been described
the most potent ´soft´ (comparing to the closure of land bridge such as the Isthmus of Panama)
barrier (Ekman 1953), which is responsible for the long-term separation of assemblages in the
Indo-Pacific and East Pacific (Briggs 1974). In spite of the long duration of pelagic phase and

Introduction
15
swimming ability of M. gregaria, crossing such broad distance without stepping-stone
dispersal seems questionable. It is necessary to carry out genetic investigation to find out
whether or not ongoing gene flow still exists between ecotypes or geographic regions and
which forces could drive a genetic divergence between them.


Aims, questions and outline
17
2. Aims, questions and outline of the thesis
2.1 Aims and questions of the thesis The superordinate aim of this thesis was to obtain new insights into the general understanding
of the processes leading to the evolution of species in the marine realm. In a top-down approach
I analysed i) the relationship between phenotypic and genetic patterns and possible existence
of sympatric speciation, and ii) interaction of emerging geographical barriers and
oceanographic influence in shaping genetic structure, biogeography of the squat lobster M.
gregaria. The principal strategy of this thesis was to establish a comprehensive analytical
framework to shed light on the various aspects of evolutionary processes. Large data sets from
genetic and morphological analyses, mitochondrial and nuclear fast-evolving markers were
applied to address the following major tasks.
Task 1: Developing a comprehensive multimarker approach to reliably study the
evolution of New Zealand and South American squat lobster species Munida gregaria.
Despite numerous studies on discovery of cryptic speciation, the vast majority of conclusions
are based on evidence from mitochondrial genes, very few studies applied high resolving
nuclear markers such as microsatellites. In case of genetic homogeneity suggested by
mitochondrial markers, alternative explanations such as introgression and incomplete lineage
sorting cannot be ruled out, therefore a more confident conclusion should be based on markers
from both mitochondrial and nuclear genome, a prerequisite of which is to provide higher
resolution in resolving differentiation among populations.
Questions to this task:
i. Is the method of reporter genome protocol (RGP) (Leese 2008) applicable for M. gregaria
and what is the success rate?
ii. Are the isolated microsatellites highly variable and suitable for subsequent population
genetic and evolutionary studies?
iii. Can the isolated microsatellites be cross-amplified with close-related species so as to
provide wider utility?
Task 2: Testing whether different ecotypes arise from differentiated genotypes, in other
words, whether morphological and ecological divergences have resulted in genetic
adaptation.

Aims, questions and outline
18
Although the M. gregaria s. l. ecotypes gregaria s. str. and subrugosa display clear
morphological, ecological and bahavioural divergences, for which they were often considered
as separate species, recent molecular evidence seems to support that they belong to a single
species (Pérez-Barros et al. 2008). This evidence was based on mitochondrial-only markers, as
well as geographically very limited sampling scheme. Populations belonging to a so-called
‘ring species’ might appear sharply distinct in an area of secondary overlap, but appear more
gradually changing in morphology or genetics through areas of their distribution that have been
more continuously inhabited (see Irwin et al. 2005; Liebers et al. 2004 and references therein).
Inadvertently sampling only in the zone of secondary overlap might overlook potentially
intermediary phenotypes and differentiated genotypes from discrete habitats. Meanwhile, in
view of the growing reports of mito-nuclear discordance (Toews & Brelsford 2012), the lack
of differentiation at mitochondria cannot be confidently extrapolated to genetic homogeneity
without checking with multiple independent nuclear loci. I suspect if M. gregaria represents a
cryptic species complex or involves more hidden ecotypes. Therefore comprehensive
molecular and morphological examination with more inclusive sampling coverage is necessary
to conclude whether the ecotypes arise from a common genetic background.
i. In contrast to the lack of mitochondrial differentiation, whether nuclear microsatellites would
discordantly detect genetic differentiation between the two ecotypes; or both types of markers
would yield a coherent result of cryptic genetic divergence among populations/ecotypes with
continental scaled sampling?
ii. On the basis of large-scale and more inclusive sampling strategy, if the morphological traits
are continuous or still disrupt; are there possible hidden morphotypes?
iii. Whether the nomenclature M. gregaria harbours cryptic species, or is a single species with
possible phenotypic plasticity?
Task 3: Analysis and discussion of patterns of genetic structure, gene flow, genetic
diversity and demographic processes of M. gregaria throughout global species’ range in
the context of the climatological and geological history.
Although the squat lobster M. gregaria is shown to have great potential dispersal capability, in
view of the great longitudinal and latitudinal distances along Patagonian coastlines and the
strong isolation between central and eastern Pacific, it seems implausible that gene flow over
large distances can be maintained. Especially the > 7,000 km expanse of open deep water

Aims, questions and outline
19
between New Zealand and Chilean Patagonia forms the continuum of the East Pacific Barrier
(EPB) that was a highly effective marine biogeographical barrier separating west-central and
eastern Pacific fauna. Alternatively, molecular dating of divergence suggested speciation for
residences between sister taxa residing both sides of the EPB was much younger than the
proposed onset of the barrier, which implies that the existence of truly trans-EPB specie, if any,
would be a complex interplay between vicariance and dispersal.
The questions are in particular:
i. Is the EPB really a strict barrier to gene flow and migration between New Zealand and South
America?
ii. Do we find population genetic evidence that M. gregaria located off New Zealand and South
America has undergone cryptic speciation or remains as one integrated species?
iii. To what extent and in which direction do populations from New Zealand and South America
historically and contemporarily exchange genes?
2.2 Outline of the thesis The thesis consists of the introduction (chapter 1), three chapters corresponding to scientific
publications and manuscripts on the development and analysis of molecular markers on the
squat lobster Munida gregaria (chapter 4-6) and a chapter of synthesis that summarizes the
results and points out the importance for present and future research (chapter 7).
The three manuscript chapters discuss the necessity of a microevolutionary framework by
developing high informative marker set for the study species (chapter 4) and subsequently
using the novel marker set in combination with a traditional mitochondrial marker to provide
evidence in delimiting species (chapter 5) and to analyze the population genetic structure, the
present and past gene flow and demography of the study species (chapter 6).


Publications
21
3. List of publications and declaration of contribution
This thesis is organized into three chapters, each corresponding to separate research articles.
The candidate is the first author of the 3 manuscripts.
List of publications and declaration of contribution:
Publication I
Wang C, Held C
Isolation and characterization of 11 microsatellite markers from the squat lobster Munida
gregaria (Decapoda: Munididae) around the Falkland Islands/Islas Malvinas
Conservation Genetics Resources (2015) 7, 147-149
DOI: 10.1007/s12686-014-0314-5
The candidate designed the research, performed experiments, analysed the data and prepared
the manuscript. CH provided guidance in data analysis and improved manuscript.
Publication II
Wang C, Agrawal S, Laudien J, Häussermann V, Held C
Discrete phenotypes are not underpinned by genome-wide genetic differentiation in the squat
lobster Munida gregaria (Crustacea: Decapoda: Munididae): a multi-marker study covering
the Patagonian shelf
Submitted to BMC Evolutionary Biology on 17 August 2016
CH and the candidate conceived and designed the study. The field work was carried out by CH,
the candidate, JL and VH. The candidate carried out the experiments and the analyses. SA and
CH provided guidance in data analysis. The candidate and CH wrote the manuscript.
Publication III
Wang C, Held C
Crossing the impassable: mitochondrial and microsatellite markers confirmed high level of
realized dispersal and gene flow in the transoceanic squat lobster Munida gregaria (Decapoda:
Munididae) across the East Pacific Barrier

Publications
22
To be submitted to Molecular Ecology
The candidate designed the research, performed experiments, analysed the data and prepared
the manuscript. CH provided guidance in data analysis and improved draft.

Publication I
23
4. Isolation and characterization of eleven microsatellite markers from the squat lobster Munida gregaria (Decapoda: Munididae) around the Falkland Islands/Islas Malvinas 4.1 Abstract Understanding phylogenetic relationship and patterns of contemporary population genetic
structure is a prerequisite for conservation and management of potential fishery resources. In
this study I report the isolation and characterization of 11 polymorphic microsatellite loci for
the squat lobster Munida gregaria from around the Falkland Islands/Islas Malvinas. The
number of alleles ranged from 3 to 31, observed heterozygosity varied from 0.130 to 0.870.
Cross-amplification was 100% successfully in the species/morph M. subrugosa and 36.4% in
another congeneric species M. gracilis. This set of microsatellites is useful for studies focused
on taxonomy, genetic diversity and genetic connectivity further may provide stock assessment
information for monitoring this important fishery resource.
Keywords: Munida, Microsatellite, Falklands/Malvinas, Fishery
4.2 Methods and Results Munida gregaria (Fabricius, 1793) is an abundant decapod in the benthic fauna and a potential
fishery resource in southern South America (Tapella et al. 2002b) with further occurrences in
the Bass Strait, southern Australia and eastern New Zealand. Although sharp differences in
morphological, behavioral and ecological traits have sometimes lead to the recognition of M.
subrugosa Dana, 1852 as a distinct species, the two forms show no consistent genetic
differentiation based on mitochondrial markers (Pérez-Barros et al. 2008). Clarifying if they
are either (1) recently diverged species or (2) distinct phenotypes arising from a single genotype
requires multiple independent, fast-evolving genetic markers from the nuclear genome,
therefore I developed and characterized eleven polymorphic microsatellite markers for M.
gregaria.
Genomic DNA from several specimens from the Falkland Islands/Islas Malvinas was extracted
using QIAamp DNA Mini Kit (Qiagen) and subsequently pooled to construct microsatellite
enriched libraries according to the reporter genome protocol (Leese et al. 2008). Single
stranded DNA of Mus musculus served as reporter genome to hybridize target genomic DNA.
Enriched fragments were amplified, purified and cloned into pCR2.1-TOPO® TA vector then
transformed into competent TOP10F’ E. coli (Invitrogen, Promega). In total, 128 positive
clones were sent to GATC-Biotech (Konstanz, Germany) for shotgun sequencing.
Microsatellite characterization and primer design was carried out using the STAMP package

Publication I
24
(Kraemer et al. 2009). Out of 113 clones containing microsatellites, 29 candidate loci were
identified and tested in 10 μl reactions containing final concentration of 0.02 U/μl 5-Prime
Hotmaster Taq, 1 x PCR-buffer, 0.5 μM of forward and reverse primers, 0.2 mM dNTPs. Out
of 21 primer pairs that successfully amplified, forward primers of each locus were synthesized
with M13 tails added to their 5’ terminus (5’-GTAAAACGACGGCCAG-3’). Optimal
annealing temperature of M13-tailed primer pairs were decided after test on gradient PCR.
Final amplifications were conducted in two separate, successive PCRs, the first of which
contained 0.1 μM M13-tailed forward primers and reverse primers at annealing temperatures
optimized for each locus. The second amplification contained 0.2 μM labeled universal M13
primers and unlabeled locus-specific reverse primers with annealing temperature at 53 °C. One
microliter product of the first PCRs served as DNA templates in 10 μl reactions of the second
PCRs. PCR program was as follows: 94 °C for 2 min, then 36 cycles of 94 °C for 20 s, annealing
temperature for 20 s and 65 °C for 1 min, followed by a final elongation at 65 °C for 30 min.
Final labeled products were analyzed on an ABI 3130xl using ROX GS500 size standard
(Applied Biosystems). Genotyping was performed using GENEMAPPER ® 4.0 (Applied
Biosystems).
Allelic variation of eleven successfully genotyped microsatellite loci (Table 1) was assessed on
92 specimens from six stations around the Falkland Islands/Islas Malvinas. Alleles per locus
ranged from 3 to 31, observed heterozygosities (Ho) varied from 0.130 to 0.870. No evidence
for scoring errors caused by large allelic dropout or stutter bands could be found using
MICROCHECKER 2.2.3 (Van Oosterhout et al. 2004), while null allele presence was
suggested for Locus Mgr63. Significant deviations from Hardy-Weinbeig equilibrium (HWE)
were observed for two loci (Mgr63 and Mgr90) after Bonferroni correction (P 0.001), but no
linkage disequilibria were detected using GENEPOP 4.0.
Cross-amplification test was successful for all 11 loci in the M. subrugosa species/morphotype
(n = 10), but only for four loci (mgr4, mgr52, mgr90, mgr120) in another congeneric species
M. gracilis (n = 3). These polymorphic loci will prove useful to solve the aforementioned
taxonomic riddle and study the population genetics of M. gregaria in terms of conservation
and fisheries management.
4.3 Acknowledgments
I thank Andrea Eschbach for technical assistance. CW was supported by the Chinese
Scholarship Council (CSC grant Nr. 2009633009).

Publication I
25
Table 1 Characterization of 11 polymorphic microsatellite loci from M. gregaria for the Falklands/Malvinas population (n = 92)
NA number of alleles, Ta annealing temperature, Ho/He observed and expected heterozygosity
Locus Primer sequence (5’ – 3’) Repeat motif NA Size range (bp)
M13-tailed Ta(°C)
Ho/He Genbank accession no.
Mgr4 F: TACATTTGGACAGGTGGCGAC R: TTCACAACATTTTCTCCCGAC
(ACC)5…(ACC)4
…(ACC)4 12 296-338 58 0.717/0.767 KF011233
Mgr8 F: TTCAGGTGACATGTTAGGCA R: AACAGCTCCTGGCAGTACAT
(AATC)3…(AC)13 15 310-364 58 0.846/0.806 KF011234
Mgr46 F: CACAGTGAAACAGAGACCCA R: AAGGGAGGATGTGTGAGGTA
(AG)8 3 166-170 60 0.130/0.162 KF011236
Mgr52 F: CCGGAGTTCATTCACAATTT R: CATAAGTAGACGCACACGGA
(AC)10 9 160-176 55 0.761/0.733 KF011230
Mgr60 F: CACCTGGACCCATCATTATC R: GTATGGAATGTGTATGGCCG
(AC)29 31 170-258 56 0.750/0.867 KF011231
Mgr62 F: TAAGTTCGACTCCTGGCATT R: TGCTGCCTTTATCCAGTTCT
(AC)11 6 155-167 60 0.527/0.473 KF011232
Mgr63 F: ATGAGACTGTCTGGGTCTGG R: GACAAACAAGGAGAGACCGA
(ACAG)7...(ACAG)3…(ACAG)4
21 161-217 57 0.522/0.829 KF011235
Mgr81 F: TTACAACACAACAGTGGCTAC R: CCGTGTTCACATTGTATCAG
(AC)9 8 304-322 58 0.674/0.622 KF011229
Mgr90 F: GCTGCAGTAGTAGTCTTGGC R: ACATGAGCAGCACGTACAGT
(AGC)8 8 232-253 60 0.870/0.815 KF011238
Mgr105 F: CTTGGTAAGAAAATGAAGGTA R: TTGTTTATGTGTCAAATGCTG
(AC)6…(ACAG)1
0 26 267-353 57 0.802/0.929 KF011228
Mgr120 F: GGCAGATAACGTGACAAGGAC R: CCGTCTTACTCGTCACATTCAT
(AAGAGG)4 10 249-318 58 0.283/0.304 KF011237


Publication II
27
5. Discrete phenotypes are not underpinned by genome-wide genetic differentiation in the squat lobster Munida gregaria (Crustacea: Decapoda: Munididae): a multi-marker study covering the Patagonian shelf
5.1 Abstract Background: DNA barcoding has demonstrated that many discrete phenotypes are in fact
genetically distinct (pseudo)cryptic species. Similarly different phenotypes, however, can also
be expressed by genetically identical, isogenic individuals depending on environmental
conditions. This alternative explanation to cryptic speciation often remains untested because it
is harder to ascertain.
The widespread squat lobster Munida gregaria comprises two discrete ecotypes, gregaria s.
str. and subrugosa, which were regarded as different species by some due to marked differences
in their morphological, ecological and behavioral traits. I studied the morphometry and genetics
of M. gregaria and tested (1) whether the phenotypic differences remain stable after
continental-scale sampling and inclusion of different life stages, (2) and whether each
phenotype is underpinned by a specific genotype.
Results: A total number of 219 gregaria s. str. and subrugosa individuals from 25 stations
encompassing almost entire range in South America was included to perform morphological
and genetic analyses using nine unlinked hypervariable microsatellites and new COI sequences.
Results from the PCA and using discriminant functions demonstrated that the morphology of
the two forms remains discrete. The mitochondrial data showed shallow, star-like haplotype
network and complete overlap of intra- and inter-morphotypic genetic distances. Although all
microsatellite markers possess sufficient genetic variation, AMOVA, PCoA and Bayesian
clustering approaches revealed no genetic clusters corresponding to ecotypes or geographic
units across the entire South-American distribution. No evidence of isolation-by-distance could
be detected for this species in South America.
Conclusions: Despite their pronounced bimodal morphological and different lifestyles, the
gregaria s. str. and subrugosa ecotypes form a single, dimorphic species M. gregaria s. l..
Based on adequate geographic coverage and multiple independent polymorphic loci, there is
no indication that the two phenotypes have a genetic basis, leaving phenotypic plasticity or
localized genomic islands of speciation as possible explanations.
Keywords: phenotypic plasticity, genetic homogeneity, squat lobster, microsatellites, gene
flow

Publication II
28
5.2 Background Different species have different morphologies and lifestyles, which is commonly taken (but not
often tested) to reflect different underlying genotypes. The advent of affordable DNA
sequencing and molecular barcoding has served to greatly intensify the crosstalk between
molecular and taxonomic disciplines by uncovering a large number of previously overlooked
(pseudo)cryptic genotypes (Bickford et al. 2007; Hebert et al. 2004; Knowlton 2000), many of
which could be shown to be associated with equally overlooked morphotypes (Krabbe et al.
2009; Saez & Lozano 2005; Vanelslander et al. 2009).
However, the popularity and large number of cryptic species currently being discovered have
led to an under-appreciation of the notion that sharply distinct morphotypes are not always the
consequence of genetic differences but can also be invoked from the same genotype, often
called by environmental triggers. The differences between associated morphotypes and
lifestyles of ecotypes within the same species can be surprisingly pronounced (Harris et al.
2012; Jarrett 2009; Padilla 1998; Römer & Beisenherz 1996; Zakas & Wares 2012).
Proving polyphenism and rejecting cryptic speciation as an explanation is harder than
sequencing a mitochondrial gene fragment, which may in part explain the relatively lower
number of well-studied cases of polyphenism. Consistent differences among representatives of
different morphotypes in a single mitochondrial marker may suffice to at least flag these clades
to be checked for the presence of cryptic species, sometimes the mitochondrial differentiation
is taken at face value with no additional test carried out. But to demonstrate that no genetic
differences are responsible for the differences between ecotypes requires much more extensive
molecular evidence from multiple unlinked nuclear loci with sufficiently high substitution rates
in order to avoid common artefacts leading to the absence of demonstrable variation in the
molecular markers, in view of the commonly reported mito-nuclear discordance (Toews &
Brelsford 2012). Such extensive a posteriori knowledge is rare (e.g. Daphnia pulex (Colbourne
et al. 2011; Spanier et al. 2010; Tollrian & Leese 2010)), hence it is mostly experimental studies
in which the genetic identity of individuals is known a priori that contribute greatly to our
understanding of the importance of polyphenism and morphological plasticity, e.g.
parthenogenetic aphids (Dombrovsky et al. 2009; Müller et al. 2001), marbled crayfish (Vogt
et al. 2008), polyembryonic armadillos (Loughry & McDonough 2002) inbred lines of
Drosophila (Astauroff 1930), cloned swine (Archer et al. 2003a).

Publication II
29
It is unclear if the small number of confirmed polyphenism resulting from similar or identical
genetic backgrounds is a condition truly rare in nature or whether it reflects mostly a discovery
and/or publication bias.
Fig. 5.1 General views of gregaria s. str. and subrugosa ecotypes (above) and schematic diagrams showing morphometric measurements (below). For the dorsal view of both ecotypes, scale bar represents 1 cm. Measurements are made on: ACW, anterior carapace width; RBW, rostrum basis width; DaW, width of dactylopodus of third maxilliped; PW, width of propodus of the third maxilliped; EL, eyestalk length.
In this paper I investigate the dimorphic squat lobster, Munida gregaria sensu lato (Fabricius,
1793), which is currently considered to comprise the ecotypes M. gregaria sensu stricto Miers
1881 as well as its junior synonym M. subrugosa Dana, 1852 (see Baba et al. 2008). For clarity
and brevity, hereafter I refer to them as Munida gregaria s.l. comprising the two ecotypes
gregaria s.str. and subrugosa. In South America, M. gregaria s. l. occurs in shallow marine
waters off Patagonia, including Tierra del Fuego and the Falkland Islands/Islas Malvinas, while
in the southwestern Pacific M. gregaria s. l. are reported from off eastern New Zealand and

Publication II
30
Tasmania (Baba et al. 2008; Zeldis 1985). The taxonomic status of gregaria s. str. and
subrugosa ecotypes has been subject to conflicting interpretations. Both ecotypes were often
regarded as different species because of morphological differences in adult specimen (Fig. 5.1)
as well as different behaviors at certain developmental stages (Boschi et al. 1992; Hendrickx
2003; Retamal 1981; Tapella & Lovrich 2006). Williams (1973) on the other hand interpreted
gregaria s. str. as a transient, pelagic ontogenetic stage that would later in life gain the physical
features of subrugosa upon adopting a permanently benthic lifestyle. Regardless of the
taxonomic ramifications, gregaria s. str. is often found in huge pelagic swarms that subrugosa
lacks (Tapella et al. 2002a; Zeldis 1985). These differences persist even where both ecotypes
co-exist in the same habitat. Nevertheless, on the basis of a lack of mitochondrial DNA
differentiation (Pérez-Barros et al. 2008), these two ecotypes are currently treated as a single
polymorphic species under the name of M. gregaria in the most recent taxonomic revision of
the family (Baba et al. 2008). But this evidence must be considered insufficient because the
sampled region (Beagle Channel) represents a very small part of the species’ distribution and
the molecular evidence rest exclusively on two linked mitochondrial markers (COI and ND1),
whereas the results of the only nuclear marker (ITS-1) had to be excluded from the final
analysis of the only molecular study (Pérez-Barros et al. 2008).
In order to test whether gregaria s. str. and subrugosa ecotypes correspond to different species
of Munida or represent a single species with variable phenotypes, I employed multiple
independent, fast-evolving nuclear microsatellite markers (Wang & Held 2015) and an
expanded set of mtDNA sequences. The sampled area encompasses nearly the entire
distribution of gregaria s. str. and subrugosa ecotypes in South America. In addition, I analysed
morphological differences of both ecotypes and different ontogenetic stages following the
method of Tapella and Lovrich (2006) in order to test if the more complete geographic sampling
continues to support the discrete morphological clusters or if the boundaries between the two
ecotypes vanish under more complete geographic coverage.
Table 5.1 Sampling sites and number of adult and juvenile (in parentheses) gregaria s. str. and subrugosa ecotypes
Station Latitude Longitude
gregaria s. str.
adults (juveniles)
NmtDNA/NMSAT
subrugosa
adults (juveniles)
NmtDNA/NMSAT
Falklands/Malvinas (FM)

Publication II
31
12OT12 -52.110 -59.595 3/16 (0/0) 0/0 (0/0)
13OT13 -52.285 -59.546 4/12 (0/0) 0/0 (0/0)
15OT18 -52.391 -59.131 2/16 (0/0) 0/0 (0/0)
16OT19 -52.354 -58.592 2/16 (0/0) 0/0 (0/0)
17OT20 -52.359 -58.889 2/16* (0/0) 0/0 (0/0)
21OT16 -52.408 -59.976 2/16* (0/0) 0/0 (0/0)
12OT15 -52.189 -59.975 1/1 (0/0) 0/0 (0/0)
Total 16/93 (0/0) 0/0 (0/0)
Northern Chilean Patagonia (NCP)
Punta Metri -41.595 -72.712 0/0 (4/7) 0/0 (0/0)
Huinay -42.354 -72.463 3/3 (13/13) 0/0 (0/0)
Isla Dring -46.442 -73.957 0/0 (7/7) 0/0 (0/0)
Punta Añihue -43.793 -72.925 0/0 (4/16) 0/0 (0/0)
Islas Pajaros -43.783 -72.997 0/0 (0/0) 0/0 (5/5)
Isla Lopez-mine -50.361 -75.332 0/0 (4/7) 0/0 (0/0)
Isla Solaris -51.330 -74.311 5/5 (0/0) 7/7 (0/0)
Total 8/8 (32/50) 7/7 (5/5)
Tierra del Fuego archipelago (TdF)
Punta Dungenes -52.436 -68.568 0/0 (0/0) 1/1 (0/0)
Bahia Gregorio -52.685 -70.142 5/10 (0/0) 0/0 (0/0)
Seno Otway -52.918 -71.347 0/0 (0/0) 4/13 (0/0)
Silva Palma -53.347 -71.800 0/0 (0/0) 0/0 (2/7)
Bahia Inutil -53.556 -69.695 0/0 (0/0) 2/5 (0/0)
Bahia Nassau -55.383 -69.450 0/0 (0/0) 1/1 (0/0)
Pt. Engaño -54.929 -70.709 0/0 (0/0) 2/2 (0/0)
Bahia Virginia -54.911 -67.726 0/0 (0/0) 8/12 (0/0)
Isla Picton -55.174 -66.721 0/0 (0/0) 0/2 (0/0)
Isla Lennox -55.393 -66.679 0/0 (0/0) 2/2 (0/0)
Total 5/10 (0/0) 20/38 (2/7)
Mar del Plata (MdP)
CCDB 2374 -38.003 -57.469 0/0 (0/0) 1/0 (0/0)
Grand total 29/111 (32/50) 28/45 (7/12)

Publication II
32
NmtDNA, the number of specimens used with mitochondrial marker; NMSAT, the number of specimens used with microsatellites
* refers to one specimen with missing genotype at a certain microsatellite locus
Fig. 5.2 Sampling sites of gregaria s. str. (solid circle) and subrugosa (open circle) ecotypes. FM, Falklands/Malvinas; TdF, Tierra del Fuego archipelago; NCP, Northern Chilean Patagonia; MP, Mar del Plata.
5.3 Methods
Study population
A total number of 219 individuals were used for both morphological and molecular analyses in
this study. These samples were collected at 25 stations from Patagonia and off the Falkland
Islands/Islas Malvinas ranging from 38°S to 55°S from the shallow subtidal area to 179 meters
water depth by mid-water or bottom trawls (Table 5.1, Fig. 5.2). Sexual maturity was identified
Publication II
33
as presence of eggs and/or sexually dimorphic pleopods. In adult males the first two pairs of
pleopods are modified to form gonopods, the remaining three pairs are flap-like; in adult
females the first pair is missing and the remaining four pairs are elongated with long setae for
egg-carrying (Tapella et al. 2002a).
Morphological analysis
Specimens were classified as gregaria s. str. rather than subrugosa ecotypes based on the
following characteristics: longer eyestalk length (EL), wider rostrum basis (RBW) and broader
and blunter dactylus of the third maxilliped (DaW) (Fig. 5.1). These three morphometric
characteristics together with anterior carapace width (ACW) and width of propodus of the third
maxilliped (PW) were statistically significant in discriminating ecotypes (Tapella & Lovrich
2006) I measured my samples using a Leica MZ-12.5 microscope with intraocular scale to
the nearest 0.1 mm. To determine patterns emerging from the morphometric measurements of
these five body parts, principal components analysis (PCA) was plotted using the statistical
package PAST 3 (PAlaeontological STatistics, Hammer et al. 2001). Applying discriminant
functions (DF1 and DF2) introduced in (Tapella & Lovrich 2006), ΔDF (DF1-DF2) values were
calculated based on these measurements and subsequently plotted using R (R Core Team 2015).
mtDNA analysis
DNA was extracted from ethanol-preserved abdominal or cheliped muscle tissue using
QIAamp DNA Mini Kit (QIAGEN, Germany). For mtDNA analysis, a region of the COI gene
was amplified using the universal primers HCO2198 and LCO1490 (Folmer et al. 1994) for 96
individuals (Table 1). The 10 μl reactions consisted of 0.02U/μl Hotmaster Taq (5 Prime), 0.2
mM dNTPs, 0.5 μM of forward and reverse primers, 1 x PCR-buffer and 1 μl (about 30 ng) of
template DNA. PCR was conducted using an initial denaturation at 94°C for 2 minutes,
followed by 36 cycles of 94°C for 20 seconds, annealing at 47°C for 20 seconds, 65°C for 1
minute, and a final extension at 65°C for 10 minutes. Size and quality of amplified products
were checked on a 2% agarose gel in TAE buffer, and then 1 μl of purified PCR product was
used for cycle sequencing with the HCO primer. Sanger sequencing was conducted on an ABI

Publication II
34
3130xl sequencer. Alignment was done using CODONCODE ALIGNER 4.0 (CodonCode
Corp.) and checked for the presence of ambiguities and stop codons.
DNA polymorphism was examined as haplotype diversity (HD) and nucleotide diversity (π) for
each ecotype and all samples using DnaSP 5.10 (Librado & Rozas 2009). Genealogical
relationships among haplotypes were inferred using statistical parsimony implemented in TCS
1.21 (Clement et al. 2000). Pairwise genetic divergences measured as number of nucleotide
differences were calculated within and between the two ecotypes in MEGA 5.2 (Tamura et al.
2011). For a better understanding of the genetic distances and barcoding gap analysis, I added
three congeneric species to my analysis: M. rutllanti (n = 5; GenBank accession numbers:
JQ306226-JQ306230), M. quadrispina (n = 3; GenBank accession numbers: DQ882090-
DQ882092), and M. gracilis from my own collection (n = 2; GenBank accession numbers:
KJ544249-KJ544250). Pairwise genetic distances were calculated within M. gregaria s. l.
(pooled gregaria s. str. and subrugosa) and versus the other three Munida species.
Microsatellite analysis
In total, 218 individuals were screened for genetic variation at 11 microsatellite loci that were
originally designed for M. gregaria s. l. (Wang & Held 2015) (Table 5.1). Allele sizes were
manually binned and genotypes were assessed in GENEMAPPER 4.0 (Applied Biosystems).
Null alleles, stuttering and large allele dropout were tested using MICROCHECKER (Van
Oosterhout et al. 2004). Because of too many missing data and possible null alleles, locus
Mgr63 and Mgr105 were excluded from subsequent analyses. Genetic diversity within each
ecotype was summarized as allelic richness (Ar) in FSTAT 2.9.3.2 (Goudet 2001) using the
rarefaction approach, which was also used to determine the number of private alleles using
standardized sample sizes in ADZE 1.0 (Szpiech et al. 2008). Detection of linkage
disequilibrium between loci and deviations from Hardy-Weinberg equilibrium (HWE) per
ecotype were performed using GENEPOP 4.2 (Raymond & Rousset 1995). All loci were tested
for positive/diversifying or balancing selection using LOSITAN (Antao et al. 2008), which
simulates an expected distribution of FST as a function of expected heterozygosity under an
island model of migration. The statistical power of this set of microsatellite loci to detect
significant genetic differentiation between populations/ecotypes was tested with POWSIM 4.1
(Ryman & Palm 2006) using both Chi-square (χ2) and Fisher's exact test analysis. Various levels
of differentiation (measured as FST in the range from 0.001 to 0.01) were determined by
combining different effective population size (Ne) and times since divergence (t). In addition,

Publication II
35
POWSIM allows calculating type I error probability, which is the probability of rejecting the
null hypothesis of genetic homogeneity although it was true by drawing the alleles directly
from the base population (t = 0).
The genetic differentiation among the three major sampling areas, i.e., FM, NCP and TdF (see
Table 1), was assessed for each ecotype separately with AMOVA in ARLEQUIN 3.5 (Excoffier
& Lischer 2010). Both FST and RST estimators were calculated over all nine loci with 1,000
permutations. To provide a visual representation of species separation and potential subdivision,
Principal Coordinate Analysis (PCoA) was performed in GENALEX 6.5 (Peakall & Smouse
2006).
Bayesian assignment tests were used to evaluate the level of genetic clustering. I used
STRUCTURE 2.3.4 (Pritchard et al. 2000) first without giving any prior population
information, letting K range from 1 to 5. I also checked whether individuals could be assigned
correctly to clusters if the number of ecotypes was given a priori (K = 2). Both conditions were
run with the correlated allele frequencies option under the non-admixture model, i.e. under the
assumption that there is no gene flow between ecotypes, as well as under an admixture model,
i.e. allowing limited introgression between clusters. Twenty runs with 200,000 Markov chain
Monte Carlo (MCMC) iterations after a burn-in period of 25,000 steps were carried out for
each K. The results were uploaded onto STRUCTURE HARVESTER (Earl & von Holdt 2012)
and K was determined using the ad hoc statistic ΔK (Evanno et al. 2005), as well as mean
estimates of posterior probability L(K) (Pritchard et al. 2000). Results from the 20 replicates
of the most likely value for K were averaged using the software CLUMPP 1.1.2 (Jakobsson &
Rosenberg 2007) and the output was visualized using DISTRUCT 1.1 (Rosenberg 2004).
Since L(K) does not always provide the correct number of clusters and the ΔK statistic cannot
evaluate K = 1 or the largest value chosen for K (Evanno et al. 2005), I also applied
STRUCTURAMA 2.0 (Huelsenbeck & Andolfatto 2007), which can directly estimate the
number of clusters in which a sample can be subdivided. I allowed the number of populations
to be a random variable following a Dirichlet process prior, ran the MCMC analysis for
1,000,000 cycles, sampled every 100th cycle, and discarded the first 400 samples as burn-in.
The impact of isolation by distance (IBD) across southern South America on genetic
differentiation was estimated by Mantel tests as implemented in IBD Web Service 3.23 (Jensen
et al. 2005). For this purpose, only the geographic position but not the ecotype of the samples

Publication II
36
(mitochondrial and microsatellite data) were used (Table 5.1; Fig. 5.2). Pairwise FST values for
mitochondrial data and pairwise (δμ)2 genetic distance (Goldstein et al. 1995) for
microsatellites were obtained in ARLEQUIN 3.5, where spatial distances were calculated using
the Geographic Distance Matrix Generator 1.2.3
(http://biodiversityinformatics.amnh.org/open_source/gdmg/index.php). Geographical
distances were log-transformed to account for two-dimensional habitat distribution (Rousset
1997), and the significance of the slope of the reduced major axis (RMA) regression was
assessed by 30 000 randomizations.
5.4 Results
Morphological analysis
PCA comparison of five key morphometric characteristics (Tapella & Lovrich 2006) revealed
clearly distinct groups corresponding to ecotype and age, with the first principal component
explaining 92.48% of the variation. Samples of adult and juvenile gregaria s. str. formed two
isolated groups, both of which were clearly distinct from the subrugosa samples. The
subrugosa individuals comprise the adult and juvenile sub-groups that overlap in part (Fig. 5.3).
The discriminant functions with these five morphometric characteristics yielded result coherent
with the PCA. Samples of adult gregaria s. str. and juvenile gregaria s. str. clustered separately,
while due to the limited number of subrugosa juveniles (n = 12) it is hard to ascertain whether
juvenile and adult subrugosa show statistically significant differences (Fig. 5.4). Results of
morphological analyses ascertain that even among samples from the entire South American
distribution gregaria s. str. and subrugosa are distinct ecotypes at different ontogenetic stages
with discrete morphological traits rather than forming the extremes of a continuous distribution.

Publication II
37
Fig. 5.3 Principal component analysis (PCA) biplot for the morphometric measurements of all the samples. Dashed lines show vectors from the five representative body characteristics that are statistically significant in discriminating ecotypes. The 95% concentration ellipses are given for juvenile and adult gregaria s. str. as well as juvenile and adult subrugosa. A dashed 95% concentration ellipse represents all subrugosa individuals. Solid arrows indicate suggested interpretation as ontogenetic transition within ecotype (horizontal) and morphological discreteness between ecotypes (vertical; see discussion).
Fig. 5.4 Frequency distribution of ΔDF scores based on the morphometric measurements.
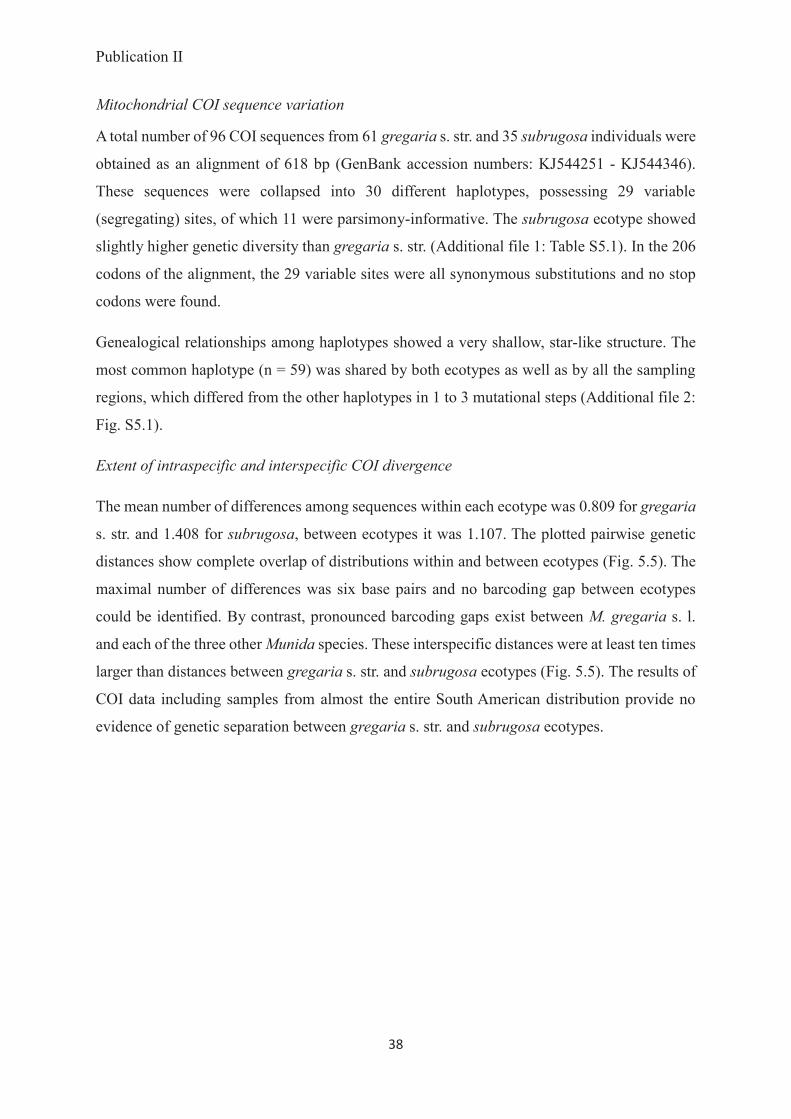
Publication II
38
Mitochondrial COI sequence variation
A total number of 96 COI sequences from 61 gregaria s. str. and 35 subrugosa individuals were
obtained as an alignment of 618 bp (GenBank accession numbers: KJ544251 - KJ544346).
These sequences were collapsed into 30 different haplotypes, possessing 29 variable
(segregating) sites, of which 11 were parsimony-informative. The subrugosa ecotype showed
slightly higher genetic diversity than gregaria s. str. (Additional file 1: Table S5.1). In the 206
codons of the alignment, the 29 variable sites were all synonymous substitutions and no stop
codons were found.
Genealogical relationships among haplotypes showed a very shallow, star-like structure. The
most common haplotype (n = 59) was shared by both ecotypes as well as by all the sampling
regions, which differed from the other haplotypes in 1 to 3 mutational steps (Additional file 2:
Fig. S5.1).
Extent of intraspecific and interspecific COI divergence
The mean number of differences among sequences within each ecotype was 0.809 for gregaria s. str. and 1.408 for subrugosa, between ecotypes it was 1.107. The plotted pairwise genetic
distances show complete overlap of distributions within and between ecotypes (Fig. 5.5). The
maximal number of differences was six base pairs and no barcoding gap between ecotypes
could be identified. By contrast, pronounced barcoding gaps exist between M. gregaria s. l.
and each of the three other Munida species. These interspecific distances were at least ten times
larger than distances between gregaria s. str. and subrugosa ecotypes (Fig. 5.5). The results of
COI data including samples from almost the entire South American distribution provide no
evidence of genetic separation between gregaria s. str. and subrugosa ecotypes.

Publication II
39
Fig. 5.5 Estimates of divergence between sequences among the two ecotypes and three other Munida species. Pairwise comparisons were performed using number of base differences.
Microsatellite diversity
Overall, the number of alleles per locus ranged between six (Mgr46) and 38 (Mgr60) with an
average of 14.9. For each locus the number of alleles, allelic size range, allelic richness as well
as observed and expected heterozygosities per population and ecotype are reported in
Additional file 3: Table S2. The mean number of private alleles per locus when sample size
was standardized was slightly higher for subrugosa (0.198±0.120) compared to gregaria s. str.
(0.111±0.065), both of which were very low, reflecting a high degree of allelic sharing between
the two ecotypes. Compared to the limited variation among COI sequences, the nine
microsatellite loci exhibited broader allelic ranges and orders of magnitude higher allelic
variation (Additional file 4: Fig. S5.2). All loci showed no linkage disequilibrium. Locus
Mgr90 showed significantly higher heterozygosity than expected, but since excluding Mgr90
had only minor effect on the results, it was kept in this study. The power test suggested that my
microsatellite dataset was sensitive enough to detect very weak genetic differentiation (FST =
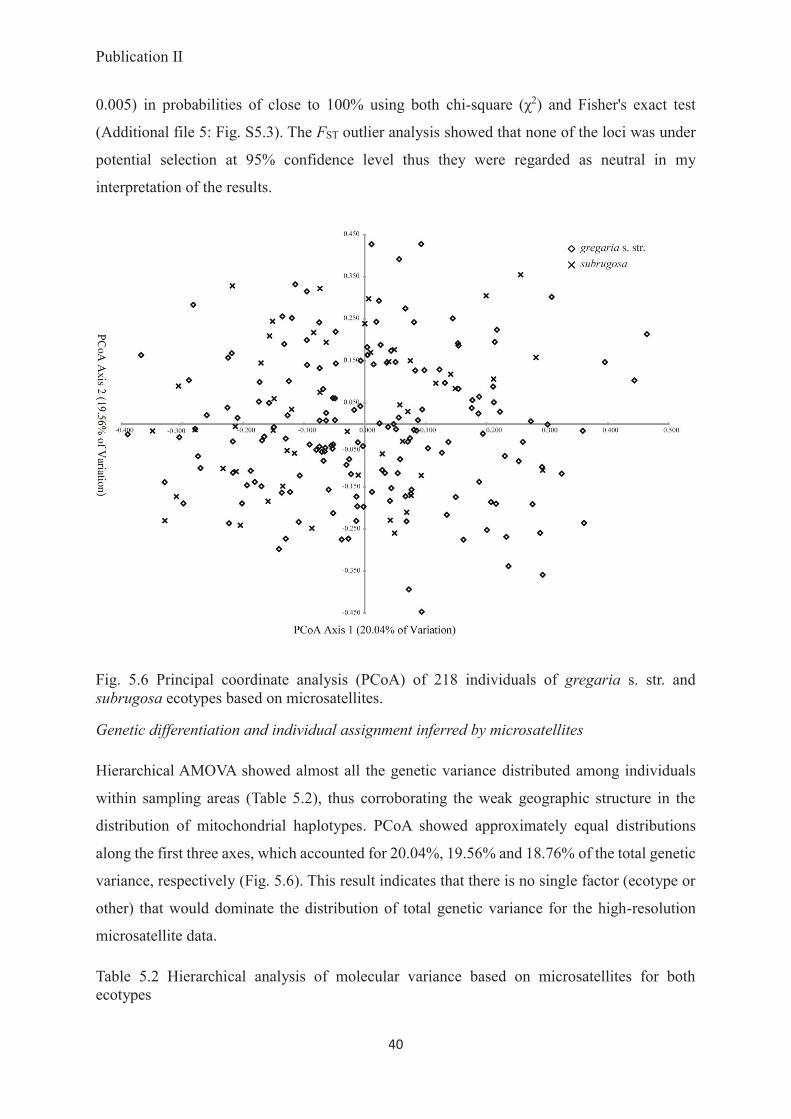
Publication II
40
0.005) in probabilities of close to 100% using both chi-square (χ2) and Fisher's exact test
(Additional file 5: Fig. S5.3). The FST outlier analysis showed that none of the loci was under
potential selection at 95% confidence level thus they were regarded as neutral in my
interpretation of the results.
Fig. 5.6 Principal coordinate analysis (PCoA) of 218 individuals of gregaria s. str. and subrugosa ecotypes based on microsatellites.
Genetic differentiation and individual assignment inferred by microsatellites
Hierarchical AMOVA showed almost all the genetic variance distributed among individuals
within sampling areas (Table 5.2), thus corroborating the weak geographic structure in the
distribution of mitochondrial haplotypes. PCoA showed approximately equal distributions
along the first three axes, which accounted for 20.04%, 19.56% and 18.76% of the total genetic
variance, respectively (Fig. 5.6). This result indicates that there is no single factor (ecotype or
other) that would dominate the distribution of total genetic variance for the high-resolution
microsatellite data.
Table 5.2 Hierarchical analysis of molecular variance based on microsatellites for both ecotypes

Publication II
41
Source of variation d.f. Sum of
squares variation
components variation
[%] F-statistics P Sum of squares
variation components
variation [%] R-statistics P
Among ecotypes 1 3.487 -0.00290 -0.10 FCT=-
0.00103 0.507 167.743 -1.10788 -0.45 RCT=-0.00448 1.00
Among sampling areas within ecotypes
3 10.977 0.01229 0.44 FSC= 0.00437 0.0426 976.391 1.11995 0.45 RSC= 0.00451 0.204
Within sampling areas
431 1207.396 2.80138 99.67 FST=0.0334 0.0255 106578.987 247.28303 100 RST=0.00005 0.277
Total 435 1221.860 2.81077 100 107723.122 247.29510 100
Bayesian cluster analyses with STRUCTURE suggested the best K was 1 according to average
log probability (L(K)), but K = 2 was indicated by the highest statistic ΔK. This is because the
change in log probability does not account for the smallest and largest K. Even under K = 2,
each individual possessed a roughly equal probability of being assigned to the first versus the
second cluster, which indicates that all individuals belong to one single group (Fig. 5.7).
Congruent distribution of posterior probabilities for each individual was obtained given the a
priori assumed number of putative populations (=ecotypes).
Fig. 5.7 Individual probabilities of cluster assignments from the software STRUCTURE. The most likely number of clusters K = 2 is shown for gregaria s. str. (n = 161) and subrugosa (n = 57) using nine microsatellite loci. Each vertical line represents the probabilities for a single individual to be assigned to one of the clusters (K).
The STRUCTURAMA analysis corroborated the inferences of the STRUCTURE analysis. The
sampled individuals all belonged to one group with a posterior probability of 1. Eventually,
both Bayesian analyses showed no correlation of my microsatellite data with either ecotypes
or geographical units.
An absence of genetic structure over the entire distribution range in South America was also
found in the IBD tests. Based on both mitochondrial and microsatellite data sets, Mantel tests
indicated no significant correlation (for COI, r = 0.0608, P = 0.229; for microsatellites, r = -

Publication II
42
0.005, P = 0.508) between genetic and log-transformed geographic distances (Additional file
6: Fig. S5.4).
5.5 Discussion
Reality of morphological dimorphism in M. gregaria s. l.
In theory, populations belonging to a so-called ‘ring species’ might appear sharply distinct in
an area of secondary overlap, but appear more gradually changing in morphology or genetics
through areas of their distribution that have been more continuously inhabited (see (Irwin et al.
2005; Liebers et al. 2004) and references therein). Inadvertently sampling only in the zone of
secondary overlap might therefore create the incorrect impression of discrete morphotypes
when populations with intermediary morphotypes remain unsampled.
Increasing the sampling area from a single location in the Beagle Channel (Pérez-Barros et al.
2008) to a continental scale, my data suggest that the boundary between two morphotypes
(gregaria s. str. and subrugosa) is not blurred across the South American shelf (Figs. 5.3 and
5.4).
The expanded morphometric analysis further suggests an ontogenetic dimension in the
morphometry. It may be expected that the gap between adults and Northern Chilean Patagonia
(NCP) juveniles in gregaria s. str. might be closed by inclusion of juveniles from other
populations and reveal a continuous ontogenetic transition as can already be found in
subrugosa (Fig. 5.3). The discreteness of the subrugosa and gregaria s. str. morphotypes,
however, is not a sampling artefact and stable with respect to a more representative sampling
scheme as well as inclusion of different life stages.
Phenotype-genotype relationship
Since the proposal that phenotype and genotype form two fundamental different levels of
biological abstractions (Johannsen 1911), untangling the relationship between phenotypes and
the underlying genotypes has long been challenging and intriguing. The advent of molecular
techniques has greatly fostered studies of phenotype-genotype interaction, especially in the
venue of ubiquitous application of DNA barcoding. The short mitochondrial fragments (e.g.
Held 2003) successfully discovered (pseudo)cryptic genetic divergence whereas corresponding
phenotypes appeared identical. Such unexpected genetic diversity, which was later often
corroborated by other independent evidences from morphology (Mobley et al. 2011), breeding

Publication II
43
behavior (Gómez et al. 2007) or multiple, independent and informative nuclear markers (Leese
& Held 2008), has become an important supplement for the phenotypic identification of an
organism to species or sub-species level in taxonomic practice (Hajibabaei et al. 2007; Hebert
& Gregory 2005; Valentini et al. 2009).
Alternatively, molecular marker-based examination found no genetic differentiation matching
discrete phenotypes, which is exemplified by the present Munida case. Nonetheless, the lack
of differentiation at a single mitochondrial marker is insufficient to extrapolate to the entire
genome. A previous molecular study used only mitochondrial evidence and found no consistent
genetic differentiation associated with each ecotype (Pérez-Barros et al. 2008) but failed to
demonstrate genetic homogeneity in the nuclear genome. The only nuclear locus (ITS 1) was
excluded from the final analysis in (Pérez-Barros et al. 2008) due to conflicting information
and possible paralogy of sequences. The inference of genetic homogeneity in (Pérez-Barros et
al. 2008) thus rested exclusively on two fully linked mitochondrial markers, COI and ND1 (the
third mitochondrial marker 16S yielded identical sequences among all individuals). In the
absence of recombination, mitochondrial genes are vulnerable to introgressive hybridization,
sex-biased dispersal, incomplete lineage sorting and heteroplasmy (Ballard & Whitlock 2004;
Ebach & Holdrege 2005; Rubinoff et al. 2006; Toews & Brelsford 2012; Wares 2010). The
determination of a ‘barcoding gap’ (i.e., significant difference between inter- and intraspecific
variation) may fail in case of close phylogenetic relationship or recent divergence (Meyer &
Paulay 2005; Moritz & Cicero 2004; Wiemers & Fiedler 2007).
However, the shortcomings of (Pérez-Barros et al. 2008) were addressed by my more
expansive sampling and the inclusion of multiple unlinked microsatellites, thus suggesting that
the distinct phenotypes in M. gregaria s. l. are not caused by different genotypes.
A case of phenotypic plasticity
A common caveat to marker-based population genetic studies in case of no differentiation
detected among populations (i.e., different phenotypes in this case) is that there may be still
unsampled isolated regions of differentiation within genome. Such ‘genomic islands’ of
differentiation (Harr 2006; Turner et al. 2005) are usually associated with genes under
divergent selection, whilst selectively neutral markers are not involved (Gavrilets & Vose 2005;
Nosil et al. 2009; Wu & Ting 2004). This alternative is hard to falsify and might be true for any
marker-based study in organisms with incompletely known genomes.

Publication II
44
Given the geographic and genomic sampling scope of my study, we can eliminate the
possibility of genetic differentiation underpinning different phenotypes, then the different
ecotypes within M. gregaria s. l. represent phenotypic plasticity, which is determined by
variations of certain environmental factors. In similar examples from parthenogenetic Daphnia
and aphids, sharply distinct morphotypes arise from the same genetic background
(Dombrovsky et al. 2009; Müller et al. 2001; Stibor & Lüning 1994) and in some examples
the environmental triggers controlling which phenotype is preferentially expressed are known.
For example, the sex of offspring from one clutch was found to be determined by temperature
among various gonochoristic organisms (those having separate sexes), e.g., invertebrates
(Cline 1976; Klass et al. 1976), fishes (Baras et al. 2000; Koumoundouros et al. 2002; Römer
& Beisenherz 1996), turtles (Bull & Vogt 1979) and crocodilians (Lang & Andrews 1994).
Dramatically different morphology can be expressed in presence or absence of predators in
Daphnia water fleas (Green 1967; Parejko & Dodson 1991; Tollrian & Harvell 1999), barnacle
Chthamalus fissus (Jarrett 2009) whereas little genetic correspondence is involved in the
predator-induced morphological changes (Jarrett 2008; Spanier et al. 2010; Tollrian & Leese
2010).
The determination of Munida ecotypes are very likely induced and controlled by one or several
as yet unknown environmental factors. In its South American distribution, Munida gregaria s.
l. occupies extensive latitudinal distribution along both coasts of Patagonia and wide
bathymetry (from water surface down to 1137m recorded for subrugosa (Arntz et al. 1999)),
which involves a strong gradient of environmental conditions (temperature, salinity, oxygen
concentration and food resources). In some species the feeding performance and diet
composition during larval phases can induce development into different morphotypes or sex
reversal (Parsons & Robinson 2007; Zupo 2000). Since gregaria s. str. and subrugosa differ in
feeding habit as deposit feeders and predator, respectively (Romero et al. 2004), changes in
environmental food composition may affect the metamorphosis of M. gregaria s. l. in an
adaptive way, favouring its development into one ecotype rather than the other. Long-term
observations of the proportion of both gregaria s. str. and subrugosa ecotypes in the Beagle
Channel and San Jorge Gulf demonstrate the existence of ecotypes is patchy (see Diez et al.
2016 and references therein). Recent hydroacoustical evidence postulates that major pelagic
swarms of gregaria s. str. on the Argentine continental shelf are associated with productive
areas such as frontal zones that vary considerably in spatial and temporal scales (Diez et al.

Publication II
45
2016), implying the availability of phytoplankton in frontal zones might favor the expression
of gregaria s. str. ecotype.
Heterochrony, which is generally defined as a developmental change in relation to size and
shape in the timing or rate of ontogenic events (see review in Smith 2001), might be a possible
mechanism involved in the observed plasticity in M. gregaria s. l.. Heterochronic process such
as paedomorphic plasticity was postulated in a widespread squat lobster in the Pacific of South
America, Pleuroncodes monodon (Haye et al. 2010). A clear boundary exists in its distribution
where to the north it is a smaller, pelagic form and to the south it is a larger, benthic form.
These two forms showed no mitochondrial DNA differentiation. A similar developmental
variation might be involved in M. gregaria s. l., since the population from San Jorge Gulf was
shown to have faster growth rate and earlier reproductive investment in its early life history
than the southern populations from Beagle Channel and Strait of Magellan (Varisco & Vinuesa
2015).
5.6 Conclusions
Based on extensive sampling of the species’ distribution in South America, and using nine
independent polymorphic nuclear microsatellite loci in addition to new mitochondrial COI
sequences, I were able to show that the lack of genetic differentiation between distinct gregaria
s. str. and subrugosa ecotypes is not an artefact due to insufficient genomic and geographic
sampling, instead they are expressed from a single underlying genotype. Morphological tests
affirmed the boundaries between the two ecotypes were not blurred with continental-scale
geographic sampling, and remain stable despite an ontogenetic dimension in the data. My
findings serve as evidence in the taxonomy of species M. gregaria s. l. (Fabricius, 1793), which
is a species with phenotypic plasticity. Its broad distribution, lack of genetic differentiation and
high levels of phenotypic divergence render M. gregaria s. l. an appropriate model to study
ecologically driven evolution, adaptive radiation and adaptive speciation. In view of the
increasing numbers of reported discordance between mtDNA and nuclear DNA, which
questions the validity of many species boundaries defined only by fast DNA barcoding, it is
necessary and strongly suggested to incorporated nuclear multi-locus markers in the attempt of
accurate taxonomy and reflection of genotype-phenotype relationship.
5.7 Acknowledgments We are very grateful to Erika Mutschke (Universidad de Magallanes, Punta Arenas), Vreni
Häussermann and Günter Försterra (Huinay scientific field station, Chile), Felipe González

Publication II
46
(Reserva Añihue, Chile), Kareen Schnabel (NIWA, New Zealand) and Fernando L. Mantelatto
(University of São Paulo, Brazil) for providing samples. I thank the Reserva Añihue for
equipment support and their hospitality. I also thank Andrea Eschbach for technical assistance
in the lab and Florian Leese for his help in the field.
5.8 Additional files Table S5.1 Genetic diversity of COI sequences per ecotype
Sequences Haplotypes Private Haplotypes HD* π*
gregaria s. str. 61 18 15 0.571 0.00131
subrugosa 35 14 12 0.677 0.00228
overall 96 30 0.622 0.00169
* HD, haplotype diversity (Nei 1987, equation 8.4); π, nucleotide diversity (Nei 1987, equation 10.5) Nei M (1987) Molecular evolutionary genetics. Columbia University Press, New York, USA.
Fig. S5.1 Haplotype genealogies for gregaria s. str. and subrugosa ecotypes. Each branch represents one substitution; small filled circles represent hypothetical, unsampled haplotypes. Radii reflect number of individuals that share a particular haplotype.
Table S5.2 Diversity indices of nine microsatellite loci for the two ecotypes. Reported are number of alleles NA, fragment size range, observed heterozygosity HO, expected

Publication II
47
heterozygosity HE and allelic richness Ar. Significant deviation from Hardy-Weinberg equilibruim (P < 0.05, based on 10,000 permutations) after Bonferroni correction were labeled in bold.
NA Size range
subrugosa_NCP subrugosa_TdF subrugosa_Total
HO/ HE Ar HO/ HE Ar HO/ HE Ar
mgr4 18 266-341 0.75/0.706 4.13 0.533/0.615 6.02 0.579/0.634 13.03
mgr8 21 284-364 0.916/0.793 7.53 0.844/0.838 6.93 0.860/0.832 13.68
mgr46 6 148-172 0.166/0.159 2.79 0.133/0.208 2.43 0.140/0.198 4.39
mgr52 11 160-180 0.833/0.753 5.32 0.666/0.753 5.07 0.702/0.747 7.93
mgr60 38 170-274 1/0.913 11.91 0.755/0.895 11.36 0.807/0.897 29.44
mgr62 7 155-167 0.5/0.489 3.38 0.377/0.406 3.25 0.404/0.424 5.24
mgr81 9 296-322 0.666/0.594 3.53 0.644/0.611 4.05 0.649/0.607 7.09
mgr90 9 232-256 0.75/0.807 6.16 0.8/0.822 6.22 0.789/0.832 7.88
mgr120 15 249-318 0.333/0.307 4.12 0.355/0.339 3.95 0.351/0.332 9.59
gregaria. s. str._FM gregaria. s.
str.__NCP gregaria. s. str.__TdF
gregaria. s. str.__Total
HO/ HE Ar HO/ HE Ar HO/ HE Ar HO/ HE Ar
mgr4 0.720/0.768 6.98 0.637/0.676 5.45 0.7/0.805 7.00 0.689/0.737 13.54
mgr8 0.838/0.816 6.62 0.810/0.829 7.46 1/0.773 6.77 0.839/0.816 13.70
mgr46 0.129/0.161 2.16 0.206/0.249 2.67 monomorphic 1.98 0149/0.184 3.68
mgr52 0.763/0.735 5.12 0.689/0.762 5.07 0.7/0.7 4.81 0.733/0.744 7.62
mgr60 0.752/0.870 11.17 0.896/0.887 11.08 0.7/0.905 11.60 0.801/0.880 29.43
mgr62 0.516/0.483 3.17 0.534/0.589 3.53 0.8/0.573 2.83 0.540/0.536 5.47
mgr81 0.677/0.627 4.03 0.620/0.626 4.54 0.4/0.673 2.98 0.640/0.633 7.56
mgr90 0.870/0.820 6.32 0.844/0.830 6.18 1/0.805 4.98 0.870/0.824 8.07
mgr120 0.290/0.311 3.77 0.396/0.376 4.03 0.1/0.1 3.65 0.317/0.324 9.40
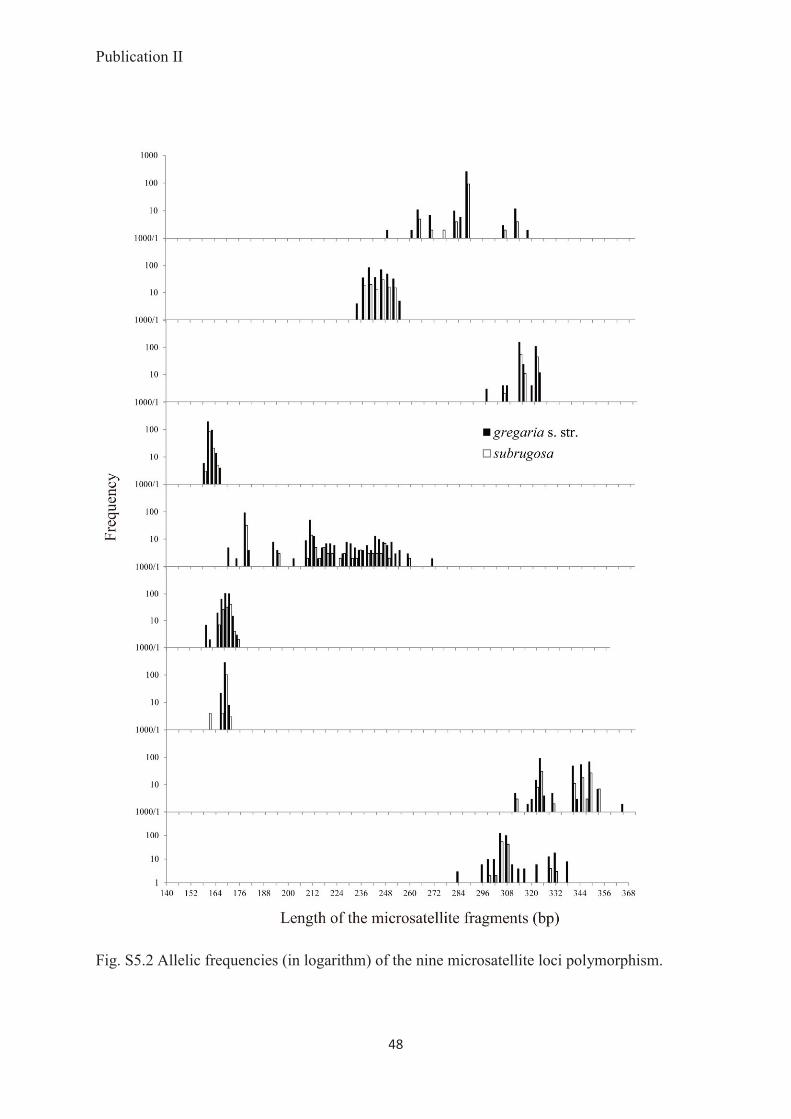
Publication II
48
Fig. S5.2 Allelic frequencies (in logarithm) of the nine microsatellite loci polymorphism.

Publication II
49
Fig. S5.3 Tests of statistical power for microsatellite data set as inferred with POWSIM 4.1.
Fig. S5.4 Correlation between genetic distances (Pairwise FST values for COI and pairwise (δμ)2 values for microsatellites) and log-transformed geographical distances for mitochondrial and microsatellite data for specimens from 25 sampling sites listed in Table 1.


Publication III (Manuscript)
51
6. Crossing the impassable: mitochondrial and microsatellite markers confirmed high level of realized dispersal and gene flow in the transoceanic squat lobster Munida gregaria (Decapoda: Munididae) across the East Pacific Barrier 6.1 Abstract The Eastern Pacific Barrier (EPB) has been recognized the world´s most potent biogeographic
barriers to dispersal and gene flow from various taxa in the tropics. By contrast, in the higher
southern latitude (35 -55 S) where stretches of open water are even broader without stopover
islands to dispersal, there is a dearth of studies that describe whether the EPB is a strict barrier
to gene flow. The widespread shallow-water squat lobster Munida gregaria is described the
only transpacific species in the family Munididae with disjunct distribution mainly off New
Zealand and Patagonia, yet cryptic speciation may present within this nominal species due to
separation by the EPB. Population genetic and phylogeographic analyses were performed using
mitochondrial COI as well as multiple independent microsatellites in a range-wide sampling
scope. Genetic structure was shown across the Pacific between New Zealand (NZ) and South
America (SA), but this differentiation was only the reflection of intraspecific polymorphism
due to many shared alleles between populations. Testing in a Bayesian framework consistently
confirmed eastward gene flow at different timescales by COI and microsatellites. Incorporating
a substitution rate of 2 % per Myr for COI sequences in Crustacea, divergence between NZ and
SA populations was estimated 0.254 Ma, which was much younger than the installation of the
EPB (ca. 65 Ma). My study proved that M. gregaria is a truly transpacific species, i.e., the EPB
is not a strict marine barrier to dispersal and gene flow.
Keywords: East Pacific Barrier, microsatellite, dispersal, gene flow, Munida
6.2 Introduction The advent of molecular techniques and improved accessibility and sampling of realtively
untouched regions such as the deep sea and the Antarctic have refreshed our knowledge of
global species diversity and endemism which were previously underestimated (Brandt et al.
2007; Griffiths 2010; Gutt et al. 2004). Even though there is still a great deal of uncertainty
and controversy about how new species arise, the influential concept of allopatric speciation
still plays a dominant role in explaining the remarkable biodiversity. The initial step of that one
continuous gene pool underwent allopatric speciation and eventually split into two genetically
isolated subsets is geographic separation due to emergence of physical barriers, such as
mountain formation, island formation, or glaciations. For marine shallow water species, the
stretches of open deep water provides as formidable barriers to dispersal.

Publication III (Manuscript)
52
The East Pacific Barrier (EPB) is an extensive, uninterrupted 4 000-7 000 km stretch of deep
water that draws a division line between the biogeographic provinces of the eastern Pacific and
the central-western Pacific (sensu Briggs 1974). As early as more than one hundred years ago,
this broad space of open ocean extends without any island as transition has already been
recognized its zoogeographic importance and remarked as ‘impassable’ in Darwin (1872).
Later Ekman (1953) emphasized that the EPB was the world’s most potent marine
biogeographic barrier. The effectiveness of the EPB has been well documented through
molecular studies in corals (Baums et al. 2012), sea urchins (McCartney et al. 2000),
calyptraeid gastropods (Collin 2003), spiny lobster (Chow et al. 2011) and reef fishes (Craig
et al. 2007; Fitzpatrick et al. 2011). This barrier started to come in effect about 65 Ma (Rosen
& Smith 1988), and if a previously widespread population was separated by this barrier and
subsequently became vicariant, deep genetic divergence between separated populations should
be evident. Even though a few examples of fish and invertebrate lineages have been
demonstrated to cross the barrier (Lessios et al. 2003; Lessios & Robertson 2006), it still
remains largely unknown whether the EPB is a strict barrier that interrupts gene flow, thus is
responsible for the consequence of allopatric speciation for the pronounced genetic break
between the two sides of the barrier. Moreover, current case studies have exclusively centered
on circumtropical area, while in the higher latitude of southern Pacific where the distance of
open deep water is even broader without intermediate shallow water habitats and
oceanographic regimes are different, it remains poorly studied in comparison.
The squat lobster Munida gregaria (Decapoda: Munididae) is a nearshore benthic species with
amphi-Pacific distribution off southeastern New Zealand and Chilean Patagonia between 41°
S and 55° S, as well as in the Atlantic shelf off Patagonia (Boschi et al. 1992; Zeldis 1985).
Some unique characters of this squat lobster are thought to be related to its extensive area of
distribution. It is one of the few species that have a post-larval pelagic phase in the life cycles
within the highly diversified and speciose family Munididae, and this pelagic larval phase can
last about four months (Tapella et al. 2002b). The larval strategies and potential dispersal
capability of pelagic juvenile make it the only transpacific species out of its family (Baba et al.
2008; Tapella 2002). This species is also featuring sympatric phenotypes that display sharp
morphological, ecological and behavioral divergence. Using multiple, unlinked mitochondrial
and nuclear molecular markers and sampling almost the entire species’ range in South America,
Wang et al. (unpublished) confirmed that despite its distinct morphological and ecological
characteristics, M. subrugosa Dana, 1852 is a junior synonym of M. gregaria. Even though its

Publication III (Manuscript)
53
high dispersal potential was highly impressive due to the absence of an isolation-by-distance
pattern in South America, the > 7 000-km stretches of deep sea between New Zealand and
southern Chile most likely represent a significant barrier to dispersal for this shallow water
species.
Fig. 6.1 Map of the study area including sampling locations (red dots), the northern boundary (i.e., Subtropical Convergence) of the Antarctica Circumpolar Current (ACC) (dashed lines), and the flowing direction of the ACC (black arrows). NZ, New Zealand; NCP, Northern Chilean Patagonia; CCP, Central Chilean Patagonia; BC, Beagle Channel; SM, Strait of Magellan; FM, Falklands/Malvinas; MdP, Mar del Plata.
In this study I added the New Zealand component of the global species’ range to assess the
genetic connectivity of M. gregaria among its highly disjunct distribution using mitochondrial
COI and nuclear microsatellites specific to M. gregaria (Wang & Held 2015) as two different
molecular marker systems (see discussion in Held & Leese 2007). The utility of different types
of markers enabled rigorous analyses in determining genetic structure, directionality of gene
flow and constructing multiple time-scaled evolutionary history. Ultimately I would like to
answer 1) if the EPB is effective to impede gene flow for M. gregaria populations, i.e., if M.
gregaria is indeed a single interbreeding species maintaining its integrity across the major
barrier, or long isolated relicts of vicariance; 2) was dispersal evident across the biogeographic
barrier and how was dispersal, if any, influenced by geological or oceanographic events and 3)
if residences on both sides of the EPB belong to the same species, what is the pattern of
historical and contemporary gene flow?

Publication III (Manuscript)
54
Table 6.1 Sampling sites and number of specimens used with mitochondrial marker (NmtDNA) and microsatellite markers (NMSAT). FM, Falklands/Malvinas; NCP, Northern Chilean Patagonia; CCP, Central Chilean Patagonia; SM, Strait of Magellan; BC, Beagle Channel; MdP, Mar del Plata; NZ, New Zealand.
Region Station Latitude Longitude NmtDNA NMSAT Region Station Latitude Longitude NmtDNA NMSAT
FM
12OT12 -52.110 -59.595 3 16
NCP
Punta Metri -41.595 -72.712 4 7
13OT13 -52.285 -59.546 4 12 Huinay -42.354 -72.463 16 16
15OT18 -52.391 -59.131 2 16 Isla Dring -46.442 -73.957 7 7
16OT19 -52.354 -58.592 2 16 Punta Añihue -43.793 -72.925 4 16
17OT20 -52.359 -58.889 2 16* Islas Pajaros -43.783 -72.997 5 5
21OT16 -52.408 -59.976 2 16* CCP
Isla Lopez-mine
-50.361 -75.332 4 7
12OT15 -52.189 -59.975 1 1 Isla Solaris -51.330 -74.311 12 12
SM
Punta Dungenes -52.436 -68.568 1 1
BC
Bahia Nassau -55.383 -69.450 1 1
Bahia Gregorio -52.685 -70.142 5 10 Pt.
Engaño -54.929 -70.709 2 2
Seno Otway -52.918 -71.347 4 13 Bahia Virginia -54.911 -67.726 8 12
Silva Palma -53.347 -71.800 2 7 Isla Picton -55.174 -66.721 0 2
Bahia Inutil -53.556 -69.695 2 5 Isla Lennox -55.393 -66.679 2 2
NZ
North Canterbury -43.03 173.55 33 32 MdP CCDB
2374 -38.003 -57.469 1 0
Otago Shelf -45.90 170.97 17 19 Total of SA 96 218
Haypaddock -45.34 171.27 26 27 Total of NZ 76 78
Grand total 172 296
* refers to one specimen with missing genotype at a certain microsatellite locus
6.3 Materials and Methods Sampling and DNA extraction
A total number of 297 Munida gregaria adults or juveniles were collected from 28 locations
that were grouped into six geographic regions. This sampling scope represents almost the entire
global range of this species. Samples were mainly obtained via trawling from 0m - 179m (Table
6.1, Fig. 6.1). Total genomic DNA was extracted from ethanol-preserved abdomen or cheliped

Publication III (Manuscript)
55
muscle tissue using QIAamp DNA Mini Kit (QIAGEN, Germany) following the
manufacturer’s instructions.
Mitochondrial DNA amplification and sequencing
The cytochrome c oxidase subunit I (COI) gene was amplified using the universal primers
HCO2198 and LCO1490 (Folmer et al. 1994) for 172 individuals from all the six geographic
regions. The 10 μl reactions consisted of 0.02 U/μl Hotmaster Taq (5 Prime, Germany), 0.2
mM dNTPs, 0.5 μM of forward and reverse primers, 1 x PCR-buffer and 1 μl (about 30 ng) of
template DNA. PCR was conducted using an initial denaturation at 94 °C for 2 minutes,
followed by 36 cycles of 94 °C for 20 seconds, annealing at 47 °C for 20 seconds, 65 °C for 1
minute, and a final extension at 65°C for 10 minutes. Size and quality of amplified products
were checked on a 2 % agarose gel, then 5 μl product was subsequently purified using 0.25 μl
Exo I and 1 μl FastAP enzymes (Thermo Scientific). Cycle sequencing using 1 μM HCO
primers was conducted in 10 μl reaction volumes using 1 μl of the purified template DNA and
the BigDye Termiator Kit 3.1 (Applied Biosystems) according to the recommendations.
Reactions were purified using the Qiagen DyEx Kit (QIAGEN, Germany). Sequencing was
conducted on an ABI 3130xl sequencer. Sequences were aligned using CODONCODE
ALIGNER 4.2.7 (CodonCode Corp.) and checked for ambiguities by eye.
Microsatellite genotyping
In total, 296 individuals (without the single individual from Mar del Plata) were screened for
genetic variation at nine loci (microsatellite markers Mgr4, Mgr8, Mgr 46, Mgr 52, Mgr60,
Mgr 62, Mgr81, Mgr90, Mgr120), which were originally designed for M. gregaria (Wang &
Held 2015). PCR amplification was achieved in two steps. A 10 μl reaction volume containing
30 ng DNA, 0.3 U HotMasterTM Taq (5 PRIME), 2 nmol dNTPs, 1 μl HotMasterTM Taq Buffer,
1 pmol M13-tailed forward primer and 1 pmol reverse primer were used in the first-step PCR,
one microliter product of which together with 2 pmol universal M13 primer labeled with
fluorescent dye FAM or Hex and 2 pmol reverse primer were used in the second-step PCR.
Fragment lengths were analyzed with ROX GS500 size standard (Applied Biosystems) on an
ABI 3130 x 1 sequencer, and scored with GENEMAPPER 4.0 (Applied Biosystems).
Genetic polymorphism
Mitochondrial DNA Polymorphism was examined as haplotype diversity (HD) and nucleotide
diversity (π) for each sampling region , the combined group South America and total samples
Publication III (Manuscript)
56
using DnaSP 5.10.1 (Librado & Rozas 2009). A statistical parsimony network was constructed
with TCS 1.21 (Clement et al. 2000) using default settings. The substitution model that best
fits the data was determined using jModelTest 2.1.5 (Darriba et al. 2012; Guindon & Gascuel
2003).
For the microsatellite loci, deviations from Hardy-Weinberg equilibrium (HWE) for each
geographic region at each locus and Linkage disequilibrium between each pair of loci were
tested with 5 x 10⁷ Markov chain iterations respectively using GENEPOP 4.2 (Raymond &
Rousset 1995). Bonferroni correction was applied for multiple comparisons (Rice 1989). The
program ANIMALFARM 1.0 (Landry et al. 2002) was used to test for loci with significantly
disproportionate variances that may bias allele-size based distance estimates such as Slatkin's
RST estimates (Slatkin 1995). Sample statistics including the number of alleles observed per
locus (NA), expected Heterozygosity (HE) and expected Heterozygosity (HO) was calculated in
ARLEQUIN 3.5. Standardized allelic richness (Ar) (measured as the mean number of alleles
per locus independent of sample size) in FSTAT 2.9.3.2 (Goudet 2001) using the rarefaction
approach (Hurlbert 1971; Petit et al. 1998).
The statistical power of the COI and microsatellite data sets was assessed using POWSIM 4.1
(Ryman & Palm 2006). This software simulates a random distribution of the marker alleles
over subpopulations at various levels of expected divergence, which is determined by
combinations of Ne (effective population size) and t (generations since divergence). It also
allows to calculate α error (type I error), which is the probability of rejecting the null hypothesis
of genetic homogeneity although it was true by drawing the alleles directly from the base
population (t = 0). Simulations were run on a global level including all populations, and
between pooled South America (SA) and New Zealand (NZ) populations. For every simulation,
1 000 replicates were run using both Chi-square (χ2) and Fisher's exact test analysis, the number
of dememorizations, batches, and iterations per batch were set to 104, 103, 104, respectively.
Population structure
Levels of genetic divergence among geographic regions were calculated as pairwise ΦST
(Excoffier et al. 1992) for COI and FST (Wright 1965) for microsatellites using ARLEQUIN
3.5 (Excoffier & Lischer 2010). According to the best substitution model suggested by
jModelTest, a more inclusive Tamura-Nei (TN, Tamura & Nei 1993) model with the same ti/tv
rate was used. The interpretation of the FST or FST-analogues (e.g., GST (Nei 1987), θ (Weir &
Cockerham 1984), RST (Slatkin 1995)) values from highly polymorphic genetic markers, such

Publication III (Manuscript)
57
as microsatellites is problematic because their maximum values are inversely proportional to
the within-population heterozygosity and even in the absence of any shared allele often fail to
reach the theoretical maximum of 1 (Hedrick 1999, 2005; Whitlock & McCauley 1999).
Following Hedrick (2005), I, therefore, standardized FST values by applying the sampling bias
correction using RECODEDATA (Meirmans 2006), the output of which was used to calculate
FST(max) in ARLEQUIN 3.5. The corrected pairwise FST’ was subsequently calculated by
dividing FST by FST(max). Significance of the derived pairwise differences was assessed using
104 permutations.
The hierarchical genetic structure of both data sets was described using the analysis of
molecular variance (AMOVA) implemented in GENALEX 6.5 (Peakall & Smouse 2012).
Genetic variation was partitioned into among-group, within-group and within-population
components. The same standardization procedure of FST values was applied for microsatellites.
Significance of results for both data sets were assessed with 104 permutations.
The Bayesian clustering method implemented in STRUCTURE 2.3.4 (Falush et al. 2007;
Pritchard et al. 2000) was used to infer M. gregaria global population structure. STRUCTURE
was first run without any a priori population/location information using 1) uncorrelated allele
frequencies option and non-admixture model, that is, under the assumption that there is no gene
flow between populations; 2) correlated allele frequencies option and admixture model,
acknowledging that the grouping applied here is only roughly based on their geography. The
analyses were conducted with a burn-in length of 5 x 10⁴ replications followed by 2 x 10⁵
MCMC replications. For each value of K (from one to the number of geographic groups plus
two in the present study) that was assessed, 20 independent runs were conducted for each model.
The results were uploaded onto STRUCTURE HARVESTER (Earl & von Holdt 2012), best K
was determined using the ad hoc statistic ΔK, based on the rate of change in the log probability
of the data between successive K values (Evanno et al. 2005). Results from 20 replicates of the
most likely K were averaged using the software CLUMPP 1.1.2 (Jakobsson & Rosenberg 2007)
and the output was visualized using DISTRUCT 1.1 (Rosenberg 2004). I further used prior
population information derived from the classification of aforementioned analyses to detect
potential immigrants using the USEPOPINFO option, which assumes that most individuals
classified as belonging to one group have pure ancestry from that group, while a small
percentage of individuals may be immigrants to their supposed group, or have recent immigrant
ancestors (Pritchard et al. 2000). The MIGRPRIOR option was run at three different values of
Publication III (Manuscript)
58
immigration rates (0.01, 0.05 and 0.10) to assess the robustness of the assignment as suggested
by Pritchard et al. (2000).
Demographic history and divergence time estimation
Considering the realized genetic populations (New Zealand (NZ) and South America (SA), see
“Results”), a two-population scenario was adopted in the following analyses of ancestral
reconstruction, demographic history and gene flow.
Signatures of population demographic changes were first examined by Tajima’s D (Tajima
1989), Fu’s Fs (Fu 1997) and R2 statistics (Ramos-Onsins & Rozas 2002) using DnaSP 5.10.1.
The latter two statistics are considered most powerful for detecting expansions on
nonrecombining genomic regions (Ramírez-Soriano et al. 2008). Significant deviations from
neutrality of these tests might be evident for historical population expansion or bottleneck.
Statistical significance of these tests was based on 1 000 coalescent simulations in DnaSP.
Second, the distribution of the frequencies of nucleotide pairs between individuals were
compared with the expected distribution of a model of population expansion as implemented
in ARLEQUIN 3.5. Populations that have been stable over time are expected to have a bimodal
or multimodal mismatch distribution, whereas a unimodal distribution is typical in populations
having undergone demographic expansion (Rogers & Harpending 1992).
BOTTLENECK 1.2.02 (Cornuet & Luikart 1996) was used for microsatellites to determine if
data suggested the occurrence of severe past population contraction in both genetic groups.
I used the Bayesian analysis to date the tree with the mitochondrial sequences in BEAST 2.1.3
(Bouckaert et al. 2014; Drummond & Rambaut 2007). A relaxed lognormal model of lineage
variation and a coalescent prior with constant size were assumed. Without fossil calibration, I
implemented the general substitution rates of 2 % per Myr for COI sequences in Crustacea
(Schubart et al. 1998; Wares & Cunningham 2001), while a rate as high as 7 % was set as the
upper limit of the prior distribution to include the highest clock rate of 6.6 % reported by
Crandall et al. (2012). The best-fit model was selected using jModelTest 2.1.5. Two
independent runs with 108 MCMC generations and a sampling interval of every 104 generations
for each run were performed. The total sampled 2 x 10⁴ trees were combined in
LOGCOMBINER 1.7.4 (http://beast.bio.ed.ac.uk/LogCombiner) with 10 % discarded as burn-
in. Convergence of the stationary distribution was checked by monitoring the effective sample
sizes of each parameter (>200) in TRACER 1.6 (Drummond & Rambaut 2007). A consensus
Publication III (Manuscript)
59
tree with the maximum clade credibility was summarized using TREEANOTATOR 1.6.1
(Drummond & Rambaut 2007) with the PP limit set to 0 and summarizing mean node heights.
Visualization and polishing of the consensus tree was performed using FIGTREE 1.4.2
(http://tree.bio.ed.ac.uk/software/figtree/).
Migration and gene flow
Using the coalescent-based Bayesian framework in MIGRATE-N 3.6.1 (Beerli & Felsenstein
2001), I investigated gene flow between the recognized two genetic populations, NZ and SA.
Three models were hypothesized, i.e., oppositely two unidirectional and one bidirectional gene
flow. Analyses were conducted based on both mtDNA and microsatellite data sets. In order to
avoid bias in gene flow directionality caused by unequal sample sizes, sub sets of SA were
randomly chosen to match the size of NZ (for mtDNA, n=76; for microsatellites, n=78).
Preliminary runs based on the more complex model (bidirectional migration) were used to
determine optimal parameter settings and run lengths. For the final analyses, employing 16
static chains of default temperatures, five independent runs of 105 recorded steps sampled every
102 steps, with a burn-in length of 5 x 10³ steps were performed. Parameter ranges for uniform
priors were empirically set to θ [0, 0.1], M [0, 5 000] for mtDNA and θ [0, 1 000], M
[0, 1 000] for microsatellites. The Brownian motion model and sequence model were employed
for microsatellites and mtDNA, respectively. Parameter starting values were based on FST
estimates. In order to determine the optimal gene flow directionality model, the Bezier
corrected marginal likelihood was used to calculate log Bayes Factors and model probabilities
(Beerli & Palczewski 2010). Log Bayes Factor differences of > 10 units provide very strong
support for one model over another (Kass & Raftery 1995). For the most probable gene flow,
I estimated theta (θ = 4Neμ for microsatellites or θ = Neμ for mtDNA, where Ne is the long-
term effective population size and μ is the mutation rate per generation) and historical gene
flow M (M = m/μ, where m is the immigration rate per generation). The number of migrants
per generation was calculated as Nem= θM/4 for microsatellites or Nem= θM for mtDNA.
Contemporary rates of migration were investigated through several analyses. A Bayesian
approach implemented in BAYESASS 3.0.3 (Wilson & Rannala 2003) was first performed to
estimate migration rates and directions of dispersal that occurred in the past one to three
generations. This software relaxes several assumptions (e.g. HWE) of other methods of gene
flow estimation thus provides more robust results. Recent immigrants were identified as
individuals that display genotypic disequilibrium relative to the population from where they

Publication III (Manuscript)
60
were sampled. The analyses were performed with 107 iterations and a sampling frequency of
100 and 106 iterations were discarded as burn-in. Delta values were adjusted to ensure that
proposed changes between chains were between 40 % and 60 % of the total number of iterations
(Wilson & Rannala 2003). Convergence was examined by comparison of 4 runs with different
random starting seeds, as well as monitoring the trace files for the log-probability in TRACER
1.6. Detection of first-generation migrants using resampling algorithm of Paetkau et al. (2004)
were performed using GeneClass2 (Piry et al. 2004). I computed a likelihood ratio test
comparing the population where the individual was sampled over the highest likelihood value
among all available populations (L=L_home/L_max) with default critical probability level of
0.01.
Fig. 6.2 Statistical parsimony network of COI haplotypes. Each branch represents one substitution; small filled circles represent hypothetical, unsampled haplotypes. Radii reflect number of individuals that share a particular haplotype.
6.4 Results Genetic polymorphism
Alignment of the COI sequences from 172 individuals yielded a consensus sequence of 618 bp
(GenBank accession numbers: KJ544251 - KJ544346 and KU728379 - KU728454). These
sequences were collapsed into 40 different haplotypes, determined by 36 variable (segregating)
sites, of which 16 were parsimony-informative. Haplotype diversity (HD) and nucleotide

Publication III (Manuscript)
61
diversity (π) are reported in Table 6.2 for each sampling area, as well as summarized as NZ and
SA. The resulting haplotype genealogy (Fig 6.2) was in star-like shape. The most common
haplotype (found in 103 individuals) is present in all areas, and the remaining haplotypes
differed from the most common one in one or a few mutational steps (Fig 6.2). Mean sequence
divergence within NZ or SA is 0.144 and 0.166%, respectively and between them is 0.162%.
The maximum sequence divergence between NZ and SA is 0.971%.
Table 6.2 Genetic diversity of COI sequences per population and region. HD, haplotype diversity; π, nucleotide diversity.
Sequences Haplotypes Private haplotypes HD π
FM 16 5 3 0.450 0.00121
BC 13 6 4 0.641 0.00224
SM 14 7 3 0.731 0.00195
CCP 17 8 5 0.669 0.00207
NCP 36 12 7 0.587 0.00124
SA 96 29 25 0.601 0.00164
NZ 76 15 12 0.650 0.00145
Total 172 40 0.634 0.00160
For the microsatellite data, there were 7 to 39 alleles per locus across all populations, the overall
allelic richness ranged from 4.251 to 17.39 independent of sample size. The observed (HO) and
expected heterozygosity (HE) ranged from 0.053 to 0.895 and 0.053 to 0.915, respectively
(Table S6.1, Additional files). There was no evidence of linkage disequilibrium after adjusting
the significance level for multiple comparisons (P < 0.05). Three locus-population
combinations showed significant deviation from the Hardy-Weinberg expectation after
Bonferroni correction (Table S6.1, Additional files) at locus mgr90. But since excluding Mgr90
had only minor effect on the results, it was kept in this study. Test of disproportionate variances
among loci confirmed that none of the loci contributed disproportionally to distance-based
differentiation estimates after Bonferroni or Sidak adjustment of the significance level.
Power test showed that the mtDNA data set had the probability of 94.5 % for the χ2 test and
86.7 % for Fisher's exact test to detect a global population structure with a true FST value of
0.01. With pooled SA and NZ populations, this degree of divergence would be detected with
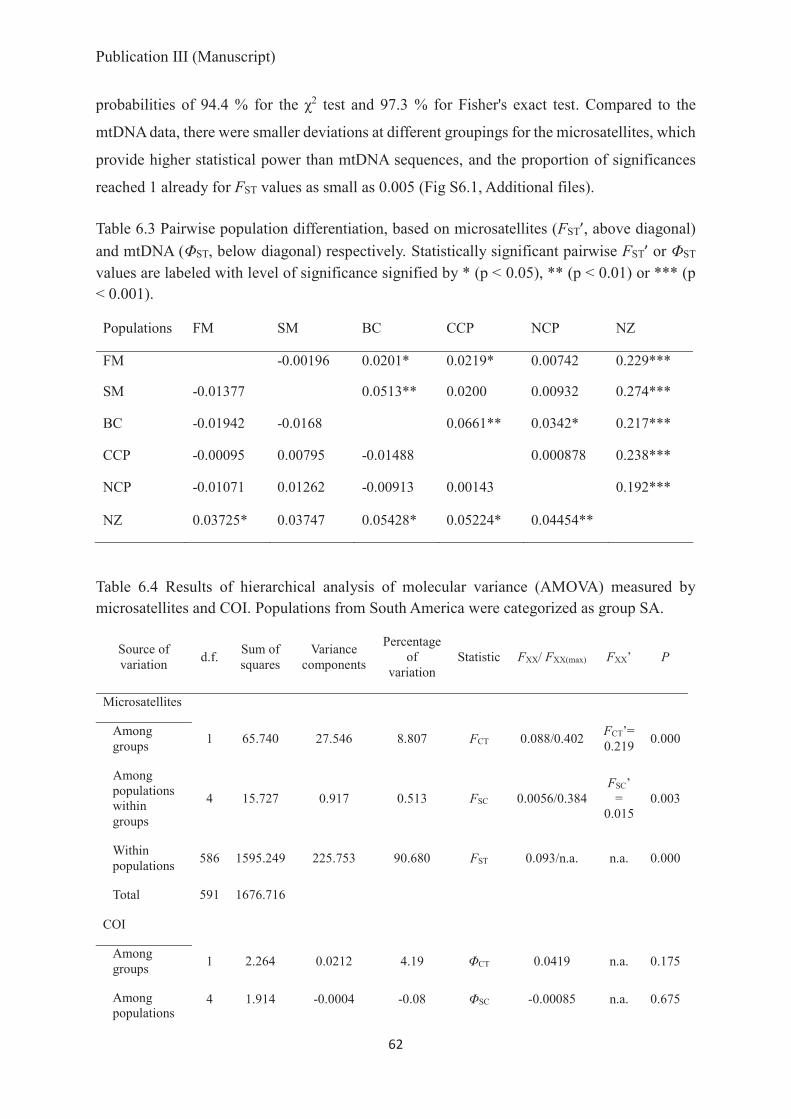
Publication III (Manuscript)
62
probabilities of 94.4 % for the χ2 test and 97.3 % for Fisher's exact test. Compared to the
mtDNA data, there were smaller deviations at different groupings for the microsatellites, which
provide higher statistical power than mtDNA sequences, and the proportion of significances
reached 1 already for FST values as small as 0.005 (Fig S6.1, Additional files).
Table 6.3 Pairwise population differentiation, based on microsatellites (FST’, above diagonal) and mtDNA (ΦST, below diagonal) respectively. Statistically significant pairwise FST’ or ΦST values are labeled with level of significance signified by * (p < 0.05), ** (p < 0.01) or *** (p < 0.001).
Populations FM SM BC CCP NCP NZ
FM -0.00196 0.0201* 0.0219* 0.00742 0.229***
SM -0.01377 0.0513** 0.0200 0.00932 0.274***
BC -0.01942 -0.0168 0.0661** 0.0342* 0.217***
CCP -0.00095 0.00795 -0.01488 0.000878 0.238***
NCP -0.01071 0.01262 -0.00913 0.00143 0.192***
NZ 0.03725* 0.03747 0.05428* 0.05224* 0.04454**
Table 6.4 Results of hierarchical analysis of molecular variance (AMOVA) measured by microsatellites and COI. Populations from South America were categorized as group SA.
Source of variation d.f. Sum of
squares Variance
components
Percentage of
variation Statistic FXX/ FXX(max) FXX’ P
Microsatellites
Among groups 1 65.740 27.546 8.807 FCT 0.088/0.402 FCT’=
0.219 0.000
Among populations within groups
4 15.727 0.917 0.513 FSC 0.0056/0.384 FSC’
= 0.015
0.003
Within populations 586 1595.249 225.753 90.680 FST 0.093/n.a. n.a. 0.000
Total 591 1676.716
COI
Among groups 1 2.264 0.0212 4.19 ΦCT 0.0419 n.a. 0.175
Among populations
4 1.914 -0.0004 -0.08 ΦSC -0.00085 n.a. 0.675

Publication III (Manuscript)
63
within groups
Within populations 166 80.675 0.4860 95.89 ΦST 0.0411 n.a. 0.001
Total 171 84.853 0.5068 100
Genetic population structure
The genetic population differentiations estimated with ΦST for mtDNA and FST’ for
microsatellites were congruent. Both data sets showed significant pairwise population
differentiation with the highest degree of divergence for the NZ population. Especially for
microsatellites, FST’ values between NZ and any population in SA were at least one order of
magnitude larger than values among SA populations and highly significant (P < 0.001; Table
6.3). Also, the microsatellite data revealed substructure between regions of Pacific coasts and
regions of Atlantic coasts. Significantly greater FST’ values were found for both Northern and
Central Chilean Patagonia (NCP and CCP) versus the Atlantic groups (SM and BC) than that
between Chilean groups (NCP vs. CCP). Results of hierarchical AMOVA based on both data
sets indicate most variation is distributed within populations (Table 6.4), whereas small
proportions of variation (4.19 % for COI and 8.8 % for microsatellites) were distributed
between continents (SA vs. NZ) with the highest divergence (measured as FCT’/ΦCT values).
The genetic classification indicated by the above findings was corroborated by the Bayesian
clustering method implemented in STRUCTURE. Log-likelihood values were calculated for
the existence of 1≤ K ≤ 8 clusters for the microsatellite data set. Under both schemes assuming
no-admixture and admixture, the scenario of two clusters was consistently suggested for the
highest ΔK values and L(K). One is NZ and the other is a cluster comprising all the sampled
groups from SA (Fig 6.3). Noticeably, both clusters contained specimens with shared genotype
proportions, where these from SA seemed to incorporate more sharing from NZ (Fig 6.3).
Demographic history and divergence time estimation
Neutrality tests for the mitochondrial data revealed significant negative values for Tajima’s D
and Fu’s Fs, and significant positive R2 values for both identified SA and NZ genetic
populations, which congruently suggest a possible past expansion for both populations (Table
6.5). According to mismatch distributions analysis, the hypothesis of population expansion

Publication III (Manuscript)
64
could not be rejected for SA (SSD = 0.0002, P = 0.915, Table 6.5), whereas small but significant
SSD and raggedness index values were observed for NZ (Fig. S6.2, Additional files). The
Bottleneck analysis of the microsatellite data revealed nonsignificant P values for Wilcoxon
tests of heterozygosity excess (indicative of a recent founder event) under both mutation
models, thus suggesting no recent significant reductions in effective population size for either
NZ or SA population (Table S6.2, Additional files).
Fig. 6.3 Results of cluster analyses performed with STRUCTURE (non-admixture model, allele frequencies uncorrelated) with the highest ΔK value as well as log likelihood probability L(K). The graphs display the consensus membership coefficients matrices (Q-matrices) for 296 individuals from six populations of Munida gregaria using nine microsatellite loci. The genotype of each individual is represented by a single bar, where the proportion of the colour refers to the probability of assignment to a certain cluster. Potential immigrants were labeled with asterisk (USEPOPINFO option, MIGRPRIOR = 0.1).
Different selection criteria (Akaike and Bayesian information criterion) identified the same
best-fit substitution model, i.e., HKY+I model (Hasegawa et al. 1985) for my COI data.
Bayesian inference of phylogenetic relationships using this substitution model suggested a
huge monophyletic clade of all haplotypes occurring exclusively from NZ. The four haplotypes
shared by SA and NZ also formed a monophyletic clade that was nested in the group of SA
haplotypes (Fig. 6.4). The low Bayesian posterior probabilities of most nodes is expected when
referring to the very structure of haplotype network, resulting from the low sequence variability.
The divergence time between NZ and SA lineages was estimated to be 0.254 (95 %HPD: 0.171
- 0.481) Ma, which corresponded to the late Pleistocene glaciations but much younger than the
date when the EPB came into effect (ca. 65 Ma) (Fig. 6.4).
Table 6.5 Neutrality tests on COI data. Parameters of time since the population expansion (Tau), sum of square deviations (SSD) for test of the validity of the sudden expansion model as well as Harpending’s Raggedness index (Raggedness) for the test of goodness-of-fit are shown. Significance level: * P<0.05, ** P<0.01, *** P<0.001.
Population Tajima’s D Fu’s Fs R2 Τau (95%CI) SSD (PSSD) Raggedness (Pr) SA -2.492** -40.543*** 0.0202*** 1.035 (0-3.918) 0.0002 (0.915) 0.038 (0.780) NZ -2.037* -12.948*** 0.0349* 1 (0.719-1.801) 0.009 (0.034*) 0.116 (0.009**) Total - 2.523*** -63.866*** 0.0144**

Publication III (Manuscript)
65
Fig. 6.4 Bayesian phylogenetic tree based on 172 COI sequences. Colors indicate the distributions of haplotypes in relation to SA (light green), NZ (violet) or share of both (magenta). Each node was labeled with posterior support value and bar of 95 % HPD node heights.
Migration and gene flow
Patterns of historical gene flow estimated by Migrate-N employing the mitochondrial and
microsatellite data were congruent in favoring the eastward unidirectional gene flow model,
i.e., gene flow from NZ to SA (Table 6.6). The log Bayesian Factor difference for
microsatellites was more than three orders of magnitude comparing to the other two gene flow
models, thus resulting an absolute favor of the eastward gene flow model (probability = 1;

Publication III (Manuscript)
66
Table 6.6), while the mitochondrial data also suggest a probability of 0.897 for the eastward
gene flow model. The estimated value of θ consistently suggested higher value of NZ than that
of SA by both data. For microsatellites θNZ was about two folds of θSA, although both of them
had wide and overlapped 95% confidence intervals. For mtDNA, both the peak and 95% CI
values of θNZ was about an order larger than those of θSA (Table 6.7). The mutation-scaled
migration rate (M) had the values much greater than one suggested by both data, indicating that
migration (and not mutation) was the main factor contributing genetic connectivity and
variation between these two populations (Prospero et al. 2009). The effective number of
immigrants per generation Nem (=θM/4) moving from NZ to SA was 15.944 (95% CI: 0-41.173)
for microsatellites and 13.288 (95% CI: 8.183-20.4) (Table 6.6).
Table 6.6 Bayes factors and log marginal likelihoods of different models for microsatellites and COI.
Microsatellites Mitochondrial COI
Model SA↔ NZ SA ← NZ SA→ NZ SA ↔ NZ SA ← NZ SA → NZ
Bezier ImL -22948.13 -5135.37 -13859.51 -1389.28 -1387.12 -1400.50
LBF(Bezier) -35625.52 0 -17448.28 -4.32 0 --26.76
Model probability 0 1 0 0.103 0.897 0
Multiple runs of Bayesass yielded low levels of contemporary gene flow (measured as fraction
of individuals that are immigrants) between the two regions. Although the migration rate of SA
into NZ (0.0092) was slightly higher than that of NZ into SA (0.0076), they both are minor and
overlapped broadly with one another at the 95% CI (Fig. 6.5).
Table 6.7 Estimates of mutation-scaled effective population size (θ), mutation-scaled migration rate (MNZ SA) and effective number of immigrants per generation (Nem = θSAMNZ SA/4 for microsatellites or Nem = θSAMNZ SA for mtDNA) from New Zealand (NZ) to South America (SA) based on Bayesian analysis in MIGRATE-N. Data are modes with the lower 2.5 and upper 97.5 percentiles in parentheses.
Data θSA θNZ MNZ SA Nem
mtDNA 0.0075 (0.0044-0.0103) 0.0704 (0.0392-0.0925) 1771.67 (1091.13-2720) 13.288 (8.183-20.4)
Msats 5.799 (0-25.732) 13.734 (0-28.4) 10.998(0-28.4) 15.944 (0-41.173)
Migrant detection performed with three different methods (Structure, GeneClass and Bayesass)
all suggested potential immigrants from NZ to SA, but no immigrants from SA to NZ. One
individual, NCP40, was suggested as immigrant by all these three methods (Table 6.8).
Individual NCP12 was detected by Structure and Bayesass, while NCP 17 was suggested by

Publication III (Manuscript)
67
GeneClass and Bayesass (Structure also showed that this individual had a proportion of 35.4%
admixture from NZ) (Fig. 6.3 and Table 6.8). Interestingly, all these three potential immigrants
are from the Pacific coast of Patagonia, implying a migration route from NZ to Chile.
Fig. 6.5 Recent migration rates (mBA) between SA and NZ using BayesAss. The numbers within the circles denote the proportion of non-immigrants within populations.
Table 6.8 Migrant detection performed using STRUCTURE, GENECLASS and Bayesass
Geographical origin
GeneClass F0 migrants (P-value)
Bayesass nonmigrant/1st/2nd Gen migrant
Structure q value
SA NCP12 (0.012) 0.492/0.499/0.009 0.345/0.655 SA NCP17 (0.0092) 0.891/0.062/0.046 0.646/0.354 SA NCP40 (0.0018) 0.154/0.814/0.033 0.055/0.945
6.5 Discussion A truly single species across the Pacific
Based on sampling of the global distribution of M. gregaria using mtDNA and multi-locus
nuclear microsatellite markers, my results demonstrate this squat lobster species is a truly
single species with high mobility frequently cross the EPB. The maximum uncorrected
pairwise sequence distances between the different M. gregaria COI haplotypes were 0.971%,
which is much smaller than the upper limit expected for a single interbreeding species (3%
sequence divergence threshold typically used in the barcoding studies; Song et al. 2008). This
was further supported by the shared haplotypes between NZ and SA, as well as the star-like
shape of maximum parsimony network, which was beyond the 95% parsimony connection
limit as a rule of thumb to delimit species (Hart & Sunday 2007). Having higher evolutionary
rates relative to coding genes as well as a fourfold greater effective population size compared
to mitochondrial genes that enables them less susceptible to random genetic drift, the
microsatellites are expected to exhibit more recent genetic differentiation which is not
contradicting the mitochondrial data but instead complementing them. In contrast to COI, the
genetic structure revealed by microsatellites are more evident as shown in pairwise population
comparison as well as the STRUCTURE result. Yet allele sharing are present among all loci

Publication III (Manuscript)
68
between SA and NZ, which is reflected as the ubiquitous admixture in STRUCTURE even
under the model of non-admixture. Thus the level of genetic differentiation between NZ and
SA demonstrates intraspecific variance within an interbreeding species.
The revealed gene flow homogenizing distant populations across the seemingly
insurmountable EPB makes M. gregaria unique in view of none transoceanic relatives in the
remarkably diversified family Munididae (Baba et al. 2008). High levels of fauna affinities are
particularly clear on both sides of the EPB (Briggs 1974; Castilla & Guiñez 2000; Cowman &
Bellwood 2013; Glynn & Ault 2000; Macpherson et al. 2010). The traditional interpretation of
these affinities involves vicariance due to the effective separation by the EPB. In our study, the
divergence time between populations NZ and SA (ca. 0.25 Ma) is extremely young compared
to the installation of the EPB (ca. 65 Ma), after which further recurrent gene flow occurred
regularly to maintain species integrity. An alternative interpretation to the timing of divergence
might arise that the species had undergone vicariant speciation since the onset of the EPB, later
secondary contact enabled distant populations to hybridize. However, this is hardly true due to
no hint of historical secondary contact shown as the unimodal mismatch distribution. In the
end, my results highlight 1) the EPB may not always be a strict barrier to dispersal, it is
permeable in space and time; 2) the species studied is too young to have been affected by the
presumed vicariant barrier, suggesting a recent history of dispersal, rather than vicariance. My
estimated divergence time of populations NZ and SA is in line with the finding of recent (less
than 0.2 Ma) separations of eastern Pacific and central Pacific populations of 14 transpacific
shore fishes (Lessios & Robertson 2006). This congruence may imply that the recent
divergence between populations of transpacific species at both sides of the EPB is accompanied
with climatic and oceanographic oscillations during geological events of late Pleistocene.
Gene flow from NZ to SA
The mitochondrial COI and nuclear microsatellites applied in my study demonstrates a
powerful combination in recovering a more complete evolutionary history of a species. In
general, mtDNA evolves 5–10 times faster than single-copy nuclear DNA (scnDNA) (Jansen
2000), thus it is typically used to reconstruct a species’ demographic history at scales of tens
of thousands to millions of years (Avise 2004). By contrast, microsatellites are generally
considered fast-evolving and independent markers, they evolve 100–1 000 times faster than
scnDNA (Gilbert et al. 1990). Therefore they are expected to detect near-contemporary
demographic events at a scale as recent as tens to hundreds of generations (Nance et al. 2011;

Publication III (Manuscript)
69
Raeymaekers et al. 2005; Selkoe & Toonen 2006a). The results of MIGRATE-N employing
both mtDNA and microsatellites consistently suggest gene flow from west to east at different
time scales, which should be interpreted from NZ to SA in view of the ocean currents, life
history traits of this organism. The suggested eastward gene flow conforms to the direction of
the Antarctic Circumpolar Current (ACC), which extends its influence north to ca. 45 S known
as the Subantarctic Front (SAF). As the mightiest current system, it provides overwhelming
transportation of pelagic larvae. The lack of genetic differentiation at circum-subantarctic scale
of southern bull kelp Durvillaea antarctica well exemplified the homogenizing effect of the
ACC, whereas differentiation was contrarily shown at a smaller geographic scale along the
Chilean coast (Fraser et al. 2009). Interestingly, the separation between central Chilean lineage
and Patagonian lineage of D. antarctica conformed to the split of the ACC by South American
continent as the north-flowing Humboldt Current and south-flowing Cape Horn Current (Fraser
et al. 2010). Unexpected low genetic structure was evident even for Antarctic benthic
invertebrates, e.g. the brooding brittle Star Astrotoma agassizii (Hunter & Halanych 2008), the
Antarctic brooding isopod Septemserolis septemcarinata (Leese et al. 2010). All of these
immobile species displayed extensive genetic continuity across a large geographic range (>500
km) owing to the transport of the ACC.
Besides the aid of the ACC, the long pelagic larval duration (PLD) of M. gregaria is also taken
into account for the successive migration across the EPB within one generation. M. gregaria
has a unique pelagic post-larval stage out of its family that lasts about 90-120 days (Tapella et
al. 2002b). Even though adults settle benthic, they still perform migration through water
column (Tapella 2002; Zeldis 1985). Further swarming behavior of both juveniles and adults
may promote their dispersal in larger areas (Diez et al. 2012; Zeldis 1985). Although under
certain circumstances the pelagic larval duration (PLD) may not correlate well with geographic
range size (Bowen et al. 2006; Selkoe & Toonen 2011), it is still broadly considered to play a
key role in population connectivity (Cowen & Sponaugle 2009; Lester et al. 2007; Shanks
2009). Reckoning a 7900km-distance between NZ and SA (at 45°S) and a surface speed of 77
cm s-1 (2.8 km h-1) inside the jets of the ACC (Whitworth 1988), a voyage from NZ to SA lasted
about 117days, whereas the time travelling eastward from SA to NZ (ca. 18 000 km) would
need about 266 days. The maximum dispersal in a single generation only allows the short trip
on ecological time scale. The plausible interpretation of the eastward gene flow thus would be
from NZ to SA. Nevertheless, we cannot explicitly exclude the alternative that gene flow still
went eastward but from SA to NZ. Flexibility on evolutionary scale might enable change of

Publication III (Manuscript)
70
migration patterns according to ecological and biogeographic factors. Although contemporarily
M. gregaria does not occur in South Africa or around islands in the Southern Indian Ocean (E.
Macpherson, personal communication, November 24, 2014) to form a circum-subantarctic
distribution via stepping-stone dispersal, which might be due to incompatible oceanographical
conditions, but the possibility of historically broader distributions through oscillated climate
should not be neglected. During glaciation the cooled seawater temperature might shift the
species’ range to lower latitudes, such as southern South Africa. A paleobiogeography study
based on comprehensive fossil records of decapods from the Southern Hemisphere postulates
that the high southern latitudes was a site of origin of several generic-level taxa, which were
later found in lower latitude regions (Feldmann & Schweitzer 2006). Furthermore,
reconstruction of the ACC in the past 500 kyr suggest that flow speeds were faster during
glacial epochs and slower during warm stages (Mazaud et al. 2010). Therefore dispersal
duration from coast to coast might be shortened during cold periods. Given drastic difference
of climatic and oceanographic conditions in the past, migration encircling the globe via the
ACC might be historically possible.
Possible ancestor population
Although populations NZ and SA was estimated to have diverged about 0.25 Ma, current data
do not allow to articulate which is the ancestral population of M. gregaria. Yet patterns of
species richness at this temperate latitudes might be indicative. Following the common
Gondwanan vicariance and marine dispersal the Indo-West Pacific (IWP) has been proposed
to be the global center of both marine and terrestrial biodiversity (Hughes et al. 2002; Lohman
et al. 2011). Coastal species showed maximum diversity in the Western Pacific (Tittensor et al.
2010). In southern higher latitude, biogeographers explicitly developed hypotheses involving
ACC-mediated transport of marine larvae. Described as ‘a diminishing trail of species
eastwards’ (Fleming 1979), a trend of progressive decline in species richness clockwise from
Australia to South Africa was hypothesized as in echinoderms (Fell 1967; Fell 1962), galaxiid
fishes (Cussac et al. 2004; McDowall 1970; Mcdowall 1978). These lines suggest that South
Africa is a most unlikely source of origin and dispersal, and rather, is the end of a chain of
dispersal areas (McDowall 1970). Similar pattern of cline was also shown for squat lobsters in
the Pacific Ocean, where the Coral Sea (Solomon-Vanuatu-New Caledonia islands) and Indo-
Malay-Philippines archipelago (IMPA) comprised the highest number of squat lobster species
(Macpherson et al. 2010). Exhaustive sorting of species’ distributions within the speciose squat
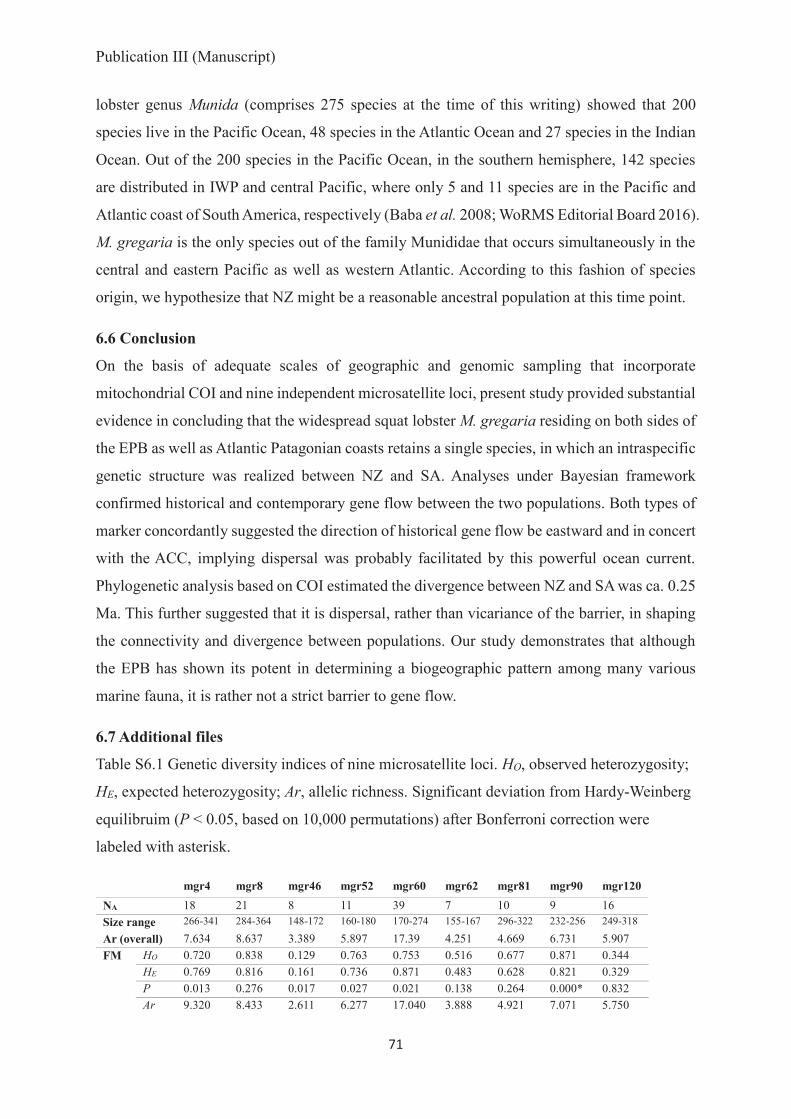
Publication III (Manuscript)
71
lobster genus Munida (comprises 275 species at the time of this writing) showed that 200
species live in the Pacific Ocean, 48 species in the Atlantic Ocean and 27 species in the Indian
Ocean. Out of the 200 species in the Pacific Ocean, in the southern hemisphere, 142 species
are distributed in IWP and central Pacific, where only 5 and 11 species are in the Pacific and
Atlantic coast of South America, respectively (Baba et al. 2008; WoRMS Editorial Board 2016).
M. gregaria is the only species out of the family Munididae that occurs simultaneously in the
central and eastern Pacific as well as western Atlantic. According to this fashion of species
origin, we hypothesize that NZ might be a reasonable ancestral population at this time point.
6.6 Conclusion On the basis of adequate scales of geographic and genomic sampling that incorporate
mitochondrial COI and nine independent microsatellite loci, present study provided substantial
evidence in concluding that the widespread squat lobster M. gregaria residing on both sides of
the EPB as well as Atlantic Patagonian coasts retains a single species, in which an intraspecific
genetic structure was realized between NZ and SA. Analyses under Bayesian framework
confirmed historical and contemporary gene flow between the two populations. Both types of
marker concordantly suggested the direction of historical gene flow be eastward and in concert
with the ACC, implying dispersal was probably facilitated by this powerful ocean current.
Phylogenetic analysis based on COI estimated the divergence between NZ and SA was ca. 0.25
Ma. This further suggested that it is dispersal, rather than vicariance of the barrier, in shaping
the connectivity and divergence between populations. Our study demonstrates that although
the EPB has shown its potent in determining a biogeographic pattern among many various
marine fauna, it is rather not a strict barrier to gene flow.
6.7 Additional files Table S6.1 Genetic diversity indices of nine microsatellite loci. HO, observed heterozygosity;
HE, expected heterozygosity; Ar, allelic richness. Significant deviation from Hardy-Weinberg
equilibruim (P < 0.05, based on 10,000 permutations) after Bonferroni correction were
labeled with asterisk.
mgr4 mgr8 mgr46 mgr52 mgr60 mgr62 mgr81 mgr90 mgr120 NA 18 21 8 11 39 7 10 9 16 Size range 266-341 284-364 148-172 160-180 170-274 155-167 296-322 232-256 249-318
Ar (overall) 7.634 8.637 3.389 5.897 17.39 4.251 4.669 6.731 5.907 FM HO 0.720 0.838 0.129 0.763 0.753 0.516 0.677 0.871 0.344
HE 0.769 0.816 0.161 0.736 0.871 0.483 0.628 0.821 0.329 P 0.013 0.276 0.017 0.027 0.021 0.138 0.264 0.000* 0.832 Ar 9.320 8.433 2.611 6.277 17.040 3.888 4.921 7.071 5.750

Publication III (Manuscript)
72
NCP HO 0.667 0.843 0.255 0.686 0.941 0.510 0.647 0.804 0.373 HE 0.700 0.838 0.294 0.764 0.891 0.578 0.600 0.841 0.350 P 0.185 0.252 0.439 0.021 0.856 0.249 0.424 0.002 0.806 Ar 8.519 10.080 3.500 5.761 16.950 4.447 5.214 6.968 6.069
CCP HO 0.632 0.789 0.053 0.789 0.842 0.579 0.579 0.895 0.421 HE 0.623 0.771 0.053 0.741 0.899 0.562 0.693 0.825 0.360 P 0.498 0.108 1.000 0.594 0.069 0.483 0.082 0.011 1.000 Ar 8.000 8.000 2.000 5.000 17.000 3.000 6.000 6.000 4.000
SM HO 0.556 0.889 0.111 0.722 0.750 0.528 0.611 0.889 0.250 HE 0.664 0.817 0.208 0.729 0.872 0.520 0.619 0.808 0.259 P 0.081 0.994 0.003 0.748 0.144 0.971 0.177 0.010 0.373 Ar 6.388 8.007 3.516 6.438 16.550 4.342 4.816 6.424 5.453
BC HO 0.579 0.842 0.105 0.579 0.737 0.316 0.579 0.737 0.316 HE 0.576 0.851 0.104 0.724 0.915 0.289 0.650 0.845 0.333 P 1.000 0.424 1.000 0.174 0.002 1.000 0.721 0.194 0.386 Ar 7.000 11.000 3.000 7.000 15.000 4.000 4.000 7.000 5.000
SA HO 0.661 0.848 0.147 0.725 0.803 0.507 0.642 0.849 0.339 HE 0.710 0.816 0.187 0.742 0.882 0.506 0.624 0.824 0.325 P 0.000* 0.021 0.000* 0.064 0.049 0.948 0.015 0.000* 0.921 Ar 14.210 13.537 4.754 8.500 32.156 5.581 7.661 8.170 10.764
NZ HO 0.577 0.427 0.481 0.538 0.805 0.533 0.065 0.551 0.274 HE 0.617 0.421 0.518 0.561 0.905 0.575 0.638 0.797 0.319 P 0.400 0.126 0.010 0.048 0.121 0.071 1.000 0.000* 0.003 Ar 7.962 9.949 5.974 7.000 28.884 6.000 4.000 7.000 11.923
00.10.20.30.40.50.60.70.80.9
1
0 0.01 0.02 0.03 0.04 0.05
NZ vs SA_χ2NZ vs SA_Fisher6pop_χ26pop_Fisher

Publication III (Manuscript)
73
Fig. S6.1 Tests of statistical power for COI (upper) and microsatellite (lower) data sets using POWSIM 4.1. Analyses were conducted among six geographic populations as well as between NZ and SA.
Fig. S6.2 Mismatch distribution over 172 Munida gregaria individuals, based on COI sequences (618 bp).
Table S6.2 Bottleneck analyses for the identified populations, South America (SA) and New Zealand (NZ). P values are shown for 1-tailed Wilcoxon test of heterozygosity excess, under both the stepwise mutation model (SMM) and the two-phase mutation model (TPM), along with the distribution shape of alleles inferred from the mode-shift test. An L-shaped distribution of alleles suggests absence of bottleneck.
Population N Wilcoxon test (one-tail for
Heterozygosity excess) Model-shift test TPM SMM
SA 218 0.999 0.999 L-shape NZ 78 0.998 0.999 L-shape
00.10.20.30.40.50.60.70.80.9
1
0 0.002 0.004 0.006 0.008 0.01
NZ vs SA_χ2NZ vs SA_Fisher6pop_χ26pop_Fisher

Synthesis
75
7. Synthesis In this sythesis the major advances of results of present thesis will be highlighted divided in
seven major aspects. First, an efficient protocol of developing new microsatellites for non-
model organism is introduced to streamline this process and yield sufficiently many
independent candidate loci from unknown genome. In the second and third part I will highlight
the importance and the power of multimarker approaches in the attempt of accurate taxonomy,
as well as getting deeper insights into the various evolutionary and ecological factors that
contribute in understanding genotype-phenotype relationship by illustrating possible
mechanisms of the case at hand. The fourth and fifth part of the synthesis are elaborated to
provide a striking view of high level of dispersal and gene flow in maintaining species
integration rather than prevalent speciation over major biogeographic barrier in marine
organisms with a comprehensive reconstruction of the evolutionary history of M. gregaria. The
last two parts are concluding remarks and future perspectives.
7.1 The power of combined molecular markers in evolutionary studies One of the major keys to understanding the evolutionary processes and ecological mechanisms
by which biological diversity arises is the process of speciation (Coyne & Orr 2004; Turelli et
al. 2001). Realization of speciation is usually inferred from differences in morphological and/or
molecular characters, which are sometimes hard to identify and unify. Among the commonly
applied molecular markers in population genetics, microsatellites are most extensively utilized,
thanks to their high polymorphism thus great information content (Selkoe & Toonen 2006b).
In the past, a major obstacle preventing their use in evolutionary, ecological and conservation
studies of non-model organisms was the need to isolate a reasonable number of microsatellite
loci from an often unpredictably difficult isolation procedure. In this thesis, the laboratory
strategy using the Reporter Genome Protocol (Nolte et al. 2005) and the software pipeline
based on the STAMP package (Kraemer et al. 2009) have shown the promise of successfully
isolating and initiating a highly informative set of microsatellite markers within a short period
of time.
The set of microsatellites yielded in Chapter 4 shows great polymorphism at each locus and
provides solid methodological support as well as successful utilization in Chapters 5 and 6.
Their highly elevated mutational rates than single locus coding genes (including the
mitochondrial genome) have the potential to detect subtle genetic differentiation (see the
significant FST’ values between FI and CCP, FI and BC, Table 6.2, Chapter 6). In addition, these

Synthesis
76
microsatellites are selectively neutral and thus randomly distributed throughout the genome.
The results yielded from them and DNA barcoding (mitochondrial COI gene) provide a
sufficient representation that is able to extrapolate to the entire genome. Another advantage of
applying such combination of multiple loci is that they can identify evolutionary lineages
before monophyly is acquired at any individual locus (Knowles & Carstens 2007). In this way,
my choices of molecular markers have the potential to delineate evolutionary lineages that
constitute species even at the incipient stage of divergence.
7.2 M. gregaria represents a single transoceanic species with discrete phenotypes Based on variable multi-locus nuclear and mitochondrial markers and continental-scale
sampling strategy, I did not detect strong signals of genetic divergence suggesting cryptic
speciation neither between different ecotypes (Chapter 5) nor associated with major marine
barriers (Chapter 6). I can exclude that it is a hidden diversity of genetic distinctness which is
commonly found within cryptic species, thus the different ecotypes truly belong to one single
transpacific species M. gregaria. Nevertheless, it is a caveat that neutral molecular markers
(the focus of most population genetic studies) do not allow predictions on adaptive genetic
variation accumulated at certain areas of genome (Reed & Frankham 2001). Such isolated
regions of differentiation within genome, also known as ‘genomic islands’ (Harr 2006; Turner
et al. 2005), are usually associated with a set of genes under divergent selection, which remains
an explanatory underlying genetic basis of the phenotypic differentiation. This alternative is
hard to falsify and might be true for any marker-based study in organisms with incompletely
known genomes. Assuming the existence of such divergent spots and locating them without
indicative information is at the cost of exhaustive genetic survey of candidate loci, which may
be eventually still at the risk of failure and is out of the scope of my study. Even though targeted
genes under selection could be identified, suggesting that the phenotypic variation between
ecotypes are produced by genetic differences, a new question would subsequently arise that
whether this part of genetic differentiation should be rather classified as outliers or be
interpreted as provisional species (and how small provisional species are allowed to be).
Although it has been evidenced that certain loci subject to selection had led to adaptive
population divergence in the stasis of neutral markers (Hemmer-Hansen et al. 2007; Larmuseau
et al. 2010), it is doubtful that whether strong local selection could be able to override the effect
of drift and gene flow, resulting in isolation in reproduction, which constitutes the main criteria
of the BSC. So far, it is known from laboratory experiment that prezygotic behavioural barrier
to random mating is absent between gregaria s. str. and subrugosa ecotypes (Perez-Barros et

Synthesis
77
al. 2011), that is, reproductive isolation should have not formed. In this context, whether the
existence of localized genomic divergence does not preclude the conclusion that discrete
ecotypes belong to a single species following genetic criteria and the BSC.
With advances in molecular techniques and prevailing implementation of genetic markers,
molecular evidences are gaining more weights in taxonomic practices, for which the former
species M. subrugosa was considered synonymy of M. gregaria in the International Code of
Zoological Nomenclature (ICZN) (Baba et al. 2008). Yet the sharp differences in morphology,
ecology and bahaviour of the two ecotypes that are acting as well as truly separate species raise
thoughts on how they should be acknowledged and further the long-standing issue of species
definition. Ever since Mendel’s laws it became gradually realized that the genetic heritable
materials determine the observable phenotypic traits, and the ideal that the macroevolutionary
phenomenon of speciation is the result of the microevolutionary process of ecologically-based
divergent selection dates back to the modern evolutionary synthesis (Dobzhansky 1951; Mayr
1942, 1947). The lack of genetic differentiation at species-level classifies different ecotypes or
geographic populations of M. gregaria as a single species in the view of population geneticists
under the current taxonomic framework, but from the perspective of ecologists, the prominent
distinction in all aspects of ecology would keep them valid as separate units that equal to status
of species, which should not be overlooked or downplayed. Due to the fuzzy nature of species
boundaries and limits of single character classification, it has been recommended using
multiple sources of information (e.g., behaviour, ecology, molecules, and morphology) for
species discovery and validation (Carstens et al. 2013; Raxworthy et al. 2007). Current
different species concepts are often incompatible with one another, resulting in frequent
conflictions in species delimitation, such as the case of M. gregaria. Therefore, development
of a universal species concept that incorporates and deals with multi-aspects of evidences are
strongly needed, meanwhile challenging. In addition, another important aspect must be
considered in developing this universal species concept, that speciation must be viewed as a
continuum, rather than a discrete event (Coyne & Orr 2004). The process of speciation may
contain various stages, but the boundaries between stages are neither abrupt nor obvious and
transitions among stages are not inevitable or necessarily unidirectional (Hendry et al. 2009;
Mallet 2008). To fully appreciate the speciation process, examinations at different stages and
levels are necessary.

Synthesis
78
7.3 Possible mechanisms underlying the discrete phenotypes Investigating the mechanisms of variation of phenotypes is one of the central issues in biology
because it is tightly linked with individuality, adaptation of populations to environmental
fluctuations, and the evolution of biodiversity (Crawford & Oleksiak 2007; Pigliucci et al. 2006;
West-Eberhard 2003). Generally phenotypic variation can be produced by genetic differences,
environmental influences and stochastic developmental events. Outcomes from the present
study have excluded the explanation of cryptic speciation, that is, the same genotype gives rise
to the very different-looking phenotypes. Thus the possible mechanism remains as phenotypic
plasticity or developmental variation.
Environmentally induced phenotypic plasticity
Phenotypic plasticity, defined as the capacity of a single genotype to produce different
phenotypes in response to varying environmental conditions (Whitman & Agrawal 2009), is a
common phenomenon across various taxa in plants and animals. The definition of phenotypic
plasticity implies that environmental factors, rather than genetic factors, are playing the role in
the observed high phenotypic differentiation. Environmental conditions include biotic and
abiotic factors that cannot only vary in time but also vary in space. M. gregaria s. l. spans
extensive both latitudinal and latitudinal distributions and occupies wide bathymetry (from
water surface to 1137m recorded for subrugosa (Arntz et al. 1999)), which involves a great
gradient of heterogeneous environmental conditions (e.g., temperature, salinity, oxygen
concentration and food resources). It is known in some species that their feeding performance
and diet composition during larval phases can induce the development into different
morphotypes or sex reversal (Parsons & Robinson 2007; Zupo 2000). Since gregaria s. str. and
subrugosa differs in feeding habit as deposit feeders and predator, respectively (Romero et al.
2004), changes in environmental food composition may likely affect the metamorphosis of M.
gregaria s. l. in an adaptive way, favouring its development into one ecotype rather than the
other. Long-term observations of the proportion of both gregaria s. str. and subrugosa ecotypes
in the Beagle Channel and San Jorge Gulf demonstrates the existence of ecotypes on the sea-
bottom are not even and the dominant ecotype can exchange from one to the other (see Diez et
al. 2016 and references therein). In addition, recent hydroacoustical evidence postulates that
major pelagic swarms of M. gregaria on the Argentine continental shelf are associated to
productive areas such as frontal zones that vary considerably in spatial and temporal scales
(Diez et al. 2016), implying the availability of phytoplankton in frontal zones might favor the
expression of gregaria s. str. ecotype.

Synthesis
79
Fig. 7.1. A schematic spectrum depicting an evolutionary continuum of genetic and environmental interactions on phenotypes. Left end of the spectrum shows an extreme where genetic assimilation has completely taken over the effect of environmental factor in determining phenotypic variation, whereas the right end demonstrates phenotypic variation is sheer plasticity of genotype, purely induced by environmental variations. Most (perhaps all) traits, however, lie between these two extremes. Moreover, a trait’s position may shift along this continuum over evolutionary time. The evolution of canalization would reduce environmental sensitivity, whereas the evolution of plasticity would increase environmental sensitivity. Such shifts can have profound impacts on diversification and speciation.
Even though phenotypic plasticity is the reaction of the same genotype to variable
environmental selection, conversely, phenotypic plasticity can also promote the accumulation
and release of cryptic genetic changes in the genotype (i.e. variation that is only expressed
under certain environmental or genetic conditions) (Gibson & Dworkin 2004; Le Rouzic &
Carlborg 2008). In fact, the observed plasticity of phenotypic traits is a result of an interplay
between genetic and environmental factors involving different stages along the evolutionary
continuum of speciation (Fig. 7.1). In one extreme, changes in phenotypes are purely induced
by environmental factors. Plasticity may evolve to become canalized (which refers to a measure
of the ability of a population to produce the same phenotype regardless of variability of its
environment or genotype, Debat & David 2001) against environmental perturbations, via
selection acting on different populations. The increase of canalization (i.e. the decrease of
plasticity) is achieved by the process of genetic assimilation, which was first termed by
Waddington (1961) and is a type of genetic accommodation (sensu Crispo 2007). The
phenotypic traits, which initially are produced only in response to some environmental
influence, through the persistence of selection, are gradually taken over by the genotype.
Finally, even in the absence of environmental influence that needed at first to be necessary,
plasticity of the phenotypic traits are still present (Waddington 1961). In this sense, it reaches
the other extreme of genotype-environment interaction (Fig. 7.1), i.e., phenotypes are purely
determined by different genes or genotypes, which implicates possibly the origin of new
species (West-Eberhard 2005). With regard to M. gregaria s. l., the bimodal distributions of
distinct ecotypes, rather than a broad continuous curve, implies each ecotype that resulted from

Synthesis
80
the genotype of M. gregaria s. l. may be buffered against environmental variation
(environmentally insensitive), that is, genetic canalization might play a role at certain degree.
Such assimilated genetic basis perhaps exists as tiny proportion of genome that are actually
localized and responsible for the distinctness of the ecotypes. As discussed in detail above, this
tiny proportion of genome, if exists, must involve a set of genes that are extremely selected,
which might be uncovered unless complete genome is known.
Developmental variation (DV)
Given that gregaria s. str. and subrugosa ecotypes occur mostly in sympatry (Boschi et al.
1992; Tapella 2002), and the differences in morphology and life strategy is already discernable
at the stage of megalopa (Rayner 1935; Roberts 1973), perhaps in their early developments
environmental variation is absent in triggering the differentiation. In this event, other than
genetic and environmental factors, developmental variation (DV), or developmental instability
is interpreted as a third source of phenotypic determination (Graham et al. 2003) (but see
Falconer & Mackay 1996 pp. 134-135, which considered DV to be a variation of environmental
origin). Unlike phenotypic plasticity that is rather widely and well investigated, DV remained
poorly touched and among the most causally opaque sources of phenotypic variation due to
technical challenges in its measurement, i.e. the lack of an absolute standardization of
experimental conditions and suitable laboratory model (Peaston & Whitelaw 2006).
Nevertheless, as a basic biological principle, DV was documented in systematically distant taxa.
For example, 30 yearlong analyse of different components of random variability in quantitative
traits in standardized laboratory rats and mice (Gärtner 1990), population genetic calculations
on human monozygotic twins (Falconer & Mackay 1996), resting egg formation in Daphnia
pulicaria (Lajus & Alekseev 2004), polyembryonic armadillos (Loughry & McDonough 2002),
inbred lines of Drosophila, guinea pigs (Astauroff 1930; Peaston & Whitelaw 2006; Wright &
Chase 1936), and cloned mammals and plants (Archer et al. 2003a; Archer et al. 2003b;
Jaenisch & Bird 2003; Scowcroft 1985) revealed that DV usually accounts for more than half
of the total variation of a trait.
Heterochrony, which is generally defined as a developmental change in relation to size and
shape in the timing or rate of ontogenic events (see review in Smith 2001), has been recognized
as a major kind of developmental dissociation that increases morphological evolvability and is
thus an important mode of evolution. Recent study showed that M. gregaria s. l. from the
lower-latitudinal San Jorge Gulf has faster growth rate and earlier reproductive investment in

Synthesis
81
its early life history than the southern populations from Beagle Channel and Strait of Magellan
(Varisco & Vinuesa 2015). Such differences in the timing of ontogeny may involve
heterochrony. There are varying examples of heterochrony within crustacean species. For
example, within the widespread squat lobster, Pleuroncodes monodon, along Pacific coast of
South America, there is a smaller pelagic form in the north and a larger benthic form in the
south. The morphological differences with lack of genetic differentiation were postulated to
have undergone heterochronic process (Haye et al. 2010). Some other Crustacean species show
variations in the timing of appearance and rates of character development, which occur at
different stages in abbreviated larval development, such as euphausiids (Makarov &
Maslennikov 1981), brachyurans (Clark 2005), and anomurans (Delgado & Defeo 2006).
Especially for the anomuran mole crab, Emerita brasiliensis, neoteny was previously described
as a characteristic of males (Efford 1967). As stated by Delgadoand Defeo (2006), ‘‘The
principal benefit to early maturation is demographic: sexually mature neotenic males are most
likely to succeed since they have less chance of dying before maturation.’’, the long ontogenetic
pathways is probably maintaining the basal population, whereas an existing abbreviated
pathway seems to be a response to population density and female biased sex ratio. Similarly,
environmental variation across the broad distribution of M. gregaria s. l. may determine
different geographical populations undergoing long or abbreviated ontogenetic pathways.
7.4 Gene flow across the EPB Munida gregaria s. l. possesses a transpacific distribution on the continental shelf off southern
South America and New Zealand (Baba et al. 2008). This apparent disjoint distribution hinted
at the possibility of a cryptic speciation process between populations on both sides of the EPB.
My results, i.e., the absence of different groups of haplotypes and measured gene flow
constantly along evolutionary time, all suggest that populations on both sides of the EPB belong
to the same species.
Although the uninterrupted 4,000-7,000 km stretch of deep water of the EPB had shown its
potency in forming high levels of fauna affinities between the central and eastern Pacific
(Briggs 1974; Castilla & Guiñez 2000; Cowman & Bellwood 2013; Glynn & Ault 2000;
Macpherson et al. 2010), the question that whether the EPB serves as an absolute barrier to
gene flow is not only answered by the case of M. gregaria s. l., but also witnessed by several
other organisms. The onset of the EPB was studied to be ca. 65 Ma (Rosen & Smith 1988), if
a previously widespread population was separated by this barrier and subsequently became
vicariant, deep genetic divergence between separated populations should be evident. However,

Synthesis
82
Dana (1975) and later Glynnand Wellington (1983) and Cortés (1997) argued that the
establishment of the eastern Pacific coral reef biota was more recent, possibly since Pleistocene
low sea level stands, by dispersal from the other side of the EPB. Ongoing connectivity between
central and eastern Pacific was also inferred in reef shore fishes (Lessios & Robertson 2006;
Robertson et al. 2004; Rosenblatt & Waples 1986), sea urchins (Lessios et al. 2003) and sea
stars (Nishida & Lucas 1988). Two aspects of difference make the case of M. gregaria s. l.
particular to these examples.
Firstly, previous case studies have exclusively centered on tropical area, whereas in the higher
latitude of southern Pacific, where the distance of open deep water is even broader without
intermediate shallow water habitats and oceanographic regimes are different, there are few
examples explicitly investigate genetic connectivity and gene flow over evolutionary time
between central and eastern Pacific. Secondly, the advantage of my study is using fast-evolving
microsatellites to provide convincing evidence of high level of gene flow. If the lack of specific
divergence yielded from mitochondrial COI, e.g., shared haplotypes by NZ and SA, is
interpreted as lack of resolution of marker itself (retention of shared ancestral polymorphisms),
this alternative would be eliminated by the corroboration of microsatellites. In fact, my set of
microsatellites has shown its advantage over COI in detecting the weak genetic structure
between NZ and SA. Moreover, the combination of mitochondrial COI and nuclear
microsatellites yielded a more detailed history of Munida gregaria s. l. along evolutionary time
scale in demonstrating a consistent gene flow from west to east.
Maintenance of gene flow between NZ and SA are mainly ascribed to two factors: ocean
current and life history traits. Gene flow between NZ and SA was suggested eastward, which
is consistent with the direction of the ACC. Being the mightiest ocean current system, the ACC
extends its influence north to ca. 45 S as the Subtropical Front (STF). The ACC has been
referred to as overwhelming transportation of pelagic larvae and thus responsible for the
genetic connectivity. The lack of genetic differentiation at circum-subantarctic scale of
southern bull kelp Durvillaea antarctica well exemplified the homogenizing effect of the ACC
(Fraser et al. 2009). Even for benthic invertebrates with less dispersal ability, e.g. the brooding
brittle Star Astrotoma agassizii (Hunter & Halanych 2008), the Antarctic brooding isopod
Septemserolis septemcarinata (Leese et al. 2010), low genetic structure was realized with
rafting on floating objects that were transported by the ACC.

Synthesis
83
Single factor of the ACC may not well enough explain the high level of connectivity for Munida
gregaria s. l., whereby its life history traits play another important role. M. gregaria s. l. has a
unique pelagic post-larval stage (pelagic larval duration, PLD) out of its family that lasts about
90-120 days (Tapella et al. 2002b). Even though adults settle benthic, they still perform
migration through water column (Tapella 2002; Zeldis 1985). Further swarming bahaviour of
both juveniles and adults may promote their dispersal in larger areas (Diez et al. 2012; Zeldis
1985). Even though some researchers argue that PLD may not be a good indicator to dispersal
distance (Bowen et al. 2006; Selkoe & Toonen 2011), a majority of studies still support that
PLD is a key factor in population connectivity (Cowen & Sponaugle 2009; Lester et al. 2007;
Shanks 2009). Besides, the ability to raft with flotsam and broad environmental tolerance of M.
gregaria s. l. can be instead accounted for as means to successive migration.
7.5 Outstanding diversity in small lakes vs the lack of that in the ocean The high levels of gene flow maintained across the southern Pacific as well as between distinct
ecotypes render M. gregaria a spectacular case that differs from the increasingly reported
cryptic speciation in the marine regime (Cowen & Sponaugle 2009; Hellberg et al. 2002;
Knowlton 2000; Palumbi 2003). In contrast to the comparatively evolutionary stasis of M.
gregaria, the well-studied cichlid fish in African lakes, which is usually taken to exemplify the
contentious sympatric speciation (as well as allopatric speciation), demonstrates the opposite
extreme with high species richness and diversity in the following aspects. a) Number of species.
Based on different delimiting criteria (e.g., morphology, genetics, physiology and behaviour),
thousands of species are being identified or scientifically described, with ongoing new
discoveries (Froese & Pauly 2012). For instance, it is estimated that there are at least 1 000
species in Lake Malawi (Kornfield & Smith 2000) and more than 500 phenotypically distinct
putative species in Lake Victoria (Johnson et al. 2000; Turner et al. 2001). By contrast, my
study confirms that M. gregaria s. l. is a single species. b) Scales of geography. Such enormous
species richness of cichlids exist within tiny African Lakes (e.g. Tanganyika, Victoria, Malawi)
compared to the span of thousands of kilometres in the southern Pacific for M. gregaria (Fig.
7. 2). Some crater lakes, which are only a few kilometres in diameter with shallow depth and
completely isolated from neighbouring river-system. For example, Lakes Barombi Mbo,
Bamin (Schliewen et al. 1994) and Ejagham (Schliewen et al. 2001) in Cameroon, Lake Apoyo
in Nicaragua (Barluenga et al. 2006), provide unequivocal homogenous habitat evidencing
sympatric speciation. c) Solid genetic examination. Like the comprehensive genetic
investigation on the phenotypically different M. gregaria ecotypes, considerable genetic
Synthesis
84
differentiation with pervasive signatures of speciation for cichlids were confirmed by solid
genetic examination. Genetic investigations were carried out using not only the standardly
applied mitochondrial markers, but also genotypic markers with faster evolutionary rates, such
as microsatellites (Barluenga et al. 2006; Takeda et al. 2013), AFLP (Barluenga et al. 2006;
Bezault et al. 2011), SNPs (Loh et al. 2008), as well as next-generation sequencing of
restriction-site-associated DNA (RAD tags) (Keller et al. 2013; Wagner et al. 2013). In
particular, to distinguish speciation from intraspecific polymorphism, Bezault et al. (2011)
performed AFLP genome scan with large number of putative species and sampling sizes for
cichlids from Lake Victoria, which found considerable species-level genetic differentiation. In
comparison, the genetic differentiation between NZ and SA for M. gregaria demonstrates
intraspecific genetic polymorphism (Table 7.1). It is worth noting that the amount of genetic
differentiation calculated in Bezault et al. (2011) is in the context of putative sympatric
speciation, where occasional gene flow between related species offsets the actual level of
differentiation in some degree. This explains why sympatric populations of related species can
be more similar at neutral markers than allopatric populations of the same species
(Konijnendijk et al. 2011). d) Reproductive isolation. This is of basic importance when
following the BSC to corroborate the genetic evidence of speciation. Mate-choice experiments
demonstrating that strong assortative mating (Baylis 1976) was in line with the specific status
of genetic clusters (Barluenga et al. 2006). Work on pairs of phenotypically defined taxa
demonstrated divergence from reproductive isolated sister species with strong phenotypic and
significant neutral genetic differentiation (Magalhaes et al. 2009; Mzighani et al. 2010;
Seehausen et al. 2008). e) Rapid adaptive radiation. The endemic cichlid fishes of African
lakes are characterized by explosive speciation and adaptive radiation, where reproductive
isolated lineages were found as young as ~ 10 000 yr (Barluenga et al. 2006; Schliewen et al.
2001; Won et al. 2005) and species flocks of the Lake Malawai and the Lake Victoria areas
were shown to be monophyletic, indicating a single colonization event by an ancestral lineage
(Salzburger & Meyer 2004). By contrast, divergence between NZ and SA dates back 0.254
Ma, and the populations still belong to a single species.
In summary, the well-studied African cichlids demonstrate an extreme of speciation coincided
with ecological opportunity, intrinsic ecological versatility and genomic flexibility, behavioural
mate choice and the amounts of standing genetic variation. In comparison, M. gregaria emerges
as an opposite evolutionary model in which many fundamental questions in evolution and
ecology still await to be tested and ultimately help enrich the knowledge of speciation.

Synthesis
85
The famous essay by Theodosius Dobzhansky (1973) “Nothing in biology makes sense except
in the light of evolution” is often quoted to emphasize the importance of understanding
evolution when asking questions about causal factors in biology. A corollary to this notion
“Nothing in evolution makes sense except in the light of ecology” (Grant & Grant 2008) reminds
us the notion of evolutionary consequences of ecological interactions. Molecular results helped
us understand current patterns of biological diversity, but to fully understand why organisms
today are the way they are, we need to comprehend how they have been shaped by their natural
environment. Recent conceptual ideas of ´niche construction´ (Odling-Smee et al. 2003)
demonstrate a framework for building a dynamic connection between niche and evolutionary
process, which offers an interesting perspective for future studies such as the M. gregaria case.
Fig. 7.2 A sketch demonstrating the contrast between highly diverged Cichlids in Lake Victoria and single truly transpacific species M. gregaria. Bold black lines indicate coasts along which M. gregaria s. l. occurs.
Table 7.1 Comparison of amount of genetic differentiation between cichlids in Lake Victoria and M. gregaria.
No. of
species/populations Fixation Index (FST)
Percentage of total
genetic variance (%)
Cichlids in Lake
Victoria* 72 0.235 19
Transpacific
M. gregaria 2 0.088 8.8
* Data from Bezault et al. 2011 excluded satellite lakes of Lake Victoria.

Synthesis
86
7.6 Concluding remarks In the present thesis genetic analyses performed with newly developed nuclear microsatellite
markers and new sets of DNA barcoding, as well as morphological analysis, were carried out
to reconstruct the evolutionary history of the transoceanic squat lobster M. gregaria. The
superordinate aim was to test if phenotypic differences are reflected in underlying genetic
differences, meanwhile whether great marine geographical barrier leads to cryptic speciation
in widespread marine organisms.
The overall results highlighted that unlike the ubiquitous cryptic speciation among marine
populations, there are high levels of gene flow homogenizing the genetic background of
different ecotypes as well as distant populations, so that M. gregaria is maintained as a single
species out of its global distribution.
1) Based on a sampling scope of the South American distribution, genetic analyses using
multi-locus nuclear microsatellites and the mitochondrial COI fragment found that
discrete ecotypes of M. gregaria share the same genotype, i.e. the phenotypic
differentiation is not produced by genetic differences. The application of independent
polymorphic nuclear microsatellites helped exclude alternative explanations when
relying on a single mitochondrial marker, such as incomplete lineage sorting,
introgressive hybridization or insufficient evolutionary rate. Morphological analyses
affirmed the boundaries between the two ecotypes were not blurred with continental-
scale geographic sampling, instead remain stable despite an ontogenetic dimension in
the data.
2) The geographic separation by the more than 7,000 km open Pacific water as well as the
landmass of Patagonia did not translate into diminished or further vanished gene flow
for M. gregaria in its global disjunct distribution. The only detectable genetic structure
is a differentiation across the Pacific but many shared alleles as well as testing in a
Bayesian framework confirmed gene flow at different timescales across the EPB. This
divergence between NZ and SA dated back 0.254 Ma, corresponding to late Pleistocene,
indicating the Pleistocene climate fluctuation, rather than the EPB, was likely to be
responsible for the divergence. The high level of gene flow that was consistently
suggested eastward by mitochondrial and microsatellite data indicated that migration
was realized in the venue of the ACC.
Synthesis
87
In summary, the frequently asked questions whether or not gregaria s. str. and subrugosa
ecotypes, as well as disjunct populations on both sides of the EPB represent a truly single
species are affirmatively answered in this thesis. The evolution of M. gregaria is a
prominent example in contrast to the commonly expected allopatric speciation resulted
from geographical separation or selection-led sympatric speciation. The insights provided
by this thesis will motivate species delimitation by using multiple molecular markers with
sufficient evolutionary rates from both nuclear and mitochondrial genomes. Meanwhile,
present molecular investigation motivates to connect current knowledge of basic principles
of evolution to insights from ecology, in which the causal factors of M. gregaria case should
be sought.
7.7 Future perspectives There are stimulating questions and ideas arising from the presented findings, which are
outlined for future research to gain a more comprehensive understanding of evolutionary
processes shaped by the interactions of genetic and environmental factors from the example of
M. gregaria.
1) The caveat that neutral molecular markers do not allow predictions on adaptive genetic
variation accumulated at certain areas of genome encourages further test to find out the
existence of more pronounced difference at loci affected by selection, which might
support the differentiation in the phenotypic traits and/or adaptation to environmental
heterogeneity. The growing utilization of cost-reducing genome-wide sequencing
approaches, i.e. next generation sequencing, provides the opportunity to investigate the
whole genomes of M. gregaria. This offers the possibility to identify all regions of the
genomes that are actually under divergent selection and responsible for the phenotypic
or developmental variations. These additional insights would help me learn the
necessary quantity of genes that build and maintain a genetic divergence based on
selection. Furthermore the functions of those genes could help reveal relevant
environmental factors that are playing the roles in adaptive divergence.
2) In current morphological analyses, a third cluster formed by juvenile gregaria s. str.
from Northern Chilean Patagonia (NCP) emerged discrete from the known cluster
represents gregaria s. str. adults. One hypothesis is the gap between them is natural
irrespective sampling composition, i.e., the ontogenetic transition from juveniles to
adults of gregaria s. str. is more pronounced than that in subruguosa. In future study,
the inclusion of samples of juvenile gregaria s. str. from other Patagonia regions except

Synthesis
88
NCP will help test whether this hypothesis is true, or alternatively, this gap would be
filled and then gregaria s. str. ecotype would have a broader spectrum of phenotypic
plasticity.
3) Although there is no evidence of behavioural prezygotic barriers to gene flow (Perez-
Barros et al. 2011), studies investigating the existence of intrinsic postzygotic isolation
are crucial in order to draw the conclusion of no reproductive isolation between
gregaria s. str. and subrugosa. Mating experiments are necessary to collect hatched
larvae from homo- and heterotypic mating couples, whereby the set of microsatellites
at hand provides the opportunity to perform parentage analysis for these larvae.
4) The causes of nearly 400 whales’ death in the area of Penas Gulf are still mysterious,
which spotlighted the ecological significance of M. gregaria in the food web due to its
large abundance and its direct link to the top predators such as whales and primary
producers. The presence of biotoxins generated in harmful algae blooms (HABs) in the
stomach content of two whales and their prey (including M. gregaria) has been
confirmed in the latest report of Patagonia Projects: Golfo de Penas
(https://expedition2016.wordpress.com/), but more solid and direct evidences are
needed to confirm HABs as the killer. In future research, long-term observation and
measurements are necessary to monitor realize the degree of accumulation of toxins
such as paralytic shellfish poisoning (PSP) in M. gregaria and study seasonal
population dynamics in relation to the outbreak of harmful phytoplankton.

References
89
References Abdelkrim J, Robertson B, Stanton JA, Gemmell N (2009) Fast, cost-effective development of species-
specific microsatellite markers by genomic sequencing. Biotechniques 46, 185-192.
Ajzenberg D, Collinet F, Mercier A, Vignoles P, Dardé M-L (2010) Genotyping of Toxoplasma gondii
Isolates with 15 Microsatellite Markers in a Single Multiplex PCR Assay. Journal of Clinical
Microbiology 48, 4641-4645.
Allendorf FW, Hohenlohe PA, Luikart G (2010) Genomics and the future of conservation genetics.
Nature Reviews Genetics 11, 697-709.
Andersson L (1990) The Driving Force: Species Concepts and Ecology. Taxon 39, 375-382.
Antao T, Lopes A, Lopes R, Beja-Pereira A, Luikart G (2008) LOSITAN: a workbench to detect
molecular adaptation based on a Fst-outlier method. Bmc Bioinformatics 9, 323.
Archer GS, Dindot S, Friend TH, et al. (2003a) Hierarchical Phenotypic and Epigenetic Variation in
Cloned Swine. Biology of Reproduction 69, 430-436.
Archer GS, Friend TH, Piedrahita J, Nevill CH, Walker S (2003b) Behavioral variation among cloned
pigs. Applied Animal Behaviour Science 81, 321-331.
Arntz W, Gorny M (1996) Cruise report of the Joint Chilean-German-Italian Magellan “Victor Hensen”
Campaign in 1994. Ber. Polarforsch 190, 1-113.
Arntz WE, Gorny M, Soto R, et al. (1999) Species composition and distribution of decapod crustaceans
in the waters off Patagonia and Tierra del Fuego, South America. Scientia Marina 63, 303-314.
Ashton GV, Willis KJ, Burrows MT, Cook EJ (2007) Environmental tolerance of Caprella mutica:
Implications for its distribution as a marine non-native species. Marine Environmental
Research 64, 305-312.
Astauroff BL (1930) Analyse der erblichen Störungsfälle der bilateralen Symmetrie. Zeitschrift für
Induktive Abstammungs- und Vererbungslehre 55, 183-262.
Avise JC (2004) Molecular markers, natural history and evolution (Second edition) Sinauer Associates,
Inc., Sunderland, MA.
Baba K, Macpherson E, Poore GC, et al. (2008) Catalogue of squat lobsters of the world (Crustacea:
Decapoda: Anomura-families Chirostylidae, Galatheidae and Kiwaidae). Zootaxa 1905, 1-220.
Baird HP, Miller KJ, Stark JS (2011) Evidence of hidden biodiversity, ongoing speciation and diverse
patterns of genetic structure in giant Antarctic amphipods. Molecular Ecology 20, 3439-3454.
Ballard JWO, Whitlock MC (2004) The incomplete natural history of mitochondria. Molecular Ecology
13, 729-744.
Baras E, Prignon C, Gohoungo G, Méalard C (2000) Phenotypic sex differentiation of blue tilapia under
constant and fluctuating thermal regimes and its adaptive and evolutionary implications.
Journal of Fish Biology 57, 210-223.

References
90
Barber PH, Palumbi SR, Erdmann MV, Moosa MK (2000) Biogeography: A marine Wallace's line?
Nature 406, 692-693.
Barluenga M, Stölting KN, Salzburger W, Muschick M, Meyer A (2006) Sympatric speciation in
Nicaraguan crater lake cichlid fish. Nature 439, 719-723.
Baums IB, Boulay JN, Polato NR, Hellberg ME (2012) No gene flow across the Eastern Pacific Barrier
in the reef-building coral Porites lobata. Molecular Ecology 21, 5418-5433.
Baylis JR (1976) A Quantitative Study of Long-Term Courtship: I. Ethological Isolation Between
Sympatric Populations of the Midas Cichlid, Cichlasoma Citrinellum, and the Arrow Cichlid,
C. Zaliosum. Behaviour 59, 59-69.
Beerli P, Felsenstein J (2001) Maximum likelihood estimation of a migration matrix and effective
population sizes in n subpopulations by using a coalescent approach. Proceedings of the
National Academy of Sciences of the United States of America 98, 4563-4568.
Beerli P, Palczewski M (2010) Unified Framework to Evaluate Panmixia and Migration Direction
Among Multiple Sampling Locations. Genetics 185, 313-326.
Bezault E, Mwaiko S, Seehausen O (2011) Population Genomic Tests of Models of Adaptive Radiation
in Lake Victoria Region Cichlid Fish. Evolution 65, 3381-3397.
Bickford D, Lohman DJ, Sodhi NS, et al. (2007) Cryptic species as a window on diversity and
conservation. Trends in Ecology & Evolution 22, 148-155.
Boschi E, Fischbach C, Iorio M (1992) Catálogo ilustrado de los crustáceos estomatópodos y decápodos
marinos de Argentina [Illustrated catalogue of stomatopod and decapod crustraceans of the
marine littoral of Argentina]. Frente Marítimo 10, sec. A, 7-94.
Bouckaert R, Heled J, Kühnert D, et al. (2014) BEAST 2: A Software Platform for Bayesian
Evolutionary Analysis. Plos Computational Biology 10, e1003537.
Bowen BW, Bass AL, Muss A, Carlin J, Robertson DR (2006) Phylogeography of two Atlantic
squirrelfishes (Family Holocentridae): exploring links between pelagic larval duration and
population connectivity. Marine Biology 149, 899-913.
Brandt A, Gooday AJ, Brandao SN, et al. (2007) First insights into the biodiversity and biogeography
of the Southern Ocean deep sea. Nature 447, 307-311.
Brey T, Dahm C, Gorny M, et al. (1996) Do Antarctic benthic invertebrates show an extended level of
eurybathy? Antarctic Science 8, 3-6.
Briggs JC (1974) Marine zoogeography McGraw Hill, New York.
Brown WM, George M, Wilson AC (1979) Rapid evolution of animal mitochondrial DNA. Proceedings
of the National Academy of Sciences 76, 1967-1971.
Bull J, Vogt R (1979) Temperature-dependent sex determination in turtles. Science 206, 1186-1188.
Butlin RK, Galindo J, Grahame JW (2008) Sympatric, parapatric or allopatric: the most important way
to classify speciation? Philosophical Transactions of the Royal Society of London B: Biological
Sciences 363, 2997-3007.

References
91
Caley MJ, Carr MH, Hixon MA, et al. (1996) Recruitment and the Local Dynamics of Open Marine
Populations. Annual Review of Ecology and Systematics 27, 477-500.
Carstens BC, Pelletier TA, Reid NM, Satler JD (2013) How to fail at species delimitation. Molecular
Ecology 22, 4369-4383.
Castilla JC, Guiñez R (2000) Disjoint geographical distribution of intertidal and nearshore benthic
invertebrates in the Southern Hemisphere. Revista Chilena De Historia Natural 73, 1-23.
Chilton C (1909) Report on the Amphipoda obtained by the FIS “Endeavour” in Australian seas.
Biological Results of the Fishing Experiments carried on by the FIS “Endeavour” 14, 2.
Chow S, Jeffs A, Miyake Y, et al. (2011) Genetic Isolation between the Western and Eastern Pacific
Populations of Pronghorn Spiny Lobster Panulirus penicillatus. Plos One 6, e29280.
Clark PF (2005) The evolutionary significance of heterochrony in the abbreviated zoeal development
of pilumnine crabs (Crustacea : Brachyura : Xanthoidea). Zoological Journal of the Linnean
Society 143, 417-446.
Clarke A, Johnston NM (2003) Antarctic marine benthic diversity. Oceanography and Marine Biology
41, 47-114.
Clement M, Posada D, Crandall KA (2000) TCS: a computer program to estimate gene genealogies.
Molecular Ecology 9, 1657-1659.
Cline TW (1976) A sex-specific, temperature-sensitive maternal effect of the daughterless mutation of
Drosophila melanogaster. Genetics 84, 723-742.
Cohen SN (1993) Bacterial plasmids: their extraordinary contribution to molecular genetics. Gene 135,
67-76.
Colbourne JK, Pfrender ME, Gilbert D, et al. (2011) The ecoresponsive genome of Daphnia pulex.
Science 331, 555-561.
Collin R (2003) Phylogenetic relationships among calyptraeid gastropods and their implications for the
biogeography of marine speciation. Systematic Biology 52, 618-640.
Cornuet JM, Luikart G (1996) Description and power analysis of two tests for detecting recent
population bottlenecks from allele frequency data. Genetics 144, 2001-2014.
Cortés J (1997) Biology and geology of eastern Pacific coral reefs. Coral Reefs 16, S39-S46.
Cowen RK, Lwiza KMM, Sponaugle S, Paris CB, Olson DB (2000) Connectivity of Marine Populations:
Open or Closed? Science 287, 857-859.
Cowen RK, Sponaugle S (2009) Larval Dispersal and Marine Population Connectivity. Annual Review
of Marine Science 1, 443-466.
Cowman PF, Bellwood DR (2013) Vicariance across major marine biogeographic barriers: temporal
concordance and the relative intensity of hard versus soft barriers. Proceedings of the Royal
Society of London B: Biological Sciences 280.
Coyne JA, Orr HA (2004) Speciation Sinauer Associates Sunderland, MA, Sunderland, MA.

References
92
Craig MT, Eble JA, Robertson DR, Bowen BW (2007) High genetic connectivity across the Indian and
Pacific Oceans in the reef fish Myripristis berndti (Holocentridae). Marine Ecology Progress
Series 334, 245–254.
Crandall ED, Frey MA, Grosberg RK, Barber PH (2008) Contrasting demographic history and
phylogeographical patterns in two Indo-Pacific gastropods. Molecular Ecology 17, 611-626.
Crandall ED, Sbrocco EJ, DeBoer TS, Barber PH, Carpenter KE (2012) Expansion dating: calibrating
molecular clocks in marine species from expansions onto the sunda shelf following the last
glacial maximum. Molecular Biology and Evolution 29, 707-719.
Crawford DL, Oleksiak MF (2007) The biological importance of measuring individual variation.
Journal of Experimental Biology 210, 1613-1621.
Crispo E (2007) The baldwin effect and genetic assimilation: revisiting two mechanisms of evolutionary
change mediated by phenotypic plasticity. Evolution 61, 2469-2479.
Cronquist A (1978) Once again, what is a species? Allanheld and Osmun, Montclair, NJ.
Cussac V, Ortubay S, Iglesias G, et al. (2004) The distribution of South American galaxiid fishes: the
role of biological traits and post-glacial history. Journal of Biogeography 31, 103-121.
Dana TF (1975) Development of contemporary Eastern Pacific coral reefs. Marine Biology 33, 355-
374.
Darriba D, Taboada GL, Doallo R, Posada D (2012) jModelTest 2: more models, new heuristics and
parallel computing. Nature Methods 9, 772-772.
Darwin C (1872) The origin of species by means of natural selection or the preservation of favored
races in the struggle for life, six edn. John Murry, London.
Dasmahapatra KK, Mallet J (2006) DNA barcodes: recent successes and future prospects. Heredity 97,
254-255.
Dawson MN, Barber PH, González-Guzmán LI, et al. (2011) Phylogeography of Emerita analoga
(Crustacea, Decapoda, Hippidae), an eastern Pacific Ocean sand crab with long-lived pelagic
larvae. Journal of Biogeography 38, 1600-1612.
Dayton pk, Mordida bJ, Bacon f (1994) Polar Marine Communities. American Zoologist 34, 90-99.
de Queiroz K (2007) Species Concepts and Species Delimitation. Systematic Biology 56, 879-886.
Debat V, David P (2001) Mapping phenotypes: canalization, plasticity and developmental stability.
Trends in Ecology & Evolution 16.
Delgado E, Defeo O (2006) A complex sexual cycle in sandy beaches: the reproductive strategy of
Emerita brasiliensis (Decapoda: Anomura). Journal of the Marine Biological Association of
the United Kingdom 86, 361-368.
Dieckmann U, Doebeli M (1999) On the origin of species by sympatric speciation. Nature 400, 354-
357.

References
93
Dietz L, Arango CP, Dömel JS, et al. (2015) Regional differentiation and extensive hybridization
between mitochondrial clades of the Southern Ocean giant sea spider Colossendeis megalonyx.
Royal Society Open Science 2.
Diez MJ, Cabreira AG, Madirolas A, Lovrich GA (2016) Hydroacoustical evidence of the expansion of
pelagic swarms of Munida gregaria (Decapoda, Munididae) in the Beagle Channel and the
Argentine Patagonian Shelf, and its relationship with habitat features. Journal of Sea Research.
Diez MJ, Perez-Barros P, Romero MC, et al. (2012) Pelagic swarms and beach strandings of the squat
lobster Munida gregaria (Anomura: Munididae) in the Beagle Channel, Tierra del Fuego. Polar
Biology 35, 973-983.
Dobzhansky T (1951) Genetics and the Origin of Species, 3rd edn. Columbia University Press, New
York.
Dobzhansky T (1973) Nothing in biology makes sense except in the light of evolution. American
Biology Teacher 35, 125-129.
Dombrovsky A, Arthaud L, Ledger TN, Tares S, Robichon A (2009) Profiling the repertoire of
phenotypes influenced by environmental cues that occur during asexual reproduction. Genome
Research 19, 2052-2063.
Donoghue MJ (1985) A Critique of the Biological Species Concept and Recommendations for a
Phylogenetic Alternative. The Bryologist 88, 172-181.
Drummond A, Rambaut A (2007) BEAST: Bayesian evolutionary analysis by sampling trees. Bmc
Evolutionary Biology 7, 214.
Earl D, von Holdt B (2012) STRUCTURE HARVESTER: a website and program for visualizing
STRUCTURE output and implementing the Evanno method. Conservation Genetics Resources
4, 359-361.
Ebach MC, Holdrege C (2005) DNA barcoding is no substitute for taxonomy. Nature 434, 697-697.
Efford IE (1967) Neoteny in Sand Crabs of the Genus Emerita (Anomura, Hippidae). Crustaceana 13,
81-93.
Ekman S (1953) Zoogeography of the sea Sidgwick and Jackson, London.
Ellegren H (2000) Microsatellite mutations in the germline: implications for evolutionary inference.
Trends in Genetics 16, 551-558.
Evanno G, Regnaut S, Goudet J (2005) Detecting the number of clusters of individuals using the
software STRUCTURE: a simulation study. Molecular Ecology 14, 2611-2620.
Ewers RM, Didham RK (2006) Confounding factors in the detection of species responses to habitat
fragmentation. Biological Reviews 81, 117-142.
Excoffier L, Lischer HE (2010) Arlequin suite ver 3.5: a new series of programs to perform population
genetics analyses under Linux and Windows. Molecular Ecology Resources 10, 564-567.

References
94
Excoffier L, Smouse PE, Quattro JM (1992) Analysis of molecular variance inferred from metric
distances among DNA haplotypes: application to human mitochondrial DNA restriction data.
Genetics 131, 479-491.
Falconer DS, Mackay TFC (1996) Introduction to quantitative genetics Longman, Burnt Mill, England.
Falush D, Stephens M, Pritchard JK (2007) Inference of population structure using multilocus genotype
data: dominant markers and null alleles. Molecular Ecology Notes 7, 574-578.
Feldmann RM, Schweitzer CE (2006) Paleobiogeography of southern hemisphere decapod crustacea.
Journal of Paleontology 80, 83-103.
Fell H (1967) Cretaceous and Tertiary surface currents of the oceans. Oceanography and Marine
Biology Annual Reviews 5, 317-341.
Fell HB (1962) West-wind-drift dispersal of echinoderms in the southern hemisphere. Nature 193, 759-
761.
Fitzpatrick BM, Fordyce JA, Gavrilets S (2008) What, if anything, is sympatric speciation? Journal of
Evolutionary Biology 21, 1452-1459.
Fitzpatrick BM, Fordyce JA, Gavrilets S (2009) Pattern, process and geographic modes of speciation.
Journal of Evolutionary Biology 22, 2342-2347.
Fitzpatrick JM, Carlon DB, Lippe C, Robertson DR (2011) The West Pacific diversity hotspot as a
source or sink for new species? Population genetic insights from the Indo-Pacific parrotfish
Scarus rubroviolaceus. Molecular Ecology 20, 219-234.
Fleming CA (1979) The geological history of New Zealand and its life Auckland University Press,
Auckland.
Folmer O, Black M, Hoeh W, Lutz R, Vrijenhoek R (1994) DNA primers for amplification of
mitochondrial cytochrome c oxidase subunit I from diverse metazoan invertebrates. Molecular
marine biology and biotechnology 3, 294-299.
Fowler-Walker MJ, Wernberg T, Connell SD (2006) Differences in kelp morphology between wave
sheltered and exposed localities: morphologically plastic or fixed traits? Marine Biology 148,
755-767.
Fraser C, Thiel M, Spencer H, Waters J (2010) Contemporary habitat discontinuity and historic glacial
ice drive genetic divergence in Chilean kelp. Bmc Evolutionary Biology 10, 203.
Fraser CI, Nikula R, Spencer HG, Waters JM (2009) Kelp genes reveal effects of subantarctic sea ice
during the Last Glacial Maximum. Proceedings of the National Academy of Sciences 106, 3249-
3253.
Frézal L, Leblois R (2008) Four years of DNA barcoding: Current advances and prospects. Infection,
Genetics and Evolution 8, 727-736.
Froese R, Pauly D (2012) List of Nominal Species of Cichlidae, in Froese, Rainer, and Daniel Pauly,
eds. FishBase.
References
95
Fu Y-X (1997) Statistical Tests of Neutrality of Mutations Against Population Growth, Hitchhiking and
Background Selection. Genetics 147, 915-925.
Galtier N, Nabholz B, Glémin S, Hurst GDD (2009) Mitochondrial DNA as a marker of molecular
diversity: a reappraisal. Molecular Ecology 18, 4541-4550.
Gärtner K (1990) A third component causing random variability beside environment and genotype. A
reason for the limited success of a 30 year long effort to standardize laboratory animals?
Laboratory Animals 24, 71-77.
Gavrilets S (2014) Models of Speciation: Where Are We Now? Journal of Heredity 105, 743-755.
Gavrilets S, Vose A (2005) Dynamic patterns of adaptive radiation. Proceedings of the National
Academy of Sciences of the United States of America 102, 18040-18045.
Gibson G, Dworkin I (2004) Uncovering cryptic genetic variation. Nat Rev Genet 5, 681-690.
Gilbert DA, Lehman N, O'Brien SJ, Wayne RK (1990) Genetic fingerprinting reflects population
differentiation in the California Channel Island fox. Nature 344, 764-767.
Glynn PW, Ault JS (2000) A biogeographic analysis and review of the far eastern Pacific coral reef
region. Coral Reefs 19, 1-23.
Glynn PW, Wellington GM (1983) Corals and coral reefs of the Galápagos Islands Univ of California
Press, Berkeley, CA.
Goldstein DB, Ruiz Linares A, Cavalli-Sforza LL, Feldman MW (1995) Genetic absolute dating based
on microsatellites and the origin of modern humans. Proceedings of the National Academy of
Sciences 92, 6723-6727.
Gómez A, Wright PJ, Lunt DH, et al. (2007) Mating trials validate the use of DNA barcoding to reveal
cryptic speciation of a marine bryozoan taxon. Proceedings of the Royal Society B: Biological
Sciences 274, 199-207.
González-Wevar CA, Nakano T, Cañete JI, Poulin E (2010) Molecular phylogeny and historical
biogeography of Nacella (Patellogastropoda: Nacellidae) in the Southern Ocean. Molecular
Phylogenetics and Evolution 56, 115-124.
Goudet J (2001) FSTAT, a program to estimate and test gene diversities and fixation indices (version
2.9.3). Lausanne University, Lausanne, Switzerland.
Graham JH, Emlen JM, Freeman DC (2003) Nonlinear dynamics and developmental instability. In:
Developmental Instability. Causes and Consequences (ed. Polak M). New York, Oxford Univ
Press.
Grant PR, Grant BR (2008) How and why species multiply: the radiation of Darwin's finches Princeton
University Press, Princeton, NJ.
Green J (1967) The distribution and variation of Daphnia lumholtzi (Crustacea: Cladocera) in relation
to fish predation in Lake Albert, East Africa. Journal of Zoology 151, 181-197.

References
96
Griffiths AM, Sims DW, Cotterell SP, et al. (2010) Molecular markers reveal spatially segregated
cryptic species in a critically endangered fish, the common skate (Dipturus batis). Proceedings
of the Royal Society of London B: Biological Sciences 277, 1497-1503.
Griffiths HJ (2010) Antarctic marine biodiversity ? What do we know about the distribution of life in
the Southern Ocean? Plos One 5, e11683.
Griffiths HJ, Barnes DKA, Linse K (2009) Towards a generalized biogeography of the Southern Ocean
benthos. Journal of Biogeography 36, 162-177.
Guichoux E, Garnier-Géré P, Lagache L, et al. (2013) Outlier loci highlight the direction of
introgression in oaks. Molecular Ecology 22, 450-462.
Guichoux E, Lagache L, Wagner S, et al. (2011) Current trends in microsatellite genotyping. Molecular
Ecology Resources 11, 591-611.
Guindon S, Gascuel O (2003) A simple, fast, and accurate algorithm to estimate large phylogenies by
maximum likelihood. Systematic Biology 52, 696-704.
Guisan A, Thuiller W (2005) Predicting species distribution: offering more than simple habitat models.
Ecology Letters 8, 993-1009.
Gutt J, Helsen E, Arntz WE, Buschmann A (1999) Biodiversity and community structure of the mega-
epibenthos in the Magellan region (South America). Scientia Marina 63, 155-170.
Gutt J, Sirenko BI, Smirnov IS, Arntz WE (2004) How many macrozoobenthic species might inhabit
the Antarctic shelf? Antarctic Science 16, 11-16.
Hajibabaei M, Singer GA, Hebert PD, Hickey DA (2007) DNA barcoding: how it complements
taxonomy, molecular phylogenetics and population genetics. Trends in genetics : TIG 23, 167-
172.
Hammer Ø, Harper D, Ryan P (2001) PAST: Paleontological Statistics Software Package for education
and data analysis. 4, 9.
Harr B (2006) Genomic islands of differentiation between house mouse subspecies. Genome Research
16, 730-737.
Harris KDM, Bartlett NJ, Lloyd VK (2012) Daphnia as an Emerging Epigenetic Model Organism.
Genetics Research International 2012, 8.
Hart MW, Sunday J (2007) Things fall apart: biological species form unconnected parsimony networks.
Biology Letters 3, 509-512.
Hasegawa M, Kishino H, Yano T-a (1985) Dating of the human-ape splitting by a molecular clock of
mitochondrial DNA. Journal of Molecular Evolution 22, 160-174.
Hausdorf B (2011) Progress toward a general species concept. Evolution 65, 923-931.
Hausdorf B, Hennig C (2010) Species Delimitation Using Dominant and Codominant Multilocus
Markers. Systematic Biology 59, 491-503.
References
97
Hausdorf B, Wilkens H, Strecker U (2011) Population genetic patterns revealed by microsatellite data
challenge the mitochondrial DNA based taxonomy of Astyanax in Mexico (Characidae,
Teleostei). Molecular Phylogenetics and Evolution 60, 89-97.
Hayden MJ, Nguyen TM, Waterman A, Chalmers KJ (2008) Multiplex-Ready PCR: A new method for
multiplexed SSR and SNP genotyping. Bmc Genomics 9, 1-12.
Haye P, Salinas P, Acuna E, Poulin E (2010) Heterochronic phenotypic plasticity with lack of genetic
differentiation in the southeastern pacific squat lobster pleuroncodes monodon. Evolution &
Development 12, 627 - 633.
Hebert PDN, Cywinska A, Ball SL, DeWaard JR (2003) Biological identifications through DNA
barcodes. Proceedings of the Royal Society B-Biological Sciences 270, 313-321.
Hebert PDN, Gregory TR (2005) The Promise of DNA Barcoding for Taxonomy. Systematic Biology
54, 852-859.
Hebert PDN, Penton EH, Burns JM, Janzen DH, Hallwachs W (2004) Ten species in one: DNA
barcoding reveals cryptic species in the neotropical skipper butterfly Astraptes fulgerator.
Proceedings of the National Academy of Sciences of the United States of America 101, 14812-
14817.
Hedrick PW (1999) Perspective: highly variable loci and their interpretation in evolution and
conservation. Evolution 53, 313-318.
Hedrick PW (2005) A standardized genetic differentiation measure. Evolution 59, 1633-1638.
Held C (2003) Molecular evidence for cryptic speciation within the widespread Antarctic crustacean
Ceratoserolis trilobitoides (Crustacea, Isopoda). Antarctic biology in a global context, 135–
139.
Held C, Leese F (2007) The utility of fast evolving molecular markers for studying speciation in the
Antarctic benthos. Polar Biology 30, 513-521.
Hellberg ME, Burton RS, Neigel JE, Palumbi SR (2002) Genetic assessment of connectivity among
marine populations. Bulletin of Marine Science 70, 273-290.
Hemery LG, Eléaume M, Roussel V, et al. (2012) Comprehensive sampling reveals circumpolarity and
sympatry in seven mitochondrial lineages of the Southern Ocean crinoid species
Promachocrinus kerguelensis (Echinodermata). Molecular Ecology 21, 2502-2518.
Hemmer-Hansen J, Nielsen EE, Frydenberg J, Loeschcke V (2007) Adaptive divergence in a high gene
flow environment: Hsc70 variation in the European flounder (Platichthys flesus L.). Heredity
99, 592-600.
Hendrickx ME (2003) The temperate species of the genus Munida Leach (Crustacea, Decapoda,
Galatheidae) in the east Pacific, with the description of a new species and additional records
for tropical-subtropical species. Bulletin de l’Institut royal des Sciences naturelles de Belgique
73, 115-136.

References
98
Hendry AP, Bolnick DI, Berner D, Peichel CL (2009) Along the speciation continuum in sticklebacks.
Journal of Fish Biology 75, 2000-2036.
Huelsenbeck JP, Andolfatto P (2007) Inference of population structure under a Dirichlet process model.
Genetics 175, 1787-1802.
Hughes TP, Bellwood DR, Connolly SR (2002) Biodiversity hotspots, centres of endemicity, and the
conservation of coral reefs. Ecology Letters 5, 775-784.
Hunter RL, Halanych KM (2008) Evaluating Connectivity in the Brooding Brittle Star Astrotoma
agassizii across the Drake Passage in the Southern Ocean. Journal of Heredity 99, 137-148.
Hurlbert SH (1971) The nonconcept of species diversity: a critique and alternative parameters. Ecology
52, 577-586.
Huxley TH (1868) On the classification and distribution of the Alectoromorphae and Heteromorphae.
Proceedings of the Zoological Society of London, 294-319.
Ilves KL, Taylor EB (2008) Evolutionary and biogeographical patterns within the smelt genus
Hypomesus in the North Pacific Ocean. Journal of Biogeography 35, 48-64.
Irwin DE, Bensch S, Irwin JH, Price TD (2005) Speciation by distance in a ring species. Science 307,
414-416.
Jaenisch R, Bird A (2003) Epigenetic regulation of gene expression: how the genome integrates intrinsic
and environmental signals. Nat Genet.
Jakobsson M, Rosenberg NA (2007) CLUMPP: a cluster matching and permutation program for dealing
with label switching and multimodality in analysis of population structure. Bioinformatics 23,
1801-1806.
Jansen RPS (2000) Germline passage of mitochondria: quantitative considerations and possible
embryological sequelae. Human Reproduction 15, 112-128.
Jarrett JN (2008) Inter-population variation in shell morphology of the barnacle. Journal of Crustacean
Biology 28, 16-20.
Jarrett JN (2009) Predator-induced defense in the barnacle. Journal of Crustacean Biology 29, 329-333.
Jensen J, Bohonak A, Kelley S (2005) Isolation by distance, web service. Bmc Genetics 6, 13.
Johannsen W (1911) The genotype conception of heredity. The American Naturalist 45, 129-159.
Johnson TC, Kelts K, Odada E (2000) The Holocene history of Lake Victoria. AMBIO: A Journal of
the Human Environment 29, 2-11.
Kass RE, Raftery AE (1995) Bayes factors. Journal of the American Statistical Association 90, 773-
795.
Keller I, Wagner CE, Greuter L, et al. (2013) Population genomic signatures of divergent adaptation,
gene flow and hybrid speciation in the rapid radiation of Lake Victoria cichlid fishes. Molecular
Ecology 22, 2848-2863.
Klass M, Wolf N, Hirsh D (1976) Development of the male reproductive system and sexual
transformation in the nematode Caenorhabditis elegans. Developmental Biology 52, 1-18.

References
99
Knowles LL, Carstens BC (2007) Delimiting species without monophyletic gene trees. Systematic
Biology 56, 887-895.
Knowlton N (2000) Molecular genetic analyses of species boundaries in the sea. Hydrobiologia 420,
73-90.
Knox GA (2006) Biology of the Southern Ocean CRC Press, Boca Raton, FL.
Konijnendijk N, Joyce DA, Mrosso HDJ, Egas M, Seehausen O (2011) Community genetics reveal
elevated levels of sympatric gene flow among morphologically similar but not among
morphologically dissimilar species of Lake Victoria cichlid fish. International Journal of
Evolutionary Biology 2011, 12.
Kornfield I, Smith PF (2000) African cichlid fishes: Model systems for evolutionary biology. Annual
Review of Ecology and Systematics 31, 163-196.
Koumoundouros G, Pavlidis M, Anezaki L, et al. (2002) Temperature sex determination in the European
sea bass, Dicentrarchus labrax (L., 1758) (Teleostei, Perciformes, Moronidae): Critical
sensitive ontogenetic phase. Journal of Experimental Zoology 292, 573-579.
Krabbe K, Leese F, Mayer C, Tollrian R, Held C (2009) Cryptic mitochondrial lineages in the
widespread pycnogonid Colossendeis megalonyx Hoek, 1881 from Antarctic and Subantarctic
waters. Polar Biology 33, 281-292.
Kraemer L, Beszteri B, G bler-Schwarz S, et al. (2009) STAMP: Extensions to the STADEN sequence
analysis package for high throughput interactive microsatellite marker design. Bmc
Bioinformatics 10, 41.
Lagerberg T (1906) Anomura und Brachyura der Schwedischen Südpolar Expedition. Wissenschaftliche
Ergebnisse der Schwedischen Südpolar Expedition 1901-1903 5, 6-10.
Lajus DL, Alekseev VR (2004) Phenotypic variation and developmental instability of life-history traits:
a theory and a case study on within-population variation of resting eggs formation in Daphnia.
2004, 8.
Landry P-A, Koskinen MT, Primmer CR (2002) Deriving evolutionary relationships among populations
using microsatellites and (δμ)2: All loci are equal, but some are more equal than others ….
Genetics 161, 1339-1347.
Lang JW, Andrews HV (1994) Temperature-dependent sex determination in crocodilians. Journal of
Experimental Zoology 270, 28-44.
Larmuseau MHD, Huyse T, Vancampenhout K, Van Houdt JKJ, Volckaert FAM (2010) High molecular
diversity in the rhodopsin gene in closely related goby fishes: A role for visual pigments in
adaptive speciation? Molecular Phylogenetics and Evolution 55, 689-698.
Latinne A, Waengsothorn S, Rojanadilok P, et al. (2012) Combined mitochondrial and nuclear markers
revealed a deep vicariant history for Leopoldamys neilli, a cave-dwelling rodent of Thailand.
Plos One 7, e47670.

References
100
Le Rouzic A, Carlborg Ö (2008) Evolutionary potential of hidden genetic variation. Trends in Ecology
& Evolution 23, 33-37.
Lee CW, Song J-H, Min G-S, Kim S (2016) The complete mitochondrial genome of squat lobster,
Munida gregaria (Anomura, Galatheoidea, Munididae). Mitochondrial DNA Part B, 1-3.
Leese F, Agrawal S, Held C (2010) Long-distance island hopping without dispersal stages:
transportation across major zoogeographic barriers in a Southern Ocean isopod.
Naturwissenschaften 97, 583-594.
Leese F, Held C (2008) Identification and characterization of microsatellites from the Antarctic isopod
Ceratoserolis trilobitoides: nuclear evidence for cryptic species. Conservation Genetics 9,
1369-1372.
Leese F, Mayer C, Held C (2008) Isolation of microsatellites from unknown genomes using known
genomes as enrichment templates. Limnology & Oceanography: Methods 6, 412-426.
Leese FM, C; Held, C (2008) Isolation of microsatellites from unknown genomes using known genomes
as enrichment templates.
Lefébure T, Douady CJ, Gouy M, Gibert J (2006) Relationship between morphological taxonomy and
molecular divergence within Crustacea: proposal of a molecular threshold to help species
delimitation. Molecular Phylogenetics and Evolution 40, 435-447.
Lessios HA, Kane J, Robertson DR (2003) Phylogeography of the pantropical sea urchin tripneustes:
contrasting patterns of population structure between oceans. Evolution 57, 2026-2036.
Lessios HA, Robertson DR (2006) Crossing the impassable: genetic connections in 20 reef fishes across
the eastern Pacific barrier. Proceedings of the Royal Society of London B: Biological Sciences
273, 2201-2208.
Lester SE, Ruttenberg BI, Gaines SD, Kinlan BP (2007) The relationship between dispersal ability and
geographic range size. Ecology Letters 10, 745-758.
Librado P, Rozas J (2009) DnaSP v5: a software for comprehensive analysis of DNA polymorphism
data. Bioinformatics 25, 1451-1452.
Liebers D, De Knijff P, Helbig AJ (2004) The herring gull complex is not a ring species. Proceedings
of the Royal Society of London B: Biological Sciences 271, 893-901.
Litt M, Luty JA (1989) A hypervariable microsatellite revealed by in vitro amplification of a
dinucleotide repeat within the cardiac muscle actin gene. American Journal of Human Genetics
44, 397-401.
Loh Y-HE, Katz LS, Mims MC, et al. (2008) Comparative analysis reveals signatures of differentiation
amid genomic polymorphism in Lake Malawi cichlids. Genome Biology 9, 1-12.
Lohman DJ, de Bruyn M, Page T, et al. (2011) Biogeography of the Indo-Australian Archipelago.
Annual Review of Ecology, Evolution, and Systematics 42, 205-226.
Loughry WJ, McDonough CM (2002) Phenotypic variablity within and between litters of nine-banded
armadillos. Southeastern Naturalist 1, 287-298.

References
101
Lovrich G, Casalinuovo M, Molina S, Cárcamo C, Pierotti R (1998) Las langostillas Munida subrugosa
y M. gregaria (Decapoda, Anomura) como potencial recurso economico Patagonico.[The
galatheid crabs Munida subrugosa and M. gregaria (Decapoda, Anomura) as Patagonian
potential economic resource]. Naturalia Patagónica. Ciencias Biológicas 89, 92.
Luiz OJ, Madin JS, Robertson DR, et al. (2012) Ecological traits influencing range expansion across
large oceanic dispersal barriers: insights from tropical Atlantic reef fishes. Proceedings of the
Royal Society of London B: Biological Sciences 279, 1033-1040.
MacKenzie AL, Harwood T (2014) Grazing on a toxic Alexandrium catenella bloom by the lobster krill
Munida gregaria (Decapoda: Galatheoidea: Munididae). Harmful Algae 39, 161-164.
Macpherson E, Richer de Forges B, Schnabel K, et al. (2010) Biogeography of the deep-sea galatheid
squat lobsters of the Pacific Ocean. Deep Sea Research Part I: Oceanographic Research Papers
57, 228-238.
Magalhaes IS, Mwaiko S, Schneider MV, Seehausen O (2009) Divergent selection and phenotypic
plasticity during incipient speciation in Lake Victoria cichlid fish. Journal of Evolutionary
Biology 22, 260-274.
Makarov RR, Maslennikov VV (1981) Ecology of larval development of the crustacean Euphausia
superba. Change in dominant larval forms as a function of environmental conditions. Marine
Ecology Progress Series 4, 265-271.
Malausa T, Gilles A, MeglÉCz E, et al. (2011) High-throughput microsatellite isolation through 454
GS-FLX Titanium pyrosequencing of enriched DNA libraries. Molecular Ecology Resources
11, 638-644.
Mallet J (1995) A species definition for the modern synthesis. Trends in Ecology & Evolution 10, 294-
299.
Mallet J (2005) Hybridization as an invasion of the genome. Trends in Ecology & Evolution 20, 229 -
237.
Mallet J (2008) Hybridization, ecological races and the nature of species: empirical evidence for the
ease of speciation. Philosophical Transactions of the Royal Society of London B: Biological
Sciences 363, 2971-2986.
Marchinko KB (2003) Dramatic phenotypic plasticity in barnacle legs (Balanus glandula darwin):
magnitude, age dependence, and speed of response. Evolution 57, 1281-1290.
Matthews LH (1932) Lobster-krill. Discovery Reports 5, 467-484.
Maynard Smith J (1962) Disruptive selection, polymorphism and sympatric speciation. Nature 195, 60-
62.
Maynard Smith J (1966) Sympatric speciation. American Naturalist, 637-650.
Mayr E (1942) Systematics and the origin of species, from the viewpoint of a zoologist. Columbia
University Press, New York
Mayr E (1947) Ecological Factors in Speciation. Evolution 1, 263-288.
References
102
Mayr E (1954) Change of genetic environment and evolution. In: Evolution as a Process (eds Huxley
J, Hardy AC, Ford EB), 157-180.
Mayr E (1963) Animal species and evolution Belknap Press of Harvard University Press Cambridge.
Mazaud A, Michel E, Dewilde F, Turon JL (2010) Variations of the Antarctic Circumpolar Current
intensity during the past 500 ka. Geochemistry, Geophysics, Geosystems 11, Q08007.
McCartney MA, Keller G, Lessios HA (2000) Dispersal barriers in tropical oceans and speciation in
Atlantic and eastern Pacific sea urchins of the genus Echinometra. Molecular Ecology 9, 1391-
1400.
McClatchie S, Jillett JB, Gerring P (1991) Observations of gulls foraging on beach-stranded plankton
in Otago Harbor, New Zealand. Limnology and Oceanography 36, 1195-1200.
McDowall RM (1970) The galaxiid fishes of New Zealand Museum of Comparative Zoology, Harvard
University, Cambridge, MA.
Mcdowall RM (1978) Generalized tracks and dispersal in biogeography. Systematic Zoology 27, 88-
104.
Meirmans PG (2006) Using the AMOVA framework to estimate a standardized genetic differentiation
measure. Evolution 60, 2399-2402.
Meyer CP, Paulay G (2005) DNA barcoding: Error rates based on comprehensive sampling. Plos
Biology 3, e422.
Mishler BD (1985) The Morphological, Developmental, and Phylogenetic Basis of Species Concepts
in Bryophytes. The Bryologist 88, 207-214.
Mobley KB, Lussetti D, Johansson F, Englund G, Bokma F (2011) Morphological and genetic
divergence in Swedish postglacial stickleback (Pungitius pungitius) populations. Bmc
Evolutionary Biology 11, 1-18.
Moritz C, Cicero C (2004) DNA barcoding: Promise and pitfalls. Plos Biology 2, e354.
Müller CB, Williams IS, Hardie J (2001) The role of nutrition, crowding and interspecific interactions
in the development of winged aphids. Ecological Entomology 26, 330-340.
Mullis K, Faloona F, Scharf S, et al. (1986) Specific Enzymatic Amplification of DNA In Vitro: The
Polymerase Chain Reaction. Cold Spring Harbor Symposia on Quantitative Biology 51, 263-
273.
Mzighani SI, Nikaido M, Takeda M, et al. (2010) Genetic variation and demographic history of the
Haplochromis laparogramma group of Lake Victoria—An analysis based on SINEs and
mitochondrial DNA. Gene 450, 39-47.
Nance HA, Klimley P, Galván-Magaña F, Martínez-Ortíz J, Marko PB (2011) Demographic processes
underlying subtle patterns of population structure in the scalloped hammerhead shark, sphyrna
lewini. Plos One 6, e21459.
Nei M (1987) Molecular evolutionary genetics. Columbia University Press, New York.

References
103
Nishida M, Lucas JS (1988) Genetic differences between geographic populations of the Crown-of-
thorns starfish throughout the Pacific region. Marine Biology 98, 359-368.
Nolte AW, Stemshorn KC, Tautz D (2005) Direct cloning of microsatellite loci from Cottus gobio
through a simplified enrichment procedure. Molecular Ecology Notes 5, 628-636.
Nosil P (2012) Ecological speciation Oxford University Press, Oxford.
Nosil P, Funk DJ, Ortiz-Barrientos D (2009) Divergent selection and heterogeneous genomic
divergence. Molecular Ecology 18, 375-402.
Odling-Smee FJ, Laland KN, Feldman MW (2003) Niche construction: the neglected process in
evolution Princeton University Press, Princeton, NJ.
Padilla DK (1998) Inducible phenotypic plasticity of the radula in Lacuna (Gastropoda: Littorinidae).
Veliger 41, 201-204.
Paetkau D, Slade R, Burden M, Estoup A (2004) Genetic assignment methods for the direct, real-time
estimation of migration rate: a simulation-based exploration of accuracy and power. Molecular
Ecology 13, 55-65.
Page TJ, Hughes JM (2010) Comparing the performance of multiple mitochondrial genes in the analysis
of Australian freshwater fishes. Journal of Fish Biology 77, 2093-2122.
Palumbi SR (1994) Genetic Divergence, Reproductive Isolation, and Marine Speciation. Annual Review
of Ecology and Systematics 25, 547-572.
Palumbi SR (2003) Population genetics, demographic connectivity, and the design of marine reserves
Ecological Applications 13, 146-158.
Parejko K, Dodson SI (1991) The evolutionary ecology of an antipredator reaction norm: Daphnia pulex
and Chaoborus americanus. Evolution 45, 1665-1674.
Parsons KJ, Robinson BW (2007) Foraging performance of diet-induced morphotypes in pumpkinseed
sunfish (Lepomis gibbosus) favours resource polymorphism. Journal of Evolutionary Biology
20, 673-684.
Peakall R, Smouse PE (2006) GENALEX 6: genetic analysis in Excel. Population genetic software for
teaching and research. Molecular Ecology Notes 6, 288-295.
Peakall R, Smouse PE (2012) GenAlEx 6.5: genetic analysis in Excel. Population genetic software for
teaching and research—an update. Bioinformatics 28, 2537-2539.
Peaston AE, Whitelaw E (2006) Epigenetics and phenotypic variation in mammals. Mammalian
Genome 17, 365-374.
Perez-Barros P, Calcagno JA, Lovrich GA (2011) Absence of a prezygotic behavioural barrier to gene
flow between the two sympatric morphs of the squat lobster Munida gregaria (Fabricius, 1793)
(Decapoda: Anomura: Galatheidae). Helgoland Marine Research 65, 513-523.
Pérez-Barros P, D'Amato ME, Guzmán NV, Lovrich GA (2008) Taxonomic status of two South
American sympatric squat lobsters, Munida gregaria and Munida subrugosa (Crustacea:
References
104
Decapoda: Galatheidae), challenged by DNA sequence information. Biological Journal of the
Linnean Society 94, 421-434.
Perez Barros P, Tapella F, Romero M, Calagno JA, Lovrich GA (2004) Benthic decapod crustaceans
associated with captures of Munida spp.(Decapoda: Anomura) in the Beagle Channel,
Argentina. Scientia Marina 68, 237-246.
Petit RJ, El Mousadik A, Pons O (1998) Identifying populations for conservation on the basis of genetic
markers. Conservation biology 12, 844-855.
Petit RJ, Excoffier L (2009) Gene flow and species delimitation. Trends in Ecology & Evolution 24,
386-393.
Pigliucci M, Murren CJ, Schlichting CD (2006) Phenotypic plasticity and evolution by genetic
assimilation. Journal of Experimental Biology 209, 2362-2367.
Piry S, Alapetite A, Cornuet J-M, et al. (2004) GENECLASS2: A software for genetic assignment and
first-generation migrant detection. Journal of Heredity 95, 536-539.
Pons JM, Sonsthagen S, Dove C, Crochet PA (2014) Extensive mitochondrial introgression in North
American Great Black-backed Gulls (Larus marinus) from the American Herring Gull (Larus
smithsonianus) with little nuclear DNA impact. Heredity 112, 226-239.
Pritchard JK, Stephens M, Donnelly P (2000) Inference of population structure using multilocus
genotype data. Genetics 155, 945-959.
Prospero S, Grünwald NJ, Winton LM, Hansen EM (2009) Migration patterns of the emerging plant
pathogen Phytophthora ramorum on the west coast of the United States of America.
Phytopathology 99, 739-749.
R Core Team (2015) R: A language and environment for statistical computing. R Foundation for
Statistical Computing, Vienna, Austria.
Raeymaekers JAM, Maes GE, Audenaert E, Volckaert FAM (2005) Detecting Holocene divergence in
the anadromous–freshwater three-spined stickleback (Gasterosteus aculeatus) system.
Molecular Ecology 14, 1001-1014.
Ramírez-Soriano A, Ramos-Onsins SE, Rozas J, Calafell F, Navarro A (2008) Statistical power analysis
of neutrality tests under demographic expansions, contractions and bottlenecks with
recombination. Genetics 179, 555-567.
Ramos-Onsins SE, Rozas J (2002) Statistical properties of new neutrality tests against population
growth. Molecular Biology and Evolution 19, 2092-2100.
Raxworthy CJ, Ingram CM, Rabibisoa N, Pearson RG (2007) Applications of ecological niche
modeling for species delimitation: A review and empirical evaluation using day geckos
(Phelsuma) from Madagascar. Systematic Biology 56, 907-923.
Raymond M, Rousset F (1995) An exact test for population differentiation. Evolution 49, 1280-1283.
Rayner GW (1935) The Falkland species of the crustacean genus Munida Discovery Report.

References
105
Reed DH, Frankham R (2001) How closely correlated are molecular and quantitative measures of
genetic variation? A meta-analysis. Evolution 55, 1095-1103.
Retamal MA (1981) Catálogo ilustrado de los crustáceos decápodos de Chile. Gayana Zoología 44, 1-
110.
Retamal MA (2000) Decápodos de Chile World Biodiversity Database CD-ROM Series.
Rice WR (1989) Analyzing tables of statistical tests. Evolution 43, 223-225.
Rieseberg LH (2001) Chromosomal rearrangements and speciation. Trends in Ecology & Evolution 16,
351-358.
Roberts PE (1973) Larvae of Munida subrugosa (White), 1847, from Perseverance Harbour, Campbell
Island. Journal of the Royal Society of New Zealand 3, 393-408.
Robertson DR, Grove JS, McCosker JE (2004) Tropical transpacific shore fishes. Pacific Science 58,
507-565.
Rogers A, Harpending H (1992) Population growth makes waves in the distribution of pairwise genetic
differences. Molecular Biology and Evolution 9, 552 - 569.
Römer U, Beisenherz W (1996) Environmental determination of sex in Apistogrammai (Cichlidae) and
two other freshwater fishes (Teleostei). Journal of Fish Biology 48, 714-725.
Romero MC, Lovrich GA, Tapella F, Thatje S (2004) Feeding ecology of the crab Munida subrugosa
(Decapoda: Anomura: Galatheidae) in the Beagle Channel, Argentina. Journal of the Marine
Biological Association of the UK 84, 359-365.
Rosen BR, Smith AB (1988) Tectonics from fossils? Analysis of reef-coral and sea-urchin distributions
from late Cretaceous to Recent, using a new method. Geological Society, London, Special
Publications 37, 275-306.
Rosenberg NA (2004) DISTRUCT: a program for the graphical display of population structure.
Molecular Ecology Notes 4, 137-138.
Rosenblatt RH, Waples RS (1986) A genetic comparison of allopatric populations of shore fish species
from the eastern and central pacific ocean: Dispersal or vicariance? Copeia 1986, 275-284.
Roughgarden J, Iwasa Y, Baxter C (1985) Demographic theory for an open marine population with
space-limited recruitment. Ecology 66, 54-67.
Rousset F (1997) Genetic differentiation and estimation of gene flow from F-statistics under isolation
by distance. Genetics 145, 1219-1228.
Rubinoff D, Cameron S, Will K (2006) A genomic perspective on the shortcomings of mitochondrial
DNA for “barcoding” identification. Journal of Heredity 97, 581-594.
Rundle HD, Nosil P (2005) Ecological speciation. Ecology Letters 8, 336-352.
Ryman N, Palm S (2006) POWSIM: a computer program for assessing statistical power when testing
for genetic differentiation. Molecular Ecology Notes 6, 600-602.
Saez AG, Lozano E (2005) Body doubles. Nature 433, 111-111.
References
106
Salzburger W, Meyer A (2004) The species flocks of East African cichlid fishes: recent advances in
molecular phylogenetics and population genetics. Naturwissenschaften 91, 277-290.
Sands CJ, Lancaster ML, Austin JJ, Sunnucks P (2009) Single copy nuclear DNA markers for the
onychophoran Phallocephale tallagandensis. Conservation Genetics Resources 1, 17-19.
Sanford E, Kelly MW (2011) Local adaptation in marine invertebrates. Annual Review of Marine
Science 3, 509-535.
Santana QC, Coetzee MPA, Steenkamp ET, et al. (2009) Microsatellite discovery by deep sequencing
of enriched genomic libraries. Biotechniques 46, 217-223.
Schliewen U, Rassmann K, Markmann M, et al. (2001) Genetic and ecological divergence of a
monophyletic cichlid species pair under fully sympatric conditions in Lake Ejagham, Cameroon.
Mol Ecol 10, 1471-1488.
Schliewen UK, Tautz D, Paabo S (1994) Sympatric speciation suggested by monophyly of crater lake
cichlids. Nature 368, 629-632.
Schlötterer C (2004) The evolution of molecular markers—just a matter of fashion? Nature Reviews
Genetics 5, 63-69.
Schlötterer C, Wiehe T (1999) Microsatellites, a neutral marker to infer selective sweeps. In:
Microsatellites (eds. Goldstein DB, Schlötterer C), pp. 238-248. Oxford University Press,
Oxford.
Schluter D (2001) Ecology and the origin of species. Trends in Ecology & Evolution 16, 372-380.
Schluter D, Conte GL (2009) Genetics and ecological speciation. Proceedings of the National Academy
of Sciences 106, 9955-9962.
Schnabel KE, Ahyong ST, Maas EW (2011) Galatheoidea are not monophyletic – Molecular and
morphological phylogeny of the squat lobsters (Decapoda: Anomura) with recognition of a new
superfamily. Molecular Phylogenetics and Evolution 58, 157-168.
Schubart CD, Diesel R, Hedges SB (1998) Rapid evolution to terrestrial life in Jamaican crabs. Nature
393, 363-365.
Scowcroft WR (1985) Somaclonal variation: the myth of clonal uniformity. In: Genetic flux in plants
(eds. Hohn B, Dennis ES), pp. 217-245. Springer, Wien.
Seehausen O, Terai Y, Magalhaes IS, et al. (2008) Speciation through sensory drive in cichlid fish.
Nature 455, 620-626.
Selkoe K, Toonen RJ (2011) Marine connectivity: a new look at pelagic larval duration and genetic
metrics of dispersal. Marine Ecology Progress Series 436, 291-305.
Selkoe KA, Toonen RJ (2006a) Microsatellites for ecologists: a practical guide to using and evaluating
microsatellite markers. Ecology Letters 9, 615-629.
Selkoe KA, Toonen RJ (2006b) Microsatellites for ecologists: a practical guide to using and evaluating
microsatellite markers. Ecology Letters 9, 615-629.
References
107
Shaffer HB, Thomson RC (2007) Delimiting species in recent radiations. Systematic Biology 56, 896-
906.
Shanks AL (2009) Pelagic larval duration and dispersal distance revisited. The Biological Bulletin 216,
373-385.
Shearer TL, Coffroth MA (2008) DNA barcoding: Barcoding corals: limited by interspecific divergence,
not intraspecific variation. Molecular Ecology Resources 8, 247-255.
Sites JW, Marshall JC (2004) Operational criteria for delimiting species. Annual Review of Ecology
Evolution and Systematics 35, 199-227.
Slatkin M (1995) A measure of population subdivision based on microsatellite allele frequencies.
Genetics 139, 457-462.
Smith KK (2001) Heterochrony revisited: the evolution of developmental sequences. Biological
Journal of the Linnean Society 73, 169-186.
Song H, Buhay JE, Whiting MF, Crandall KA (2008) Many species in one: DNA barcoding
overestimates the number of species when nuclear mitochondrial pseudogenes are coamplified.
Proceedings of the National Academy of Sciences 105, 13486-13491.
Sorte CJB, Williams SL, Carlton JT (2010) Marine range shifts and species introductions: comparative
spread rates and community impacts. Global Ecology and Biogeography 19, 303-316.
Spanier KI, Leese F, Mayer C, et al. (2010) Predator-induced defences in Daphnia pulex: Selection and
evaluation of internal reference genes for gene expression studies with real-time PCR. Bmc
Molecular Biology 11, 1-11.
Stibor H, Lüning J (1994) Predator-induced phenotypic variation in the pattern of growth and
reproduction in Daphnia hyalina (Crustacea: Cladocera). Functional Ecology 8, 97-101.
Szpiech ZA, Jakobsson M, Rosenberg NA (2008) ADZE: a rarefaction approach for counting alleles
private to combinations of populations. Bioinformatics 24, 2498-2504.
Tajima F (1989) The effect of change in population size on DNA polymorphism. Genetics 123, 597-
601.
Takeda M, Kusumi J, Mizoiri S, et al. (2013) Genetic structure of pelagic and littoral cichlid fishes from
Lake Victoria. Plos One 8, e74088.
Tamura K, Nei M (1993) Estimation of the number of nucleotide substitutions in the control region of
mitochondrial DNA in humans and chimpanzees. Molecular Biology and Evolution 10, 512-
526.
Tamura K, Peterson D, Peterson N, et al. (2011) MEGA5: molecular evolutionary genetics analysis
using maximum likelihood, evolutionary distance, and maximum parsimony methods.
Molecular Biology and Evolution 28, 2731-2739.
Tapella F (2002) Reproducción, crecimiento, distribución y abundancia de la langostilla Munida
subrugosa (Anomura: Galatheidae) del Canal Beagle, Tierra del Fuego, Argentina. DPhil
Thesis, Universidad Nacional de Córdoba.

References
108
Tapella F, Lovrich GA (2006) Morphological differences between 'subrugosa' and 'gregaria' morphs of
adult Munida (Decapoda: Anomura: Galatheidae) from the Beagle Channel, southern South
America. Journal of the Marine Biological Association of the United Kingdom 86, 1149-1155.
Tapella F, Lovrich GA, Romero MC, Thatje S (2002a) Reproductive biology of the crab Munida
subrugosa (Decapoda: Anomura: Galatheidae) in the Beagle Channel, Argentina. Journal of the
Marine Biological Association of the UK 82, 589-595.
Tapella F, Romero MC, Lovrich GA, Chizzini A (2002b) Life history of the galatheid crab Munida
subrugosa in subantarctic waters of the Beagle Channel, Argentina. Crabs in cold waters
regions: biology, management, and economics. University of Alaska Sea Grant, AK-SG-02-01,
Fairbanks, 115-134.
Tautz D (1993) Notes on the definition and nomenclature of tandemly repetitive DNA sequences. In:
DNA Fingerprinting: State of the Science (eds. Pena SDJ, Chakraborty R, Epplen JT, Jeffreys
AJ), pp. 21-28. Birkhäuser Basel, Basel.
Tittensor DP, Mora C, Jetz W, et al. (2010) Global patterns and predictors of marine biodiversity across
taxa. Nature 466, 1098-1101.
Toews DPL, Brelsford A (2012) The biogeography of mitochondrial and nuclear discordance in animals.
Molecular Ecology 21, 3907-3930.
Tollrian R, Harvell CD (1999) The ecology and evolution of inducible defenses Princeton University
Press.
Tollrian R, Leese F (2010) Ecological genomics: steps towards unraveling the genetic basis of inducible
defenses in Daphnia. Bmc Biology 8, 1-4.
Tóth G, Gáspári Z, Jurka J (2000) Microsatellites in different eukaryotic genomes: Survey and analysis.
Genome Research 10, 967-981.
Trussell GC (1996) Phenotypic plasticity in an intertidal snail: the role of a common crab predator.
Evolution 50, 448-454.
Turelli M, Barton NH, Coyne JA (2001) Theory and speciation. Trends in Ecology & Evolution 16, 330-
343.
Turner GF, Seehausen O, Knight ME, Allender CJ, Robinson RL (2001) How many species of cichlid
fishes are there in African lakes? Molecular Ecology 10, 793-806.
Turner TL, Hahn MW, Nuzhdin SV (2005) Genomic islands of speciation in Anopheles gambiae. Plos
Biology 3, e285.
Valentini A, Pompanon F, Taberlet P (2009) DNA barcoding for ecologists. Trends in Ecology &
Evolution 24, 110-117.
Van Oosterhout C, Hutchinson WF, Wills DPM, Shipley P (2004) Micro-Checker: software for
identifying and correcting genotyping errors in microsatellite data. Molecular Ecology Notes 4,
535-538.
Van Valen L (1976) Ecological species, multispecies, and oaks. Taxon 25, 233-239.

References
109
Vanelslander B, Créach V, Vanormelingen P, et al. (2009) Ecological differentiation between sympatric
pseudocryptic species in the estuarine benthic diatom Navicula phyllepta (bacillariophyceae).
Journal of Phycology 45, 1278-1289.
Vanhaecke D, de Leaniz CG, Gajardo G, et al. (2012) DNA barcoding and microsatellites help species
delimitation and hybrid identification in endangered galaxiid fishes. Plos One 7, e32939.
Varisco M, Vinuesa J (2010) Occurrence of pelagic juveniles of Munida gregaria (fabricius, 1793)
(anomura, galatheidae) in San Jorge Gulf, Argentina. Crustaceana 83, 1147-1151.
Varisco M, Vinuesa JH (2015) Growth and reproduction investment of the young of the year of the
squat lobster Munida gregaria (Crustacea: Anomura) in the Patagonian coast. Scientia Marina
79, 345-353.
Varisco M, Vinuesa JH, Góngora M (2015) Bycatch of the squat lobster Munida gregaria in bottom
trawl fisheries in San Jorge Gulf, Argentina. Revista De Biologia Marina Y Oceanografia 50,
249-259.
Vences M, Thomas M, Bonett RM, Vieites DR (2005) Deciphering amphibian diversity through DNA
barcoding: chances and challenges. Philosophical Transactions of the Royal Society of London
B: Biological Sciences 360, 1859-1868.
Vermeij GJ (1978) Biogeography and adaptation: patterns of marine life Harvard University Press,
Cambridge, MA.
Vermeij GJ (2005) From Europe to America: Pliocene to Recent trans-Atlantic expansion of cold-water
North Atlantic molluscs. Proceedings of the Royal Society of London B: Biological Sciences
272, 2545-2550.
Vinuesa JH (1977) Aportes al conocimiento de los crustáceos decápodos de Tierra del Fuego, con
algunas observaciones zoogeográficas. Physis, Sec. A 36, 9-19.
Vinuesa JH, Varisco M (2007) Trophic ecology of the lobster krill Munida gregaria in San Jorge Gulf,
Argentina. Investigaciones marinas 35, 25-34.
Vogt G, Huber M, Thiemann M, et al. (2008) Production of different phenotypes from the same
genotype in the same environment by developmental variation. Journal of Experimental
Biology 211, 510-523.
Wada E, Terazaki M, Kabaya Y, Nemoto T (1987) 15N and 13C abundances in the Antartic Ocean with
emphasis on the biogeochemical structure of the food web. Deep Sea Research Part A.
Oceanographic Research Papers 34, 829-841.
Waddington CH (1961) Genetic Assimilation. In: Advances in Genetics (eds. Caspari EW, Thoday JM),
pp. 257-293. Academic Press.
Wagner CE, Keller I, Wittwer S, et al. (2013) Genome-wide RAD sequence data provide unprecedented
resolution of species boundaries and relationships in the Lake Victoria cichlid adaptive
radiation. Molecular Ecology 22, 787-798.
References
110
Wang C, Held C (2015) Isolation and characterization of 11 microsatellite markers from the squat
lobster Munida gregaria (Decapoda: Galatheidae) around the Falkland Islands/Islas Malvinas.
Conservation Genetics Resources 7, 147-149.
Wares JP (2010) Natural distributions of mitochondrial sequence diversity support new null hypotheses.
Evolution 64, 1136-1142.
Wares JP, Cunningham CW (2001) Phylogeography and historical ecology of the north Atlantic
intertidal. Evolution 55, 2455-2469.
Watson JD, Crick FH (1953) Molecular structure of nucleic acids; a structure for deoxyribose nucleic
acid. Nature 171, 737-738.
Weir BS, Cockerham CC (1984) Estimating F-statistics for the analysis of population structure.
Evolution 38, 1358-1370.
West-Eberhard MJ (2003) Developmental plasticity and evolution Oxford University Press, Oxford.
West-Eberhard MJ (2005) Developmental plasticity and the origin of species differences. Proceedings
of the National Academy of Sciences 102, 6543-6549.
Whitlock MC, McCauley DE (1999) Indirect measures of gene flow and migration: FST[ne]1/(4Nm+1).
Heredity 82, 117-125.
Whitman DW, Agrawal AA (2009) What is phenotypic plasticity and why is it important? In:
Phenotypic Plasticity of Insects (eds. Whitman DW, Ananthakrishnan TN), pp. 1-63. CRC Press,
Boca Raton, FL.
Whitmore TC (1981) Wallace's line and plate tectonics Clarendon Press, Oxford.
Whitworth T (1988) The Antarctic circumpolar current. Oceanus 31, 53-58.
Whitworth T, Dawson R, Magalon H, Baudry E (2007) DNA barcoding cannot reliably identify species
of the blowfly genus Protocalliphora (Diptera: Calliphoridae). Proceedings of the Royal
Society B: Biological Sciences 274, 1731-1739.
Wiemers M, Fiedler K (2007) Does the DNA barcoding gap exist?–a case study in blue butterflies
(Lepidoptera: Lycaenidae). Frontiers in Zoology 4, 1-16.
Williams BG (1973) The effect of the environment on the morphology of Munida gregaria
(Fabricius)(Decapoda, Anomura). Crustaceana, 197-210.
Williams BG (1980) The pelagic and benthic phases of post-metamorphic Munida gregaria (Fabricius)
(Decapoda, Anomura). Journal of Experimental Marine Biology and Ecology 42, 125-141.
Wilson GA, Rannala B (2003) Bayesian inference of recent migration rates using multilocus genotypes.
Genetics 163, 1177-1191.
Wilson NG, Maschek JA, Baker BJ (2013) A species flock driven by predation? Secondary metabolites
support diversification of slugs in Antarctica. Plos One 8, e80277.
Won Y-J, Sivasundar A, Wang Y, Hey J (2005) On the origin of Lake Malawi cichlid species: A
population genetic analysis of divergence. Proceedings of the National Academy of Sciences
102, 6581-6586.
References
111
WoRMS Editorial Board (2016) World Register of Marine Species. Society for the Management of
Electronic Biodiversity Data (SMEBD).
Wright S (1965) The interpretation of population structure by F-statistics with special regard to systems
of mating. Evolution, 395-420.
Wright S, Chase HB (1936) On the Genetics of the Spotted Pattern of the Guinea Pig. Genetics 21, 758-
787.
Wu C-I, Ting C-T (2004) Genes and speciation. Nature Reviews Genetics 5, 114-122.
Zakas C, Wares JP (2012) Consequences of a poecilogonous life history for genetic structure in coastal
populations of the polychaete Streblospio benedicti. Molecular Ecology 21, 5447-5460.
Zeldis JR (1985) Ecology of Munida gregaria (Decapoda, Anomura): Distribution and abundance,
population dynamics and fisheries. Marine Ecology Progress Series 22, 77-99.
Zeldis JR (1989) A fishery for Munida gregaria in New Zealand: ecological considerations N.Z. Fish.
Tech. Rep.
Zhang D-X (2004) Lepidopteran microsatellite DNA: redundant but promising. Trends in Ecology &
Evolution 19, 507-509.
Zupo V (2000) Effect of microalgal food on the sex reversal of Hippolyte inermis (Crustacea: Decapoda).
Marine Ecology Progress Series 201, 251-259.