HIGH INTENSITY LASER POWER BEAMING FOR...
146
HIGH INTENSITY LASER POWER BEAMING FOR WIRELESS POWER TRANSMISSION DANIEL EDWARD RAIBLE Bachelor of Electrical Engineering Cleveland State University May, 2006 submitted in partial fulfillment of requirements for the degree MASTER OF SCIENCE IN ELECTRICAL ENGINEERING at the CLEVELAND STATE UNIVERSITY May, 2008
Transcript of HIGH INTENSITY LASER POWER BEAMING FOR...

HIGH INTENSITY LASER POWER BEAMING
FOR WIRELESS POWER TRANSMISSION
DANIEL EDWARD RAIBLE
Bachelor of Electrical Engineering
Cleveland State University
May, 2006
submitted in partial fulfillment of requirements for the degree
MASTER OF SCIENCE IN ELECTRICAL ENGINEERING
at the
CLEVELAND STATE UNIVERSITY
May, 2008

This thesis has been approved
for the Department of Electrical and Computer Engineering
and the College of Graduate Studies by
________________________________________________
Advisor, Taysir H. Nayfeh
________________________________
Department/Date
________________________________________________
Thesis Committee Co-Chairperson, Fuqin Xiong
________________________________
Department/Date
________________________________________________
Ana V. Stankovic
________________________________
Department/Date
________________________________________________
Petru S. Fodor
________________________________
Department/Date

iii
To my family…

ACKNOWLEDGEMENTS
There are many people that I would like to express my gratitude towards, starting
with my advisor Dr. Taysir Nayfeh, for affording me the opportunity to pursue my
education through working at the Industrial Space Systems Laboratory, and for helping
me develop my skills as a researcher.
I would like to thank Dr. Fuqin Xiong for graciously accepting the role of co-
chairperson and for his services as a committee member, Dr. Ana V. Stankovic for
providing her knowledge in power electronics and systems, and Dr. Petru S. Fodor for
providing his expertise in physics.
I am ever grateful for the technical guidance that I received from Bernie Sater of
Photovolt, Inc. His lifelong pursuit of the VMJ technology is the enabler of this project.
Special thanks to Ken Edwards and the Eglin AFRL for believing in and
supporting this research. I am looking forward to what the future will bring.
Thanks to Hobson Lane, Bob Rice and NGST, as well as Colin Burke and LIMO
for providing their facilities and invaluable expertise.
I would also like to thank several graduate students and employees with whom I
have had the honor of working with at the Industrial Space Systems Laboratory: Brian
Fast, Dragos Dinca, Nick Tollis, Andrew Jalics, Sagar Gadkari, Scott Darpel, Maciej
Zborowski, Harry Olar and David Avanesian. They made many great contributions to
this research, and it has been a pleasure serving on the team with them.
Thanks to Adrienne Fox and Jan Basch for all of their hard work behind the
scenes, and to the rest of the Electrical and Computer Engineering Department and the

v
Industrial and Manufacturing Engineering Department for their support and guidance
given to me while at the Fenn College of Engineering.
I wish to particularly thank my wife, Jamie, for her eternal patience and love. I
am grateful to my parents, my sister Janice, my uncles Richard and Fred and my Aunt
Anna Rae for their continual support and for encouraging me to always try to take the
Giant Steps in life.

vi
HIGH INTENSITY LASER POWER BEAMING
FOR WIRELESS POWER TRANSMISSION
DANIEL EDWARD RAIBLE
ABSTRACT
This paper describes work supporting the development of a high intensity laser
power beaming (HILPB) system for the purpose of wireless power transmission. The
main contribution of this research is utilizing high intensity lasers to illuminate vertical
multi-junction (VMJ) solar cells developed by NASA-GRC. Several HILPB receivers
are designed, constructed and evaluated with various lasers to assess the performance of
the VMJ cells and the receiver under a variety of conditions. Several matters such as
parallel cell back-feeding, optimal receiver geometry, laser wavelength, non-uniform
illumination and thermal effects at high intensities are investigated. Substantial power
densities are achieved, and suggestions are made to improve the performance of the
system in future iterations. Thus far, the highest amount of energy obtained from a
receiver during these tests was 23.7778 watts. In addition, one VMJ cell was able to
achieve a power density of 13.6 watts per cm2, at a conversion efficiency of 24 %. These
experiments confirm that the VMJ technology can withstand and utilize the high intensity
laser energy without damage and/or significant reduction in the conversion efficiency.

vii
TABLE OF CONTENTS
Page
NOMENCLATURE ......................................................................................................... X
LIST OF TABLES ....................................................................................................... XIII
LIST OF FIGURES ..................................................................................................... XIV
I. INTRODUCTION ......................................................................................................... 1
1.1 Overview and Applications of Wireless Power Transmission ................... 1
1.2 Existing Work in Wireless Power Transmission ........................................ 3
1.3 New Approaches, Laser Power Beaming ................................................... 5
1.4 Research Objectives .................................................................................... 6
1.5 Document Overview ................................................................................... 7
II. HISTORY OF LONG-RANGE WIRELESS POWER TRANSFER ..................... 8
2.1 Electromagnetic Radiation .......................................................................... 8
2.2 Microwave Power Transmission ............................................................... 14
2.3 Laser Power Beaming ............................................................................... 20
III. ENABLING TECHNOLOGIES ............................................................................. 26
3.1 Photovoltaic‟s ........................................................................................... 26
3.1.1 Photovoltaic Theory ...................................................................... 27
3.1.2 Vertical Multi-Junction Solar Cells ............................................... 33

viii
3.1.3 Considerations with Laser Power Beaming .................................. 39
3.2 Lasers ........................................................................................................ 41
3.2.1 State of the Art and Beyond .......................................................... 41
3.2.2 Atmospheric Considerations ......................................................... 48
IV. EXPERIMENTAL SETUP ..................................................................................... 52
4.1 HILPB Receiver Design and Construction ............................................... 53
4.2 Data Acquisition ....................................................................................... 63
4.3 Lasers and Optics ...................................................................................... 66
4.4 Complete Apparatus and Methodology .................................................... 72
V. EXPERIMENTAL RESULTS .................................................................................. 77
5.1 Parallel Cell Back-Feeding ....................................................................... 78
5.2 Radial versus Square Geometry ................................................................ 81
5.3 Output Linearity ........................................................................................ 89
5.4 Determining the Optimal Laser Wavelength ............................................ 91
5.5 Uniform versus Gaussian Beam Profiles .................................................. 97
5.6 Maximum Power Density ....................................................................... 103
VI. CONCLUSIONS AND FUTURE WORK............................................................ 114
6.1 Summary and Contributions ................................................................... 114
6.2 Future Work ............................................................................................ 116

ix
REFERENCES .............................................................................................................. 121
APPENDICES ............................................................................................................... 126

x
NOMENCLATURE
ISSL: Industrial Space Systems Laboratory
CSU: Cleveland State University
AFRL: Air Force Research Laboratory
NGST: Northrop Grumman Space Technology
LIMO: Lissotschenko Mikrooptik GmbH
LASER: Light Amplification by Stimulated Emission of Radiation
HILPB: High Intensity Laser Power Beaming
VMJ: Vertical Multi-Junction
NASA: National Aeronautics and Space Administration
GRC: Glenn Research Center
PV: Photovoltaic
RFID: Radio-Frequency Identification
TET: Transcutaneous Energy Transfer
UAV: Unmanned Aerial Vehicle
COTS: Commercial off the Shelf
MPT: Microwave Power Transmission
CBS: Columbia Broadcasting System

xi
JPL: Jet Propulsion Laboratory
SHARP: Stationary High Altitude Relay Platform
MWLC: Micro-Wave Light Craft
LEO: Low Earth Orbit
GEO: Geosynchronous Orbit
SBM: Space-Based Microwave
PS: Power Sphere
PVCC: Photovoltaic Cavity Converter
EADS: European Aeronautic Defense and Space Company
POWOW: Power With Out Wires
I-V: Current-Voltage Relationship
Isc: Short-Circuit Current
Voc: Open Circuit-Voltage
Vmp: Maximum Power Voltage
Imp: Maximum Power Current
Pmp: Maximum Power
FF: Fill Factor
Ƞ%: Conversion Efficiency

xii
QE: Quantum Efficiency
LAPSS: Large Area Pulsed Solar Simulator
TEM00: Transverse Electro-Magnetic Gaussian
DPAL: Diode Pumped Alkali Vapor Laser
HEL: High Energy Laser
ATP: Acquisition Tracking & Pointing
ABL: Airborne Laser
TBM: Tactical Ballistic Missiles
IR: Infra-Red
PCB: Printed Circuit Board
CFM: Cubic Feet per Minute
RPM: Revolutions per Minute
FPGA: Field Programmable Gate Array
GUI: Graphical User Interface
FET: Field Effect Transistor

xiii
LIST OF TABLES
Table Page
TABLE I: Thermal Analysis of the Laser Power Beaming Receiver ................... 56
TABLE II: 976 nm Wavelength Results ................................................................ 94
TABLE III: 940 nm Wavelength Results ................................................................ 94
TABLE IV: 808 nm Wavelength Results ................................................................ 94
TABLE V: Gaussian Beam Results ....................................................................... 99
TABLE VI: Flat-Top Results ................................................................................ 101
TABLE VII: Maximum Power Density Data ........................................................ 104
TABLE VIII: Receiver Temperature Log .............................................................. 106
TABLE IX: HILPB Receiver Construction Log ................................................... 126

xiv
LIST OF FIGURES
Figure Page
Figure 1: Tesla‟s Wireless Energy Apparatus [3] ................................................... 10
Figure 2: Tesla‟s Wireless Energy Lecture - Wikipedia ......................................... 11
Figure 3: Tesla‟s Wardenclyffe Tower - Wikipedia ............................................... 12
Figure 4: W. C. Brown with MPT Helicopter [10] ................................................. 15
Figure 5: JPL Ground-to-Ground MPT Experiment [12] ....................................... 16
Figure 6: 1/8 SHARP Flight Experiment Model [16] ............................................ 17
Figure 7: Phased Array Model Airplane Experiment [17] ..................................... 18
Figure 8: Microwave Transmitter (left) and Rectenna [18] .................................... 19
Figure 9: Light-craft Ascending a Microwave Beam [20] ..................................... 20
Figure 10: PVCC and its Concept Layout [21] ..................................................... 21
Figure 11: First Laser Powered Aircraft Flight [22] ............................................. 22
Figure 12: EADS Laser Powered Mini-rover [23] ................................................ 23
Figure 13: Spaceward Foundation Elevator .......................................................... 24
Figure 14: Beaming Power to an Obscured Satellite ............................................ 25
Figure 15: Cross Section of a Single-Junction Solar Cell ..................................... 27
Figure 16: Optimal Band-Gaps for Semiconductors ............................................. 28

xv
Figure 17: Illustration of Photovoltaic Theory ..................................................... 29
Figure 18: Typical Photovoltaic I-V Curve .......................................................... 30
Figure 19: Hahn-Meitner Solar Radiation Spectrum ............................................ 32
Figure 20: Solar Sprint Panel Incidence Variation ............................................... 32
Figure 21: VMJ Cells in a 9 kW Solar Concentrator ............................................ 33
Figure 22: 40-junction VMJ Silicon Photovoltaic [29] ........................................ 34
Figure 23: Spectral Response of the VMJ Cells ................................................... 35
Figure 24: Reverse-Biased Test of a VMJ Cell .................................................... 36
Figure 25: VMJ Cell I-V Curves from LAPSS ..................................................... 37
Figure 26: VMJ Cell Efficiency vs. Temperature ................................................. 38
Figure 27: Gaussian Cell Illumination .................................................................. 40
Figure 28: Elements of a HEL System [37] .......................................................... 43
Figure 29: Boeing ABL with Laser Turret [38] .................................................... 44
Figure 30: One-Megawatt Iodine Solar-Pumped Laser [41] ................................ 46
Figure 31: Laser Power to a Lunar Base and Vehicle [41] ................................... 48
Figure 32: Atmospheric Optical Window - Wikipedia ......................................... 49
Figure 33: Mie Scattering, Scintillation and Absorption ...................................... 50
Figure 34: Zalman 9500 Heat-sink ....................................................................... 54
Figure 35: Receiver Cross-Sectional Stack-up ..................................................... 55

xvi
Figure 36: Propeller Path Representing Displacement ......................................... 57
Figure 37: Probe Channels Machined into the Face ............................................. 59
Figure 38: Instrumented Four Cell HILPB Receiver ............................................ 60
Figure 39: HILPB Receiver in the Solar Concentrator ......................................... 61
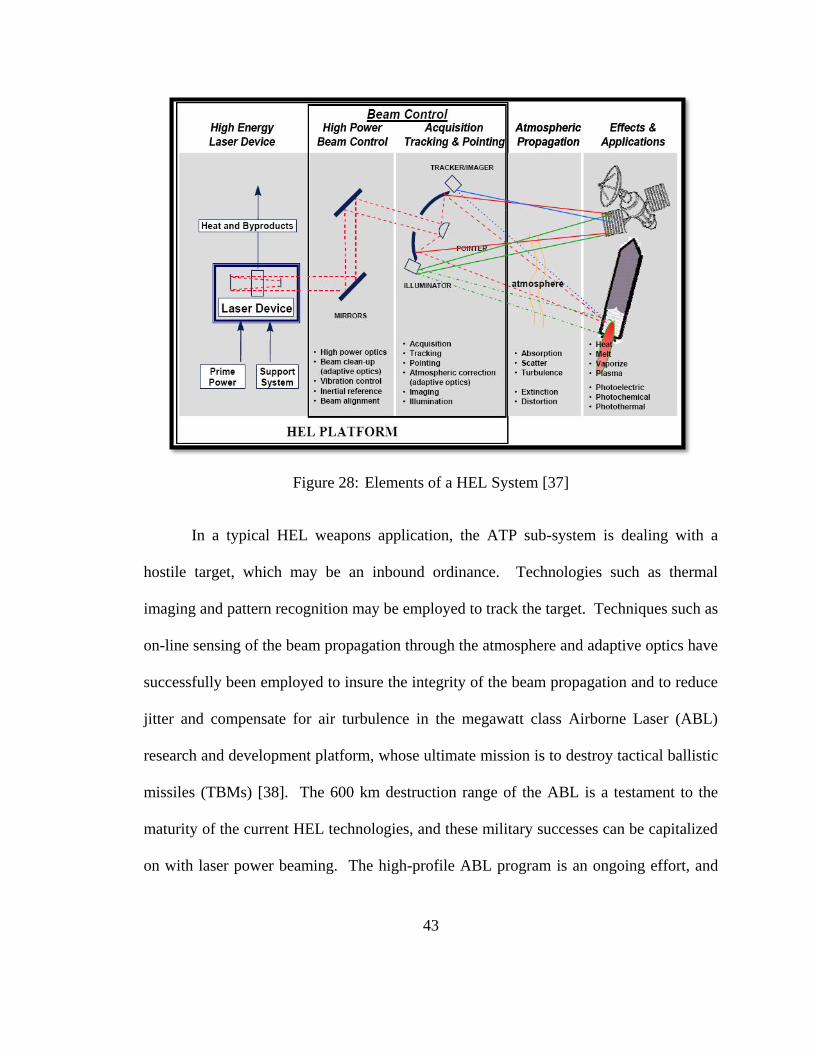
Figure 40: Thermal Validation of the Receiver .................................................... 62
Figure 41: Electrical Validation of the Receiver .................................................. 63
Figure 42: Schematic for Characterizing the Receivers ........................................ 63
Figure 43: DATAQ Functional Block Diagram ................................................... 64
Figure 44: DATAQ Hardware .............................................................................. 65
Figure 45: DATAQ GUI Plotting a Typical I-V Curve ........................................ 66
Figure 46: LIMO Turnkey Laser System .............................................................. 67
Figure 47: LIMO Laser Spectral Measurement .................................................... 68
Figure 48: LIMO Laser Energy Profile Measurements ........................................ 69
Figure 49: Melles Griot Transmittance Curve ...................................................... 70
Figure 50: HEBBAR Coating for Near-Infrared /077 ......................................... 70
Figure 51: Typical Beam Profiles with the Flat-top Optics .................................. 71
Figure 52: Illustration of the Flat-top Optics ........................................................ 71
Figure 53: 9 and 40-junction Receiver .................................................................. 72
Figure 54: Four and Nine-Cell Square Array Receivers ....................................... 73

xvii
Figure 55: Eleven-Cell Radial Orientation Receiver ............................................ 73
Figure 56: Illustration of the HILPB Test Rig ...................................................... 74
Figure 57: AFRL and CSU Personnel in the NGST Lab ...................................... 78
Figure 58: Connections With and Without Blocking Diodes ............................... 79
Figure 59: Cell Back-feeding with Small Overfill ................................................ 80
Figure 60: Cell Back-feeding with Medium Overfill ............................................ 80
Figure 61: Cell Back-feeding with Large Overfill ................................................ 80
Figure 62: Nine-Cell Square Receiver .................................................................. 82
Figure 63: Radial Orientation Receiver Layout .................................................... 83
Figure 64: Square Receiver at 30 % Fill, 23 Watts Pmp ........................................ 84
Figure 65: Top Cell I-V Curve, 7.471 Watts Pmp .................................................. 85
Figure 66: Right Cell I-V Curve, 7.467 Watts Pmp ............................................... 85
Figure 67: Bottom Cell I-V Curve, 7.485 Watts Pmp ............................................ 85
Figure 68: Left Cell I-V Curve, 7.385 Watts Pmp ................................................. 85
Figure 69: Center Cell I-V Curve, 6.852 Watts Pmp ............................................. 86
Figure 70: Four-Cell I-V Curve, 19.976 Watts Pmp .............................................. 87
Figure 71: Five-Cell I-V Curve, 23.935 Watts Pmp ............................................... 87
Figure 72: 48.09 % Illum., 25.286 Watts Pmp at 26.2 % Ƞ ................................... 88
Figure 73: 37.72 % Illum., 23.479 Watts Pmp at 31.12 % Ƞ ................................. 88

xviii
Figure 74: 25.24 % Illum., 22.488 Watts Pmp, at 44.39 % Ƞ ................................. 88
Figure 75: Linearity Test Over-fill ........................................................................ 89
Figure 76: Linearity Test at 58 Watts ................................................................... 90
Figure 77: Linearity Test at 118 Watts ................................................................. 90
Figure 78: Linearity Test at 146 Watts ................................................................. 90
Figure 79: Linearity Test at 200 Watts ................................................................. 91
Figure 80: Linear Input-Output Power Relationship ............................................ 91
Figure 81: Semiconductor Optical Absorption Coefficients ................................. 92
Figure 82: Wavelength Input versus Output ......................................................... 95
Figure 83: Wavelength Maximum Power I-V Curves .......................................... 95
Figure 84: Wavelength Conversion Efficiencies .................................................. 96
Figure 85: Wavelength Output Comparison ......................................................... 97
Figure 86: Wavelength Efficiency Comparison .................................................... 97
Figure 87: Nine-Cell Receiver with Gaussian Beam ............................................ 98
Figure 88: Gaussian Receiver Output ................................................................... 99
Figure 89: Gaussian Receiver Efficiencies ........................................................... 99
Figure 90: Nine-Cell Receiver with Flat-Top Beam ........................................... 100
Figure 91: Flat-Top Receiver Output .................................................................. 101
Figure 92: Flat-Top Receiver Efficiencies .......................................................... 101

xix
Figure 93: Gaussian vs. Flat Top Output Comparison ........................................ 102
Figure 94: Gaussian vs. Flat Top Efficiency Comparison .................................. 103
Figure 95: Maximum Power Density Alignment ................................................ 104
Figure 96: Maximum Power Density Output ...................................................... 105
Figure 97: Maximum Power Density Efficiency ................................................ 105
Figure 98: Maximum Power Density I-V Curve ................................................ 106
Figure 99: Efficiency Drop-off Beyond 60 °C.................................................... 107
Figure 100: Photocell Thermal Efficiency Degradation ....................................... 108
Figure 101: Surface Reflections at 30 Watt Intensity ........................................... 110
Figure 102: Surface Reflections at 91 Watt Intensity ........................................... 111
Figure 103: Surface Reflections at 150 Watt Intensity ......................................... 112
Figure 104: Surface Reflections at 200 watt Intensity .......................................... 113
Figure 105: Chevron Concept for a VMJ Radial Array ........................................ 117
Figure 106: Direct Bonding to Anodized Aluminum ........................................... 119
Figure 107: DATAQ PCB Artwork ...................................................................... 127

1
CHAPTER I
INTRODUCTION
Although the notion of wireless power transmission is now almost 200 years old,
it remains innovative as ever while developing technology pursues the concept. New
advances in solid state light amplification by stimulated emission of radiation (lasers) and
photovoltaic (PV) technologies generate an opportunity to revisit this concept. The
implementation of the high intensity laser power beaming (HILPB) system will extend
the capabilities of existing applications here on Earth, and create many new avenues for
the exploration of our universe.
1.1 Overview and Applications of Wireless Power Transmission
Wireless power transmission is the process by which electrical energy is sent from
a power source to a load, without the use of conventional interconnecting wires. This is
ideal in applications where either an instantaneous amount or a continuous delivery of
energy is needed, but where conventional conduction wires are prohibitively
inconvenient, expensive, hazardous or impossible.

2
The underlying physics of wireless power transmission resembles that of wireless
communications, but with an important difference. Unlike information transfer, where
the percentage of received power must be only sufficiently high enough to recover the
signal, wireless power transmission places a critical emphasis on the maximum amount
of possible energy transfer and conversion efficiency. Ideally, a wireless power
transmission system would have the ability to transmit any amount of power to any point
in space, but practical limitations such as conversion efficiencies at the source and the
receiver, and disturbances in the transmission medium will always limit the performance
of an implemented system.
Low-level and short-range wireless power transfer has found niche applications in
everyday life, such as with radio-frequency identification (RFID) tags, induction charging
of portable consumer electronics, electromagnetic card readers and transcutaneous energy
transfer (TET) systems in artificial hearts and other surgically implanted devices [8].
Wireless power transfer is a revolutionary concept whose full potential has yet to
be realized. High intensity long-range transmission is an enabling technology, by
extending the capabilities of existing applications and facilitating the development for
completely new paradigms. A HILPB system will have the potential to connect lunar
habitats, landing sites and power-plants. It will have the capability to deliver energy
indefinitely to remote vehicles and crafts such as unmanned aerial vehicle (UAV)
swarms, high altitude airships, orbiting satellites, extra-terrestrial robotic rovers and deep
space probes, thereby increasing their coverage, autonomy and endurance. A high
intensity long range wireless power transmission system could be used to relay power

3
from a solar farm or a nuclear reactor to the dark side of the moon, and can be easily
reconfigured to serve as a flexible virtual power grid.
The concept of a long range wireless power transmission system has been ahead
of its practical implementation for a long time, but this gap is shrinking. The current state
of the art in technology is providing for a high intensity long range wireless power
transmission system to be designed using many commercial off-the-shelf (COTS)
components. The vast application potential makes the pursuit of the HILPB system a
worthwhile endeavor.
1.2 Existing Work in Wireless Power Transmission
The discussion of significant amounts of wireless power transmission began with
Nikola Tesla near the end of the nineteenth century. Tesla built upon his previous
research in radio transmission to successfully design, construct and demonstrate several
wireless power transmitters. His designs were operated on the principles of
electromagnetic radiation through tuned circuitry. Although he could power light bulbs
and vacuum tubes within the vicinity of his transmitters, Tesla had a much broader vision
for where his technology should be used. Rather than stringing up copper conductors on
wooden poles in an effort to connect the country to a power distribution grid, he
envisioned a worldwide system of radiated energy. His large scale experiments probed

4
the very fabric of our Earth‟s electrical conduction characteristics in an effort to exploit it
for this purpose.
Although Tesla was not afforded an opportunity to complete his research, much
of his work is being revisited today for applications such as virtual lightning rods and
weaponry. The potentially volatile nature of this technology due to the large amounts of
uncontrollable radiated energy has partially prevented it from gaining support for
wireless power transmission applications.
Around the middle of the twentieth century, research on applying microwave
communications technology to wireless power transmission was started. This work
mainly focused on utilizing the technology to transmit energy from solar power satellites
down to Earth, or to provide power and propulsion to other spacecraft. Several large
scale ground based microwave demonstrators have been constructed and operated. The
drawback to this technology is that microwaves have very long wavelengths which
exhibit a moderate amount of diffraction over long distances. This necessitates a large
power receiver dish, which limits the flexibility of this technology to certain applications.
The ability for HILPB to focus large amounts of power to a small aperture across long
distances is what separates it from the microwave technology, and this broadens the
number of potential applications for the technology.

5
1.3 New Approaches, Laser Power Beaming
Since Schawlow and Towne‟s early patented ideas at Bell Labs [1 and 2] which
led to the development of laser technology, wireless power transmission has been a
considered application. The laser‟s efficient atmospheric propagation window, and its
ability to deliver large amounts of photonic energy to a small aperture make it an ideal
source for wireless power transmission. Original research proposed the use of lasers to
provide thermal energy for beamed energy propulsion to spacecraft. Later, it was
proposed to use the laser with a photovoltaic receiver, to effectively beam electrical
power from one location to another. The main limiting factors to the laser power
beaming (LPB) system are the conversion efficiencies of the laser (electrical to photonic)
and the photovoltaic cells (photonic to electrical). The advancement of both of these
technologies is allowing for greater power handling capacities and conversion
efficiencies. However, although there are a variety of photovoltaic cells on the market
approaching conversion efficiencies of 40 % (such as triple junction cells), these
technologies cannot operate at intensities 1000 times or greater than that of the sun.
This work proposes the use of vertical-multi junction (VMJ) photovoltaic cells for
utilization in the laser power beaming application. These cells were originally developed
by NASA-GRC scientists and are currently produced by Photovolt, Inc. for high intensity
solar energy applications (greater than 2500 suns), such as parabolic and Fresnel solar
concentrators. VMJ cells offer high power density and conversion efficiencies through

6
the use of edge-illuminated semiconductor junctions and can operate at favorable laser
wavelengths.
1.4 Research Objectives
The first objective of this work is to design, construct and test a preliminary
engineering model of a HILPB receiver as a proof-of-concept hardware device. The
receiver needs to meet the thermal and electrical demands of the system, and will be
tested with various laser sources to evaluate the performance of the VMJ cells for this
application. Next, the receiver design needs to be refined, in order to demonstrate
substantial power densities and conversion efficiencies. This will be accomplished by
investigating matters such as the parallel-cell back-feeding, optimal receiver geometry,
non-uniform illumination and thermal effects at high intensities. New iterations of the
receiver will be designed, constructed and tested to support these investigations and to
provide solutions to problems encountered during development. Finally, suggestions will
be made to improve the future performance of the design, based on the analysis of the
data collected from these experiments.

7
1.5 Document Overview
This paper is organized as follows: Chapter 2 investigates the history of wireless
power transfer, from the early days of induction and electromagnetic radiation, to
microwave power transmission and finally laser power beaming. The enabling PV and
laser technologies for HILPB are discussed in Chapter 3. The experimental apparatus are
described in Chapter 4, including the design, construction and validation of the HILPB
receivers and the supporting electronics. Chapter 5 contains the experimental results and
conclusions concerning issues such as parallel cell array back-feeding, optimal receiver
geometry and proper laser wavelengths to maximize conversion efficiency, the impact of
non-uniform beam distribution and thermal effects at high intensities. Finally, Chapter 6
offers a summary of the results and suggestions for future work.

8
CHAPTER II
HISTORY OF LONG-RANGE WIRELESS POWER TRANSFER
From the beginnings of wireless power transfer with the prolific Tesla literally
igniting the world on fire with his kilovolts of energy, the prospects of a large scale
system have engaged many researchers to push the technology further. Airships, lunar
bases and spacecraft applications have been identified as benefactors of this concept, and
as the technology progresses so do the capabilities of the wireless power transmission
systems.
2.1 Electromagnetic Radiation
The origins of wireless power transfer can be traced back to the first half of the
nineteenth century with the invention of the electromagnet by William Sturgeon, the
discovery of electromagnetic induction by Michael Faraday and the mathematical
modeling of electromagnetic radiation by James Maxwell. These discoveries were
combined and demonstrated by Nicholas Callan‟s construction of the induction coil and
Guglielmo Marconi‟s Hertz-wave transmitter apparatus, but it wasn‟t until Nikola Tesla‟s

9
coupled-tuned-circuit oscillator that the concept of wireless power transmission became
widely known. His vision of a "world system for the transmission of electrical energy
without wires" [3, 4 and 5] led him to design his own transmitter, whose power handling
capacity was five orders-of-magnitude greater than those of its predecessors. It consisted
of two flat coil variations of his Tesla coil design, with the capability to tune its operating
frequency.
Tesla‟s apparatus was demonstrated as early as 1891 in his New York
laboratories. While conducting an experiment, his electro-mechanical oscillators started
to generate a resonant frequency in the surrounding buildings, causing them to shake
violently. As the speed of the oscillators grew, he hit the resonant frequency of his own
laboratory, and had to terminate the experiment with a sledgehammer to avoid a
catastrophe. During these experiments, the radiated energy lit up vacuum tubes within
the proximity of the oscillators, providing impressive evidence for the potential of
wireless power transmission. This type of electrical conduction (the movement of energy
through space and matter, and not just the production of voltage across a conductor) was
named the Tesla effect.

10
Figure 1: Tesla‟s Wireless Energy Apparatus [3]
Tesla demonstrated his wireless power transmission method to the public over the
next few years, including the 1893 World Fair at Chicago where he powered fluorescent
lamps and single node bulbs with his apparatus. He delivered a well received
demonstration lecture to the Institute of Electrical Engineers (IEE) in London and the
American Institute of Electrical Engineers (AIEE) in New York City, which fueled his
desire to design and construct a large scale wireless power transmission demonstrator.

11
Figure 2: Tesla‟s Wireless Energy Lecture - Wikipedia
By 1900, he applied for patents describing improvements to his system
[3, 4 and 5], and he began construction of his large 187 foot Wardenclyffe Tower facility
on Long Island to conduct his high-voltage, high-frequency experiments. The main focus
of Wardenclyffe was to serve as a wireless power transmission facility, and allow him to
increase the intensity of the generated electrical oscillations. This was to be the first of
many such installations around the world, thus creating a global system of multi-channel
broadcasting and wireless industrial transmission of electric power.

12
Figure 3: Tesla‟s Wardenclyffe Tower - Wikipedia
At Wardenclyffe, he operated across a range of frequencies from 1 kHz to
100 kHz at powers up to 1.5 MW in an effort to excite and exploit the Earth‟s inherent
resonant LC circuits through the ionosphere and the natural ground. Excitation at these
frequencies would yield the most economical method of power transmission, and his
apparatus indicated an efficient range between 30 – 35 kHz. Under certain conditions, he
found that he could send pulses of electricity through the air with undiminished strength
by setting up a longitudinal acoustic-type compression wave, rather than an
electromagnetic Hertzian-type transverse wave. He could also include a stationary
resonant wave within the earth-ionosphere cavity, as well as add an 8 Hz component to
resonate with the Earth‟s Schumann cavity to determine the most efficient method of the
wireless transmission of power. These preliminary experiments revealed much about the

13
electrical nature of Earth, from its resistivity, capacitance and inductance, and these
findings convinced Tesla that his large scale construction would not only work, but
would be the beginning of greater technologies:
"As soon as [the Wardenclyffe facility is] completed, it will be possible for a
business man in New York to dictate instructions, and have them instantly appear in type
at his office in London or elsewhere. He will be able to call up, from his desk, and talk to
any telephone subscriber on the globe, without any change whatever in the existing
equipment. An inexpensive instrument, not bigger than a watch, will enable its bearer to
hear anywhere, on sea or land, music or song, the speech of a political leader, the address
of an eminent man of science, or the sermon of an eloquent clergyman, delivered in some
other place, however distant. In the same manner any picture, character, drawing, or print
can be transferred from one to another place ..." – N. Tesla [6]
Unfortunately the Wardenclyffe Tower facility was never fully completed, due to
Tesla‟s economic hardship partially resulting from the US Patent Office revoking his
earlier patent for the radio and awarding it to Marconi. By 1917, the tower was
dismantled, and his large scale vision of wireless power transmission was forfeited.
The viability of such a large-scale electromagnetic radiation system has yet to be
demonstrated, and faces the key challenges of efficiently coupling power into and out of
the earth-ionosphere cavity through its resonant modes, and in devising a small and
efficient receiver [7]. Implementation concerns such as safety, susceptibility to weather
and environmental impact have also limited the pursuit of this form of wireless power
transmission.

14
Recently, a group of researchers at MIT have revisited Nikola Tesla‟s original
idea of transporting energy over a distance without a carrier medium using
electromagnetism. They identified the impracticality of radiating the energy in an Omni-
directional manner, due to the large amount of energy that is wasted into free space. The
focus of their research is on directional (rather than radiated) power transfer at mid-range
distances (where the length of the transmission equals a few multiples of the size of the
device) for autonomous mobile electronics applications such as laptops and cell phones.
This is achieved by establishing near field resonant coupling between the objects, upon
which energy can be transferred [8]. A demonstrator of this system has been constructed
using self-resonant coils, and has achieved a transfer of 60 watts with 40 % efficiency
over distances in excess of 2 meters [9]. The approximate practical transmission distance
of this scheme is 8 times the radius of the coils, which would be the primary limiting
factor when considering the end applications.
2.2 Microwave Power Transmission
Following the World War II development of high-power microwave emitters
(called cavity magnetrons), the idea of using microwaves for wireless power transfer was
researched. One of the main pioneers of this concept of microwave power transmission
(MPT) was William Brown, who in 1964 on CBS News with Walter Cronkite,
demonstrated a microwave-powered model helicopter that received all of its flight power
from a microwave beam [10]. MPT for a proposed micro-helicopter application was later

15
revisited and demonstrated using a 1.3 GHz continuous wave at 1 watt of transmitted
power, nearing efficiencies of 31 % [11].
Figure 4: W. C. Brown with MPT Helicopter [10]
Brown later served as technical director of a JPL-Raytheon program between
1969 and 1975 that beamed 30 kW over a distance of 1 mile at 84 % efficiency. Further
MPT experiments in the tens of kilowatts have been conducted at the JPL Goldstone
Deep Space Communications Complex in California in 1975 [12, 13 and 14] and more
recently (1997) at Grand Bassin on Reunion Island [15].
16
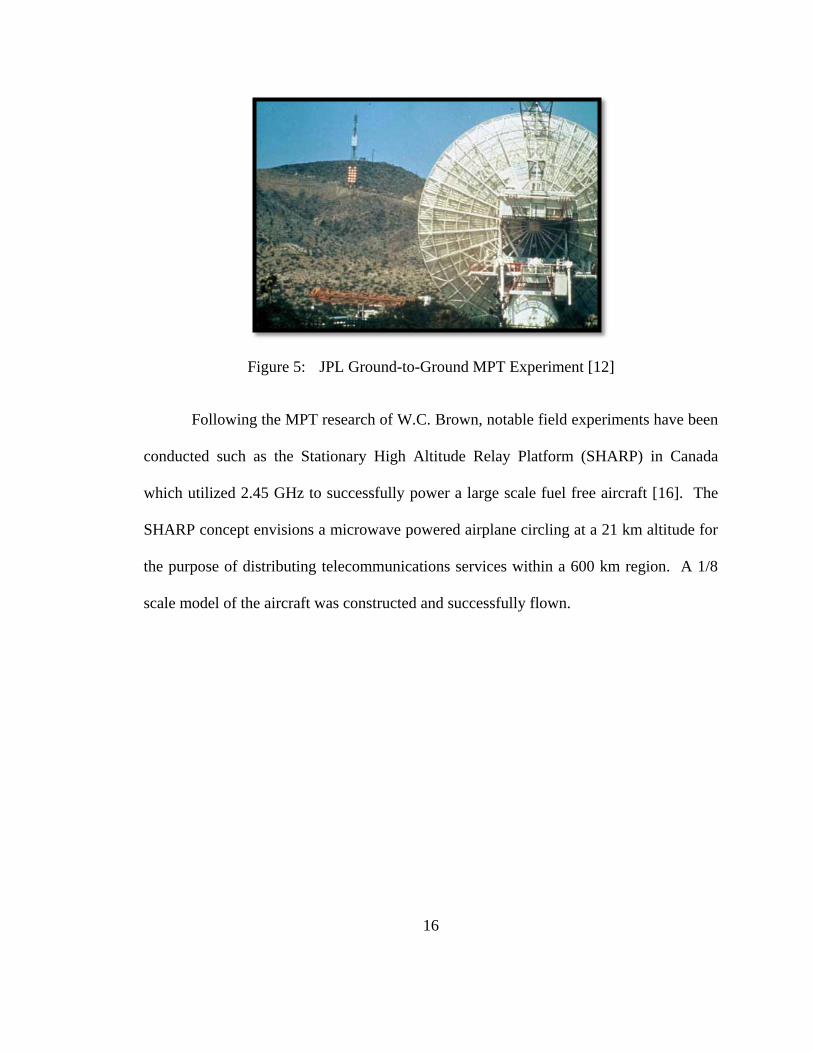
Figure 5: JPL Ground-to-Ground MPT Experiment [12]
Following the MPT research of W.C. Brown, notable field experiments have been
conducted such as the Stationary High Altitude Relay Platform (SHARP) in Canada
which utilized 2.45 GHz to successfully power a large scale fuel free aircraft [16]. The
SHARP concept envisions a microwave powered airplane circling at a 21 km altitude for
the purpose of distributing telecommunications services within a 600 km region. A 1/8
scale model of the aircraft was constructed and successfully flown.

17
Figure 6: 1/8 SHARP Flight Experiment Model [16]
A similar fuel-free airplane flight experiment using a MPT phased array with
2.411 GHz in 1992 was conducted in Japan [17]. The target application was another high
altitude long endurance airship. A rectenna (rectifying antenna) was designed to employ
a dual polarization technique to double the microwave power flux density, and this array
was mounted on an airship which had a successful microwave powered flight test lasting
3 minutes and a demonstrated radio frequency to direct current conversion efficiency of
81 %.

18
Figure 7: Phased Array Model Airplane Experiment [17]
One particular endoatmospheric application of MPT is to provide power to pulsed
particle accelerators for an ion propulsion mode Micro-Wave Light Craft (MWLC). This
type of vehicle would be able to achieve hypersonic velocities at 100 to 1000X cost
reduction over conventional chemical propulsion methods. This concept was
demonstrated in 2003 by transmitting 3 kW of 5.85 Ghz microwave power to a remote
rectenna [18]. The rectenna delivered 6 kV to a special „Ion Breeze‟ engine, which
applied a torque to the charged hull for pitch and roll maneuvers (Figure 8). This
demonstrated the feasibility of using MPT for endoatmospheric ion propulsion.

19
Figure 8: Microwave Transmitter (left) and Rectenna [18]
The inherent nature of the microwave propagation lends itself to dual use wireless
power beaming and data telemetry applications. A communications signal could be
modulated on top of the power transfer, or in the case of a multifunctional stacked patch
antenna, an optimized dual mode system could be developed. A proposal has been made
for antennae that operate with 10 dBi of gain and 18 % bandwidth at 5.8 GHz, and 4 dBi
of gain and 3.2 % bandwidth at 2.45 GHz [19]. The ability to switch between these
modes would allow for a system that could provide for a wireless power transmission at
high frequencies and data telemetry at lower frequencies, thereby obtaining dual usage
from a single technology.
The deployment of a MPT infrastructure in Low Earth Orbit (LEO) would have
the potential to radically reduce the cost of space missions by factors of 100 to 1000
times. A space-based microwave (SBM) power station would offer operational flexibility
by providing a power boost to heavy lift launch vehicles from the ground, to light-craft

20
ascending from LEO to Geosynchronous Orbit (GEO) (Figure 9) and other orbital
vehicles & satellites within the station‟s power beaming range [20]. The proposed station
may be up to 1 km in diameter, and use 320 MW of photovoltaic arrays as a means to
operate a 20 GW microwave for a short duration of time.
Figure 9: Light-craft Ascending a Microwave Beam [20]
2.3 Laser Power Beaming
During the past decade, there have been many valued applications for HILPB that
have been identified and assessed. The development of a practical HILPB system has
been slow due to the significant non-reoccurring engineering costs of the components,
but these technologies are continually being improved for applications in other fields.
The benefits from these improvements can translate to the realization of a HILPB system.

21
One such work under development is the PowerSphere (PS) [21], which is a high
efficiency Photovoltaic Cavity Converter (PVCC). The PS has a target power range of
1 kW to 100 kW, and at this time it is functioning within the 100 watt to 200 watt level
using a Nd:YAG laser operating at 1.064 µm. The current PVCC prototype is
constructed from 22 Si concentrator cells (limited to 500 suns), and the overall array
efficiency is 14 %. This prototype needs to be optimized by perfectly matching the
photovoltaic cell band gaps to the laser frequency, reducing the 15 % reflectance in the
anti-reflective (AR) coating of the cells, increasing the flux density inside of the sphere
(currently it is 30 % less than one sun) and increasing the cell population density within
the PVCC. These limitations will need to be overcome in order for the PS to become a
practical for HILPB.
Figure 10: PVCC and its Concept Layout [21]
In the past, researchers have demonstrated a variety of model aircraft being
powered using beamed microwave energy. The limitation to this technology is the
energy loss caused by the microwave beam dispersion, which prohibits long-distance
power transfer. The focused characteristic of a laser beam when compared to that of a

22
microwave beam makes it a natural choice for practical power beaming. The first
successful flight demonstration of a small-scale aircraft flying under the power delivered
from a laser was conducted at NASA‟s Marshall Space Flight Center in 2003 [22]. A
lightweight, 11 ounce aircraft was fitted with a custom Spectrolab thin film photovoltaic
panel, consisting of triple junction Ga:In:P2 cells. Because these cells could not
individually handle the high energy densities of the laser, the beam had to be spread out
over an array of 24 cells which hung from the fuselage of the aircraft, as shown in
Figure 11.
Figure 11: First Laser Powered Aircraft Flight [22]
The aircraft was flown in a continuous circle inside of a large building, and an
operator manually tracked its flight path with an adjustable 1.5 kW laser at 940 nm with
an approximate distance of 15 meters. At a laser intensity of 500 watts (39.56 watts
irradiating the panel), the photovoltaic receiver was able to provide 7 watts of power to
the motor, which was sufficient to sustain flight. This experiment demonstrated a 17.7 %

23
efficiency of the loaded cells. The experiment was re-attempted outdoors, but the small
aircraft could not handle the wind conditions.
More recently than the NASA flight endeavor, engineers at the EADS Space
Transportation facility successfully powered a mini-rover with a laser [23]. A tracking
system was developed to maintain an orthogonal angle between the photovoltaic cell
panel and the laser beam, and the test was conducted at a range of 250 meters.
Figure 12: EADS Laser Powered Mini-rover [23]
One of the future applications for laser power beaming in space exploration may
be Power With Out Wires (POWOW) [24]. The POWOW concept is a solar electric
spacecraft for the purpose of running cargo to and from Mars. The spacecraft would be
fitted with high efficiency solar cells and an electric propulsion system, and once in orbit
of the planet, it could beam power down to the Martian surface using lasers. By
delivering power in this fashion, the surface infrastructure could be reduced. Laser

24
power beaming is optimal for this application, because at an aero-synchronous orbit
distance of 17,000 km, a laser receiver would have an aperture area of 360 meters2 to
contain the beam. This is considerably smaller than if MPT were used.
Another application for HILPB in space is with space elevators. A space elevator
is simply a 100,000 km carbon nano-tube composite cable attached to Earth at one end
and a space platform at the other.
Figure 13: Spaceward Foundation Elevator
A mechanical climber ascends the cable for the purpose of carrying satellites into
space, providing a cost effective alternative to conventional heavy lift space launch
vehicles. With current developing technologies, a 20,000 kg capacity space elevator
appears feasible at a cost of $40B [25]. Although the basic design and components of the
space elevator have been worked out, the matter of delivering power to the climbers
remains an issue. Ground-based HILPB is an ideal solution, since the area surrounding
the cable will already be secure, and the target is stationary.

25
A further application of laser power beaming in space is to provide auxiliary
power to satellites during periods of eclipse, to compensate for the solar panel
degradation or after an electrical failure [26]. In this way, a laser-equipped satellite could
take the place of the solar flux to effectively extend the mission duration of other
degraded satellites.
Figure 14: Beaming Power to an Obscured Satellite

26
CHAPTER III
ENABLING TECHNOLOGIES
The present technological maturity in PV devices, high power lasers and
advanced control optics creates an opportunity to develop a HILPB system.
Understanding the interaction of these technologies is fundamental to designing a
successful system, in order to uncover potential problems that may require an engineering
solution. This chapter describes the theory and functionality of the technologies
employed for HILPB.
3.1 Photovoltaic’s
The first section explains the fundamental properties of PV devices using a single-
junction solar cell. These are compared and contrasted with the construction and
characteristics of the vertical multi-junction (VMJ) cell in the second section.
27
3.1.1 Photovoltaic Theory
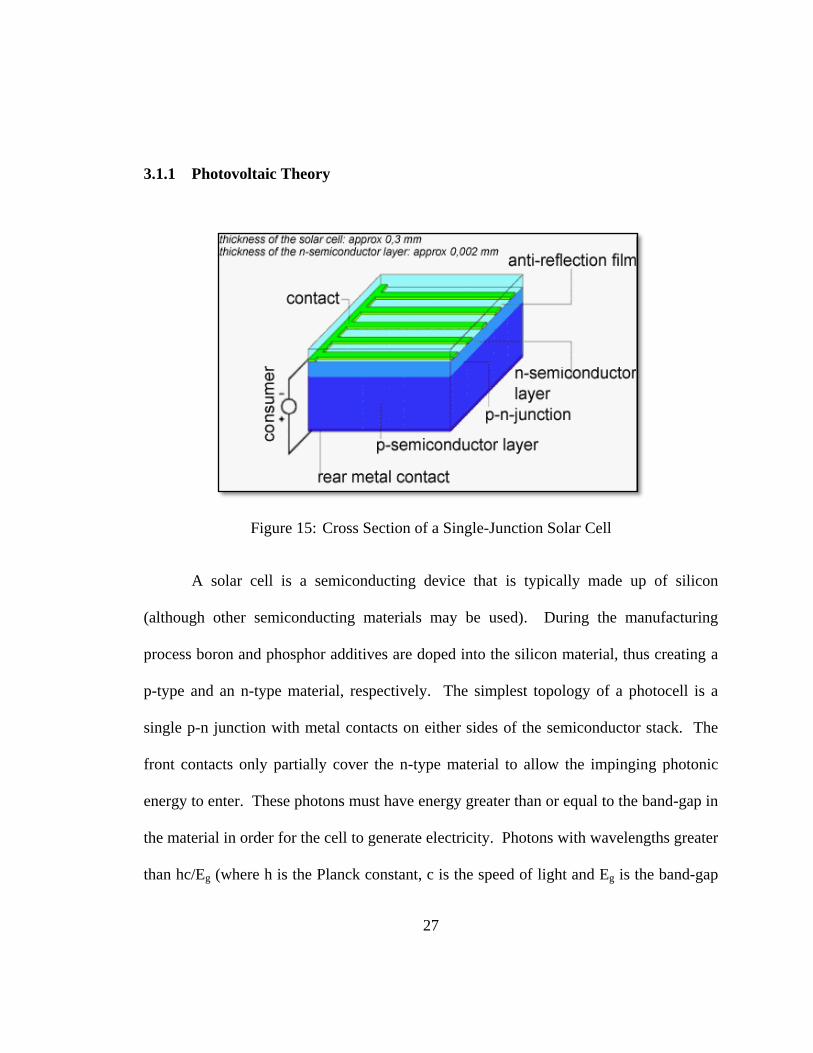
Figure 15: Cross Section of a Single-Junction Solar Cell
A solar cell is a semiconducting device that is typically made up of silicon
(although other semiconducting materials may be used). During the manufacturing
process boron and phosphor additives are doped into the silicon material, thus creating a
p-type and an n-type material, respectively. The simplest topology of a photocell is a
single p-n junction with metal contacts on either sides of the semiconductor stack. The
front contacts only partially cover the n-type material to allow the impinging photonic
energy to enter. These photons must have energy greater than or equal to the band-gap in
the material in order for the cell to generate electricity. Photons with wavelengths greater
than hc/Eg (where h is the Planck constant, c is the speed of light and Eg is the band-gap

28
energy) will promote electrons at a certain efficiency rate, and develop a photocurrent
through the cell under a loaded condition. This process is referred to as the photoelectric
effect, as mathematically described by Einstein [27]. Photons with energy less than the
band-gap of the material will not make a contribution to the generated electricity due to
the semiconductor recombination process, which results in the conversion to heat.
The band-gap of the photocell is determined by the semiconductor material used
in its construction. This material is chosen to balance the design parameter tradeoff
between high output voltages (high energy band-gaps) or high output currents (low
energy band-gaps) [28].
Figure 16: Optimal Band-Gaps for Semiconductors
When the photons enter the semiconducting material, they interact with the atoms
in the lattice. The collision of a single photon with a single electron promotes that
electron to a higher energy level, specifically the conduction band in the n-type material.
The resulting hole in the valence band is swept across the junction field to the p-type
material. In doing so, a field has been set up where conduction band electrons travel to

29
the n-type side, and valence holes travel to the p-type side, all while the photons continue
to bombard the semiconductor. Once there, they cannot re-cross the junction, as this
would oppose the field. This migration of the electrons in one direction and holes in the
opposite direction builds up a separation of charge, which eventually overcomes the
junction field to create a forward biased junction. When connected to a load the cell will
discharge this potential energy across it, creating electrical power.
Figure 17: Illustration of Photovoltaic Theory
The performance of a solar cell can be evaluated by a few simple concepts.
a) Current-Voltage (I-V) Curves
The I-V curve describes the electrical characteristics of the solar cell across its
operational range of voltages and currents. These curves are obtained by recording the
voltage and current values of a cell exposed to a constant level of light and held at
constant temperature while a variable resistive load is swept from open-circuit to short-

30
circuit states (from infinity to zero ohms). The resulting curve graphically represents
typical electrical performance parameters required for characterization. Isc refers to the
short-circuit current when the output terminals of the cell are effectively connected
together, and it intersects the vertical axis. At the opposite extreme of the curve, Voc
refers to the open circuit-voltage, and it intersects the horizontal axis.
Figure 18: Typical Photovoltaic I-V Curve
b) Maximum Power (Pmp)
The product of the voltage and the current at any point on the curve describes the
electrical power output of the cell. The point where this is a maximum is denoted Pmax,
and the corresponding contributions are labeled Vmp and Imp.

31
c) Fill Factor (FF)
Fill Factor describes the degree to which the values at Vmp and Imp match the
values at Voc and Ioc. In other words, it describes the „squareness‟ of the curve, and can
be calculated by:
𝐹𝑖𝑙𝑙 𝐹𝑎𝑐𝑡𝑜𝑟 𝐹𝐹 =𝑉𝑚𝑝 × 𝐼𝑚𝑝
𝑉𝑜𝑐 × 𝐼𝑜𝑐× [%] (3.1)
d) Conversion Efficiency (ƞ%)
The conversion efficiency of a photovoltaic cell is the percentage of the total incident
energy on the device that is converted into electrical energy, as given by
𝐶𝑜𝑛𝑣𝑒𝑟𝑠𝑖𝑜𝑛 𝐸𝑓𝑓𝑖𝑐𝑖𝑒𝑛𝑐𝑦 (ƞ%) =𝑃𝑚𝑝
𝐼𝑛𝑐𝑖𝑑𝑒𝑛𝑡 𝑆𝑜𝑙𝑎𝑟 𝐸𝑛𝑒𝑟𝑔𝑦× [%] (3.2)
e) Quantum Efficiency (QE)
Quantum Efficiency describes the relationship of the response of the cell to
different wavelength components of incident light. It is the ratio of the number of charge
carriers collected by the solar cell to the number of photons across the spectrum incident
on the PV device. The Quantum Efficiency of the device is determined from its chemical
makeup and its construction. This is generally optimized to best approximate the solar
spectrum for maximum conversion efficiency at all frequencies, as shown in Figure 19.

32
Figure 19: Hahn-Meitner Solar Radiation Spectrum
Finally, it is important to note that conversion efficiency is dependent on the angle
of incidence of the photonic energy. A PV cell exhibits its highest conversion efficiency
when it is orthogonal to the incoming photons. As the angle of incidence is increased, the
cell efficiency tapers off. The rate at which this occurs is dependent upon the design and
construction of the cell.
Figure 20: Solar Sprint Panel Incidence Variation
33
3.1.2 Vertical Multi-Junction Solar Cells
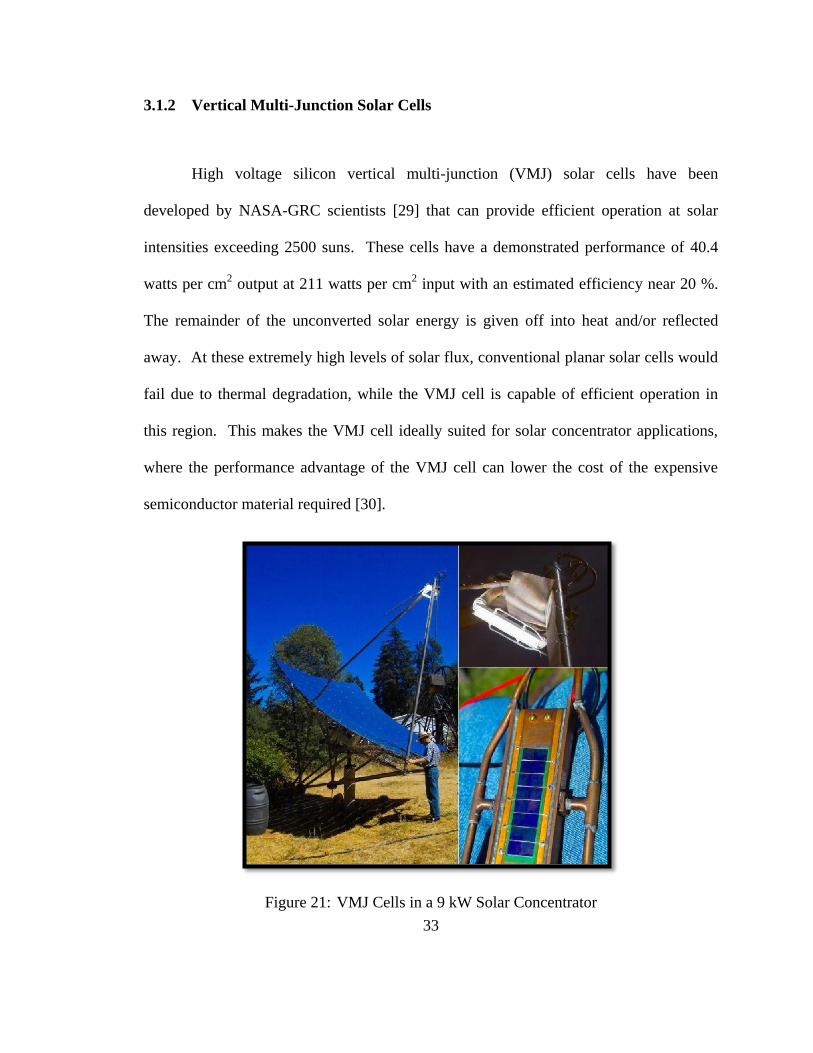
High voltage silicon vertical multi-junction (VMJ) solar cells have been
developed by NASA-GRC scientists [29] that can provide efficient operation at solar
intensities exceeding 2500 suns. These cells have a demonstrated performance of 40.4
watts per cm2 output at 211 watts per cm
2 input with an estimated efficiency near 20 %.
The remainder of the unconverted solar energy is given off into heat and/or reflected
away. At these extremely high levels of solar flux, conventional planar solar cells would
fail due to thermal degradation, while the VMJ cell is capable of efficient operation in
this region. This makes the VMJ cell ideally suited for solar concentrator applications,
where the performance advantage of the VMJ cell can lower the cost of the expensive
semiconductor material required [30].
Figure 21: VMJ Cells in a 9 kW Solar Concentrator

34
The VMJ cell is an integrally bonded series-connected array of miniature silicon
junction unit cells. The illuminated face of the cell is oriented at the side of the junctions,
and so it is also referred to as an “edge illumination” multi-junction cell. Because of the
series connected junctions, one small 40-junction VMJ cell (0.8 cm² area) can output a
nominal 24 V under load. This eliminates the need to construct series stacks of
photovoltaic cells in an array to interface with downstream electronics, resulting in a
more compact receiver. The number of junctions in a VMJ cell can easily be varied
during the manufacturing process to accommodate the bus voltage requirements of the
end application.
Figure 22: 40-junction VMJ Silicon Photovoltaic [29]
The unique design of the VMJ cell has several major inherent advantages. First,
since the cell is edge illuminated, the need for electrical contacts on the illuminated face
is eliminated. This allows for a greater convertible surface area for the photonic energy
to enter the cell. Since the junctions are vertical, the cell thickness is not limited by the
thickness of the silicon wafer, but can be adjusted during manufacturing to optimize

35
performance. Through the depth of each junction, there is an equal probability that an
excess carrier can be generated from the impinging energy, increasing the chance for a
photonic collision to occur. This produces an improved spectral response at low and high
frequencies [31].
Figure 23: Spectral Response of the VMJ Cells
Second, the series connections of the junctions provide high compatibility with
most loads. This also creates a very high reverse voltage breakdown immunity, which
reduces the need for adding bypass protection diodes that are typical in paralleled
photovoltaic arrays. In a reverse biased experiment, a 40-junction VMJ cell was able to
withstand a 6 kV potential (the limit of the test equipment) with only minimal leakage
current.
VMJ PV Cells Spectral Response
0
0.2
0.4
0.6
0.8
1
1.2
200 400 600 800 1000 1200
Wave Length (nm)
Qu
an
tum
Eff
icie
ncy
0
0.1
0.2
0.3
0.4
0.5
0.6
0.7
0.8
Cu
rre
nt
mA
/mW
Quantum Yield mA/mW
36
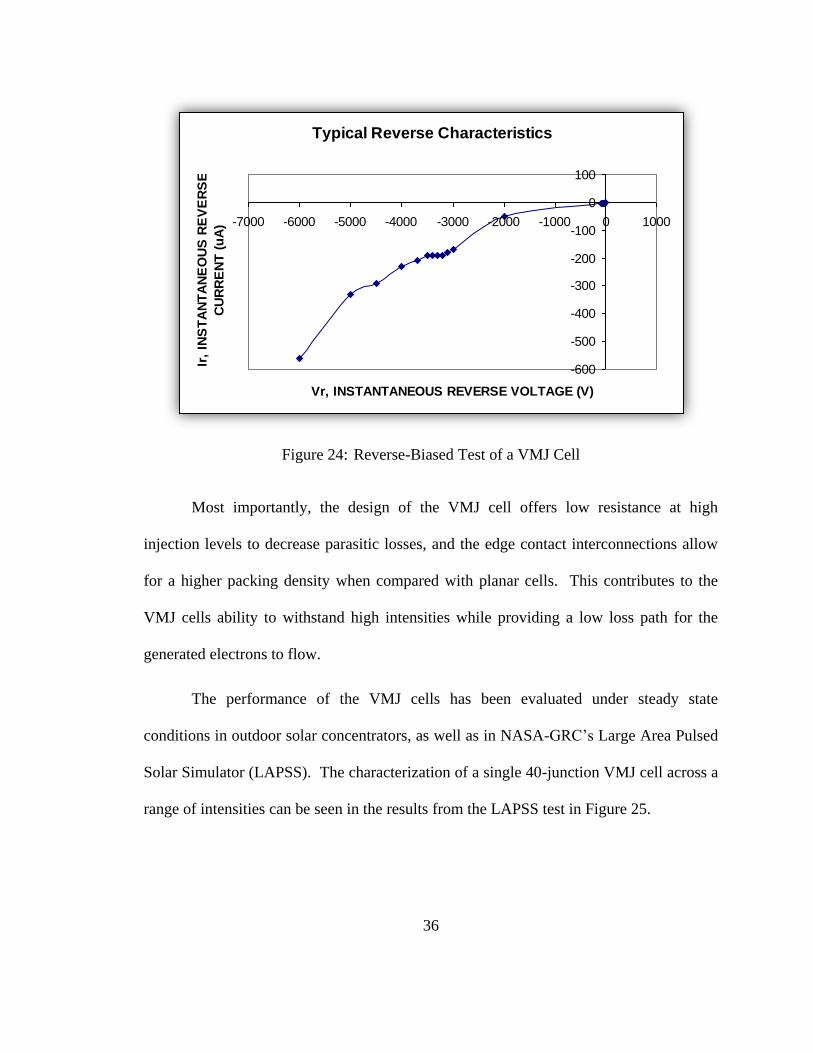
Figure 24: Reverse-Biased Test of a VMJ Cell
Most importantly, the design of the VMJ cell offers low resistance at high
injection levels to decrease parasitic losses, and the edge contact interconnections allow
for a higher packing density when compared with planar cells. This contributes to the
VMJ cells ability to withstand high intensities while providing a low loss path for the
generated electrons to flow.
The performance of the VMJ cells has been evaluated under steady state
conditions in outdoor solar concentrators, as well as in NASA-GRC‟s Large Area Pulsed
Solar Simulator (LAPSS). The characterization of a single 40-junction VMJ cell across a
range of intensities can be seen in the results from the LAPSS test in Figure 25.
Typical Reverse Characteristics
-600
-500
-400
-300
-200
-100
0
100
-7000 -6000 -5000 -4000 -3000 -2000 -1000 0 1000
Vr, INSTANTANEOUS REVERSE VOLTAGE (V)
Ir,
INS
TA
NT
AN
EO
US
RE
VE
RS
E
CU
RR
EN
T (
uA
)

37
Figure 25: VMJ Cell I-V Curves from LAPSS
The nominal efficiency of the VMJ cells is at 25 ºC, above which the performance
decreases steadily with increases in temperature. This is typical for all types of
photovoltaic devices, and the rate of the performance degradation is dependent on the
material and the construction of the particular device. Since the VMJ design does not
require conduction wires which would mask large portions of the active photovoltaic
area, the possibility for a freed electron to recombine with a hole in an electron-hole
annihilation process is decreased. This contributes to the overall efficiency of the cell,
and reduces the chance of runaway heat generation which may result in permanent
damage.

38
There are many VMJ cells in operation with solar concentration units around the
world, and the data collected from these units can be used to observe the efficiency losses
due to thermal de-rating. Figure 26 shows the comparison of VMJ cells in a concentrator
application when compared with triple-junction PV cells.
Figure 26: VMJ Cell Efficiency vs. Temperature
Since the VMJ cells are designed to operate under extremely high solar
intensities, large amounts of heat will be absorbed and/or generated within the individual
cells. As was previously discussed, the efficiency of solar cells degrades with increases
in temperature. To obtain the maximum performance it is important that the temperature
of the cells be maintained as low as possible. At high intensities this requires transferring
substantial amounts of heat out of the cells and into a heat exchanger for rejection, except
Efficiency of Concentrator PhotoCells Vs. Temperature
(Solar Spectrum)
0.00%
5.00%
10.00%
15.00%
20.00%
25.00%
30.00%
35.00%
25 35 45 55 65 75 85 95 105 115 125
Temperature in Degrees C
Co
nvers
ion
Eff
icen
cy
Silicon Based Tripple Junction Based

39
in cases where operating at these reduced efficiencies is acceptable. A maximum limit
must be avoided, above which catastrophic failures will occur from the delaminating of
the junctions and the melting of the electrical contacts. The VMJ cells are very rugged
however, and are able to withstand high temperatures up to 600 ºC.
3.1.3 Considerations with Laser Power Beaming
The demonstrated conversion efficiency of the VMJ cells is in the 20 – 25 %
range for full spectrum light, which is an average value across the frequencies of the solar
spectrum. As indicated by the quantum efficiency peak in Figure 23, the conversion
efficiency of the cell increases as the energy of the incident photons approaches the
indirect band gap energy of silicon in the near-infrared region (around 1000 nm). The
indirect band gap for silicon cells ranges from 1.125 - 1.2 eV depending on its crystalline
structure. With incident laser energy in the 800 - 1000 nm range, the theoretical
conversion efficiency of the cells will approach 50 - 60 %. It is also expected that the
VMJ cells will maintain the same linearity for high laser power concentrations as was
previously noted in the case of the solar spectrum in Figure 25.
A limiting factor in the performance of the VMJ cell under HILPB conditions is
the energy profile of the incident light. Since the cell is made up of series junctions, it is
ideal to have uniform illumination across the entire convertible surface. A single or
group of weaker junctions (resulting from relatively less illumination) will limit the
overall output from the cell. Since the cell is a series stack of many individual current

40
sources, the overall stack current will be limited by the weakest junction‟s contribution.
The problem arises with HILPB, since the very nature of the propagation of a laser beam
is not uniform, but fundamentally Transverse Electro-Magnetic Gaussian (TEM00) in
profile [32]. This is a primary issue that will be explored later in this paper.
Figure 27: Gaussian Cell Illumination
The ability to exploit the dual use potential of the HILPB technology for both
power transmission and communications is very substantial. Work has been done in
determining the transient response of gallium arsenide and silicon solar cells using short
laser pulses [33]. At laser intensities of 50 watts per cm2 (500 suns), the GaAs cells
exhibited a high frequency roll-off on the order of 1-2 GHz, and the Si cells exhibited a
high frequency roll-off on the order of 5 MHz when subjected to a 840 nm and 1.06
micron, 25 nS pulse, respectively. These roll-offs set the initial bounds for practical
communication bandwidth.
41
In the future implementation of HILPB, when the infrastructure is in the vicinity
of life forms, the operational frequency of the laser can be shifted to an eye-safe region.
High current density GaAs and GaSb photovoltaic materials have been developed for
HILPB [34], and they are optimized for operation in the spectral range of 1300-1680 nm.
3.2 Lasers
3.2.1 State of the Art and Beyond
The recent decade has seen the rapid development of compact high energy solid
state lasers, driven by the market need in the manufacturing sector for cutting and
welding applications. There is an ever increasing selection of COTS kilowatt range
lasers, and the continual development and accessibility of these lasers will benefit the
HILPB system.
When considering the feasibility of a HILPB system in a particular application,
the end-to-end system efficiency must be considered in order to make a fair assessment.
This includes the electrical to optical conversion efficiency of the laser source. Although
there have been many recent advances in the field of solid state lasers contributing to
compact packaging solutions, the average solid state laser efficiency is roughly 10%. In
order for HILPB to become a viable option for practical wireless power transfer, each

42
efficiency component of the system must be improved to provide for a higher end-to-end
system efficiency.
Fortunately, a new class of diode pumped alkali vapor lasers (DPALs) has been
developed that can offer high electrical efficiencies of 25-30 % [35]. The DPALs are
currently offered at wavelengths which couple well with the efficiencies of existing
photovoltaic technologies: silicon at 895 nm (cesium), and GaAs at 795 nm (rubidium)
and at 770 nm (potassium). These lasers will offer the ability to expand into the multi-
kilowatt range through a single aperture by paralleling multiple laser modules. This
would open up potential large-scale applications such as HILPB propulsion in order to
raise satellites from LEO to GEO [36].
For the past few decades, much of the development of the High Energy Laser
(HEL) has been directed towards weapons applications [37]. Much of this same
technology is also directly applicable to power beaming. A typical HEL system consists
of the laser device, beam control and acquisition tracking & pointing (ATP) systems.
43
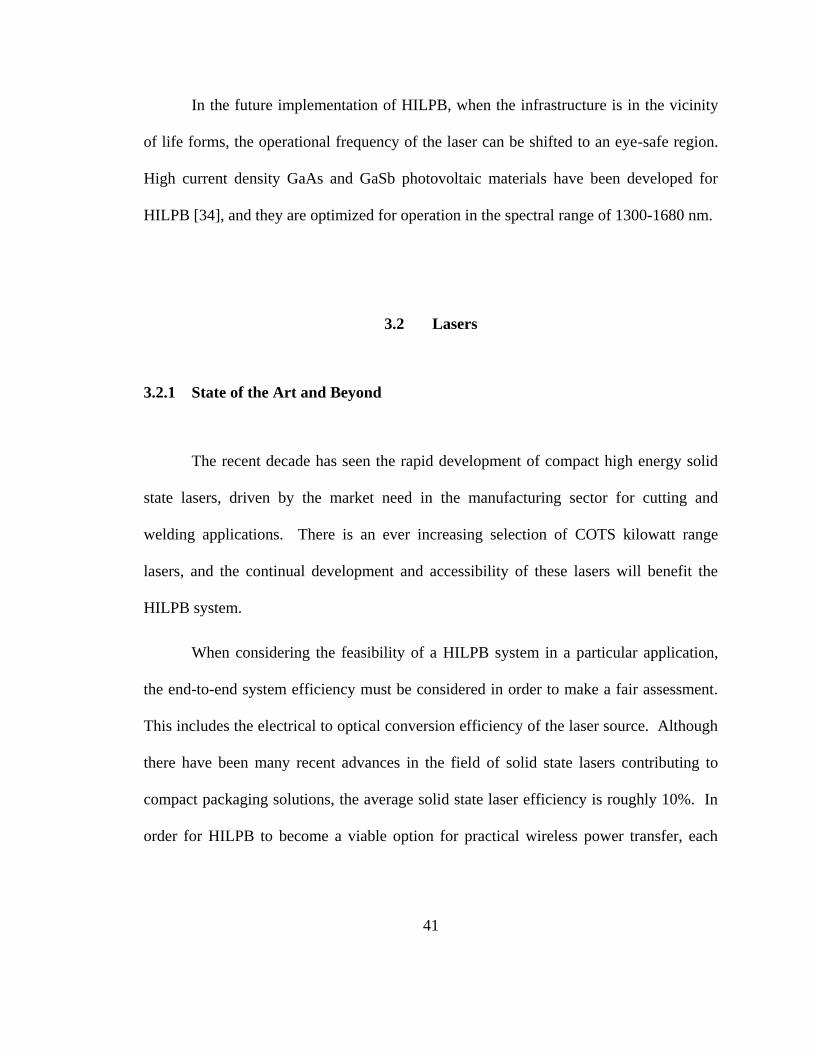
Figure 28: Elements of a HEL System [37]
In a typical HEL weapons application, the ATP sub-system is dealing with a
hostile target, which may be an inbound ordinance. Technologies such as thermal
imaging and pattern recognition may be employed to track the target. Techniques such as
on-line sensing of the beam propagation through the atmosphere and adaptive optics have
successfully been employed to insure the integrity of the beam propagation and to reduce
jitter and compensate for air turbulence in the megawatt class Airborne Laser (ABL)
research and development platform, whose ultimate mission is to destroy tactical ballistic
missiles (TBMs) [38]. The 600 km destruction range of the ABL is a testament to the
maturity of the current HEL technologies, and these military successes can be capitalized
on with laser power beaming. The high-profile ABL program is an ongoing effort, and

44
new advances in laser control will be continually developed to increase the range and
accuracy of the beam [39].
Figure 29: Boeing ABL with Laser Turret [38]
In a power beaming application, since the target is the power receiver, telemetry
can be employed to augment the amount of information available to the ATP sub-system,
thereby increasing the performance of the system.
Weapons applications for lasers have been an active pursuit since the early stages
of their development. The ability to project a large amount of power onto a distant, small
area makes them inherently suited for this task. Also proposed early on was an
application of a high-powered laser for the civilian space program [40]. This proposal by
Kantrowitz in 1972 investigated the feasibility of an earth-to-orbit launch system, in
which a ground based laser provides thermal energy to a rocket propellant (such as

45
hydrogen), for the purpose of reducing the lift-off weight of the vehicle by eliminating
the oxidizer. The technological problems unique to such a laser and the cost aspects of
the system were considered. This set the stage for many similar proposals on laser power
and propulsion during the 1970s. These activities identified several major themes
concerning laser power transmission for space applications, and revealed that advanced
space missions requiring expensive transportation applications showed a high potential
for cost reduction through the use of remote laser power [41]. A comparative analysis by
Holloway and Garrett [42] showed a substantial payoff for remote power beaming to
orbital transfer vehicles, and particularly those employing a direct nuclear or solar
pumped laser source. A preliminary analysis between such a system and a comparable
1 megawatt planar solar photovoltaic system reveals that the laser receivers were lighter
and smaller than the conventional photovoltaic panels, resulting in less drag at lower
altitudes and allowing for fewer Shuttle trips for construction [43].
From these studies in the 1970‟s, a general set of requirements began to emerge
for laser power beaming in space. The remote deployment of the system demands that
the laser be capable of long-term operation without significant maintenance, which
suggests either solar or nuclear powered lasers. Also, since the largest payoff is in high-
power applications, the laser must be capable of supplying a high amount of average
power, on the order of 100 kW or greater. This requirement suggests the use of either
continuous wave or rapidly pulsed lasers. Three general laser mechanisms have been
identified to meet these reliability and power requirements: photodissociation lasing

46
driven directly by sunlight, photoexcitation lasing driven directly by sunlight and
photoexcitation lasing driven by thermal radiation.
Several types of organic iodide lasants based on photodissociation have been
identified and successfully solar-pumped, resulting in an emitted wavelength of
1.3 micrometers. Several reports on modeling and experimental results with IBr and
C3F7I lasants have been published [44, 45, 46, 47 and 48], and have found that the lasant
does not require resupply (unlike most chemical lasers) since the lasant molecules tend to
spontaneously recombine, and that the laser remains cool enough to eliminate a thermal
radiator since these lasants absorb almost no visible light. Techniques for further
enhancing the recombination of the photodissociation products are being investigated, as
this will contribute to an increase in laser efficiency.
Figure 30: One-Megawatt Iodine Solar-Pumped Laser [41]

47
The group of direct solar-pumped photoexcitation lasers relies on the electronic-
vibration excitations produced by the sunlight to power the laser action. One such system
being studied is a liquid neodymium (Nd) ion laser, which emits in the near-infrared
region at 1.06 um. Another system is the dye laser, which absorbs in the blue-green
range and emits in the red region near 0.6 um. Although these types of lasers offer good
quantum efficiency and a relatively short wavelength, they require extremely high
excitation to overcome their high threshold for lasing, and are still being researched as to
their feasibility.
The group of indirect photoexcitation lasers driven by thermal radiation typically
has a longer wavelength emission. A blackbody-cavity-pumped laser [49] and a
blackbody-pumped transfer laser [50] operate on the principle of passing preheated
molecules such as CO2 and N2O through a laser nozzle and/or cavity. Although they
offer great potential for converting solar thermal energy to laser energy in space, they can
also convert thermal energy generated by chemical reactions, nuclear power, electrical
power or other high temperature sources.
Although the laser power requirements for space applications are very different
from those of the military, the basic research conducted by these other agencies is
applicable. Future space transportation applications show a high potential for cost
reduction using laser power beaming, and this is driving the research toward higher laser
conversion efficiencies. The development of laser power transmission in space is a
revolutionary technology that will enable exploration missions that were previously not
possible.

48
Figure 31: Laser Power to a Lunar Base and Vehicle [41]
3.2.2 Atmospheric Considerations
The atmosphere has a wide region where it is least susceptible to ionization (least
absorbance) by the longest wavelengths of the light spectrum, as described by Beer-
Lambert‟s Law. For this reason, a laser in the infra-red (IR) region (the region of interest
for this HILPB system) would be optimal for long distance power beaming within the
atmosphere.

49
Figure 32: Atmospheric Optical Window - Wikipedia
Safety is a major consideration in the design and implementation of a HILPB
system. Spurred by the recent developments in weapons-grade ultra-high power pulsed
lasers, beam conditioning and control optics have also been developed. Information
regarding the manipulation and transmission of high powered lasers is generally
classified due to the nature of their application. It is widely known however, that
successful high power laser systems are currently operational, and it follows that the
conditioning and control optics are in place to handle such a system [51]. For many of
the laser weapons systems, a secondary laser is used to test the integrity of the primary
beam between pulses. Many of these systems also rely on optical recognition to track
their targets. This technology could be easily adapted to suit the needs of the laser power
beaming application.
The condition of the atmospheric medium must be considered as an operational
issue for the optimum and safe transmission of power. Various circumstances will have

50
an influence on the nature of the optical propagation. Moisture in the form of rain
droplets will cause a minimal amount of Raleigh and Mie Scattering, as well as
absorption of the laser energy as seen in Figure 33. Fog will have a much larger
attenuation effect, since the aerosol particles are closer in size to the wavelength of the
laser. A denser fog will cause an increase in the scattering and absorption of the laser
energy. Scintillation will also result from the small-scale fluctuations in the index of
refraction of the atmosphere, as depicted by the energy fluctuations at the right edge of
Figure 33. This will cause small variations in the temperature of the atmosphere, leading
to inconsistencies within the laser beam. As the result, the system will be able to function
predictably during rainstorms, but will change its operating characteristics during periods
of heavy fog.
Figure 33: Mie Scattering, Scintillation and Absorption

51
Larger airborne solids, such as particles of sand, will have a dramatic attenuation
effect on the laser energy. To a lesser degree, atmospheric turbulence will also disrupt
the integrity of the beam. Natural events such as sandstorms would hinder the proper
operation of the system.

52
CHAPTER IV
EXPERIMENTAL SETUP
As previously discussed, the HILPB receiver is the part of the system which
converts the optical energy to electrical energy (desirable) and dissipates the
(undesirable) thermal energy. This conversion is accomplished through the vertical
multi-junction (VMJ) cells originally developed by scientists at NASA-GRC and
currently supplied by Photovolt.
Support to develop this system was provided by the Air Force Research
Laboratory (AFRL) Munitions Directorate at Eglin Air Force Base in Florida. The tests
were conducted at Northrop Grumman Space Technology (NGST) Park in Los Angeles,
California and at Lissotschenko Mikrooptik GmbH (LIMO) Laser Applications
Laboratory in Dortmund, Germany. The large distance from these locations to the
Industrial Space Systems Laboratory (ISSL) in Cleveland, Ohio facilitated the need to
develop portable hardware to conduct the experiments.

53
The receiver was designed to maximize the conversion potential of the VMJ cells
for laser applications, by tailoring the geometry of the receiver to the beam and by
providing sufficient cooling and electrical connections. These prototype receivers are
supported by data collection electronics, which were developed specifically for this
application to automatically track the voltages, currents and temperatures during the
experiments.
4.1 HILPB Receiver Design and Construction
The design and construction of the HILPB receiver addresses four main issues.
First, the receiver needs to provide sufficient thermal dissipation in order to handle the
excess unconverted energy. Second, the materials in the power receiver must have
similar coefficients of thermal expansion to avoid stress fracturing during thermal
cycling. Third, the electrical paths and connections in the receiver must be of low
resistance in order to minimize electrical losses. Lastly, the receiver must provide
electrical isolation for the junctions in the VMJ cells as well as for the electrical routing
and connections.
A standard COTS heat-sink was selected and modified for the receiver to permit
rapid prototyping of the design. Figure 34 shows the Zalman unit, which is typically
used to dissipate approximately 100 watts of thermal energy while maintaining a 60 ºC
temperature for a computer processor inside of a forced-air enclosure. The initial phase

54
of laser testing was to be at 100-200 watt intensities, and so the expected operating
temperature of 60 ºC by the Zalman unit made it an appropriate choice. The unit is
constructed from plated copper to resist tarnishing, and features three heat pipe re-
circulators that are partially filled with a phase transition fluid [52]. The heat pipes
traverse through a radial array of fins, where airflow is induced by a small fan. For the
HILPB application the fan has been replaced by a more powerful motor and propeller
arrangement supplied by the AFRL, in order to increase the cooling capacity beyond the
manufacturer‟s specifications. The front mating surface of the heat-sink is polished to
provide maximum contact area to aid in heat transfer, and it is upon this surface that the
power receiver is constructed.
Figure 34: Zalman 9500 Heat-sink
A cross-sectional illustration of the receiver design is shown in Figure 35. The
VMJ cell is mounted on a substrate using boron nitride filled epoxy resin [53]. This resin
has good thermal conductivity (1.5 watts per meter ºK), and a relatively high maximum
operating temperature (approximately 200 ºC) which is sufficiently far away from the

55
normal operating range of the receiver. In the center of the stack-up is the polished
aluminum nitride substrate [54]. Aluminum nitride has very good thermal performance
characteristics (175 watts per meter ºK) and low thermal expansion (4.6E-6 from 20-400
ºC) to match the silicon VMJ cells, and good dielectric strength (10E14 ohm-cm) to
provide electrical insulation. It is commonly used as a substitute for the standard FR4
fiberglass in printed circuit board (PCB) construction for better thermal conductivity.
These characteristics make it ideal for the HILPB receiver application. The substrate is
mounted to the heat-sink using another layer of the boron nitride epoxy resin.
Figure 35: Receiver Cross-Sectional Stack-up
The electrical paths were routed using a ferrite-nickel-cobalt alloy wire known as
Kovar™ [55]. Kovar™ is a material commonly used for bond wires within
semiconductor construction, since its coefficient of thermal expansion (3.3E-6 from 20-
100 ºC) is similar to that of silicon, which makes it an appropriate material to use with the
VMJ cells. 6 % silver plating was applied to the Kovar™ wire, resulting in a low
electrical resistance of 31.9 Ω per 1000 ft. The routing wires are attached to the outer
two junctions of the VMJ cell with an electrically conductive silver-filled adhesive paste

56
[56]. The paste has a high melting temperature (962 ºC) and a low electrical resistivity
(3.0E-5 Ω-cm).
Basic thermal analysis was performed to determine the approximate maximum
theoretical temperature of the receiver during HILPB operation. This was accomplished
by considering the thermal conductivity and the dimensions, then calculating the thermal
resistance for each material in the stack. For the purpose of this calculation the complete
receiver is interpreted as a bulk resistance, and so the tabulated values are combined with
the ambient temperature and the optical input power to determine the average steady-state
temperature of the receiver [57].
TABLE I: THERMAL ANALYSIS OF THE LASER POWER BEAMING RECEIVER
With an ambient temperature of 20 ºC, the manufacture‟s cooling fan running at
2,600 RPM, 30 % conversion efficiency for the VMJ cells and an input power of 130
optical watts, Table 1 yields an average theoretical receiver temperature of 51.4 ºC. With
an input power equal to a value of 220 optical watts, the average theoretical receiver
temperature is 73.15 ºC. Although in practice there will be a temperature delta at each of
the junctions, as well as a gradient across each of the materials, the calculated results give

57
a good indication as to the expected performance of the receiver. By upgrading the stock
fan, these temperatures can be decreased, thus increasing the upper limit of the maximum
thermal load the system can dissipate.
The published airflow data for the original cooling fan are 20.6 cubic feet per
minute (CFM) at 1,350 revolutions per minute (RPM) and 36.5 CFM at 2,600 RPM. In
replacing the original cooling fan with a new motor and propeller, a rough estimate was
made to determine an approximate operating speed needed to achieve the original airflow
specification. The new motor has a 1 inch diameter hub, and an 8 inch diameter propeller
with two blades at a 4.3 inch pitch. These dimensions are used to calculate the amount of
air displaced from the new propeller advancing by one revolution, as illustrated in
Figure 36.
Figure 36: Propeller Path Representing Displacement
The volume of air displaced by one revolution of the propeller is determined by
calculating the volume of air created from one revolution of the advancing propeller, and
subtracting the volume occupied by the center hub, as shown in the following
calculations. A bulk aerodynamic efficiency of 60 % is selected to account for the

58
slippage of the propeller, the compression of the air, the efficiency of the airfoil and the
use of a two blade propeller:
𝐷𝑖𝑠𝑝𝑙𝑎𝑐𝑒𝑚𝑒𝑛𝑡𝑝𝑟𝑜𝑝 = 𝜋 × 𝑟𝑎𝑑𝑖𝑢𝑠𝑝𝑟𝑜𝑝2 × 𝑝𝑖𝑡𝑐 (4.1)
𝐷𝑖𝑠𝑝𝑙𝑎𝑐𝑒𝑚𝑒𝑛𝑡𝑝𝑟𝑜𝑝 = 0.125 𝑓𝑒𝑒𝑡3 (4.2)
𝐷𝑖𝑠𝑝𝑙𝑎𝑐𝑒𝑚𝑒𝑛𝑡𝑢𝑏 = 𝜋 × 𝑟𝑎𝑑𝑖𝑢𝑠𝑢𝑏2 × 𝑝𝑖𝑡𝑐 (4.3)
𝐷𝑖𝑠𝑝𝑙𝑎𝑐𝑒𝑚𝑒𝑛𝑡𝑢𝑏 = 0.00195 𝑓𝑒𝑒𝑡3 (4.4)
𝐷𝑖𝑠𝑝𝑙𝑎𝑐𝑒𝑚𝑒𝑛𝑡𝑡𝑜𝑡𝑎𝑙 = 0.6 × 𝐷𝑖𝑠𝑝𝑝𝑟𝑜𝑝 − 𝐷𝑖𝑠𝑝𝑢𝑏 (4.5)
𝐷𝑖𝑠𝑝𝑙𝑎𝑐𝑒𝑚𝑒𝑛𝑡𝑡𝑜𝑡𝑎𝑙 = 0.074 𝑓𝑒𝑒𝑡3 (4.6)
In order to match the original 36.5 CFM of airflow, the new motor must turn at
the following speed:
𝑠𝑝𝑒𝑒𝑑 =𝑎𝑖𝑟𝑓𝑙𝑜𝑤 𝑑𝑒𝑠𝑖𝑟𝑒𝑑
𝐷𝑖𝑠𝑝𝑙𝑎𝑐𝑒𝑚𝑒𝑛𝑡 𝑡𝑜𝑡𝑎𝑙 (4.7)
𝑠𝑝𝑒𝑒𝑑 = 494.4 𝑅𝑃𝑀 (4.8)
The new propeller allows the new motor to turn at a much slower rate than with
the original fan. At higher speeds the new propeller provides cooling capability to the
heat sink well beyond the manufacture‟s original design, which will allow for higher
power tests to be conducted.
The temperatures at various points in the receiver are monitored by five type-K
thermocouples. Two miniature 0.020 inch square channels have been machined into the
front face of the heat-sink, as illustrated by the cross pattern in Figure 37. Four transition

59
junction thermocouple probes are embedded into these channels with the boron-nitride
epoxy, thereby residing between the face of the copper heat-sink and the aluminum-
nitride substrate. Each thermocouple probe extends toward the center of the face by a
different distance in order to depict the temperature profile across the face of the heat-
sink. The fifth thermocouple is mounted on the top surface of the aluminum-nitride
substrate next to the VMJ cell, in order to monitor the temperature difference between the
surface and the center of the receiver directly underneath the VMJ cell array.
Figure 37: Probe Channels Machined into the Face
The electrical routing and connections are physically supported by GPO-3 high
temperature electrical grade glass polyester laminate material. This material can
withstand 120 ºC, and provides a rigid insulating surface for the electrical connection
points. Aluminum mounting brackets were designed and machined to bolt the remaining
structural components of the receiver together, and to serve as a mounting point for the
clamps used on the optical bench.

60
The mounting and routing arrangement for a completed four cell receiver is
shown in Figure 38. On this particular receiver, the wiring allows each cell to either be
used individually or together in a parallel configuration. Single, double, nine and eleven
cell arrays have also been designed and constructed to accommodate a variety of
experiments to be covered in the next chapter.
Figure 38: Instrumented Four Cell HILPB Receiver
In order to obtain some preliminary data points, and to empirically verify the
thermal dissipation capabilities of the HILPB receivers, a solar concentration apparatus
was designed and constructed from steel and stainless tubing (Figure 39). A 30 inch by
40 inch acrylic Fresnel lens was selected to focus the solar energy down to the size of the

61
receiver. Various apertures were used to regulate the amount of light entering the lens,
thus providing a way to control the energy being delivered to the receiver. The
concentrator is manipulated with a pivoting indexer, so it can be manually adjusted to
follow the arc of the sun moving across the sky. The receiver is mounted at the focal
point of the lens, and is electrically connected to multi-meters and a variable load.
Provisions were made to record the thermal, electrical and optical data during the
experiments.
Figure 39: HILPB Receiver in the Solar Concentrator
Translational and rotational micro-positioning stages were assembled together to
provide positional control of the receiver beneath the Fresnel lens. The stages allow for
six degrees of freedom to enable alignment with the focal point.
During the day of the experiment the solar energy reaching the lens was measured
to be 800 watts per meter2. A mask was used to limit the input to a circular area with a
radius of 25.4 cm. The lens transmission efficiency was 90 % and the focusing efficiency
was approximately 80 % (due to the difficulty in obtaining precise optical alignment)
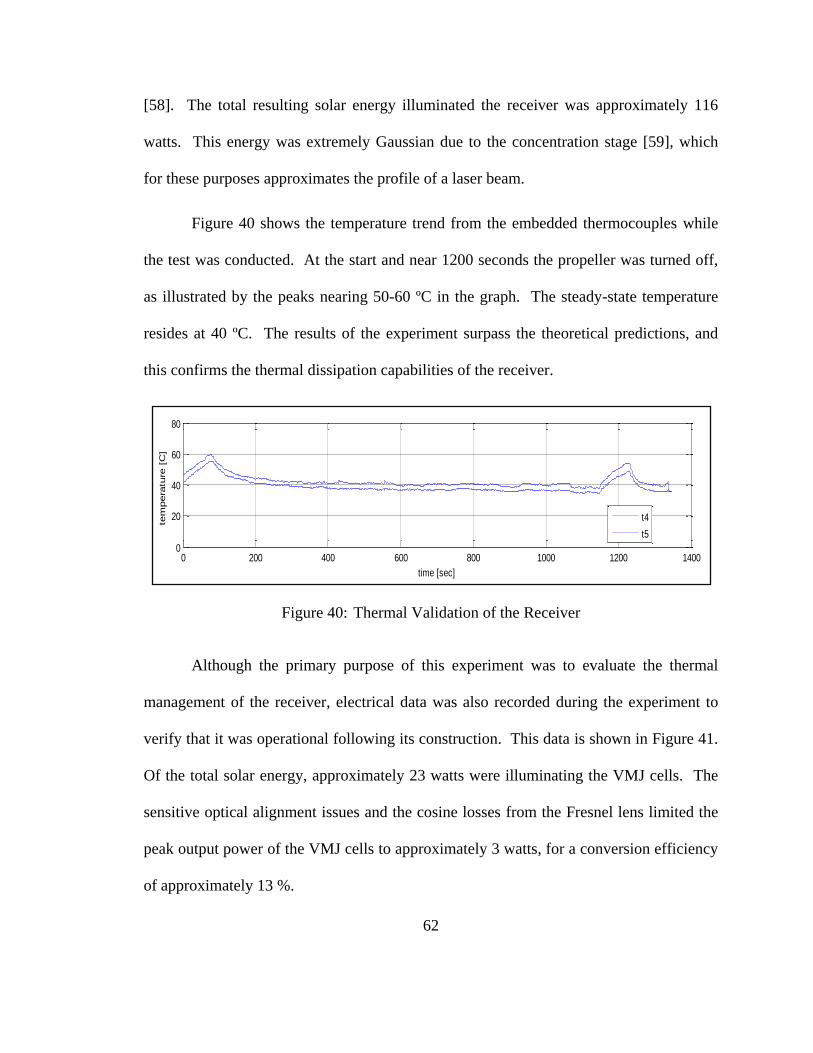
62
[58]. The total resulting solar energy illuminated the receiver was approximately 116
watts. This energy was extremely Gaussian due to the concentration stage [59], which
for these purposes approximates the profile of a laser beam.
Figure 40 shows the temperature trend from the embedded thermocouples while
the test was conducted. At the start and near 1200 seconds the propeller was turned off,
as illustrated by the peaks nearing 50-60 ºC in the graph. The steady-state temperature
resides at 40 ºC. The results of the experiment surpass the theoretical predictions, and
this confirms the thermal dissipation capabilities of the receiver.
Figure 40: Thermal Validation of the Receiver
Although the primary purpose of this experiment was to evaluate the thermal
management of the receiver, electrical data was also recorded during the experiment to
verify that it was operational following its construction. This data is shown in Figure 41.
Of the total solar energy, approximately 23 watts were illuminating the VMJ cells. The
sensitive optical alignment issues and the cosine losses from the Fresnel lens limited the
peak output power of the VMJ cells to approximately 3 watts, for a conversion efficiency
of approximately 13 %.
0 200 400 600 800 1000 1200 14000
20
40
60
80
time [sec]
tem
pera
ture
[C
]
0 200 400 600 800 1000 1200 14000
20
40
60
80
time [sec]
tem
pera
ture
[C
]
0 200 400 600 800 1000 1200 14000
20
40
60
time [sec]
fan s
peed [
%]
t1
t2
t3
t4
t5

63
Figure 41: Electrical Validation of the Receiver
4.2 Data Acquisition
In order to characterize the performance of the receiver, a variable load may be
used in conjunction with a current meter and a volt meter, as illustrated in Figure 42. By
varying the value of the load from open-circuit to short-circuit for a given optical input
and recording the data, an I-V curve for the receiver may be constructed.
Figure 42: Schematic for Characterizing the Receivers

64
This characterization process was automated by developing a data acquisition
(DATAQ) system that records the voltage, current, and temperature information across
multiple channels. The system is comprised of three subsystems: an active variable load,
the sensing circuitry, and the data logging and processing. Care was taken in the design
of the buffering, gain and sampling circuitry to provide the cleanest possible analog
signals with highly accurate digital representations. For example, the current sensors
employ an open-loop/Hall Effect configuration, thus minimizing noise interference and
current draw. Also, in terms of accuracy, the data is represented by 16-bit words, and
these values are sent to the computer at an update rate across all channels at 6 Hz. There
is extra filtering in the power conversion circuitry to minimize ripple. The functional
block diagram of the DATAQ system is illustrated in Figure 43.
Figure 43: DATAQ Functional Block Diagram
For reliability and modularity, the DATAQ system is divided into two PCBs, as
shown in Figure 44. The Xilinx Spartan-3 development board serves as the mother
board, where a 200k gate field programmable gate array (FPGA) is utilized for

65
processing and sending the data to a personal computer through a RS-232 interface for
logging and analysis. The power, channel sensing and analog to digital conversion
circuitry has been integrated together within a separate daughter board, which interfaces
to the main development board through multiple headers. This board was carefully
designed to provide separation between the analog and digital signals and power planes
to provide for noise immunity.
Figure 44: DATAQ Hardware
After the data from the electronics is sent to the computer, it is displayed on a
Graphical User Interface (GUI) (Figure 45). The real-time plotting of the I-V data, and
the continuous recalculation of the power output during the experiments allow for an

66
efficient use of the time in the laser laboratory, by automating the data collection process
as much as possible.
Figure 45: DATAQ GUI Plotting a Typical I-V Curve
4.3 Lasers and Optics
There were a total of four different continuous-wave fiber-coupled lasers
available to conduct the experiments. Three of the lasers were 70 watt capacity units
with 200 um diameter fibers, and had wavelengths of 808 nm, 940 nm and 976 nm

67
(LIMO70-F200-DL808, LIMO70-F200-DL940, LIMO70-F200-DL976). These three
lasers were used for determining the best wavelength for receiver efficiency. The fourth
laser was a 200 watt capacity 980 nm unit (HLU200-F400-980P2-M2), and this was used
for all of the high power tests.
The lasers are complete systems including the power, control, water chiller and
diode module. They are controlled by limiting the current delivered by the power supply,
to regulate the amount of generated optical energy. A calibration curve describes the
relationship between electrical input and optical output of the laser, and this is verified
regularly with a power meter.
Figure 46: LIMO Turnkey Laser System

68
The wavelength of the laser deviates slightly, as can be seen in Figure 47. Here a
980 nm laser is measured to be operating at 977.2 nm, with a spectral bandwidth of
2.9 nm. For the purposes of HILPB, these variances are negligible.
Figure 47: LIMO Laser Spectral Measurement
As was previously discussed, the energy profile across laser beam is Gaussian in
nature. This can be measured and imaged, as shown in Figure 48. The graph shows the
very tip of the Gaussian distribution, and the picture show the entire profile, as captured
by a thermal imaging camera.
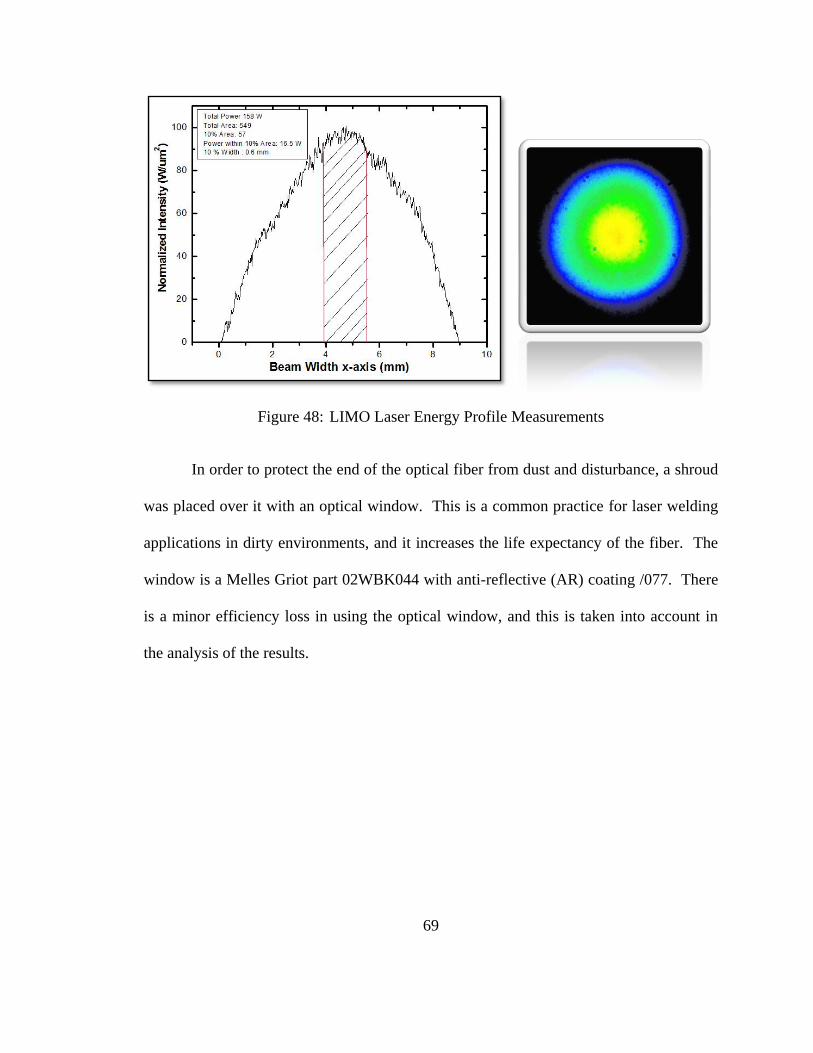
69
Figure 48: LIMO Laser Energy Profile Measurements
In order to protect the end of the optical fiber from dust and disturbance, a shroud
was placed over it with an optical window. This is a common practice for laser welding
applications in dirty environments, and it increases the life expectancy of the fiber. The
window is a Melles Griot part 02WBK044 with anti-reflective (AR) coating /077. There
is a minor efficiency loss in using the optical window, and this is taken into account in
the analysis of the results.

70
Figure 49: Melles Griot Transmittance Curve
Figure 50: HEBBAR Coating for Near-Infrared /077
In order to observe the effects of the Gaussian laser beam versus a flat profile on
the performance of the VMJ cells, a LIMO flat-top optics stage was used to condition the

71
beam. This optics stage can provide for a profile variation within 1 % at efficiencies of
around 80 %.
Figure 51: Typical Beam Profiles with the Flat-top Optics
Figure 52: Illustration of the Flat-top Optics

72
4.4 Complete Apparatus and Methodology
To date, there have been over 10 HILPB receivers designed and constructed.
Each one served a different purpose, either to investigate a particular issue or demonstrate
a certain performance. A few of the receivers that were used to obtain predominantly
significant results are shown here.
Figure 53: 9 and 40-junction Receiver

73
Figure 54: Four and Nine-Cell Square Array Receivers
Figure 55: Eleven-Cell Radial Orientation Receiver

74
A typical HILPB test consists of the laser source, a mount for the optical fiber, a
receiver mounted to a 3-axis translational stage, the cooling fan, the DATAQ electronics
and a logging computer (Figure 56). Depending on the test requirements, additional
optics stages or beam trimmers may be required. Supporting equipment such as beam
guards and dumps, IR viewfinders & cameras and laser pyrometers were also used for
safety as well as for calibration and alignment.
Figure 56: Illustration of the HILPB Test Rig
When conducting a test, the first thing was to check the laser calibration with a
meter to insure that it was operating to its full potential. Next, all of the hardware for the
experiment was fastened down to the optical bench and aligned as eyesight permits. At

75
this point the appropriate electrical connections were made, and the DATAQ was brought
online. The laser was then operated at a relatively low intensity while the receiver
position was adjusted in three axes, until the maximum output power was generated.
This was accomplished by continually sweeping the load to trace new I-V curves at each
new location of the receiver, until the output power of the receiver was observed to
„peak‟. Performing this initial alignment was usually the most involved step in the
process. The laser power was then increased to the levels required by the test plan, and
the receiver was once again „peaked‟, typically requiring only minor adjustment. This
final adjustment was necessary due to wave-front variations over the operational range of
fiber coupled lasers, and with extended tests it was a good practice to periodically
recheck the alignment. At this point, the test plan was executed, while the cooling fan
was controlled to regulate the receiver temperature. Devices such as IR viewfinders and
cameras were used to image the beam and make notes about the size, distance, amount
and alignment of the illumination. These observations would later be used to calculate
efficiencies.
The amount of power developed by the receiver is automatically reported by the
DATAQ system, but the efficiencies must be manually calculated. For the purposes of
this research, the efficiency calculations describe the amount of photonic energy
illuminating the cells with respect to the amount of generated power of the receiver. The
focus is on developing the greatest amount of power at high efficiencies, and as such the
performance of the HILPB receiver refers to the isolated unit that receives photonic
energy and converts it into electric energy while dissipating the excess thermal energy.
76
This performance is dependent on the response of the VMJ cells to laser energy at a given
frequency, intensity and profile, the geometric packing efficiency of the VMJ cells on the
surface of the receiver, the capacity of the thermal system to reject the excess heat, and
the efficiency of the electronics to maximize and measure the power output. It does not
include the factors associated with the generation and transmission of the laser energy,
and it takes into account the over-fill of the beam beyond the convertible surface of the
VMJ cells.

77
CHAPTER V
EXPERIMENTAL RESULTS
Various apparatus was designed and constructed to first evaluate the feasibility of
using the VMJ cells in a HILPB application, and then to start to answer some of the more
complex issues through experimentation. The performance of a parallel array of cells
was observed with different geometries, under different intensities, wavelengths and
wave fronts. The tests were conducted at the NGST and LIMO laser laboratory. The
limited availability of these laser testing facilities facilitated the need to conduct efficient
test plans, and a great emphasis was placed on safety due to the weapons-grade nature of
the lasers.

78
Figure 57: AFRL and CSU Personnel in the NGST Lab
5.1 Parallel Cell Back-Feeding
The purpose of this test was to investigate the back-feeding phenomenon of VMJ
cells wired in parallel. This effect is encountered in a conventional solar array under
conditions where they are subjected to non-uniform illumination (such as from partial
shading or debris on the panel), and this is commonly solved by inserting blocking diodes
between the cells to prevent the current flow from back-feeding into a weaker cell. The

79
downside of doing this is that a voltage drop will occur across the diodes during normal
operation of the array, resulting in a slightly lower output power.
Since the beam profile of the laser is non-uniform, this phenomenon could be
encountered when using a parallel array of VMJ cells for HILPB. To investigate this, an
experiment was conducted on a multi-cell receiver, using two of the available VMJ cells
(referred to as the top and the top-right cell) connected in parallel. These particular cells
were chosen because they represent two different grades of VMJ cells, with one offering
consistently better performance than the other. This would establish the conditions for
the imbalance to occur. Low-loss diodes were selected for the blocking application, and
these could be introduced into the circuit to observe their effects. Ammeters were used to
measure the amount and polarity of the individual branch current contributions.
Figure 58: Connections With and Without Blocking Diodes
The test was conducted using a 200 watt 980 nm laser, with the beam directed in
proximity of the two cells as to allow for each to receive the similar profile. The test was
conducted with three different amounts of beam overfill to vary the profile illuminating
the cells, and was repeated both with and without the blocking diodes in the circuit. The

80
receiver temperature was maintained within 50–60 °C. The results of these tests are
shown below, and the relative diameter and placement of the beam overfill is illustrated.
Figure 59: Cell Back-feeding with Small Overfill
Figure 60: Cell Back-feeding with Medium Overfill
Figure 61: Cell Back-feeding with Large Overfill
The negative currents can be seen in Figures 59-61 when the blocking diodes are
not present, and represent the back-feeding of the current from the strong cell into the
weak cell. The addition of the blocking diodes does correct the flow, but at the expense
of the inherent power loss through the diodes, to the extent that the diodes did not
improve the overall output power for any of the experimental results, and it was observed

81
in these instances that their presence was more detrimental than beneficial. This is due to
the voltage drop losses exceeding the branch current gains, leading to a decrease in
output power.
5.2 Radial versus Square Geometry
The purpose of this test was to determine an effective orientation of the cells with
respect to the non-uniform laser illumination. Since the junctions within a VMJ cell are
all oriented in the same direction, each one will not receive equal intensities of laser light.
This permits the possible scenario where the VMJ cell may be limited by the performance
of its weakest junction, and the excess energy of the other junctions would then be
wasted.
To explore this premise and quantify the degree of its severity, two receiver
geometries are considered, a 9-cell square array and a 9-cell radial orientation array. The
9-cell square array simply orients all of the p-n junctions in the same direction, which
enables for the maximum junction to junction delta when illuminated with a Gaussian
beam. The receiver is hard-wired for three stacks of three parallel cells, and for this test
each stack is patched together to produce nine parallel cells.

82
Figure 62: Nine-Cell Square Receiver
The 9-cell radial orientation array places all of the junctions in eight of the cells
on a radial to the center-point of the receiver. When centered with the laser beam, the
Gaussian profile will extend down the length of each p-n junction, rather than across the
junctions. In this way, the junction-to-junction delta is minimized, resulting in an equal
average illumination. A compromise to this rule is made by placing a single cell at the
center of the array, for the purpose of maximizing packing density. Each cell has its own
dedicated pair of leads. This receiver also has two additional miniature cells mounted in
the corners, which were not used for this test.
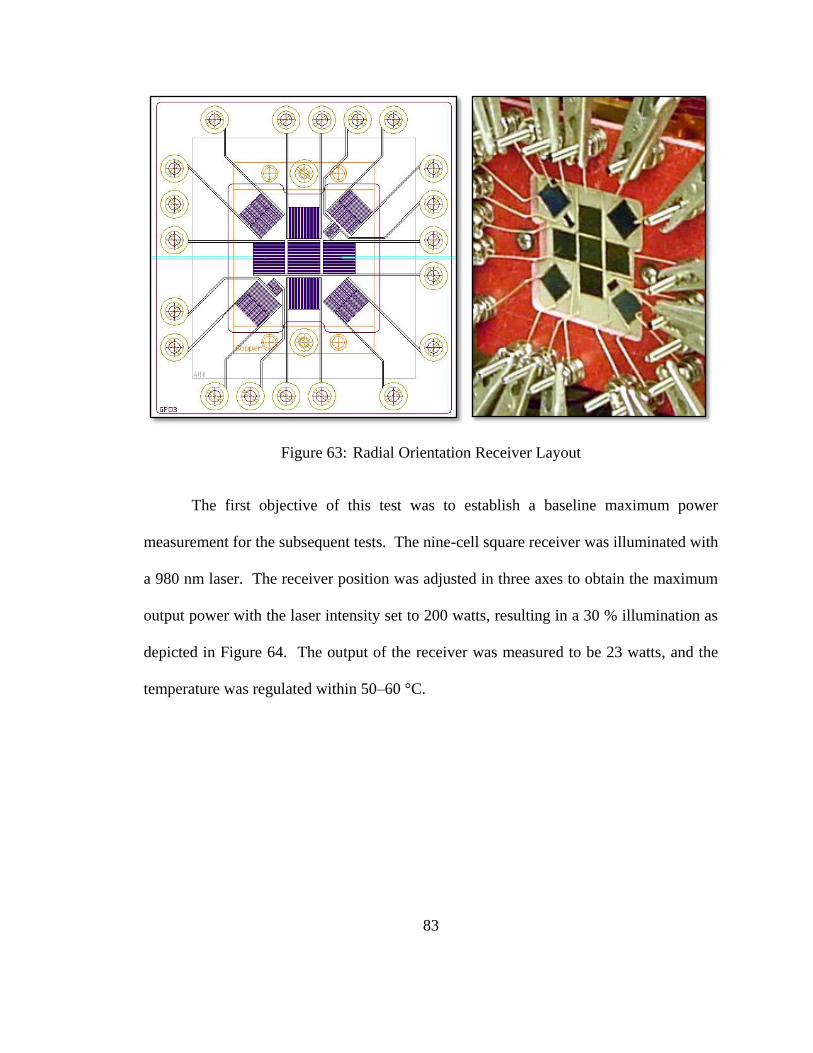
83
Figure 63: Radial Orientation Receiver Layout
The first objective of this test was to establish a baseline maximum power
measurement for the subsequent tests. The nine-cell square receiver was illuminated with
a 980 nm laser. The receiver position was adjusted in three axes to obtain the maximum
output power with the laser intensity set to 200 watts, resulting in a 30 % illumination as
depicted in Figure 64. The output of the receiver was measured to be 23 watts, and the
temperature was regulated within 50–60 °C.

84
Figure 64: Square Receiver at 30 % Fill, 23 Watts Pmp
For the next part of the test, the radial orientation receiver was used. First, the
same conditions were used as with the previous test to align the receiver at full laser
intensity, starting with the inner grouping of five cells. Next the individual cells in the
array were characterized in order to determine their contribution to the overall output of
the receiver. The resulting output I-V curves are shown below, and the relative diameter
and placement of the beam overfill is illustrated.

85
Figure 65: Top Cell I-V Curve, 7.471 Watts Pmp
Figure 66: Right Cell I-V Curve, 7.467 Watts Pmp
Figure 67: Bottom Cell I-V Curve, 7.485 Watts Pmp
Figure 68: Left Cell I-V Curve, 7.385 Watts Pmp

86
Figure 69: Center Cell I-V Curve, 6.852 Watts Pmp
It is interesting to note that the center cell, where the beam energy is the strongest,
did not have a higher output power than the four immediately surrounding cells. This
may be attributed to the fact that unlike the surrounding cells, the center cell does not
comply with the radial configuration, and even though it is receiving the highest intensity
portion of the laser beam, it is unable to convert the energy efficiently since it is seeing an
uneven power distribution across its p-n junctions. This is an indication into the
magnitude of the detrimental effect of uneven power distribution across the p-n junctions,
and is also a first glimpse into the validity of the radial arrangement of the surrounding
cells.
For the next part of the test, data was collected from both the inner four and five
cell arrangements wired in parallel. These tests were performed with the same optical
alignment as before and at the 200W laser power level. The resulting output I-V curves
are shown below, and the relative diameter and placement of the beam overfill is
illustrated.

87
Figure 70: Four-Cell I-V Curve, 19.976 Watts Pmp
Figure 71: Five-Cell I-V Curve, 23.935 Watts Pmp
A comparison of the results obtained in Figures 70 and 71 with those in Figures
65-69 shows that the four inner cells are contributing the majority of the radial receiver‟s
total output. Although the center cell is illuminated by the most intense part of the laser
beam, it is converting less energy than its four neighboring cells. As stated earlier, this
may be attributed to the center cell not complying with the radial configuration.
The five-cell output power of 23.935 watts (Figure 71) was calculated to be a
conversion efficiency of 22.75 %. Comparing these results with those in Figure 64
demonstrates that five cells in the radial orientation can outperform nine cells in the
square orientation, providing further validation of the radial concept.
For the final portion of the test, the over-fill of the receiver was increased to
involve more of the corner cells in the overall output. As with all of the previous parts of

88
this test the laser was operated at 200 watts, and the receiver temperature was regulated
within 50–60 °C.
Figure 72: 48.09 % Illum., 25.286 Watts Pmp at 26.2 % Ƞ
Figure 73: 37.72 % Illum., 23.479 Watts Pmp at 31.12 % Ƞ
Figure 74: 25.24 % Illum., 22.488 Watts Pmp, at 44.39 % Ƞ
The smallest beam over-fill yielded the highest output power collected during the
test, at 25.206 watts. At this level of overfill, the conversion efficiency was calculated to

89
be 26.2 %. The highest conversion efficiency was found to be with the largest beam
over-fill, at 44.39 %.
These results show that a radial orientation of the p-n junctions on the receiver
face will outperform a uniform orientation, and even with less VMJ cells. This
demonstrated the impact of the cell geometry in the receiver design.
5.3 Output Linearity
The objective of this test was to establish an input-output relationship across
different illumination intensities. The nine-cell radial orientation receiver was
illuminated with a 980 nm laser. The receiver position was adjusted in three axes to
obtain the maximum output power with the laser intensity set to 58.2 watts, with an over-
fill as shown in Figure 75.
Figure 75: Linearity Test Over-fill

90
At the 58.2 watt intensity, the load was varied to obtain the characteristic I-V
curve of the receiver. This was repeated at laser intensities of 118, 146 and 200 watts,
without readjusting the amount of beam overfill, while the temperature of the receiver
was controlled between 50-60 °C. The resulting output data is shown below.
Figure 76: Linearity Test at 58 Watts
Figure 77: Linearity Test at 118 Watts
Figure 78: Linearity Test at 146 Watts

91
Figure 79: Linearity Test at 200 Watts
A comparison graph of the laser input power versus converted electrical output
power is shown in Figure 80. It can be seen that the response of the receiver for this
range of optical power is fairly linear, within the 200 watts of available laser energy.
Figure 80: Linear Input-Output Power Relationship
5.4 Determining the Optimal Laser Wavelength
At low injection levels, Shockley equations are adequate for describing the
current-voltage relationship of p-n junction semiconductor devices. High injection levels

92
cause a change in the carrier generation and recombination process, resulting in a
narrowing of the band gap [60]. If the conversion efficiency is to be maintained at high
intensities, the energy wavelength must adhere to this non-linear constraint. In
semiconductor material, beyond the cutoff wavelength the absorption coefficient
decreases rapidly [61], as illustrated by the knee in the silicon curve in Figure 81. In the
case of the band-gap narrowing, the curve would shift, and depending on the thickness of
the semiconductor material there may not be sufficient depth of penetration for efficient
photoelectric conversion, resulting in saturation. Another possible phenomenon is the
increase in the wavelength of light as it penetrates through the silicon, due to oblique
collisions in the capture cross section, until the energy is beyond the band-gap of the
material. Either scenario would lead to an increase in heating and a decrease in
efficiency.
Figure 81: Semiconductor Optical Absorption Coefficients

93
Although the original quantum efficiency information for the VMJ cells can be
used to initially determine the best range for narrowband illumination, this needs to be
verified at continuous high intensities to verify that saturation is not occurring. An
experiment utilizing similar lasers at different operational frequencies will verify this, and
reveal the optimal operating frequency for maximum efficiency. Unfortunately, current
technology does not provide for an infinitely tunable high power laser, but there are
standardized frequencies that can be selected.
Three standard frequencies within the range of interest were available to conduct
this experiment, and three corresponding lasers at 808, 940 and 976 nm were provided by
LIMO laser. A single cell receiver was used, and to maintain a control during the
experiment the same laser fiber was left in alignment, leaving only the laser diode
module to be replaced between trials. These three lasers had a maximum output of
70 watts, and were identical in all ways except for their frequencies.
The tests were conducted across the full power range of the laser, and the receiver
was aligned in three axes until the maximum output power was achieved. This occurred
at an over-fill amount where 26 watts of laser energy was illuminating the cell, and these
results are tabulated in Tables II, III and IV, with the maximum output power of each test
indicated.

94
TABLE II: 976 NM WAVELENGTH RESULTS
TABLE III: 940 NM WAVELENGTH RESULTS
TABLE IV: 808 NM WAVELENGTH RESULTS
The output power, I-V curves and efficiency data are plotted in Figures 82, 83 and
84, along with images of the experiment. Although the laser beams are observed as three
different colors, they are all in the IR region that is invisible to the human eye. The
coloring effects are artifacts of the digital camera used to image the laser beam.
Rated Operating Adj. Optical Impinging VMJ
Current Optical Optical Window Optical Peak Conversion Receiver
Setpoint Power Power Transmittance Power Power Efficiency Temp.
Amps (A) Watts (W) Watts (W) Watts (W) Watts (W) Watts (W) (%) (°C)
10 9.8 9.114 8.52159 3.6217 1.5481 42.74 24.1
20 25.4 23.622 22.08657 9.3868 3.5402 37.71 24.7
30 40.9 38.037 35.564595 15.1150 5.1722 34.22 27.5
40 56 52.08 48.6948 20.6953 6.4459 31.15 30.1
50 70 65.1 60.8685 25.8691 7.2430 28.00 32.6
LIMO70-F200-DL976 LIMO70-F200-DL976
Rated Operating Adj. Optical Impinging VMJ
Current Optical Optical Window Optical Peak Conversion Receiver
Setpoint Power Power Transmittance Power Power Efficiency Temp.
Amps (A) Watts (W) Watts (W) Watts (W) Watts (W) Watts (W) (%) (°C)
10 9.9 9.207 8.608545 3.6586 1.5198 41.54 24.4
20 25.7 23.901 22.347435 9.4977 3.5398 37.27 25
30 40.9 38.037 35.564595 15.1150 5.0675 33.53 27.6
40 55.1 51.243 47.912205 20.3627 6.1611 30.26 30.1
50.8 70 65.1 60.8685 25.8691 6.8263 26.39 32
LIMO70-F200-DL940LIMO70-F200-DL940
Rated Operating Adj. Optical Impinging VMJ
Current Optical Optical Window Optical Peak Conversion Receiver
Setpoint Power Power Transmittance Power Power Efficiency Temp.
Amps (A) Watts (W) Watts (W) Watts (W) Watts (W) Watts (W) (%) (°C)
10 1.7 1.581 1.478235 0.6282 0.3131 49.83 22.5
20 20.3 18.879 17.651865 7.5020 1.8050 24.06 28.7
30 38.9 36.177 33.825495 14.3758 3.0695 21.35 35.4
40 56.4 52.452 49.04262 20.8431 3.9837 19.11 41.8
49.4 70 65.1 60.8685 25.8691 4.6798 18.09 47.2
LIMO70-F200-DL808LIMO70-F200-DL808
0
1
2
3
4
5
6
7
8
0 5 10 15 20 25 30
Pe
ak
Ele
ctr
ica
l O
utp
ut
(W)
Continuous Optical Input (W)

95
Figure 82: Wavelength Input versus Output
Figure 83: Wavelength Maximum Power I-V Curves

96
Figure 84: Wavelength Conversion Efficiencies
The results from these tests clearly indicate that the 976 nm wavelength offers the
best high intensity performance with these receivers. Comparison graphs are shown in
Figures 85 and 86 to further illustrate this point. It is interesting to note that at the lowest
intensity the 808 nm wavelength offered an efficiency of almost 50 %, but this quickly
dropped at higher intensities. Although this may be indicative of saturation, it may also
be that a large amount of this energy is being reflected back from the surface of the cells
at these intensities. This was noted in the pictures by the amount of visible scattering
around the cell at the 808 nm frequency, and warrants further investigation in the future.

97
Figure 85: Wavelength Output Comparison
Figure 86: Wavelength Efficiency Comparison
5.5 Uniform versus Gaussian Beam Profiles
Although the typically encountered operation of a laser is in a TEM00 resonator
mode (Gaussian), the previously discussed concern over uniform illumination of the
junctions in the VMJ cell warrants an investigation into the effects. The prior experiment

98
in 5.2 successfully compensated for the non-uniform beam by considering the geometry
of the receiver. In this experiment the laser beam is conditioned to a uniform state using
optics stages from LIMO. The beam shaping optics delivers a 44.5 x 44.5 mm square
laser beam within a 1 % variation of intensity.
The first part of the test establishes a baseline for the comparison with and
without the conditioning optics. The nine-cell square receiver was selected for the test,
and was illuminated with a 980 nm laser. The receiver position was adjusted in three
axes to obtain the maximum output power with the laser intensity set to for different
intensities, while the receiver temperature was regulated within 50–60 °C.
Figure 87: Nine-Cell Receiver with Gaussian Beam

99
TABLE V: GAUSSIAN BEAM RESULTS
Figure 88: Gaussian Receiver Output
Figure 89: Gaussian Receiver Efficiencies
After After
Rated Operating Optical Flat-Top
Current Optical Optical Window Optics
Setpoint Power Power Transmittance Transmittance
Amps (A) Watts (W) Watts (W) Watts (W) Watts (W)
10 30.2 28.086 26.26041 22.18794
20 91.2 84.816 79.30296 67.00464
30 150 139.5 130.4325 110.205
39.5 201.9 187.767 175.562145 148.33593
HLU200-F400-980P2-M2
Impinging VMJ
Optical Peak Conversion Receiver
Power Power Efficiency Temp.
Watts (W) Watts (W) (%) (°C)
13.8918 4.3895 31.60 29
41.9513 12.2321 29.16 37
68.9988 18.2832 26.50 47.2
92.8724 23.7778 25.60 47
9-cell Gaussian

100
In the next stage of the experiment, the flat-top optics stage was inserted. The
receiver position was re-adjusted in three axes to obtain the maximum output power with
the laser intensity set to for different intensities, while the receiver temperature was
regulated within 50–60 °C.
Figure 90: Nine-Cell Receiver with Flat-Top Beam

101
TABLE VI: FLAT-TOP RESULTS
Figure 91: Flat-Top Receiver Output
Figure 92: Flat-Top Receiver Efficiencies
After After
Rated Operating Optical Flat-Top Impinging VMJ
Current Optical Optical Window Optics Optical Peak Conversion Receiver
Setpoint Power Power Transmittance Transmittance Power Power Efficiency Temp.
Amps (A) Watts (W) Watts (W) Watts (W) Watts (W) Watts (W) Watts (W) (%) (°C)
10 30.2 28.086 26.26041 22.18794 7.0780 2.2668 32.03 23
20 91.2 84.816 79.30296 67.00464 21.3745 6.7194 31.44 27.2
30 150 139.5 130.4325 110.205 35.1554 10.6178 30.20 31.7
39.5 201.9 187.767 175.562145 148.33593 47.3192 13.8387 29.25 35.7
HLU200-F400-980P2-M2 9-cell Flat-Top Optics

102
The results from the two setups are compared in Figures 93 and 94. Because the
size of the flat-top beam is much larger than the aperture of the receiver, a considerable
amount of laser energy is not being utilized. Therefore, the data for the flat-top portion of
the test does not extend as high as with the Gaussian test. At the lower intensities, the
uniform illumination provided by the flat-top optics demonstrates a performance
increase, which will have to be quantified at the higher intensities in the future with either
a higher power laser or a receiver whose aperture matches the size of the flat-top beam.
Figure 93: Gaussian vs. Flat Top Output Comparison

103
Figure 94: Gaussian vs. Flat Top Efficiency Comparison
5.6 Maximum Power Density
The objective of this test is to obtain the maximum power density performance
with the available equipment. The 200 watt 980 nm laser was selected with a single cell
receiver, so that the beam could be focused down to a smallest diameter possible while
still illuminating the cell. As with the previous tests, the receiver position was re-
adjusted in three axes to obtain the maximum output power while the laser intensity was
set to for different intensities. The final alignment of the apparatus can be seen in
Figure 95. It is important to note that for this test, the nominal receiver temperature was
exceeded, as the concentrated amount of laser energy exceeded the capabilities of the
thermal system. Despite this, the results of the test successfully exceeded all of the
power density numbers thus far.

104
Figure 95: Maximum Power Density Alignment
TABLE VII: MAXIMUM POWER DENSITY DATA
After After
Rated Operating Optical Flat-Top Impinging VMJ
Current Optical Optical Window Optics Optical Peak Conversion Receiver
Setpoint Power Power Transmittance Transmittance Power Power Efficiency Temp.
Amps (A) Watts (W) Watts (W) Watts (W) Watts (W) Watts (W) Watts (W) (%) (°C)
10 30.2 28.086 26.26041 22.18794 11.1607 4.0751 36.51 31.1
20 91.2 84.816 79.30296 67.00464 33.7038 9.6017 28.49 49.4
25 121 112.53 105.21555 88.8987 44.7166 10.7461 24.03 60.5
30 150 139.5 130.4325 110.205 55.4338 7.9400 14.32 67.5
35 177 164.61 153.91035 130.0419 65.4119 2.7001 4.13 75
HLU200-F400-980P2-M2 1-cell Gaussian

105
Figure 96: Maximum Power Density Output
Figure 97: Maximum Power Density Efficiency
Figure 96 shows that the output of receiver peaked at 44.72 watts of laser energy,
above which the performance degraded. At this peak, the optical power density was 56.6
watts per cm2, and the single VMJ cell was able to produce 10.7461 watts (equivalent to
13.6 watts per cm2) for a conversion efficiency of 24 %. The I-V curve for this operating
point is shown in Figure 98.

106
Figure 98: Maximum Power Density I-V Curve
Beyond this operating point, the performance of the cell degraded. Table VIII
shows the output power and efficiency data, and the corresponding measured receiver
temperatures. As the thermal system reached saturation, the receiver temperature
exceeded its nominal temperature, and the conversion efficiency was consequently
degraded.
TABLE VIII: RECEIVER TEMPERATURE LOG
The receiver temperature values are recorded by thermocouples embedded behind
the mounting substrate, and so the actual temperatures at the VMJ semiconductor
material are much higher than those in the table due to the delta differences between the
materials in the receiver stack-up. Also, the Gaussian distribution of the beam set up an
extremely intense thermal field at the center of the cell. Unfortunately, the proper
Impinging VMJ
Optical Peak Conversion Receiver
Power Power Efficiency Temp.
Watts (W) Watts (W) (%) (°C)
11.1607 4.0751 36.51 31.1
33.7038 9.6017 28.49 49.4
44.7166 10.7461 24.03 60.5
55.4338 7.9400 14.32 67.5
65.4119 2.7001 4.13 75

107
equipment was not available at the time of the experiment to image the surface
temperature profile across the receiver.
Although the increasing receiver temperatures contribute to the decrease in
conversion efficiency, there may be more to the explanation. Revisiting the earlier
experiment with the Gaussian beam and the flat top optics gives some further insight. By
plotting the efficiency of the receiver against its measured temperatures (Figure 99), an
interesting trend can be observed. Up to approximately 60 °C, the efficiency degrades
linearly at a slope of around 8 % per 10 °C. Above 60 °C, the efficiency drops
substantially at a slope of 13 % per 10 °C. This does not match the expected thermal
degradation representative of a silicon photocell (Figure 100), which is shown to be linear
out to nearly 125 °C.
Figure 99: Efficiency Drop-off Beyond 60 °C
Conversion Efficiency (%)Vs. Temperature, 9 Cell Array
0
10
20
30
40
20 30 40 50 60 70 80
Temperature Deg. C
Eff
icie
ncy
(%)

108
Figure 100: Photocell Thermal Efficiency Degradation
An explanation of this phenomenon may be optical scattering & reflection off the
surface of the cell, due to this hot field rejecting the energy. Evidence of this resides
during the high-energy portions of the experiments, where it was observed that the laser
optics were heating up due to back reflection off the receivers. The VMJ cells feature an
anti-reflective (AR) coating to reduce this, and the substrate material in the receiver is a
non-reflective dull surface. Furthermore, the heating at the optics stage was only
observed at high intensities, corresponding with the knee in the efficiency curve. Up to
this temperature, the standard temperature de-rating applies to the receiver efficiency.
Above this point some of the laser energy is reflected back away from the surface of the
receiver. Detailed pictures taken during one of the experiments may reveal this
Efficiency of Concentrator PhotoCells Vs. Temperature
(Solar Spectrum)
0.00%
5.00%
10.00%
15.00%
20.00%
25.00%
30.00%
35.00%
25 35 45 55 65 75 85 95 105 115 125
Temperature in Degrees C
Co
nvers
ion
Eff
icen
cy
Silicon Based Tripple Junction Based

109
reflection, as shown in Figures 101-104. In viewing the trend of these pictures, as the
laser energy is increased a series of dark patterns are seen to develop in the center of each
of the nine VMJ cells. At the high power setting in Figure 104, the patterns have grown
in size to fully shroud the cells, and this may represent the refection of the laser energy.
This energy reflection would explain why the efficiencies dropped significantly, as the
photons were no longer able to enter the photovoltaic material. Fortunately, there are
several ways to solve this problem, which are addressed in the summary.

110
Figure 101: Surface Reflections at 30 Watt Intensity

111
Figure 102: Surface Reflections at 91 Watt Intensity

112
Figure 103: Surface Reflections at 150 Watt Intensity

113
Figure 104: Surface Reflections at 200 watt Intensity

114
CHAPTER VI
CONCLUSIONS AND FUTURE WORK
The primary data gathered from these experiments is instrumental in shaping the
future of the HILPB program, as it progresses toward higher intensity and efficiency
goals. The proof of concept objectives have been met, and further investigations into the
details of the system have been performed. The following is a synopsis of the research
achievements, with suggestions for future improvements.
6.1 Summary and Contributions
1. VMJ cells were successfully utilized with HILPB, and the maximum continuous
power obtained from a receiver is 23.7778 watts.

115
2. The maximum continuous optical to electrical conversion efficiency obtained
from a HILPB receiver is 49.83 % (nearing the 50-60 % theoretical limit), at low
intensities with an 808 nm laser.
3. The peak power density produced by a single VMJ is 13.6 watts per cm², with an
optical input 56.6 watts per cm2.
4. The optimal frequency of the laser energy is in the 980 nm range (976 nm
commercially available).
5. There is approximately a 10% absolute improvement in the efficiency of the
photocells when using a uniform beam distribution versus a normal Gaussian
beam.
6. The geometry of the HILPB receiver can be designed to favor the Gaussian laser
beam, or the beam can be conditioned with optics to provide for a uniform
distribution at the receiver.
7. The commercial off the shelf (COTS) thermal management system was not
effective at keeping the temperature of the photocell array at an acceptable level
during the highest power density portions of the experiments, thus resulting in
drastic reductions in their conversion efficiency.
8. Conventional solar array blocking diodes are not applicable to HILPB.
The main contribution of this work was in designing, constructing and testing a
preliminary engineering model of the HILPB receiver as a proof-of-concept hardware

116
device. For these initial tests, the receiver was able to meet the thermal and electrical
demands of the system. With modifications to subsequent designs, the receivers were
also able to be tested with a variety of laser sources to evaluate the performance of the
VMJ cells for this application. These newer iterations allowed for the further
investigations into parallel-cell back-feeding, optimal receiver geometry, non-uniform
illumination and thermal effects at high intensities. The receivers have been tested to
their capable limits, and to move forward with higher intensities and efficiencies it is
necessary to design a more robust HILPB receiver.
6.2 Future Work
Further cell improvements will have an effect on the packing density of the
receiver. The addition of welded leads to the VMJ cells will improve their robustness,
increase the packing density and enhance the manufacturability of the receiver. The lead
attachment may be accomplished through ultrasonic welding.
The excess unconvertible area due to the electrical connections between the cells
could be minimized by using a substrate with embedded circuit traces, similar to a PCB.
The rapid prototyping demand and the various cell configurations facilitated the usage of
the delicate silver-plated kovar leads, but chemically etched bus paths directly on the
receiver surface would increase the thermal conductivity and the current handling
capability of the connections.

117
Another method to maximize the convertible area on the surface of the receiver
would be to adjust the manufacturing of the cells in order to obtain an optimal radial
geometry, in a way that reflects the Gaussian distribution of the laser beam. This could
be accomplished by manufacturing the cells in a chevron shape with a taper inversely
related to the Gaussian distribution, which would improve both the packing density and
the uniformity of the junction illumination. An illustration of this concept is shown in
Figure 105. A possible way to fabricate the angled cells may be to use laser-cutting
techniques, which have been successfully employed to cut silicon wafers.
Figure 105: Chevron Concept for a VMJ Radial Array
Another method to maximize the convertible area is to return to the original
rectangular array design (made up of square VMJ cells), and condition the laser beam
with optics into a flat profile. This beam manipulation could be done at either the laser or

118
the receiver end, for experimental purposes. By insuring a relatively uniform power
distribution in the beam, the geometry of the receiver could be made simpler and more
compact, allowing for a much higher power density.
At the very best cell efficiencies, 40-50 % of the impinging laser energy will still
be lost into heat. With HILPB, large amounts of heat will be generated in a relatively
small area. Although in their current form the VMJ cells are able to withstand
temperatures up to 600 ºC, they do so with a considerably degraded efficiency.
Therefore, thermal management is of the utmost concern in the design and operation of
the HILPB system. The COTS system was effective for supporting the fundamental
HILPB research, and now a new thermal management system must be designed to
facilitate significantly higher energy intensities. A few preliminary designs have been
constructed using anodized aluminum as the base thermal conductor, which may be
ported for fluid circulation. A new mounting technique is used to attach the VMJ cells
directly to the heat-sink face, eliminating the number of thermal barriers present in the
receiver. This is possible since the anodized coating supplies the electrical isolation,
eliminating the need for the Aluminum Nitride substrate. KaptonTM
insulation material
and copper foil may be used for the electrical routing. A new epoxy film is also being
evaluated for the cell adhesion which has an improved thermal transfer rating, is
dimensionally consistent and simplifies the fabrication process. Examples of this type of
construction are shown in Figure 106.

119
Figure 106: Direct Bonding to Anodized Aluminum
As an alternative to dissipating the excess heat generated from HILPB, the heat
may be harnessed for energy usage. An example of this would be the implementation of
a fluid heat exchanger / micro-turbine system instead of a heat-sink, to convert the excess
thermal energy into a usable electric form.
The energy scattering/reflection issue can be approached in a number of ways.
Fundamentally, the new thermal management system will lower the overall temperature
of the receiver, which will decrease the energy rejection effect. The effectiveness of
other AR coatings on the surface of the cell may also be investigated. Another possibility
would be to align the receiver slightly off axis from the beam. The data obtained from
performing an experiment where the receiver is articulated in two different axes will
provide the performance parameters for the beam tracking and control system in a HILPB
system implementation.

120
Although the blocking diodes were more detrimental than beneficial to the overall
performance of the receiver, they did correct the current flow. An active switching and
control system can be developed to minimize the inherent losses resulting from
unbalanced power levels from the cells caused by uneven illumination and manufacturing
variability. The sensors and switches in the power electronics system need to be selected
to minimize the amount of parasitic losses to the receiver. This may be accomplished
through inductive current sensing and low-loss FET (field effect transistor) switches.

121
REFERENCES
1. Schawlow, A. L.; Townes, C. H., “Infrared and Optical Masers, “ Physical Review, vol. 112, Issue 6, pp.
1940-1949, 12/1958.
2. Schawlow et al., “Masers and Maser Communications System,” U.S. Patent No. 2929922, Mar 1960.
3. Tesla, N., “Apparatus for Transmission of Electrical Energy”, U.S. Patent No. 649,621, May 15, 1900.
4. Tesla, N., “Means for Increasing the Intensity of Electrical Oscillations,” U.S. Patent No. 685,012, Oct. 22,
1901.
5. Tesla, N., “Art of Transmitting Electrical Energy through Natural Mediums,” U.S. Patent No. 787,412, April
18, 1905.
6. Tesla, N., "The Future of the Wireless Art," Wireless Telegraphy and Telephony, pg. 67-71, 1908.
7. Van Voorhies, Kurt L | Smith, James E, “Promises and prospects of worldwide wireless power transfer. An
overview,” Proc Intersoc Energy Convers Eng Conf, IEEE, Piscataway, NJ, (USA), vol. 4, pp. 341-346,
1991.
8. Aristeidis Karalisa, J.D. Joannopoulosb and Marin Soljačić, “Efficient wireless non-radiative mid-range
energy transfer,” Massachusetts Institute of Technology, Available online 27 April 2007.
9. Kurs A, Karalis A, Moffatt R, Joannopoulos JD, Fisher P, Soljacic M., “Wireless power transfer via strongly
coupled magnetic resonances,” Science Express on 7 June 2007, Science 6 July 2007: Vol. 317. no. 5834, pp.
83 – 86.
10. Brown, W. C., “Experimental Airborne Microwave Supported Platform,” Raytheon Co Burlington, MA
Microwave and Power Tube Div, Dec. 1965.
11. Jenn, D.C. Vitale, R.L., “Wireless power transfer for a micro remotely piloted vehicle,” Dept. of Electr. &
Comput. Eng., Naval Postgraduate Sch., Monterey, CA; Circuits and Systems, 1998. ISCAS '98. Proceedings
of the 1998 IEEE International Symposium on, Publication Date: 31 May-3 Jun 1998, Volume: 6, On
page(s): 590-593 vol.6.
12. NASA Video, date/author unknown, http://www.spaceislandgroup.com/biz/NASAPowerP1.mov
13. N. Shinohara, “Wireless Power Transmission for Solar Power Satellite (SPS),” Space Solar Power
Workshop, Georgia Institute of Technology.

122
14. Brown., W. C., "The History of Power Transmission by Radio Waves". Microwave Theory and Techniques,
IEEE Transactions on (Volume: 32, Issue: 9 On page(s): 1230- 1242 + ISSN: 0018-9480), September 1984.
15. J. D. Lan Sun Luk, A. Celeste, P. Romanacce, L. Chane Kuang Sang, J. C. Gatina, “POINT-TO-POINT
WIRELESS POWER TRANSPORTATION IN REUNION ISLAND,” 48th International Astronautical
Congress, Turin, Italy, 6-10 October 1997 - IAF-97-R.4.08 - University of La Réunion - Faculty of Science
and Technology.
16. Jull, G W | Lillemark, A | Turner, R M, “SHARP (Stationary High Altitude Relay Platform)
Telecommunications missions and systems,” GLOBECOM '85 - Global Telecommunications Conference,
New Orleans, LA, Conference Record , Volume 2; UNITED STATES; 2-5 Dec. 1985. pp. 955- 959, 1985.
17. Fujino, Y., M. Fujita, N. Kaya, S. Kunimi, M. Ishii, N. Ogihata, N. Kusaka, and S. Ida, “A Dual Polarization
Microwave Power Transmission System for Microwave propelled Airship Experiment,” Proc. of ISAP‟96,
Vol.2, 1996, pp.393-396.
18. Cummings, T.; Janssen, J.; Karnesky, J.; Laks, D.; Santillo, M.; Strause, B.; Myrabo, L. N.; Alden, A.;
Bouliane, P.; Zhang, M., “6 GHz microwave power-beaming demonstration with 6-kV rectenna and ion-
breeze thruster,” AIP Conference Proceedings Second International Symposium on Beamed Energy
Propulsion n 702 2004 p.430-42.
19. Yang, G.; Ali, M.; Dougal, R., “A multi-functional stacked patch antenna for wireless power beaming and
data telemetry,” 2005 IEEE Antennas and Propagation Society International Symposium 2005 p.359-62 vol.
2A.
20. Myrabo, L. N., “Microwave power beaming infrastructure for manned lightcraft operations,” AIP Conference
Proceedings Fourth International Symposium on Beamed Energy Propulsion n 830 2006 p.651-62.
21. Ortabasi, U.; Friedman, H., “Powersphere: a photovoltaic cavity converter for wireless power transmission
using high power lasers,” Conference Record of the 2006 IEEE 4th World Conference on Photovoltaic
Energy Conversion 2006 p.4 pp.
22. Blackwell, T., “Recent demonstrations of laser power beaming at DFRC and MSFC,” AIP Conference
Proceedings Beamed Energy Propulsion. Third International Symposium on Beamed Energy Propulsion n
766 2005 p.73-85.
23. Author Unknown, “To infinity ... and beyond! [power beaming for interplanetary vehicles],” Machine Design
International v 79 n 5 2007 p.78, 80, 82, 84, 86, 88.
24. Brandhorst, H. W. , Jr., “POWOW: power without wires: a SEP concept for space exploration,” IEEE
Aerospace and Electronic Systems Magazine v 16 n 2 2001 p.3-7.
25. Edwards, B. C.; Bennett, H. E., “Space elevator feasibility test using laser power beaming,” Proceedings of
the SPIE - The International Society for Optical Engineering Laser and Beam Control Technologies v 4632
2002 p.141-7.

123
26. Luce, R.; Michael, S., “An experiment to demonstrate spacecraft power beaming and solar cell annealing
using high-energy lasers,” AIP Conference Proceedings Beamed Energy Propulsion. First International
Symposium n 664 2003 p.461-72.
27. Einstein, A., “ On the Heuristic Viewpoint Concerning the Production and Transformation of Light,”
Annalen der Physik, in AJP, 33, No. 5, May (1965).
28. Marales, Rolf Allan Lunders, “Performance of Advanced Triple-Junction (ATJ) Solar Cells,” Pontificia
Universidad Catolica De Chile, Escuela De Ingenieria, 2005.
29. Sater, B.L. Sater, N.D., “High voltage silicon VMJ solar cells for up to 1000 suns intensities,” Photovoltaic
Specialists Conference, 2002. Conference Record of the Twenty-Ninth IEEE, Publication Date: 19-24 May
2002, On page(s): 1019- 1022, ISSN: 1060-8371, ISBN: 0-7803-7471-1.
30. Sater, B., “The effectiveness of the Photovolt VMJ Cell Technology,” Photovolt Inc., 2005,
http://users.adelphia.net/~esch/papers/The_effectiveness_VMJ_Cell_Technology.pdf
31. Goradia, C | Sater, B L, “A first order theory of the p/+/-n-n/+/ edge-illuminated silicon solar cell at very high
injection levels,” IEEE Transactions on Electron Devices. Vol. ED-24, pp. 342-351. Apr. 1977.
32. Alda, Javier, “Laser and Gaussian beam propagation and transformation,” University Complutense of
Madrid, Madrid, Spain, Encyclopedia of Optical Engineering, 2003.
33. Jain, R. K.; Landis, G. A., “Transient response of gallium arsenide and silicon solar cells under laser pulse,”
Solid-State Electronics v 42 n 11 1998 p.1981-3 – 5Mhz Si & 1-2GHz GaAs.
34. Andreev, V.; Khvostikov, V.; Kalinovsky, V.; Lantratov, V.; Grilikhes, V.; Rumyantsev, V.; Shvarts, M.;
Fokanov, V.; Pavlov, A., “High current density GaAs and GaSb photovoltaic cells for laser power beaming,”
Proceedings of 3rd World Conference on Photovoltaic Energy Conversion 2003 p.761-4 Vol.1.
35. Krupke, W. F.; Beach, R. J.; Kanz, V. K.; Payne, S. A.; Early, J. T., “New class of cw high-power diode-
pumped alkali lasers (DPALs),” (plenary paper). Proceedings of the SPIE - The International Society for
Optical Engineering High Power Laser Ablation V v 5448 n 1 2004 p.7-17.
36. Krupke, W. F.; Beach, R. J.; Payne, S. A.; Kanz, V. K.; Early, J. T., “DPAL: a new class of lasers for cw
power beaming at ideal photovoltaic cell wavelengths,” AIP Conference Proceedings Second International
Symposium on Beamed Energy Propulsion n 702 2004 p.367-77.
37. Cook, J. R., “Atmospheric propagation of high energy lasers and applications,” AIP Conference Proceedings
Beamed Energy Propulsion. Third International Symposium on Beamed Energy Propulsion n 766 2005 p.58-
72.

124
38. Cook, J. R.; Cusumano, S. J.; Whiteley, M. R., “Potential use of CW high energy laser on an airborne
platform,” AIP Conference Proceedings Fourth International Symposium on Beamed Energy Propulsion n
830 2006 p.400-10.
39. Stepanov, V. V.; Alekseyev, V. N.; Osipov, V. A.; Rezunkov, Y. A.; Sheremetyeva, T. E., “Laser beam
control system to compensate the turbulent distortions of laser beam at introducing a lead angle,” Res. Inst.
for Complex Testing of Opto-electronic Devices, Leningrad Region, Russia, AIP Conference Proceedings.
no.702 2004, p 283-92, 2004.
40. Kantrowitz, Arthur, “Propulsion to orbit by ground-based lasers,” Astronautics & Aeronautics, vol. 10, no. 5,
May 1972, p. 74, 75; Propulsion techniques - Action and reaction (A98-24576 05-20), Reston, VA, American
Institute of Aeronautics and Astronautics, Inc., 1998, p. 351-353.
41. Edmund J. Conway, “Laser Power Transmission,” NASA SP-509, Volume 2, Johnson Space Center, JAN 1,
1992.
42. Holloway, P F | Garrett, L B, “Comparative analyses of space-to-space central power stations,” NASA TP-
1955, Dec. 1981.
43. deYoung, R J | Tepper, W D | Conway, E J | Humes, D H, “Preliminary comparison of laser and solar space
power systems,” IECEC '83; Proceedings of the Eighteenth Intersociety Energy Conversion Engineering
Conference, Orlando, FL, Volume 3; United States; 21-26 Aug. 1983. pp. 983-989. 1983.
44. Zapata, L E | deYoung, R J, “Flashlamp-pumped iodine monobromide laser characteristics,” Journal of
Applied Physics. Vol. 54, pp. 1686-1692. Apr. 1983.
45. Harries, W L | Meador, W E, “Kinetic modeling of an IBr solar pumped laser,” Space Solar Power Review.
Vol. 4, no. 3, pp. 189-202. 1983.
46. Weaver, W R | Lee, J H, “Solar pumped gas laser for the direct conversion of solar energy,” J. ENERGY.
Vol. 7, no. 6, pp. 498-501. 1983.
47. Wilson, J W | Lee, Y | Weaver, W R | Humes, D H | Lee, J H, “Threshold kinetics of a solar-simulator-
pumped iodine laser,” NASA TP-2241, Feb. 1984.
48. deYoung, R J, “Low threshold solar-pumped iodine laser,” IEEE Journal of Quantum Electronics. Vol. QE-
22, no. 7, pp. 1019-1023. 1986.
49. Insuik, R J | Christiansen, W H, “A radiatively pumped CW CO2 laser,” IEEE Journal of Quantum
Electronics. Vol. QE-20, pp. 622-625. June 1984.
50. deYoung, R J | Higdon, N S, “A blackbody-pumped CO2-N2 transfer laser,” NASA TP-2347, Aug. 1984.

125
51. Akhmanov, Sergei A., Vysloukh, Viktor A., Chrkin, Anatolii S., “Optics of femtosecond laser pulses”,
Izdatel'stvo Nauka, 1988.
52. Alvidres, H., Hoetger, D., Fischer, M., “Thermal Control System Design,” Texas Space Grant Consortium,
1995.
53. Bujard, P., “Thermal conductivity of boron nitride filled epoxy resins: temperature dependence and influence
of sample preparation,” Ciba-Geigy Ltd., Fribourg: Thermal Phenomena in the Fabrication and Operation of
Electronic Components: 1-THERM ‟88, Inter Society Conference on; 11-13 May 1988.
54. Miwa, K.; Fukumoto, A., “First Principles Calculation of the structural, electronic and vibrational properties
of gallium nitride and aluminum nitride ,” Physical Review B, Volume 48 Number 11, Spetember 15, 1993.
55. Liu, G; Cui, B; Chen, R J., “Thermal Expansion Behavior of Copper/Kovar Alloy Composite ,” Northeast
Univ. Technol. (China). Vol. 9, no. 4, pp. 498-501. Dec. 1988.
56. Daoqiang Lu; Tong, Q.K.; Wong, C.P., "Conductivity mechanisms of isotropic conductive adhesives (ICAs)
," Electronics Packaging Manufacturing, IEEE Transactions on [see also Components, Packaging and
Manufacturing Technology, Part C: Manufacturing, IEEE Transactions on] , vol.22, no.3pp.223-227, Jul
1999.
57. Horowitz, Paul; Hill, Winfield, “The Art of Electronics ,” Second Edition, Cambridge University Press, 1989.
58. Wong, Wayne A., Macosko, Robert P., “Refractive Secondary Concentrators for Solar Thermal
Applications,” SAE, AIAA, ASME, IEEE, AIChE, and ANS, IECEC - Intersociety Energy Conversion
Engineering Conference, 34th, Vancouver, Canada; UNITED STATES; 2-5 Aug. 1999. 1999.
59. Ferriere, A | Rodriguez, G P | Sobrino, J A, “Flux distribution delivered by a Fresnel lens used for
concentrating solar energy,” Journal of Solar Energy Engineering (Transactions of the ASME). Vol. 126, no.
1, pp. 654-660. Feb. 2004.
60. Noor Mohammad, S | Abidi, S T H, “Theory of saturation photocurrent and photovoltage in p-n junction
solar cells,” Journal of Applied Physics. Vol. 61, pp. 4909-4919. 15 May 1987.
61. Edward D. Palik, “Handbook of Optical Constants of Solids,” Academic Press, NY, 1985.

126
APPENDICES
TABLE IX: HILPB RECEIVER CONSTRUCTION LOG
Construction Log
Designator Cells Notes
MK-I H3-14 single, consistant side down, lead ripped off during testing
H3-11 obscured during assembly
MK-IB E12-11 rebuild double, consistant side up
H3-33 rebuild double, consistant side down
MK-II E12-4 single, consistant side up, lead ripped off during testing & repaired at Northrop
experienced a burn to the AR coating from the Gaussian laser set to 110W
MK-IIB K3-5 rebuild single
consistant side up
MK-III K1-C double, IR coating, thick cell
SCA9-A double, IR coating, small cell
MK-IV K3-23 double, IR coating
SCA9-B double IR coating, small cell
MK-V E12-10 top left corner
E12-13 top right corner
H3-7 bottom right corner
F1-5 bottom left corner
MK-VI K1-B top left corner
K3-3 top center
K3-4 top right corner
K3-15 right center
K3-20 bottom right corner
K3-19 bottom center
K3-17 bottom left corner
K3-8 left center
K3-12 center
MK-VII K3-1 top left corner
K3-27 top center
E12-8 top right corner
E12-20 right center
K3-11 bottom right corner
E12-17 bottom center
E12-18 bottom left corner
K3-10 left center
F3-13 center
MK-VIII-A H3-5 top left corner
(radial) K5-19 top center
H1-14 top right corner
K12-13 right center
H1-29 bottom right corner
K7-16 bottom center
H1-31 bottom left corner
K12-3 left center
K11-9 center
SCA9-D top-right small cell
SCA9-E bottom-left small cell

127
Figure 107: DATAQ PCB Artwork