Battery Conductance & System Analyzer Battery Conductance ...
HIGH FREQUENCY CONDUCTANCE MEASUREMENTS AND THE STUDY
OP THE RAPID_HYDROLYSES OP SOME CYCLIC CARBONATES
A Thesis submitted to the U niversity of London
fo r the Degree of Doctor of Philosophy
by
Amir Saadi
Chemistry Department,B attersea College of Technology, LOUDON, S .W .ll. Ju ly , 1964.
ProQuest Number: 10803863
All rights reserved
INFORMATION TO ALL USERS The qua lity of this reproduction is d e p e n d e n t upon the qua lity of the copy subm itted.
In the unlikely e ve n t that the au tho r did not send a co m p le te m anuscrip t and there are missing pages, these will be no ted . Also, if m ateria l had to be rem oved,
a no te will ind ica te the de le tion .
uestProQuest 10803863
Published by ProQuest LLC(2018). C opyrigh t of the Dissertation is held by the Author.
All rights reserved.This work is protected aga inst unauthorized copying under Title 17, United States C o de
M icroform Edition © ProQuest LLC.
ProQuest LLC.789 East Eisenhower Parkway
P.O. Box 1346 Ann Arbor, Ml 4 81 06 - 1346

-2 -
ABSTRACT
The work described in th is th e s is i s concerned mainly w ith the
app lica tion of high frequency conductance measurements to the study of
the rap id hydrolyses of cyclic carbonate e s te rs . A high-frequency
o s c i l la to r with an inductive-type c e l l has been b u il t and i t s behaviour
towards changes in conductance of e le c tro ly te so lu tions i s accounted fo r
by a th e o re tic a l equivalent c i r c u i t rep resen ting the c e l l and i t s con ten ts.
An equation re la tin g the parameters of the o sc illa to ry c ir c u i t and of the
c e l l i s derived and v e r if ie d experim entally . The importance, w ith regard
to re a c tio n -ra te measurements, of the d ispersion of conductance and
d ie le c tr ic constant of e le c tro ly te so lu tions i s determined.
The s u i ta b i l i ty of the apparatus fo r follow ing conductance changes,
associated w ith the r e la t iv e ly rap id hydrolyses of organic e s te r s , i s
demonstrated by follow ing the a lk a lin e hydrolysis of methyl a ce ta te a t
severa l tem peratures. Values fo r the r a te constants and the energy of
a c tiv a tio n are determined. The apparatus i s then applied to the stu d ies
of the a lk a lin e hydrolyses of ethylene, propylene, and vinylene carbonates
a t several tem peratures. The ra te constants and the energies of a c tiv a tio n
fo r these hydrolyses are determined. The e ffe c ts of su b s titu en ts and
s tru c tu re in cyclic carbonates on the ra te s and k in e tic s of th e i r hydrolyses
are discussed* D ifferences in the r a te constants fo r the hydrolyses of
ethylene and propylene carbonates from those of previous authors are
-3 -
accounted fo r , A mechanism fo r the hydrolysis i s suggested and evidence
in i t s favour discussed*
The d ie le c tr ic constant and the dipole moment of vinylene carbonate
are determined, and the sign ificance of the re s u l ts in terms of
in term olecular in te ra c tio n i s in d ica ted .
The reac tio n of o-phenylene carbonate in a lk a lin e so lu tion i s
stud ied ; a method su itab le fo r follow ing th is extremely rap id hydrolysis
i s described, and a value fo r the h a l f - l i f e of the reac tio n is
determined,

Preface
The work described in th is th e s is was ca rried out in the
lab o ra to ries of the Chemistry Department, B attersea College of
Technology, under the supervision of Dr* W#.H* Lee, Reader in
Physical Chemistry*
I should l ik e to express my sincere g ra titu d e to Dr# ¥ , H*
Lee fo r a l l the help and guidance which he gave me throughout the
course of th is work#
I am indebted to Dr, R. Kempa fo r perm ission to use h is
apparatus fo r dipole measurements and fo r h is help and advice*
Sincere thanks are a lso extended to Dr# Z.L* Ernst and Dr* C*L,
Arcus fo r he lp fu l discussions*
G rateful acknowledgment i s due to the Government of Iraq
fo r providing a scho larsh ip .
June, 1964* A. H# A1 Saadi#

-5~
C O N T B I T S
page number
Abstract •.. •.. » • » *«« *•* 2Preface ... ... ... ... • 4
General in troduction . , . . . . 6
P art I Theory of High Frequency Measurements ••• 9
In troduction «•* . . . ••• 10
Section 1. In v estig a tio n of the behaviour of the o s c i l la to r 12
Section 2* D ispersion of conductance and d ie le c tr icconstant * .. 40
P art I I A pplications of the High Frequency O s o il la to r .. . 47
In troduction • • • • • . ••• 48
Section 1, Apparatus *•«. . . . . . . . . . 51
Section 2. The a lk a lin e hydrolysis of methyl ace ta te 59
Section 3• The a lk a lin e hydrolysis of ethylene andpropylene carbonates . . . 74
P art I I I Vinylene Carbonate and o-Phenylene Carbonate . . . 102
In troduction . . . . . . . . . . . . 103
Section 1. D ie lec tric constant and dipole moment . . . 106
Section 2. The a lk a lin e hydrolysis of vinylene carbonate 126
Section 3* The a lk a lin e hydrolysis of o-phenylene carbonate 141
Appendices • . . * .. . . . ••• . . . 131
1. pH-measurements . . . . . . . . . 152
2. Ethylene carbonate hydrolysis in barium hydroxide 160so lu tio n
3. Rate equation fo r cy c lic carbonates hydrolysis ina lk a li carbonate so lu tio n 167
General conclusions . . . . . . . . . . . . 172
References . . . . . . . . . . . . . . . 17s

GENERAL INTRODUCTION
-7 -
Progress in the development of polymer chemistry in recen t years
has been g rea tly enhanced by the discovery of many new solvents fo r
polym erisation rea c tio n s . Cyclic carbonates, and in p a r tic u la r ethylene
carbonate, have found a wide range of app lica tions in th is f i e ld , and con
sequently the physico-chemical p ro p erties of these compounds have become
of specia l in te r e s t .
Kempa and Lee studied those physico-chemical p ro p erties of cyclic
carbonates which la rg e ly determine the behaviour of an organic solvent
towards inorganic m ate ria ls . They determined the dipole moments and
d ie le c tr ic constants of severa l cyclic carbonates [ 1] , and found th a t a l l
these compounds possessed large dipole moments and very high d ie le c tr ic
constan ts, and th a t a l l exhib ited some degree of in term olecu lar associa
tio n (see Table 3*26,page 12% They also studied the w ater-catalysed
and a lkaline hydrolyses of ethylene and propylene carbonates f 2] ; the
water hydrolysis was very slow, but the a lk a lin e hydrolysis was rapid*
Pohoryles and h is a ssoc ia tes [3] studied the hydrolyses of some cyclic
carbonates in potassium carbonate so lu tions a t 0°C.
Sarel and h is asso c ia tes [4] in v es tig a ted the mechanism of the18hydrolysis of cyclic carbonates using water enriched w ith 0 • They
concluded th a t the acid and base hydrolyses involved two stages and pro
ceeded with acyl-oxygen bond f is s io n . Levin e t a l . [3] studied the
ac id -ca ta lysed hydrolysis of cyclic carbonates and found th a t i t proceeded
-8 -
a t a much sloT^er ra te than th a t of the a lka line hydro lysis,
A novel technique fo r the measurements of the r a te s of compara
tiv e ly f a s t reactions has been developed by Flom and Elving [ 6] , who
used a high-frequency o s c i l la to r to follow the hydrolysis of some open-
chain e s te rs . I t was apparent from the prelim inary stud ies of Kempa
and Lee th a t the hydro lysis of cyclic carbonate e s te rs would be r e la t iv e ly
rap id processes even in concentrations of hydroxyl ions as low as 10 “Vi.
Since the high frequency technique of conductance measurements has been
extensively investiga ted in these la b o ra to r ie s [ 7] i t was adopted in the
present studies and found generally sa tis fa c to ry in reg ions of hydroxyl ion
concentration which rendered the reac tio n too f a s t to be followed by the
t i t r a t i o n techniques employed by the previous authors. With a high speed
recording potentiom eter, requiring J second fo r f u l l - s c a le deflection*
reactions of h a l f - l i f e as short as 6 sec, could be followed conveniently.
With fa s te r reac tio n s, however, the response curve may be somewhat un certa in
due to the f in i t e time taken ( l - 2 s e c ,) fo r the o s c i l la to r cu rren t in
crease or decay to reach a steady value when the conductance of the t e s t
so lu tion i s suddenly changed. Reactions of several hou rs’ duration may
also be followed, provided th a t the o s c il la to r cu rren t d r i f t , which i s ne
g lig ib le up to 20 m in., i s taken in to considera tion .
To extend the range of cyclic carbonates studied , the p reparations of
Vinylene carbonate and o-phenylene carbonate ?/ere in v es tig a ted . Pure
samples have been obtained, and th e ir physico-chemical p ro p e rtie s , of
in te r e s t in the p resen t in v es tig a tio n s , have been measured.
-9 -
PART I
THEORY OP HIGH FREQUENCY MEASUREMENTS

-1 0 -
INTRODUCTION
I f a so lu tion i s placed in an a lte rn a tin g e le c tr ic or magnetic
f ie ld of high frequency ( in the range 10 - 50 Mc/s), i t i s possib le to
produce ion ic or d ipolar motion without the in troduction of e lec trodes
in to the so lu tion . Energy i s required to produce th is motion, and a
l iq u id or a so lu tion introduced in to the c i r c u i t of an o s c i l la to r causes
a change in i t s c h a ra c te r is t ic s . The change, which can be measured, may
be in the anode curren t or voltage, or in the frequency, of the o s c i l la to r
depending on the design and purpose of the apparatus,
Generally, there are two ways of incorporating a conductiv ity c e l l
in to an o sc illa to ry c ircu it* The g lass o r ceramic c e l l may be connected,
v ia ex ternal band e lec trodes, in p a ra l le l with the capacitance, or p laced
d ire c tly in side the inductance; the terms ’c a p a c ita tiv e ’ and 1 in d u c tiv e1
are used to describe the two types of c e l ls . W hilst both types are
sen sitiv e towards e le c tro ly te concentration changes, th e cap ac ita tiv e type
i s also sensitive to d ie le c tr ic constant v a ria tio n s ; on the o ther hand,
the inductive type c e ll tends to minimise the e ffe c t of such v a ria tio n s [ 8] .
Much of the research in oscillom etry has been concerned with
o s c i l la to rs incorporating capac ita tive type c e l ls , mainly as to o ls fo r
t i t r im e try ; radio-frequency measurements fo r the determ ination of t i t r i
metric end-points were f i r s t used in 19^6 [ 9* 10] • Since then many
attem pts have been made to r e la te the observed changes to the param eters
of the o sc illa to ry c i r c u i t , and to produce an e le c tr ic a l ’equivalent

-IX-
circu it* fo r the c e l l used [ 11- 13] , in order to determine absolute con
ductances.
The EE response c h a ra c te r is t ic s of e le c tro ly te so lu tions in
capacita tive c e l ls have been ex tensively in v es tig a ted , and some s ig n if ic a n t
re la tio n sh ip s have been expressed mathematically and v e rif ie d experiment
a lly [ 7] • The same, however, cannot be sa id of the inductive c e l l ,
which i s the type most su itab le fo r k in e tic s tu d ies . In th is work,
there fo re , an attem pt was made to study the nature and extent of the
in te rac tio n between the e le c tro ly te so lu tion in the c e l l and the o s c i l la
to ry c ir c u i t ; and to in v es tig a te the p o s s ib il i ty of measuring the sp ec ific
conductance of an e le c tro ly te by th is technique.

-12 -
SECTION 1
Investiga tion of the behaviour of the o s c i l la to r
The high frequency o s c illa to r chosen fo r the in v es tig a tio n s of
reac tion ra te s was based on th a t described by Elom and Elving [ 6] , A
descrip tion of the c i r c u i t - and cell-design f in a l ly adopted, together
with an account of the operating procedure, w il l be given in P a rt I I ,
Section 1*
Flom and Elving studied the response c h a ra c te r is tic s of th e i r
o s c i l la to r w ith various e le c tro ly te s in the c e l l , and used the apparatus
to study the ra te s of a lka line hydrolyses of some a lip h a tic e s te r s . No
attempt vfas made to study the nature of the in te ra c tio n between the te s t
so lu tion and the o sc illa to ry c i r c u i t . In the p resen t work a prelim inary
in v es tig a tio n of the o s c i l la to r was made in order to f in d the s ig n if ic a n t
re la tio n sh ip s between the param eters of the c e l l and of the so lu tio n ,
and the o s c i l la to r anode cu rren t.
Acid-base t i t r a t io n s wrere c a rr ied out in the c e l l and the response
to various e le c tro ly te so lu tions was investiga ted ; the r e s u lts are shown
in F ig .l . I t i s seen th a t the o s c i l la to r anode curren t r i s e s to a
maximum, and then decreases with fu r th e r increase in e le c tro ly te con
c en tra tio n . Comparing so lu tions of sodium ch lo ride and hydrochloric
acid , the concentrations a t which maxima are produced are in v erse ly
proportional to the equivalent conductances of the e le c tro ly te s : e .g .
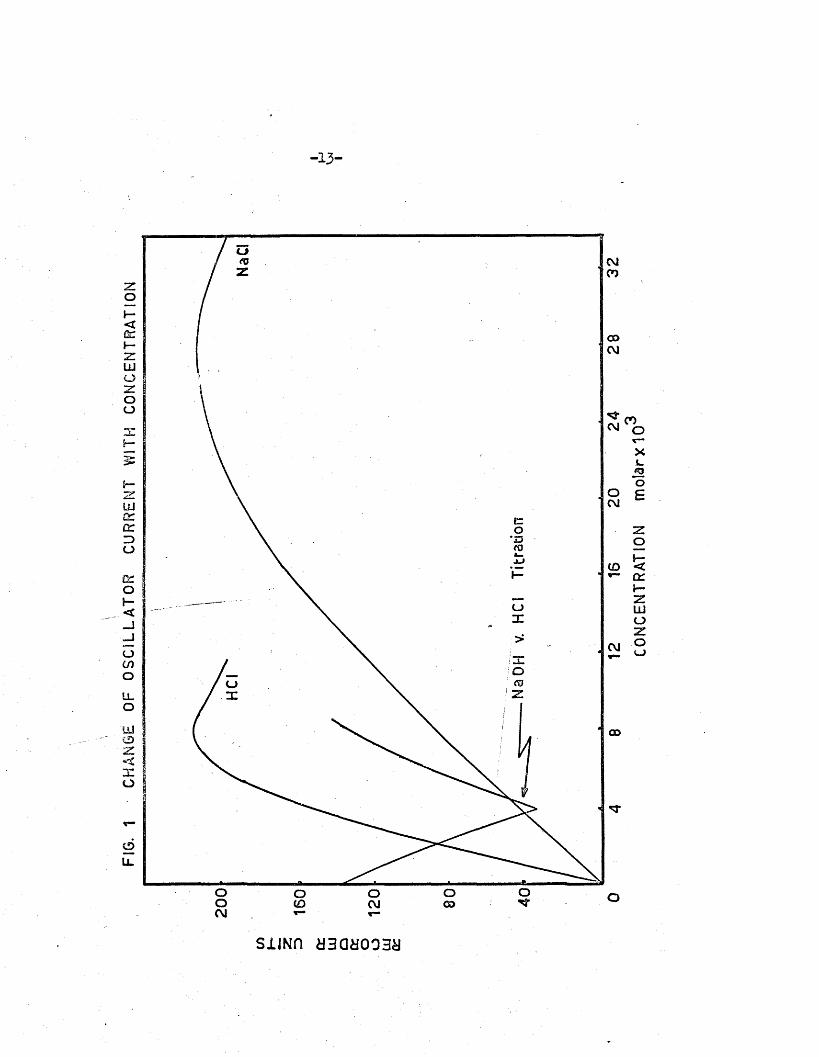
FIG.
1
CHAN
GE
OF
OS
CIL
LATO
R
CURR
ENT
WIT
H C
ON
CE
NTR
ATI
ON
-13 -
o
CO
c\J
H-
OX
CO
OO oCO
SiJNn H3Q8003H
CO
NC
ENTR
ATI
ON
m
ola
rxlO

-1 4 -
the concentrations of HC1 and NaCl so lu tions corresponding to maximum
o s c illa to r cu rren t are 0.0080M and 0.0280M resp ec tiv e ly , and th e ir respec
tiv e equivalent conductances are 425*5 aad- 126*4* I t was also found th a t
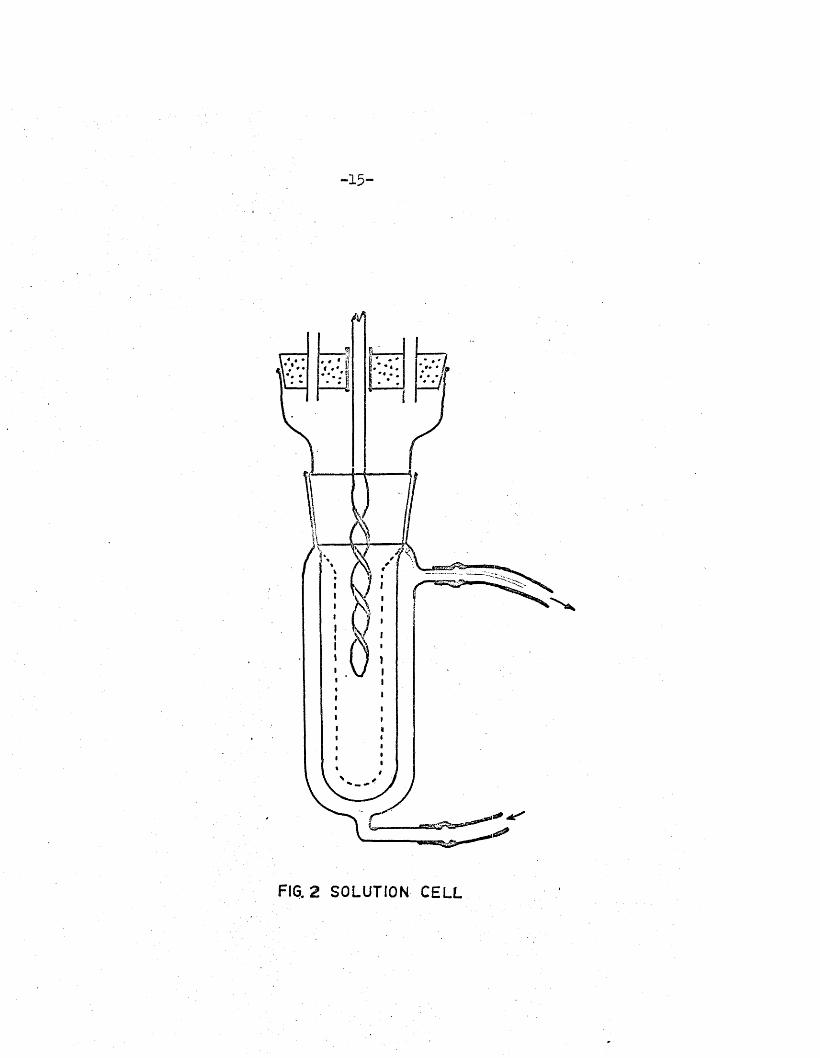
when a c e l l of sm aller in te rn a l diameter (F ig .2) was used, maximum o s c i l la to r
current was obtained a t higher Concentration: e .g . 0.0133M HC1 so lu tion ,
and 0.0467M NaCl so lu tion gave maximum o s c i l la to r curren t with th i s c e l l .
Thus, the o s c illa to r responds to the conductance of the e le c tro ly te in
a manner re la te d to i t s equivalent conductance A by :
/ M A ~ 1000c
where C i s the c e l l-c o n s ta n t , and h the op oc i f re conductance
The e ffe c t of appreciable changes in d ie le c tr ic constant was also
investiga ted by adding dioxan to water in the c e l l and vice versa;
neg lig ib le change in.anode cu rren t was observed. This o s c i l la to r i s ,
therefo re , in se n s itiv e to changes in d ie le c tr ic constant of n o n -e lec tro ly tes
over a wide range.
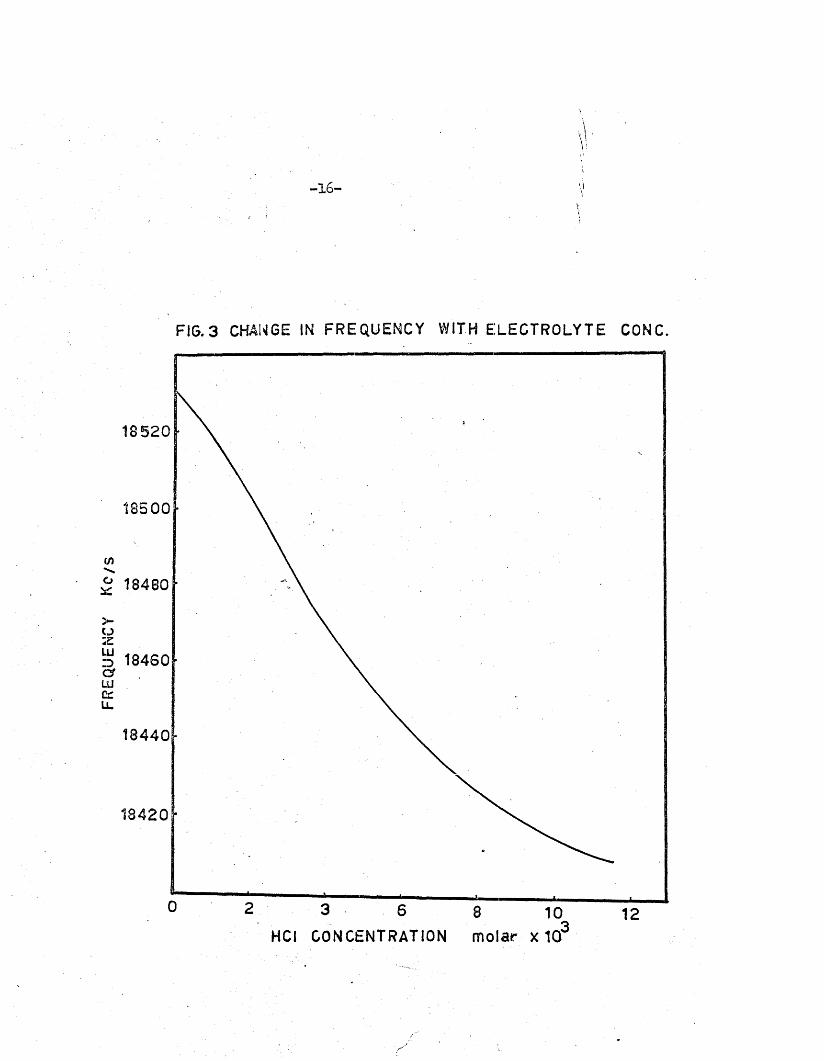
The frequency of the o s c i l la to r b u i l t could be varied from 15 to
20 Mc/s; the optimum resonant frequency fo r which the anode cu rren t was
a minimum, was obtained a t about 18*5 Mc/s. The o s c i l la to r cu rren t a t th is
frequency was 20 ma, r is in g to 45 ma when o sc illa t io n s were completely
damped out. The change in frequency with increase in e le c tro ly te concen
tra t io n was inv estig a ted by coupling the o s c i l la to r loosely to a Heterodyne
frequency meter; the frequency i s p rogressively lowered as shown in Fig.3#
-1 5 -
FIG. 2 SOLUTION CELL
-16 -
FIG.3 CHANGE IN FREQUENCY WITH ELECTROLYTE CONC.
18520
18500
18480
S 18460LU
18440
13420
3 6 8 10
HCI CONCENTRATION molar X 10'
-1 7 -
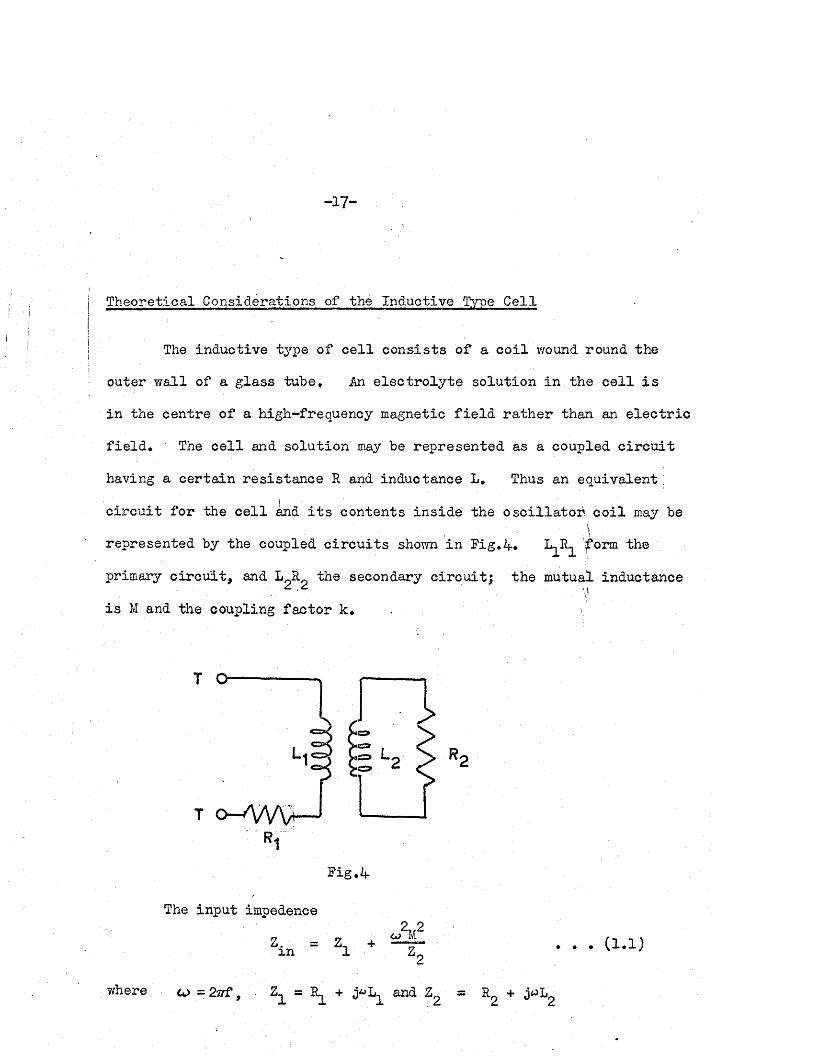
T heoretical Considerations of the Inductive Type C ell
The inductive type of c e l l co n sis ts o f a c o il wound round the
outer w all of a g lass tube. An e le c tro ly te so lu tion in the c e l l i s
in the centre of a high-frequency magnetic f i e ld ra th e r than an e le c tr ic
f ie ld . The c e l l and so lu tion may be rep resen ted as a coupled c i r c u i t
having a c e rta in re s is tan c e R and inductance L. Thus an equivalent;j
c ir c u i t fo r the c e l l dnd i t s contents in sid e the o sc illa to h c o il may be• irepresented by the coupled c ir c u i ts shown in F ig .4* f orm
primary c i r c u i t , and L R the secondary c ir c u i t ; the mutual inductance
i s M and the coupling fa c to r k .
T O
T Q—/\A /V — '
Fig.i*-
The inpu t impedence
xn . . • (1.1)
where cj = 2w f, • Z = R + and Z = +
—18—
Thereforec jM2(E - ju.L )
■ - ' - • - • ccSexa*
So + ui"L2.2
'2. . . (1 . 2)
separation of r e s is t iv e and reac tiv e terms gives2„)r2_ r 2. „2wM R0
Z.mw
®1 + 72 “272 + Jc0| h " „2 2 2V U 1 2 i 2 2J
. . (1 .3 )
In an equivalent se rie s c ir c u i t
Z.m R. + <m m
Equating re a l and imaginary p a rts , i t follows th a t
h?Rr
and
R.in
L.m
Ri +
u*2 2
2 2l 2m2w
-.2 2t 22 2
. . . (1 . 4 )
. . . (1 . 5 )
The 1Q -factor1 of an inductance L. (which i s a measure of themm agnification of voltage across 31 ^ a t resonance) i s defined as
Q.mm
R.m. . . (1. 6)
The subscrip t ’in* re fe rs to what i s a c tu a lly measured in the c i r c u i t as
a whole, "looking in to" the term inals TT. i s a conveniently-
measurable c h a ra c te r is tic of any tuned c i r c u i t ,
and 31 in equation ( l . 6) y ie ld s :
S u b stitu tio n fo r R.i n

I f the secondary inductance i s sh o rt-c ircu ited , i . e . R = 09 and2 2u til iz in g the fa c t th a t M — k L. L^, equation (1*5) becomes
Lin = . . . (1 .8)
I t follow s, therefo re , th a t
iin(E 2=0)
u)L^(l ■* k )
. • . (1 .9)
I f the secondary inductance i s open-c ircu ited , i . e . = ce,
^in(R.=co) = ' t h
Combination of equations (1 .9) and (1.10) gives
. . . (1.10)
^ n (&2 - 0 ) _ ^ _ k2)Q.in(R2 = a:)
. . . (1. 11)
I f i s a physical component coupled to the coupling fa c to r k may be
evaluated by equation ( l . l l ) . In the p resen t case, (R^ = 0 ) may be
re a lise d by f i l l i n g the c e l l with mercury, and (R2 = cd) by leaving i t empty.

-2 0 -
Equation (1 .7) may b© w ritten thus :
Q.vin
1 -1 +2 2 oJM%
ttt2 - . . . (1.12)
R1 + _.2 2t 2 2 + 2
I t can be deduced from equation (1.12) th a t Qin w ill increase monotonically
as RQ increases. Consider the denominator D of expression (1 .12) sepa
ra te ly :2 2 ooM R,
J f 2_2R. + u» Lg
D iffe ren tia tio n with resp ec t to Rg gives
an _ ( r 2 + o ? l2) u2m2 - w A . .2R,dR.
I t can be seen th a t
2, 2s 2. . . (1.13)
(Ro + t o x h
dD d2D^ = 0 i f R = uiLg, and —7; i s a negative quantity*dR
Therefore, when R = wig* ® must be a maximum;2
= R 4.maxi . e . D = R^ + 2L
A minimum value fo r Q. w il l be obtained when D is a maximum,m 9
S-n(min) . . . (1.14)
-21 -
In tro ducing M2 = k2L1L2 in to th is r e s u l t and sim plifying, equation
(1.14) gives
6j ( 2Ll L2-k ^ ^
Qin(min)1 2
I f k i s sm all, 'then
2ML1
V “ ” > ' 2 3 , ( 1 . ^ )2Bl
or®in(min) = 1 + ^ . . . (l.X 6 )
Hence, the coupling fac to r k may be evaluated fo r a so lu tion in the c e l l
i f Qin (min) an(i Q- (the Q-factor fo r the primary c ir c u i t ) are measured.
I f an inductive-type c e l l i s connected to a Q-meter i t should be possib le
to verify these relationsh ips*
Apparatus
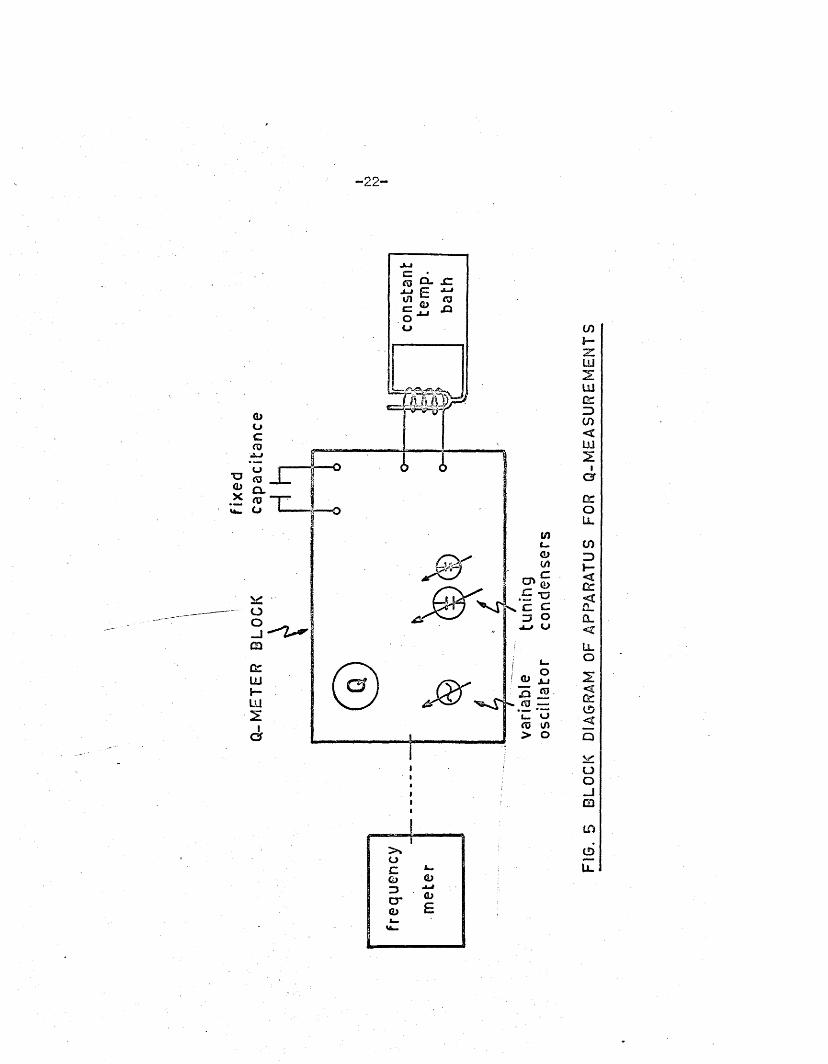
A block diagram of the apparatus used i s shown in F ig .5* The
Q-meter, or 1 C ircu it M agnification M eter1, was a Marconi type TF 329G> and
the frequency meter was a Heterodyne Beat type (CKB-74028). The constan t—
temperature apparatus consisted of a therm ostatted bath containing d i s t i l l e d
water and a ^ iro th e rm 1 c irc u la tin g pump; a tem perature contro l of
25.0 i o .i°c was obtainable.
-2 2 -
. o "o
o
T3Q.
E •§ V T s ’c c
-S uCD
LUL_ OfO to> o
I
CO* -ZLU2LilorZDCO<1112icrDCOLLCO3I—<c r
£L<
Ll_o
or<Q
oo- Jm
>sOC0>3c ro>
oj j0>
e
10CD
U -
L
-2 3 -
In the actual apparatus constructed the Q-meter i s replaced by a
stab le o s c i l la to r (see P art I I , Section l ) . However, the response of
th is o s c i l la to r i s to the Q -factor of the c i r c u i t coupled to i t s tank c o i l ,
i . e . to the Q of the c e l l and i t s co n ten ts , so th a t the use of Q-measurements
in these investiga tions i s ju s t if ie d .
Experimenta l and R esults
In order to te s t the v a lid ity of the coupled c i r c u i t taken to re
present the c e l l and i t s contents, the e le c tro ly te so lu tion was f i r s t
su b s titu ted by a secondary c o il and re s is tan c e . A copper wire was wound
round the outer w all of the inner tube of the c e l l and i t s ends provided
with term inals fo r connection to carbon re s is to r s of various values (F ig .6 ),
sq th a t, e ffe c tiv e ly , a secondary c i r c u i t was C0UP le(l to the primary
c ir c u i t ends of the primary c o il were connected to the inductance—
term inals of the Q-meter, which was se t a t 20 Mc/s and maintained a t th is
frequency. Maximum Q was obtained by ad ju sting the capacitance d ia l on the
Q-meter# A se rie s of maximum Q values were obtained s ta r tin g with
open-circu ited ( i . e . Rg = oo ) an< ending with sh o rt-c irc u ite d (R^ = 0) ,
Table 1.1* A p lo t of Q against log Rg i s shown in Fig. 7*
Q-values were ca lcu la ted by su b s titu tin g the d if fe re n t values of R^
in equation (1 . 12) . and L^, which were assumed to remain constan t, were
measured independently on the Q-meter, and R was evaluated with the a id
of equation ( l* 6) . The ca lcu la ted values o f Q are included in F ig .7#

-2 4 -
TABLE 1 .1
V ariation of the Q-factor
with re s is tan ce
(Physical components as the Secondary C irc u it)
Resistance in ohms.
c*£>
950,000
74,000
30,700
16,530
9,443
8,047
3,385
3,015
2,082
1,001
MaximumQ
204
200
194
184
174
164
159
125
117
99
67
Resistance in ohms*
692i7
556*9
364.4
1 6 2 .6
103.9
75.6
42*2
10.5
5.0
0
MaximumQ
52
44
33
23
22
23
32
82
112188

FIG. 6 PHYSICAL COMPONENTS REPRESENTING ELECTROLYTE SOLUTION

Q.F
AC
TOR
- 26-
FIG. 7 - VARIATION OF Q-FACTOR WITH RESISTANCE
160
120
80
40@ Calculated
o Exper im enta l
0 1 2 3 4 5
LOG R2
-2 7 -
E xcellent agreement with the experimental curve was obtained.
Measurements of Q were then c a rried out with varying concentrations
of hydrochloric acid so lu tion in the c e l l . D is ti lle d ?\rater from the
constant-tem perature bath was c ircu la ted through the cooling jack e t. A
p lo t of Q against log R^, where R i s row the rec ip ro ca l of the sp ec ific
conductance of the so lu tion , gave a curve s im ila r to th a t obtained with
physical components.
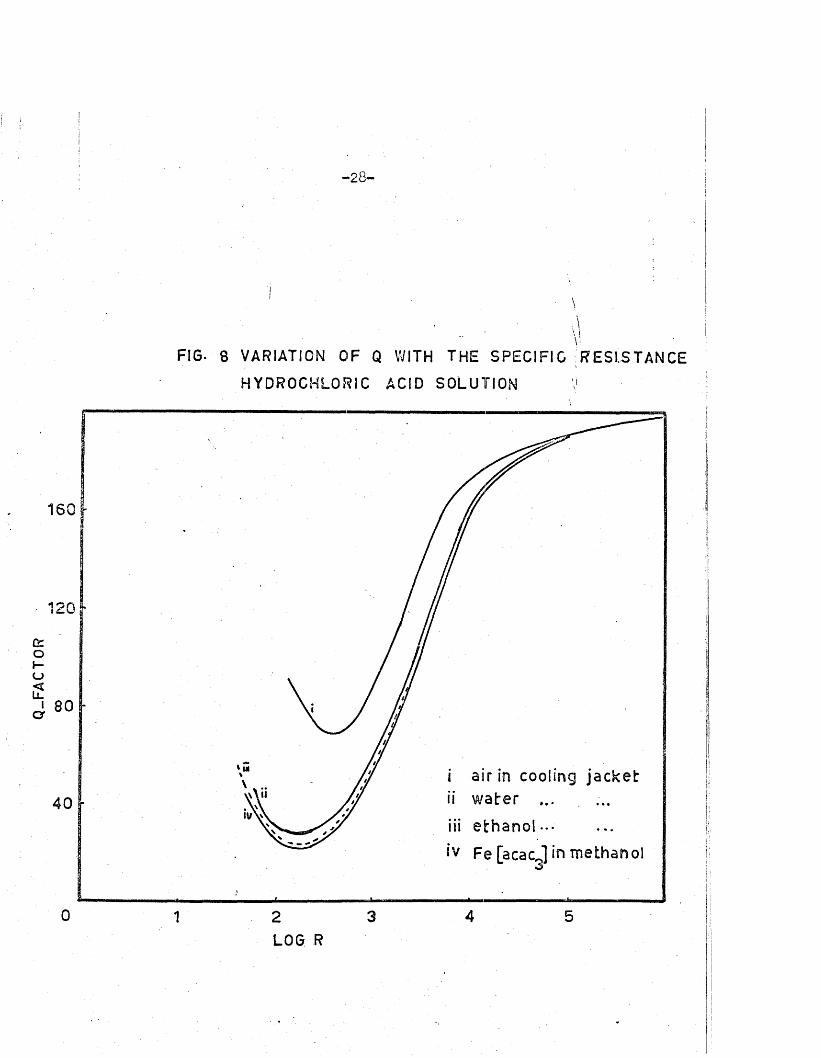
To in v es tig a te the e ffe c t on Q of changing the d ie le c tr ic constant
of the in tervening medium, fu r th e r measurements of Q were made, f i r s t with
absolute ethanol and then with a i r as coolant in the ou ter jack e t. Values
of Q fo r the same sp ec ific r e s i s t a n t o f the so lu tion were approximately the
same when water and alcohol were used as coolants, whereas a i r produced
su b s ta n tia lly h igher Q values (F ig .8) .
The d ifference in Q fo r so lu tions of the same res is tan ce evidently
does not depend so le ly on th e d ie le c tr ic constant of the in tervening medium;
i t was thought th a t i t s magnetic su sc e p tib ility might be of importance.
This was in v es tig a ted by carrying out s im ila r measurements of Q on hydro
ch lo ric acid so lu tions w ith the cooling jacket f i l l e d with a sa tu ra ted solu
tio n of f e r r ic acetylacetone (which i s an undissociated but highly
paramagnetic substance p = 5*95 B.M.) F ig .8.
F in a lly , Q was measured fo r various concentrations of sodium ethoxide
in absolute e thanol. The sp e c if ic conductance of the ethoxide so lu tion
Q_F
AC
TOR
-2 8 -
FIG- 8 VARIATION OF Q WITH THE SPECIFIC RESISTANCE
HYDROCHLORIC ACID SOLUTION Vi !
160
20 r
80
i air in c o o l in g j a c k e tii w a t e r ...
iii e t h a n o l ...
iv Fe [ a c a c j in Tuethanol
v\ \ ii4 0
0 4 531 2L O G R
-2 9 -
was determined by a normal 1000 c /s Wheatstone conductiv ity bridge before
i t was used fo r Q-meter measurements. The re s u lts obtained are shown
in Fig.9«
M aterials
AnalaR grade hydrochloric acid was d ilu te d to N5 and standardised
with standard sodium hydroxide so lu tion . F erric ace ty l acetone was pre
pared and p u rif ie d as described by Charles and Pawlikowski [14]* Sodium
ethoxide was prepared by d isso lv ing pure sodium metal in absolute ethanol
and separating the c le a r solution*
Discussion
The experimental values of Q fo r various values, when physical
components are used to represent the c e l l , are in excellen t agreement with
those ca lcu la ted from equation (1.12)* The curves obtained fo r the
v a ria tio n of Q w ith log R^ fo r hydrochloric acid so lu tions also have the
shape p red ic ted by equation (1 .12 ). This equation, which i s based on the
equivalent c i r c u i t concept o u tlined above, may, there fo re , be considered
to hold fo r the inductive type cell*
I f we assume th a t L^, the e ffec tiv e inductance of the te s t so lu tion ,
remains unchanged fo r a given c e l l the Q -factor of the system w ill be a
function of M, the mutual inductance ( i . e . of k, the coupling fa c to r ,2 2
since M = k and the res is tan ce of the solution* The coupling

Q-F
AC
TOR
-3 0 -
FIG. 9 VARIATION OF Q WITH SPECIFIC RESISTANCE OF
SODIUM E T H O X ID E IN ETHANOL
150
120
0 2LOG R
-3 1 -
fa c to r k depends upon the design of the c e l l , and in p a r tic u la r the
nature and th ickness of the in terven ing medium in the outer jack e t. I t
i s evident th a t a l iq u id (water, ethanol or methanol) as coolant in the
jacket produces much t ig h te r coupling than does a i r : k . = 0.019,a irk ^ t e r = The change in the d ie le c tr ic constant of the coolant
( £ water = 78*5, ethanol = 24.2) seems to have l i t t l e influence on k
and consequently the Q -factor also remains unaffected . This leaves the
’perm eability*, or the re la te d quantity the ’magnetic su sce p tib ility * , as a
possible fa c to r governing the ex ten t of coupling. However, in v es tig a tio n s
with sa tu rated so lu tions of f e r r ic acetylacetone in methanol revealed th a t
these p ro p erties are unimportant in determining the ex ten t of coupling
between the primary inductance and the te s t so lu tio n in the c e l l Lg*
At th i s stage, th e re fo re , i t may be concluded th a t the v aria tio n s
in , fo r a given so lu tion and c e l l but with various coolants (e .g .
a ir , water, and o ther non-conducting liq u id s ) in the outer jac k e t, are due
tod iffe rences in the coupling fac to r k . Further, the v a ria tio n s in log
corresponding to f ° r a given so lu tion in d iffe re n t c e l ls are due to
a fac to r which may be represented as the c e l l constan t.
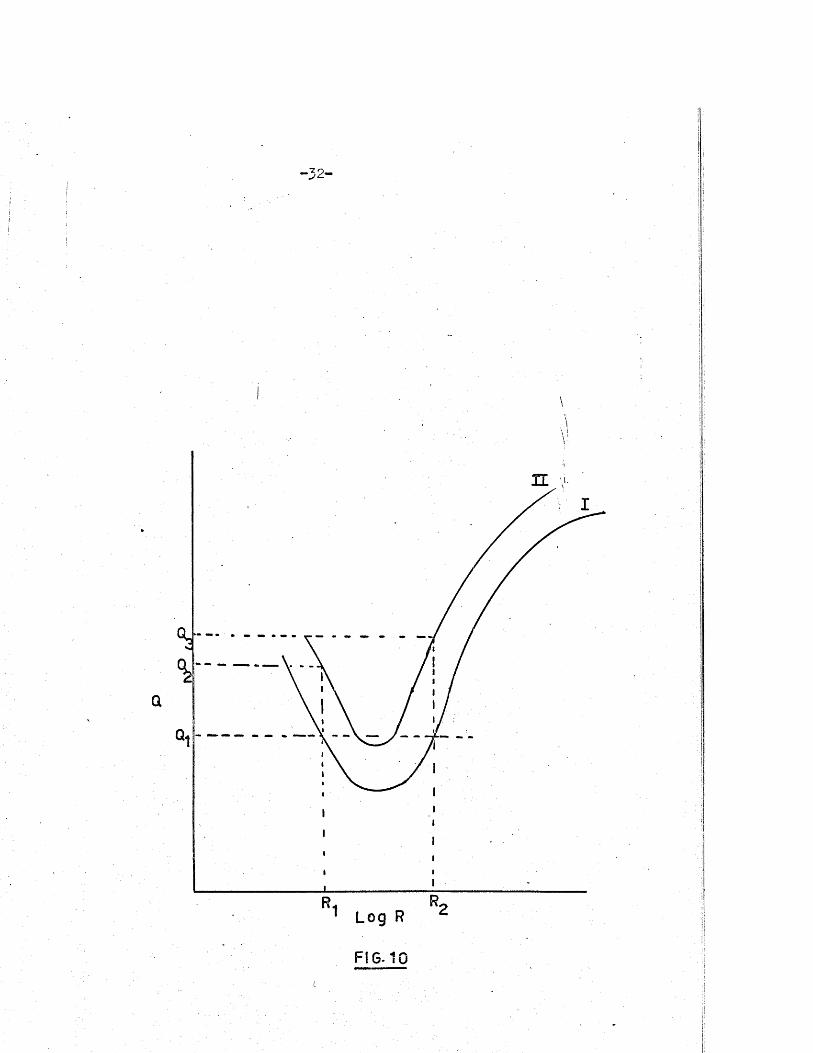
I f an e le c tro ly te of unknown specific conductance i s placed in the
c e l l , ambiguity regarding i t s ac tual resistance may a rise from the form
of the Q v. log curves. However, th is may be overcome i f measurements
are repeated in a second c e l l of d if fe re n t coupling fa c to r and c e l l constant;
th is i s apparent from F ig .10. I f the unknown e le c tro ly te gave a Q -factor
-3 2 -
FIG-10

-3 3 -
of when measured on the Q-meter in c e l l I then i t s res is tan ce might be
R or Eg* unknown e le c tro ly te i s then placed in c e l l I I the
measured Q-factor (Q or Q^) should loca te the co rrec t value of the r e s is
tance. The f a c t th a t each curve i s not symmetrical about the v e r t ic a l
l in e passing through i t s minimum i s u tiliijed* However, such ambiguity
hardly a rise s in the course of normal conductance measurements, since the
steep r ig h t hand po rtion of the Q r . lo g °urve covers the most u se fu l"•ii- 5 ““1 **1sp ec ific conductance range of 1 x lO to 5 x 10 ohm. cm. .
The advantages of such measurements l i e in the f a c t th a t the
electrodes are non-ex isten t, and therefore cannot become p o la rised or
contaminated by p re c ip ita tio n s occurring w ith in the c e l l . At p resen t,
attem pts are being made in th is laboratory to employ th is technique to
follow the r a te of adsorption of ions by c o llo id p a r t ic le s , and to d e te r-
minjs the equilibrium concentrations of such systems.
The increase in o s c i l la to r curren t observed w ith increasing e le c tro
ly te concentrations (F ig .l ) in the tuned-anode o s c i l la to r may be explained
in terms of the decrease in the Q -factor observed in Q-measurements. The
condition fo r maintenance of o s c i l la t io n in the tuned-anode o s c i l la to r i s
L.= M ( ~ r ~ + Ci n E i n
1 1 i n + C. R . J . . . . (1.17)a
where g^ and r a are the mutual conductance and anode slope re s is tan c e ,
resp ec tiv e ly , of the o s c i l la to r valTe, ^ ^ave "t*16 same
significance as befo re .

how from equation ( i .4 ) i t can be seen th a t R. increasesmas decreases, because the term
increases as decreases. I f ^ nj in e q u a tio n (1,17) i s increased ,
g must increase in order to re s to re the condition fo r o s c il la t io n ; m 9
and from Figs,11a and b, th is w il l cause an increase in anode c u rren t.
Thus v a r ia tio n in (or Q) '^le secondary c i r c u i t w il l produce
changes in the o s c i l la to r anode cu rren t.
(a) 00
-3 5 -
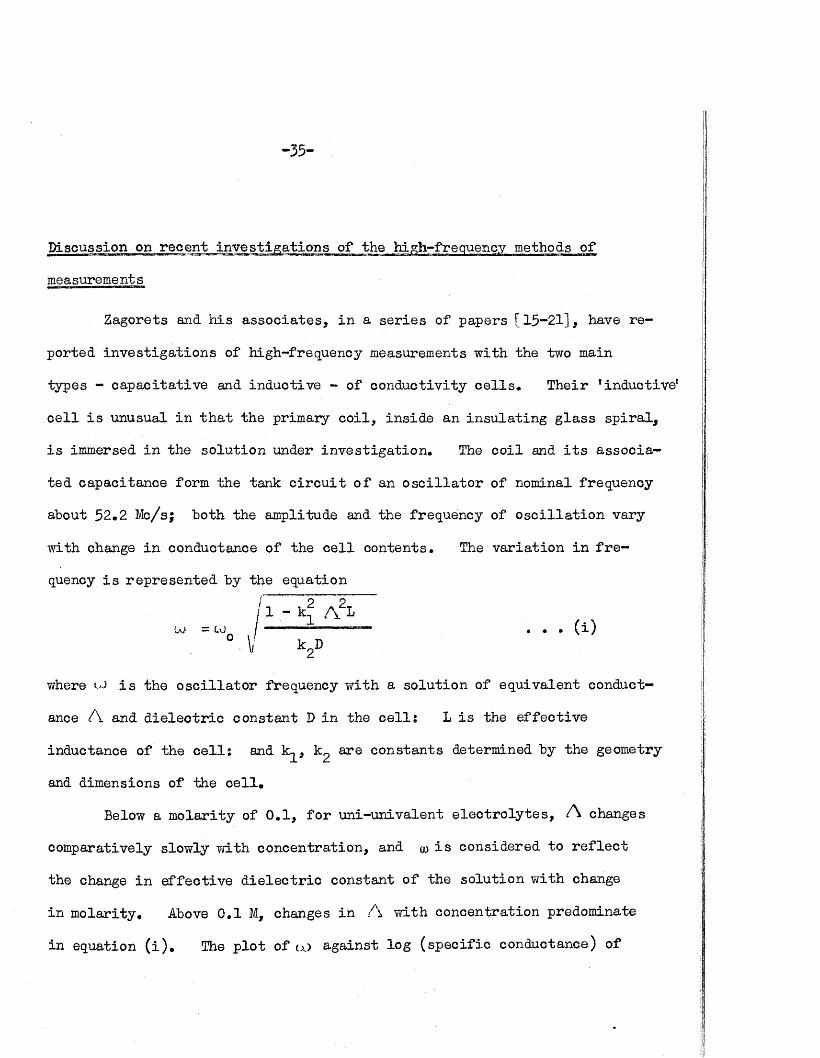
Discussion on recen t in v es tig a tio n s of the high-frequency methods of
measurements
Zagorets and h is a sso c ia tes , in a se rie s of papers [ 15-21], have re
ported in v es tig a tio n s of high-frequency measurements w ith the two main
types - cap ac ita tiv e and inductive - of conductiv ity cells* Their *inductive’
c e l l i s unusual in th a t the primary c o il , in side an in su la tin g g lass s p ira l ,
i s immersed in the so lu tion under investigation* The c o il and i t s associa
ted capacitance form the tank c i r c u i t o f an o s c i l la to r of nominal frequency
about 52.2 Mc/sj both the amplitude and the frequency of o s c i l la t io n vary
with change in conductance of the c e l l contents. The v a ria tio n in f r e
quency i s rep resen ted by the equation
where vo i s the o s c i l la to r frequency w ith a so lu tion of equivalent conduct
ance A and d ie le c tr ic constant D in the c e l l ; L i s the e ffec tive
inductance of the c e l l ; and k- , k2 are constants determined by the geometry
and dimensions of the c e l l .
comparatively slowly with concentration , and go i s considered to r e f le c t
the change in e ffec tiv e d ie le c tr ic constant of the so lu tion w ith change
in m olarity . Above 0.1 M, changes in A w ith concentration predominate
2 '
( i )
Below a m olarity of 0 .1, fo r un i-un ivalen t e le c tro ly te s , A changes
in equation ( i ) . The p lo t of u j against log (sp ec ific conductance) of
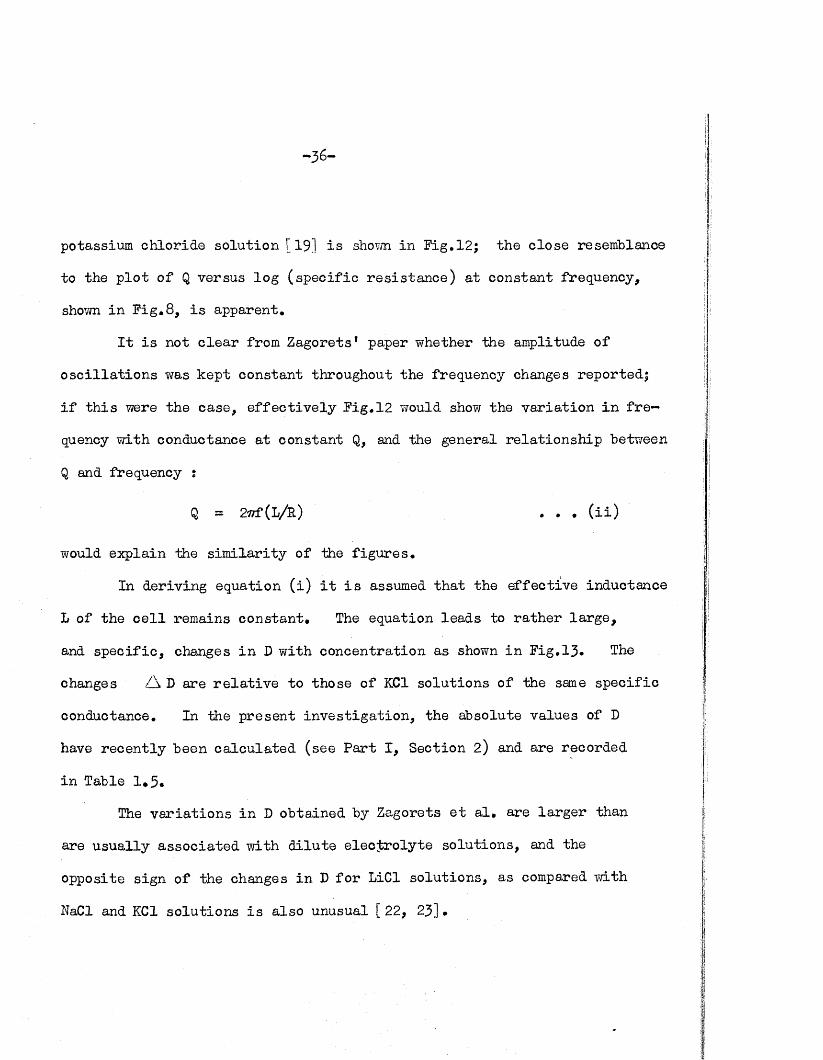
-3 6 -
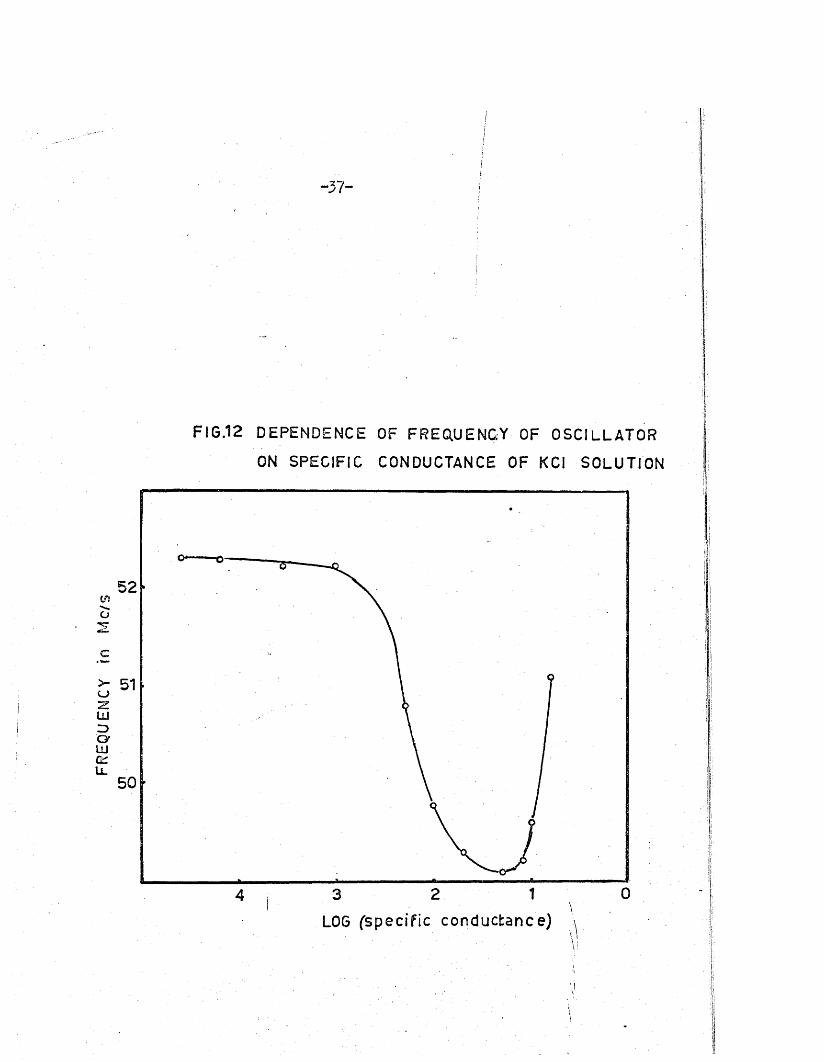
potassium chloride so lu tion [19] i s shown in F ig .12; the close resemblance
to the p lo t o f Q versus log (sp ec ific re s is ta n c e ) a t constant frequency,
shown in F ig .8, i s apparent.
I t i s not c le a r from Zagorets* paper whether the amplitude of
o s c il la t io n s was kept constant throughout the frequency changes reported ;
i f th is were the case, e ffe c tiv e ly F ig .12 would sho?* the v a ria tio n in f r e
quency with conductance a t constant Q, and the general re la tio n sh ip bet?/een
Q and frequency t
Q = 2wf(L/R) . . . ( i i )
would explain the s im ila rity of the f ig u re s .
In deriving equation ( i ) i t i s assumed th a t the e ffec tive inductance
L of the c e l l remains constan t. The equation leads to ra th e r la rg e ,
and sp e c if ic , changes in D with concentration as shown in F ig .13* The
changes A D are r e la t iv e to those of KC1 so lu tions of the same sp ec ific
conductance. In the p resent in v es tig a tio n , the absolute values of D
have recen tly been ca lcu la ted (see P art I , Section 2) and are recorded
in Table 1*5«
The v a ria tio n s in D obtained by Zagorets e t a l , are la rg e r than
are u sua lly assoc ia ted with d ilu te e le c tro ly te so lu tions, and the
opposite sign of the changes in D fo r LiGl so lu tions, as compared with
NaCl and KC1 so lu tions i s also unusual [ 22, 23]•
i
FREQ
UENC
Y rn
Mc/
s
•37-
FIG.12 DEPENDENCE OF FREQUENCY OF OSCILLATOR
ON SPECIFIC CONDUCTANCE OF KCI SOLUTION
52
51
50
4 3 2 1 0I • \
LOG (specif ic conductance) \
A

-3 8 -
FIG.13 DEPENDENCE OF AD OF SOLUTIONS
ON LOW-FREQUENCY CONDUCTANCE
AD
AICI.
NaClMgCI
- 3 - 2
LOG X- 2
- 4
ii \
■ i :i.\’ I
-39-
I t i s concluded th a t equation ( i ) over-emphasises the changes
of d ie le c tr ic constant with concentration; the s im p lifica tions involved
in deriving the fequivalent c i r c u i t1 of the r e a l o s c i l la to r , would
account fo r th is over-emphasis. As comparison of F igs. 3 12 shows,
Zagorets* o s c i l la to r va ries in frequency much more than the instrum ent
used in the p resen t work.
-40-
SECTION 2
Dispersion of Conductance and D ie lec tric Constant
The dependence of conductance and d ie le c tr ic constant in e le c tro ly te
so lu tions upon the frequency, was f i r s t p red ic ted th e o re tic a lly by Debye
and Falkenhagen [24] and subsequently v e rif ie d experim entally by Sack and
o thers [ 25* 26] . The conductiv ity theory of Debye, H&ckel, and Onsager
in th e form which takes in to account the a-parameter (the distance of
c lo ses t approach of oppositely-charged ions) may be considered as a p a r t i
cular case (of the general problem) in which the frequency of the
a lte rn a tin g e le c tr ic f i e l d i s zero. The dependence of conductance and
d ie le c tr ic constant upon the frequency i s considered separa te ly .
Conductance
Falkenhagen, L e is t, and Kelbg [ 27“31] extended the above theory
to include the e ffe c t of frequency of the applied f i e ld upon the conduct
ance. Their equation may be w ritten as
A w = A 0 - / Y J w - A n . . . ( 1.18)
where A w i s the equivalent conductance a t frequency f = u3/2ir9 A 0
the. equivalent conductance a t in f in i t e d ilu tio n , A j ^ the re laxa tion
e ffe c t a t th is frequency, and A ^ the e lec tropho re tic term - assumed
independent of frequency.
For un i-un iva len t e le c tro ly te s a t 25° the separate terms in
-4 1 -
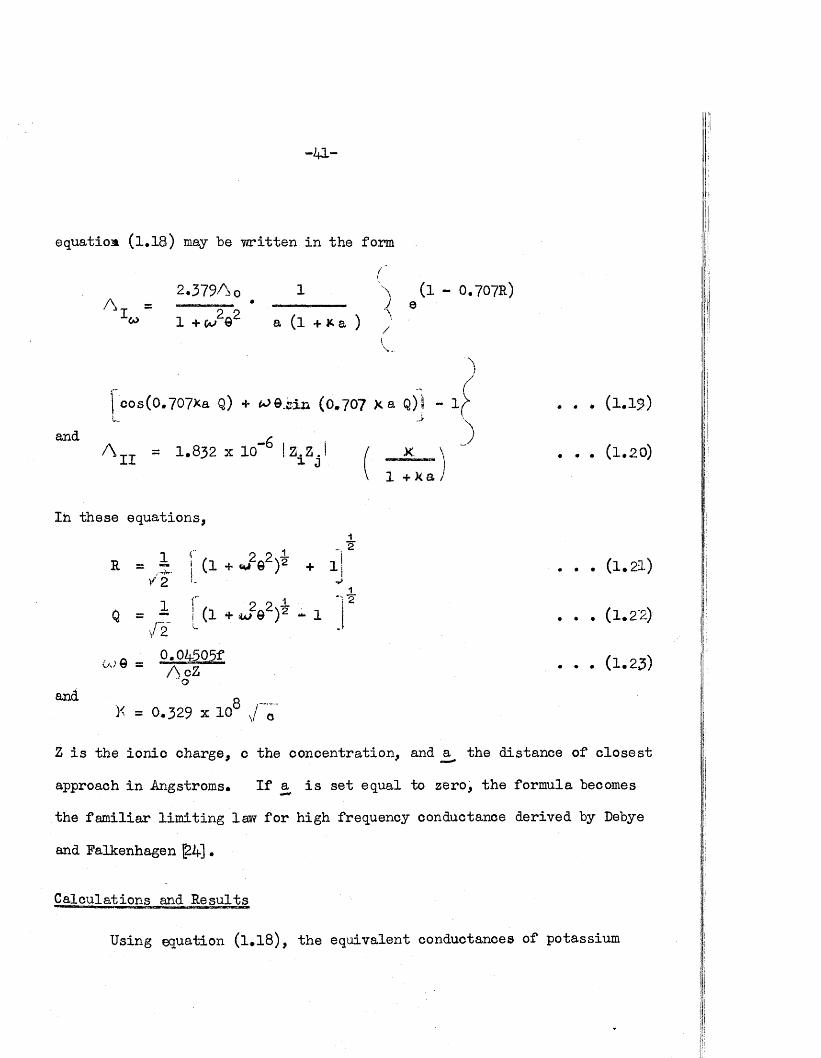
equatioat (1.18) may be w ritten in the form
( '
2.379A 0 # 1 "\ (1 - 0.707R)
l + w 2q2 a (l + k a ) ^1\
a
and
cos(0.707Xa Q) + ^© .cin (0.707 Xa Q)| - 1> . . . (1 .1?)
A 1Z = 1.832 x 10"6 I z ^ J / X \ ' . . . (1.20)1 + k a l
In these equations,jl . 2
r = i | (1 + w2e2)2 + 1 ! . . . (1.21)
1 f O O 1 I ^Q = i | (1 t w 8 )! - 1 . . . (l .2'2)
,/2
and oK = 0,329 x 10° /"o
. . . (1.23)
Z i s the io n ic charge, c the concentration, and the distance of c lo ses t
approach in Angstroms. I f a i s se t equal to zero, the formula becomes
the fam ilia r lim itin g law fo r high frequency conductance derived by Debye
and Falkenhagen [24] •
C alculations and R esults
Using equation (1 .18), the equivalent conductances of potassium
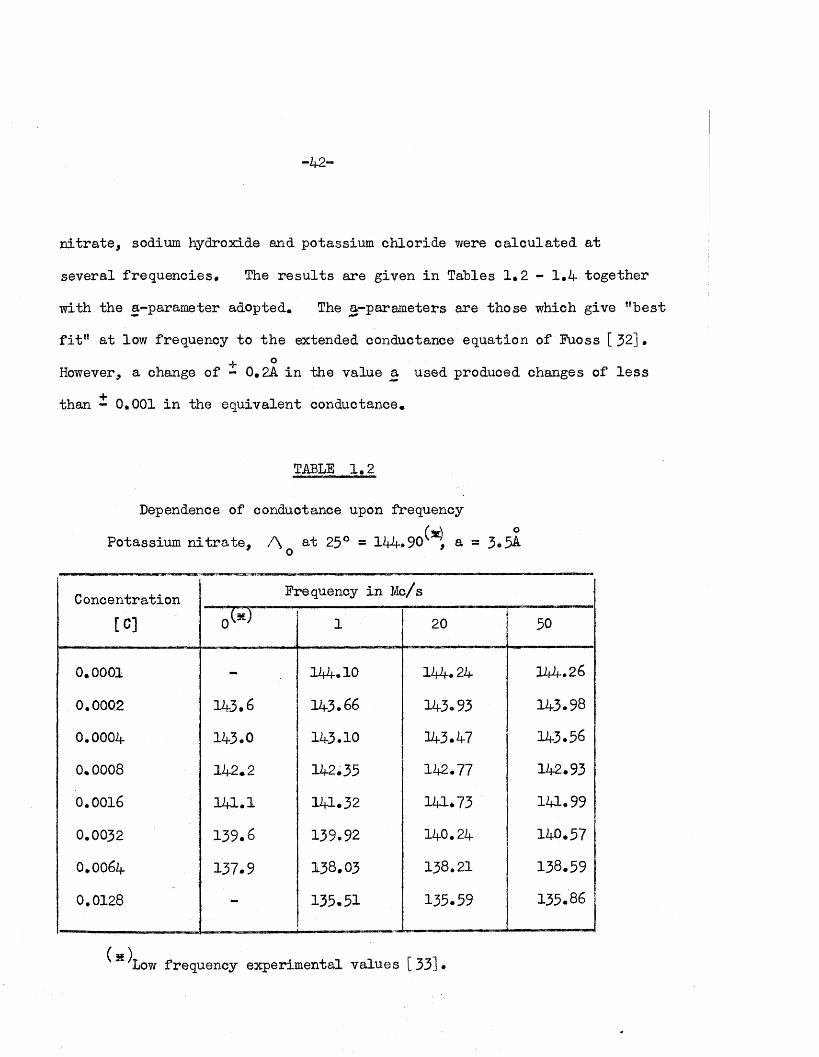
-42-
n i tr a te , sodium hydroxide and potassium chloride were ca lcu la ted a t
several frequencies* The re s u l ts are given in Tables 1*2 - 1*4 together
with the a-pararneter adopted. The a-param eters are those which give ’’b e s t
f i t ” a t low frequency to th e extended conductance equation of Fuoss [ 32] •->r °However, a change of - 0 .2A in the value a used produced changes of le s s
than - 0.001 in the equivalent conductance.
TABLE 1.2
Dependence of conductance upon frequency(z£) o
Potassium n i t r a te , A 25° = 144*90 , a = 3.5A-
Concentration Frequency in Mc/s
[C] 0® 1 20 50
0.0001 - 12*4.10 12*4.24 144.26
0.0002 143.6 143.66 143.93 143.98
0.0004 143.0 143*10 143.47 143.56
0.0008 142.2 142*35 142.77 142.93
0.0016 12*1.1 12*1.32 141*73 12*1.99
0.0032 139.6 139.92 140.24 140.57
O.OO64 137.9 138.03 138.21 138.59
0.0128 - 135.51 135.59 135.86
( x ) Low frequency experimental values [33]*

-4 3 -
TABLE 1 .3
Dependence of conductance upon frequency
wSodium hydroxide, A a t 23° = 247.8o
= 3.3A
C one e n t r a tion Frequency in Me/s
(*) Low frequency experimental values [ 34]
TABLE 1 .4
Dependence of conductance upon frequency
(*)
[C] 1 2° 50
0.0001 247.0 246.73 24-7.05 247.110*0002 246.3 246.22 246.67 246.770.0004 243.8 243.33 246.07 246.250.0008 244.9 22,4.59 245.14 245.450.0016 243.8 243.30 243.75 244.200.0032 242.2 22*1.53 241.81 242.320.0064 240.0 259.13 239.26 239.660.0128 235.91 235.96 236.17
Potassium ch lo ride , A a t 25°, 150.0' o 0Lo
3.2A
Concentration Frequency in Mc/s
[C] 0w 1 10 100
0.0001 149.05 149.15 149.30 149.370.0008 147.30 147.2*1 147.69 148.110,0032 144.75 12*4.92 345.04 145.900.0128 140.30 140.32 124). 36 141.13
(*) Low frequency experimental values [ 35]
-4 4 -
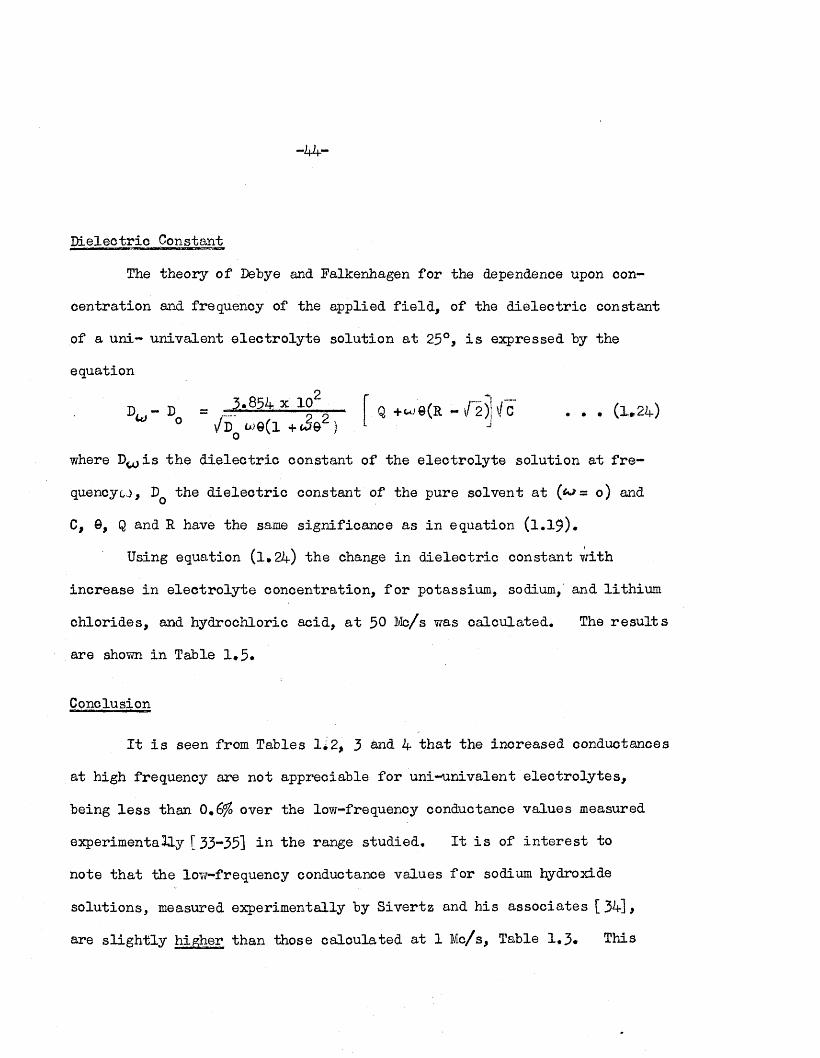
D ielectrio Constant
The theory o f Debye and Falkenhagen fo r the dependence upon con
cen tra tion and frequency of the applied f ie ld , of the d ie le c tr ic constant
of a u n i- un ivalen t e le c tro ly te so lu tion a t 25°, i s expressed by the
equation
where D ^jis th e d ie le c tr ic constant of the e le c tro ly te so lu tion a t f r e
quency c.), Dq the d ie le c tr ic constant of the pure solvent a t = o) and
C, ©, Q and R have the same sign ificance as in equation (1 .19 ).
increase in e le c tro ly te concentra tion , fo r potassium, sodium, and lith ium
ch lo rides, and hydrochloric acid , a t 50 Mo/s was ca lcu la ted . The r e s u l ts
are shown in Table 1*5*
Conclusion
I t i s seen from Tables 1*2, 3 4 th a t the increased conductances
a t high frequency are not appreciable fo r un i-un iva len t e le c tro ly te s ,
being le s s than 0m6% over the low-frequency conductance values measured
experim entally [33-35] i a the range stud ied . I t i s of in te r e s t to
note th a t the low-frequency conductance values fo r sodium hydroxide
so lu tions, measured experim entally by S ivertz and h is assoc ia tes [3 4 ],
are s l ig h tly higher than those ca lcu la ted a t 1 Mc/s, Table 1,3* This
2
j0
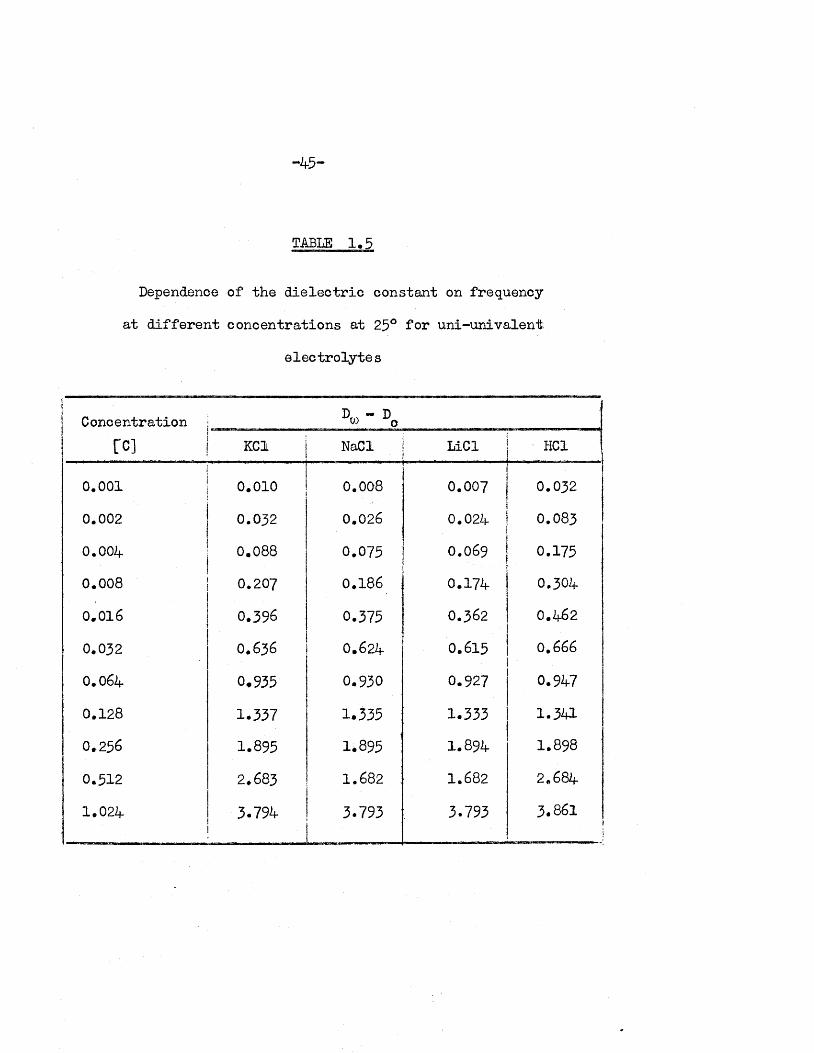
Using equation ( l.2 4 ) the change in d ie le c tr ic constant w ith
- 45-
TABLE 1,5
Dependence of the d ie le c tr ic constant on frequency
a t d if fe re n t concentrations a t 25° fo r un i-un iva len t
e le c tro ly te s
D - DConcentration ; w o
1—I
o
KC1 NaCl LiCl HC1
0.001 0.010 0.008 0.007 0.032
0.002 0.032 0.026 0.024 0.083
0.004 0.088 0.075 0.069 0.175
0.008 0.207 0.186 i 0.174 0.304
0.016 0.396 0.375 0.362 0.462
0.032 O.636 0.624 0.615 0.666
0.064 0.935 0.930 0.927 0.947
0.128 1*337 1.335 1.333 1.341
0.256 1.895 1.895 1.894 1.898
0.512 2.683 1.682 1.682 2.684
1.024 3.794 3.793 3.793 3.861!
discrepancy may be a ttr ib u te d to the A value being too low: the c a l
cu la tions were based on A = 24-7*8, as found by S iv e rtz . D&iken and
co-workers [36] obtained / \ q = 248*85, which i s id e n tic a l to the sum of
the generally accepted values fo r the lim itin g conductance of the separa te
ions (OH = 198*8 and Na+ = 50.l ) . I f the l a t t e r value fo r A i s used
in ca lcu la tin g , the increased conductances fbr NaOH w ill be s im ila r to
those observed fo r KNO and KC1 solutions* TMb , i t may be argued,
favours A = 248*85, as found by Darken e t a!* ra th e r than the lower ovalue found by S ivertz and h is associates*
Ho?/ever, the e ffe c t of these increases in conductance, so fa r as
the determ ination of rea c tio n ra te s from high-frequency conductance measure
ments are concerned, i s of no importance.
Table 1 ,5 shows the d ie le c tr ic constant a t various concentrations of
e le c tro ly te so lu tions and at 50 Mc/s compared with th a t of the pure solvent.
The increases are o f th e order of magnitude expected fo r the concentration
and frequency considered [ 37]» However, rec en tly decreases in the d ie lec
t r i c constant w ith increasing concentration have been reported [ 22,23,38-41] 9
in con trad ic tion to the p red ic tions of the Debye-Falkenhagen equation. The
p osition regarding these r e s u l ts i s f a r from c le a r , and fu rth e r in v estig a
tio n s are necessary. However, i t i s su ff ic ie n t fo r the purpose of the
present work to p o in t out th a t these increases or decreases, as the case may
be, are n eg lig ib le as regards th e i r e ffe c t upon r a te determ inations in
ionic solutions*

-4 7 -
PART I I
APPLICATIONS OF THE HIGH-FREQUENCY OSCILLATOR TO THE
STUDIES OF THE ALKALINE HYDROLYSES OF METHYL ACETATE
AND SOME CYCLIC CARBONATES

-4 8 -
INTRODUCTION
Kempa and Lee[2] studied the a lk a lin e hydrolyses of ethylene
and propylene carbonates by t i t r a t io n as in Skrabal and Baltadschiewa*s
s tud ies of open-chain e s te rs [ 42] • The hydrolysis proceeds very rap id ly
even in d ilu te so lu tions of caustic a lk a l i , and fo r th is reason i t was
studied in sodium carbonate so lu tio n s . The overa ll reac tio n was
represented by the follow ing equation:
CH -CL CH -OHI ^ ,C=0 + OH- + H,0 _ > I + Hcor . . . (2.1)CH -O CH -OH J
Using the hydrolysis constant K’ of the carbonate ions in w ater,2-
CCL + Ho0 — HCO~ + OfT . . . (2.2)
they expressed the hydroxyl ion concentration thus
fOH-1 = K' . . . (2.3)[HC0“ ]
The ra te equation, th e re fo re , was given by
= k0H K< [ ester] [C03~ ] . . . (2.4)d t [ hco: ]
where x i s the amount of e s te r hydrolysed and kQ^ the ra te constant
fo r e s te r hydro lysis. I t was assumed th a t i f the i n i t i a l concentrations of
the e s te r and the sodium carbonate were equal, equation (2,4) could be
w ritten
dx = k g K! (a - x )^ • • • (2.5)d t x
where a i s the i n i t i a l concentration.
-4 9 -
The exten t of the reac tion was determined by measuring the
change in carbonate ion concentration a t in te rv a ls by t i t r a t i o n . The
ra te constants fo r the a lk a lin e hydrolyses of ethylene and propylene—1 -1carbonates were found to be 48.8 and 17.8 l.m ole min re sp ec tiv e ly
a t 25°C.
Independently Pohoryles and h is assoc ia tes [ 3 ] , using e s se n tia lly
the same procedure stud ied the ra te s of the hydrolyses of ethylene and
propylene carbonates in potassium carbonate so lu tions a t 0°C. They-1 -1obtained ra te constants of 10.2 and 5*0 l.m ole . min fo r ethylene and
propylene carbonates re sp ec tiv e ly . Without a knowledge of the energy
of a c tiv a tio n fo r these hydrolyses i t i s impossible to make any d ire c t
comparison between the two se ts of va lues. Therefore, i t seemed desirab le
f i r s t to confirm the ra te constant by a d if fe re n t method, and to evaluate
the energy of a c tiv a tio n fo r the hydrolyses.
Prelim inary in v es tig a tio n s in the present work cast some doubt
upon the v a lid i ty of the assumption involved in obtaining equation (2*5)*
I t was evident th a t the bicarbonate ions produced as a by-product in the
e s te r hydrolysis would in te r fe re w ith the equilibrium (2 .2 ) | equation (2.5)
made no allowance fo r th i s . However, i f the bicarbonate ion thus produced
were to be converted to the carbonate ion by the use of excess caustic
a lk a l i , Bruson and Hooper [43] suggest th a t the reac tion becomes "immeasurably
fa s t" .

-5 0 -
With the development of the high-frequency conductance technique
i t i s possib le to follow these reactions by the automatic recording of
instantaneous conductance measurements, The in v es tig a tio n has been
extended to other cyclic carbonates, namely, vinylene and o-phenylene
carbonates, the hydrolyses of which have not h ith e rto been studied .
- 5 1 -
SEGTIQN 1
Apparatus
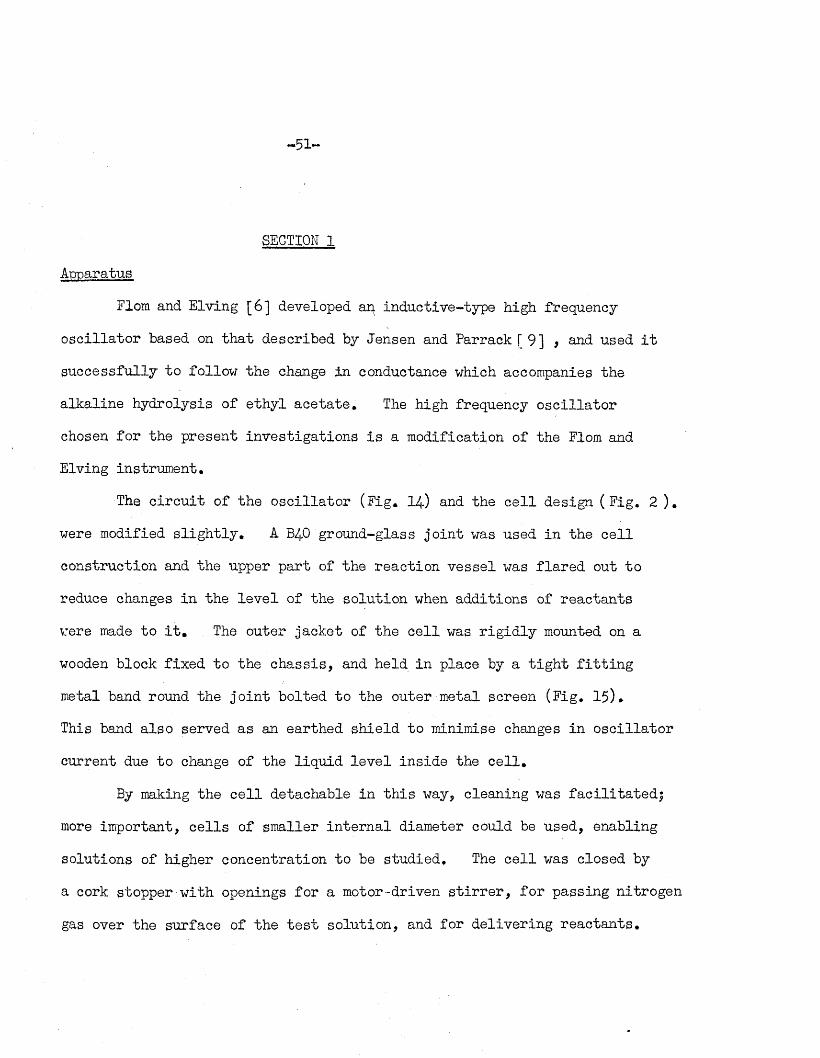
Flom and Elving [6] developed an inductive-type high frequency
o s c i l la to r based on th a t described by Jensen and Parrack [9 ] , and used i t
successfu lly to follow the change in conductance which accompanies the
a lka line hydrolysis of e th y l a ce ta te . The high frequency o s c illa to r
chosen fo r the p resent in v estig a tio n s i s a m odification of the Flom and
Elving instrum ent.
The c ir c u i t of the o s c illa to r (Fig. 14) and the c e l l design (F ig . 2 ) .
were modified s l ig h tly . A B40 ground-glass jo in t was used in the c e l l
construction and the upper p a rt of the reac tio n vesse l was f la re d out to
reduce changes in the le v e l of the so lu tion when additions of reac tan ts
were made to i t . The outer jacket of the c e l l was r ig id ly mounted on a
wooden block fixed to the chass is , and held in place by a t ig h t f i t t i n g
metal band round the jo in t bolted to the outer metal screen (F ig . 15)*
This band a lso served as an earthed sh ie ld to minimise changes in o s c i l la to r
current due to change of the liq u id le v e l in side the c e l l .
By making the c e l l detachable in th is way, cleaning was f a c i l i ta te d ;
more im portant, c e l ls of sm aller in te rn a l diameter could be used, enabling
so lu tions of higher concentration to be stud ied . The c e l l was closed by
a cork stopper-w ith openings fo r a motor-driven s t i r r e r , fo r passing n itrogen
gas over the surface of the t e s t so lu tio n , and fo r de livering re a c ta n ts .

F1G.14 OSCILLATOR CIRCUIT DIAGRAM
40 kr —
801
4-5 turns of th ick Cu-
2 w i re
2M
100 pf 100 pf
i § 2 . 5 mHJ0 M A
r e c o r d e r
6C5
►1.5k50k
0-1 k$ ik
4- _-3 0 0 V

-5 3 -
FIG-15 HIGH FREQUENCY OSCILLATOR
- 5 4 -
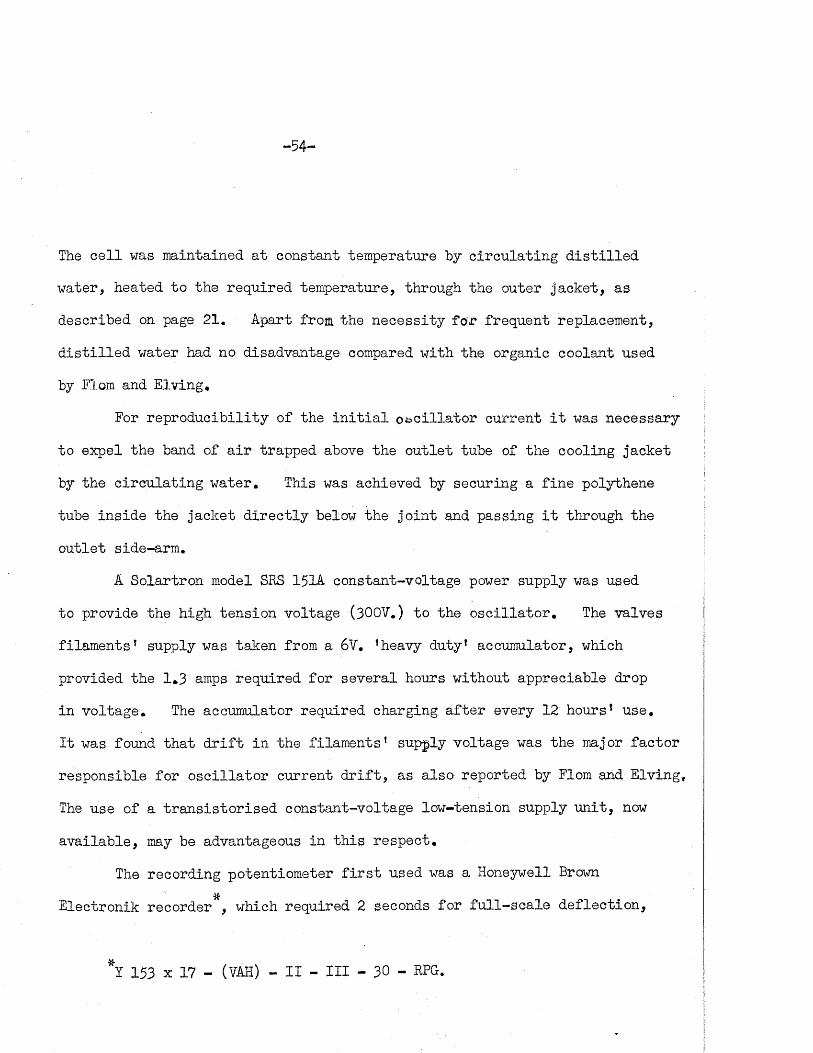
The c e l l was maintained a t constant tem perature by c irc u la tin g d i s t i l l e d
water, heated to the required tem perature, through the outer jack e t, as
described on page 21. Apart from the n ecessity fo r frequent replacement,
d i s t i l l e d water had no disadvantage compared w ith the organic coolant used
by Flom and Elving,
For rep ro d u c ib ility of the i n i t i a l o s c i l la to r cu rren t i t was necessary
to expel the band of a i r trapped above the o u tle t tube of the cooling jacket
by the c irc u la tin g w ater. This was achieved by securing a f in e polythene
tube in side the jacke t d ire c tly below the jo in t and passing i t through the
o u tle t side-arm .
A Solartron model SRS 151A constant-voltage power supply was used
to provide the high tension voltage (300V.) to the o s c i l la to r . The valves
f ilam en ts1 supply was taken from a 6V. ’heavy duty’ accumulator, which
provided the 1.3 amps requ ired fo r severa l hours without appreciable drop
in vo ltage . The accumulator required charging a f te r every 12 hours’ use.
I t was found th a t d r i f t in the filam en ts’ supply voltage was the major fa c to r
responsible fo r o s c i l la to r cu rren t d r i f t , as a lso reported by Flom and Elving,
The use of a tra n s is to r is e d constant-voltage low-tension supply u n it , now
av a ilab le , may be advantageous in th is re sp ec t.
The recording potentiom eter f i r s t used was a Honeywell Brown■ft
E lectronik recorder , which required 2 seconds fo r fu l l- s c a le d e flec tio n ,
*Y 153 x 17 - (VAH) - I I - I I I - 30 - RPG.
- 5 5 -
and had 0-5 and 0-55 mV. ranges. L ater, fo r the f a s te r hydrolysis of*
vinylene carbonate a f a s te r model was used which required only ^ second
fo r fu l l- s c a le d e flec tio n and had a range of 0-10 mV, The voltage measured
was developed by the o s c i l la to r anode curren t across a 1000 ohm r e s is to r
(R^ in F ig. 14).
The complete apparatus was housed in a therm ostated room, pro tec ted
from draughts and mechanical v ib ra tio n s . Earthed copper sheets were placed
under the apparatus and each u n it was earthed to the copper sheets | th is
arrangement reduced the e ffe c t of stray-capacitances to a minimum. A block
diagram of the apparatus i s shown in F ig, 16 .
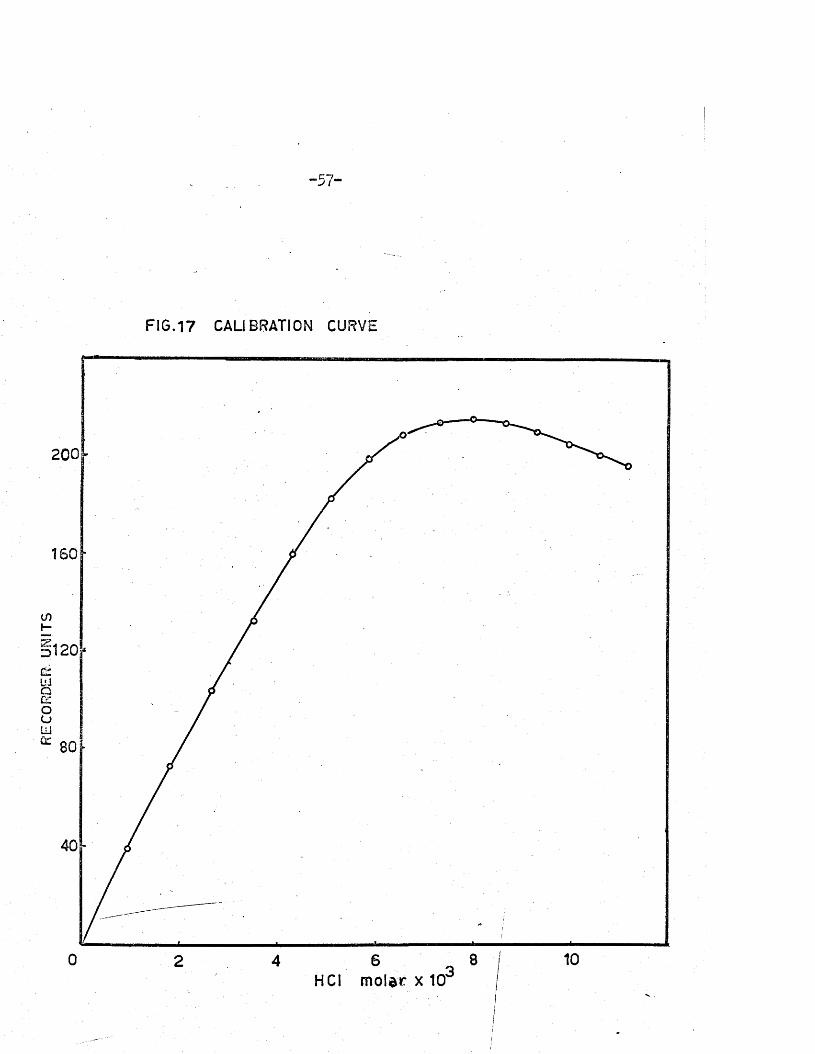
The in strum en t1 s response to conductance change was p ra c tic a lly
lin e a r over the concentration range 0-0,01 M NaOHj a c a lib ra tio n curve i s
shown in Fig. 17 *
Operating Procedure
The o s c i l la to r and recorder were switched on a t le a s t #ne hour
before measurements were made. The capacitance d ia ls C^, C^, and were
adjusted in tu rn u n t i l minimum o s c illa to r anode current (M^=20 ma.) was
obtained. The re s is ta n c e s R and R^q of the balancing c ir c u i t (which
produced a curren t in opposition to the o s c i l la to r curren t so th a t the
ammeter always recorded the d ifference between them) were adjusted to
give zero on Conductivity water (100 m l.) was then placed in the c e l l ,
the c irc u la tin g pump s ta r te d , and the water allowed to come to temperature
* 153 x 16 - (VBH) - I I - I I I - 116.

-5 6 -
z
lO3
CCsCL<
ozUJ3cjUJa:u_xoX
u.O2<oco<
uo_JmtocniZ
RECO
RDER
. U
HIT
S
FIG.17 CALIBRATION CURVE
•O—
200
160
801-
8 I 100 . 6 , HCI molar x 10'
42
-5 6 -
equilibrium under a slow stream of n itrogen gas. The zero of the recorder
was se t to th is i n i t i a l o s c i l la to r cu rren t, approximately 0.2 M, sodium
hydroxide so lu tio n (2-3 nil, depending on the concentration required) was
then added from a p ip e tte , and the span and zero con tro ls on the recorder
were adjusted such th a t the to ta l conductance-change, corresponding to
th a t occurring during a complete hydro lysis, occupied the maximum chart
width, A su ita b le chart speed was se lec ted (y~2 inches per minute) and
the ch art-d riv e switched on* When a v e r t ic a l l in e was traced by the pen,
a known volume of e s te r so lu tio n , of the concentration requ ired , was
quickly in je c te d from a 2-ml, syringe p ip e tte , and the change in
conductance w ith time traced ,
Flom and Elving used the reverse procedure, adding the a lk a li
so lu tion to a so lu tio n of the e s te r in the c e l l . This technique was used
in the runs marked with a s te r isk s {Table 2 ,9 ); i t appears th a t the method
o faddition does not a ffe c t the r e s u l ts , in the re la t iv e ly slow hydrolysis
of methyl ace ta te in sodium hydroxide so lu tion . However, in the hydrolyses
of cyclic carbonates, which are re la t iv e ly f a s t , an appreciable p a rt of
the reac tio n may take place before the add ition of the base, and the
response of the recording potentiom eter to i t , are completed; add itions
of e s te r to base were used in these determ inations.
- 5 9 -
SECTION 2
Measurements of the Rate of Alkaline Hydrolysis of Methyl Acetate
As a te s t of the s u i ta b i l i ty of the apparatus fo r measuring reac tio n
ra te s , the a lk a lin e hydrolysis of methyl ace ta te was studied at several
temperatures*
Previous values published fo r the ra te constant of a lka line hydrolysis
of methyl ace ta te in water a t 25°C range from 9*66 to 11*7 l.mole^.min"*'*'
[44-49 ]. With the exception of Walker.s[48]» the methods used fo r the
determ ination o f the ra te constant were e s se n tia lly the samej known amounts
of reac tio n mixture were discharged at noted times in to measured q u a n titie s
of acid , and the excess acid t i t r a t e d . Walker used a conductance-bridge
method in which the ra te of change in conductance of the reac tion mixture
was taken as a measure of the ra te of replacement of hydroxyl ions by
aceta te ions*
No values were found in the l i te r a tu r e fo r the ra te constant of the
a lkaline hydrolysis of methyl ace ta te in water a t temperatures o ther than
25°, and consequently no ca lcu la tio n o f the energy of a c tiv a tio n has been
made. In th is work the o vera ll change in conductance of so lu tions of methyl
aceta te and sodium hydroxide, a t 20°, 25°, 30°, and 35°G, was followed using
the high frequency o s c i l la to r with the fa s t recording potentiom eter.
Experimental
A f a i r ly pure sample of methyl ace ta te was r e d i s t i l le d and the fra c tio n
bo iling a t 57*0°C was co llec ted . The sodium hydroxide so lu tion was prepared
- 60-
by decanting 50i° c lea r sodium hydroxide so lu tion in to a non-attackable
p la s tic b o ttle and d ilu tin g to N5 with carbonate-free conductiv ity water*
The so lu tion was standardised with AnalaR potassium hydrogen ph thala te and
stored in the p la s t ic b o ttle f i t t e d with a soda-lime guard-tube* Carbonate-
free conductiv ity water was used fo r the preparations of a l l so lu tio n s .
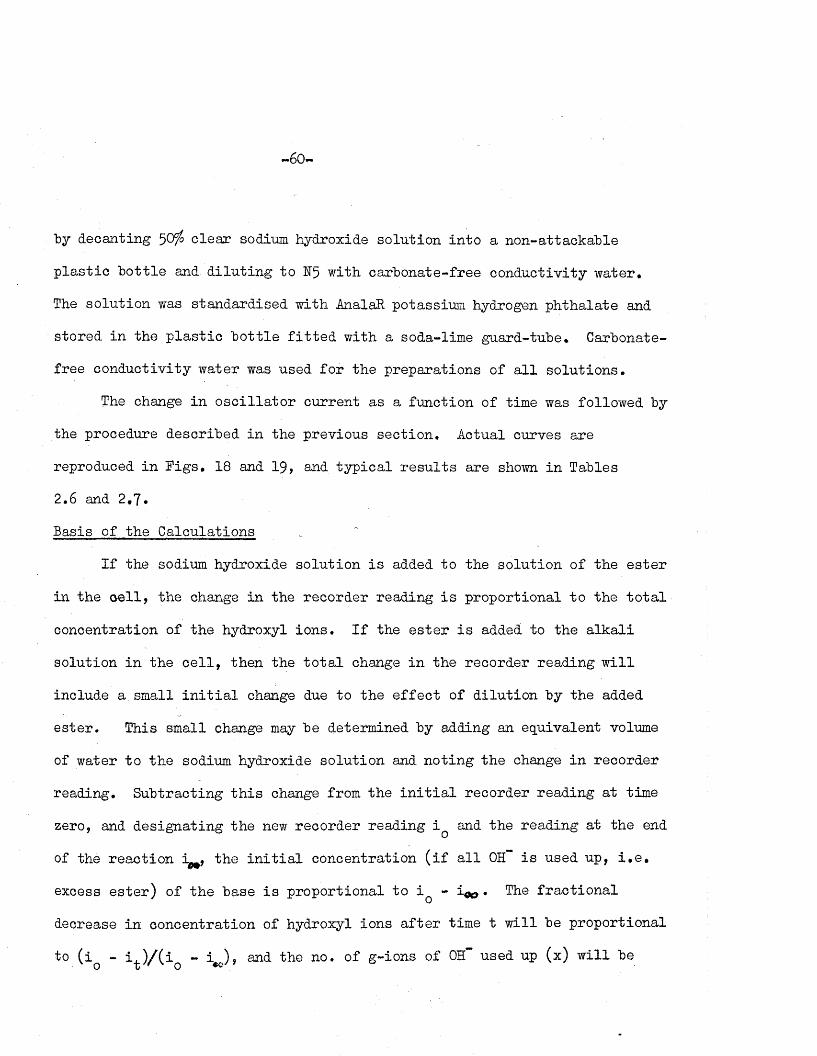
The change in o s c i l la to r current as a function of time was followed by
the procedure described in the previous sec tion . Actual curves are
reproduced in P igs. 18 and 19, and ty p ic a l re s u l ts are shown in Tables
2.6 and 2*7.
Basis of the C alculations
I f the sodium hydroxide so lu tion i s added to the so lu tion of the e s te r
in the c e l l , the change in the recorder reading i s proportional to the to ta l
concentration of the hydroxyl ions. I f the e s te r i s added to the a lk a li
so lu tion in the c e l l , then the to ta l change in the recorder reading w ill
include a small i n i t i a l change due to the e ffe c t of d ilu tio n by the added
e s te r . This small change may be determined by adding an equivalent volume
of water to the sodium hydroxide so lu tion and no ting the change in recorder
reading. Subtracting th is change from the i n i t i a l recorder reading a t time
zero, and designating the new recorder reading i Q and the reading a t the end
of the reac tio n i^ , the i n i t i a l concentration ( i f a l l OH i s used up, i,e*
excess e s te r) of the base i s p roportional to i Q - i * , . The f ra c tio n a l
decrease in concentration of hydroxyl ions a f te r time t w ill be proportional
to ( i - i , ) / ( i - i ) , and the no. of g-ions of OH" used up (x) w ill beo t f o
CDo CDCA
OCO
oCO
FIG- 18 M E T H Y L
o
oso -~r ■S 4 ;
i . . . . . . . . . . i -1.......r
CDCO oLO
oNT
O-CQ-
o( " '3
O

oCO
FIG -19 METHYL
L ! [ e s t e roh-O
OvD
OvO
OLOo
o00o00
o(No
oo
oo
UO <1
Oi. i
u/

-63-
equal to
o r ^ b • • • ( 2 . 5 )
where <r = ( i - i ^ ) / ( i - i^ ) and h i s the i n i t i a l hydroxyl ions concentration .
S ubstitu tion fo r x in the second-order ra te equation
t = h 3 0 3 _ log . M b _ e _ # Mk(a-b) (b-x)a
(where a i s the i n i t i a l concentration of the e s te r and k the ra te
constant) gives
t = log . . , (2 .7)k (a-b) 1-c r
l - r - f yA p lo t of log J '3 versus time should give a s tra ig h t lin e1- 6-
2 ^0^of slope . Second order p lo ts are shown in f ig s , 20 and 21k(a-b)
and the ra te constants fo r the a lka line hydrolysis of methyl ace ta te a t
20°, 25° ? 30° , and 35°C recorded in tab les 2 ,8-2 .11 ,

FIG
.20
SEC
ON
D-O
RD
ER
PLOT
FO
R TH
E AL
KALI
NE
HYD
ROLY
SIS
OF M
ETHY
L A
CET
ATE
- 6if-
00
o
SO I
120
160
200
240
280
320
SE
CO
ND
S

orb/
a
- 65-
\\
. 1 !\ :
' 1
FIG .21 SECOND-ORDER PLOT FOR THE ALKALINE HYDROLYSIS
OF METHYL. ACETATE AT 30° C
0.4
0.3b1
0.2t
2401800 12060
SECONDS

-66-
Results
TABLE 2.6
Alkaline Hydrolysis of Methyl Acetate a t 25°0
[ EaOH ] = 0,00364M [ CH-COOCHj » 3 3 0.03042M
t■
sec
qr , , .
Xt , !!!
h-1 1 -cra log
l - cr
\ 0 92.0.....
0 -
30 83*0 0,155 O.O65
:r 6o 2 f 16,0 0,275 0*124
: 83 11.0 0,361 0.174
■ 105 i- 6 6 ,5 0,438 0.227
120 64,0 O.48I 0.259
150 59.5 0.558 O.325
195 54.0 0.653 ' O.424
!: 240 50.0 0.722 0.516
i! 278 47.0 0,773 0.602
; 330 44.O 0.825 0.711
Oo 33.8 1.000 —
-1 -1Rate constant kO£-0 = 0,186 l.mole • sec2 5 ____________________
- 6 7 -
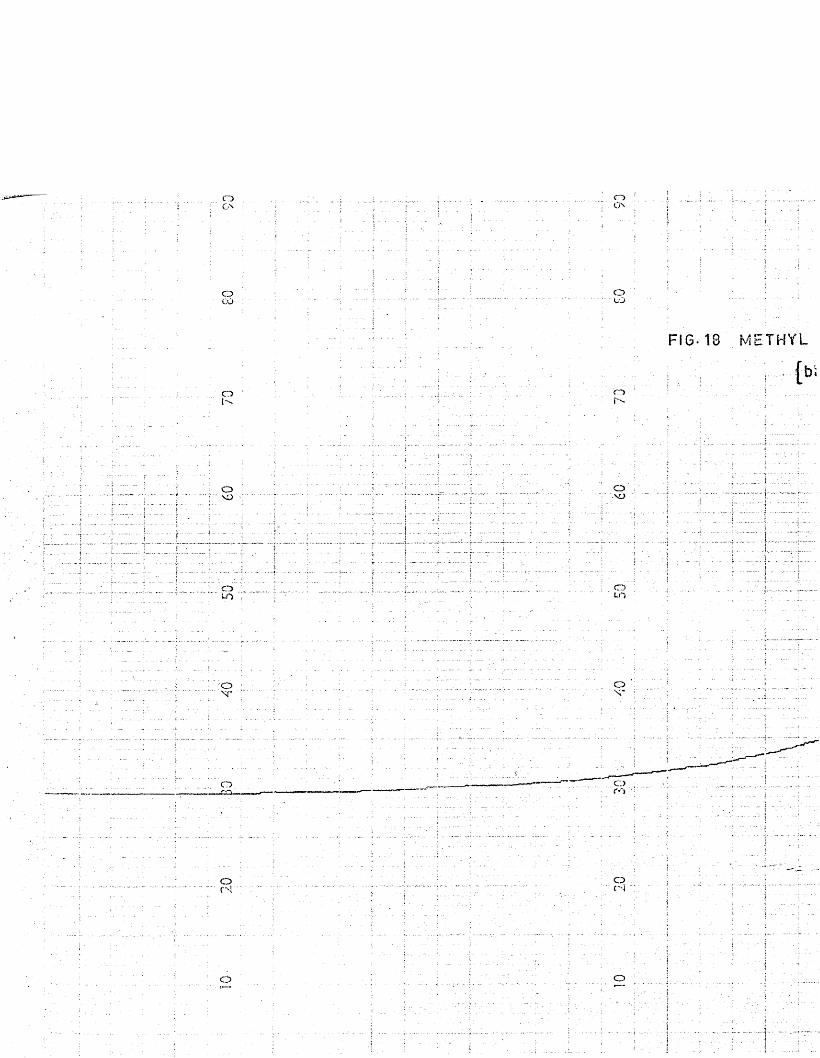
TABIE 2,7
Alkaline Hydroylsis of Methyl Acetate a t 30°C.
[RaOH] = 0 . 00501M ; ch3cooch3] = 0 . 02155M
t sec' f 1
1t c rb
, 1- cr a log1- cr
0 86.0 ,0 -
15 77.0 0.107 0.038
: 30 70.0 0.191 0.072
: 45 64.0 0.262 0.105' 60 59.3 0.318 0.133
75 55-0 0.369 0.16190 50.8 0.419 0.191
- 105 47.5 0.458 0.217120 44.0 0.500 0.247
" 135 41.0 0.536 0.275; 150 38.2 0.569 0.304
165 35.6 0.600 0.333180 33.5 0.625 0.358
195 31.0 0.655 0.390: 210 29.0 0.679 O.4I 8;■ 240 25.5 0.720 0.474: 270 22.5 0.756 0.529
CO 2.0 1.000
Rate constant = 0.258 l.m ole \ sec
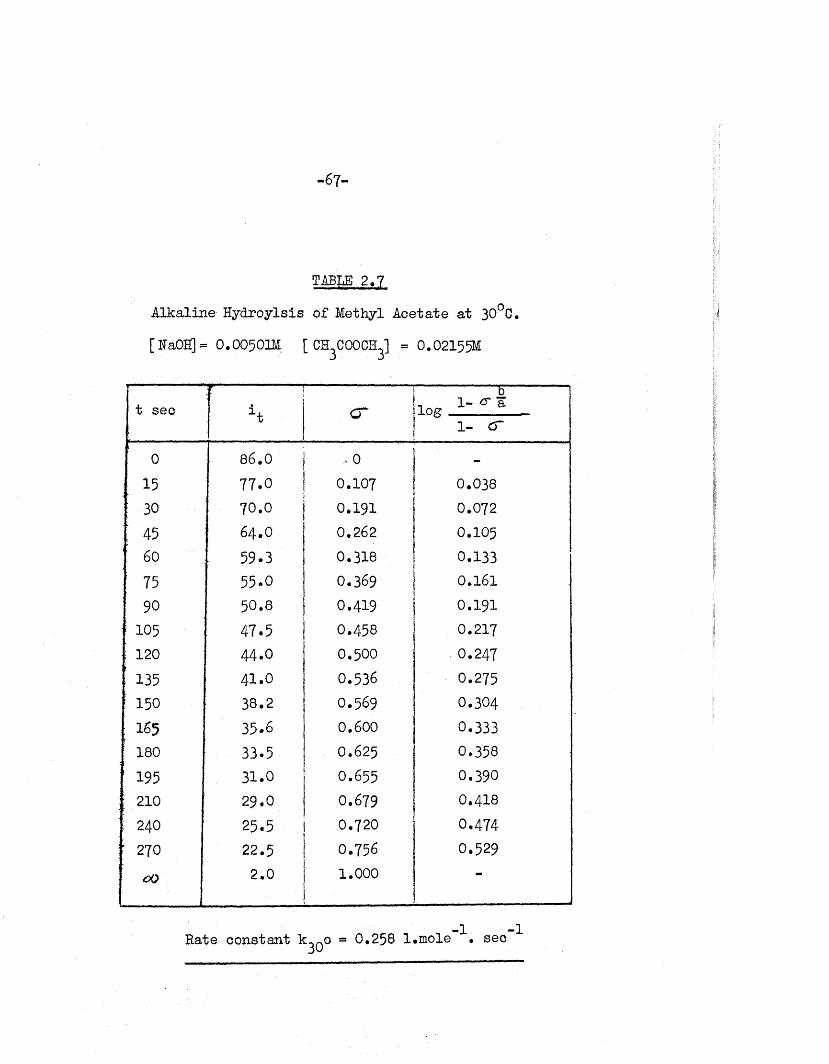
-68-*
TABLE 2.8
Rate Constant fo r the Alkaline Hydrolysis
of Methyl Acetate a t 20°C.r ----------
Rum•
[ KaOH] [ CH.COOCHJ 3 3 Rate constant
1 0.00427 0.02788 0.1352 0.00422 0.03096 0.1313 O.OO574 0.03391 0.1384 0.00427 0.02835 0.137
Mean k QO = 0*135 ~ 0.003 l.mole~^. sec”^
TABLE 2.9
Rate Constant fo r the Alkaline Hydrolysis of Methyl Acetate at 25°C •
Runi
[HaOH]------ ------ T
[ CH^OOCH^ J1
Rate constant
1* 0.00384 0.03844 0.1872* 0.00364 0.03070 0.1903* 0.00364 0.03070 0.1854* 0.00364 0.03042 0.1845* 0.00364 0.03042 0.1866* 0.00249 0.02565 0.1857 O.OO495 0.02460 0.1888* 0.00364 0.03042 0.186
+ -1 -1 Mean kot-0 = 0.186 - 0.001 l.m ole • sec25
(*)Runs in which the "base was added to the e s te r so lu tion in the c e l l .

-69-
TABLE 2,10
Rate Constant fo r the Alkaline Hydrolysis
of Methyl Acetate a t 30°C.
Run f HaOH] [CH3COOCH3] Rate constant
1 0.00501 0.02155 0.2582 0.00427 0.03058 0.2543 0.00428 0.02648 0.2504 0.00496 0.02234 0.2625 0.00501
------
0.02187 0.2 68
4- -©1 -1Mean k ^ o = 0.259 ~ 0.007 l.m ole . sec
TABLE 2.11
Rate Constant fo r the Alkaline Hydrolysis
of Methyl Acetate at 35°C.
.............. " " ' I.
Run [HaOH] [ CH3COOCH3l
........................
Rate constant
1 0.00427 0.02929 0.3532 0.00427 0.02745 0.3643 0.00428 0.02614 0.358
+ -1 -1 Mean k-,co « 0.358 - 0.004 l.mole . sec 35 ....................................... ...................

-70-
Energy of A ctivation
The dependence of the ra te constant on the tem perature fo r simple
reactions i s given by the Arrhenius equation
l& k a - ______ + constant • • • (2 .8 )R.T
where Ea i s the energy of ac tiv a tio n , R the Gas constant "*1 •*1(1.987 ca l.deg” .mole” ) and T i s the temperature in degrees absolu te.
The energy of ac tiv a tio n was calcu lated by applying the method of
le a s t squares to the data given in Table 2.12. The Arrhenius p lo t of
log k against l/T i s shown in P ig . 22,
TABLE 2.12
Dependence of the Rate Constant of the Alkaline
Hydrolysis of Methyl Acetate on Temperature
Temperature Rate constant k log k
ooCM 0.135 -0.8697: 25° 0.186 -0.7305 .
30° 0,259 -O.5867
35° 0.358 -O.446I ;
A
+ -1 Energy of A ctivation = 11.7 ~ 0.1 k .cal.m ole

LOG
k
- 71-
FIG. 2 2 INFLUENCE OF TEMPERATURE ON THE RATE OF
ALKALINE HYDROLYSIS OF METHYL ACETATE
- 0 7
3453403353 3 0325
1 / T X1CJ5
- 7 2 -
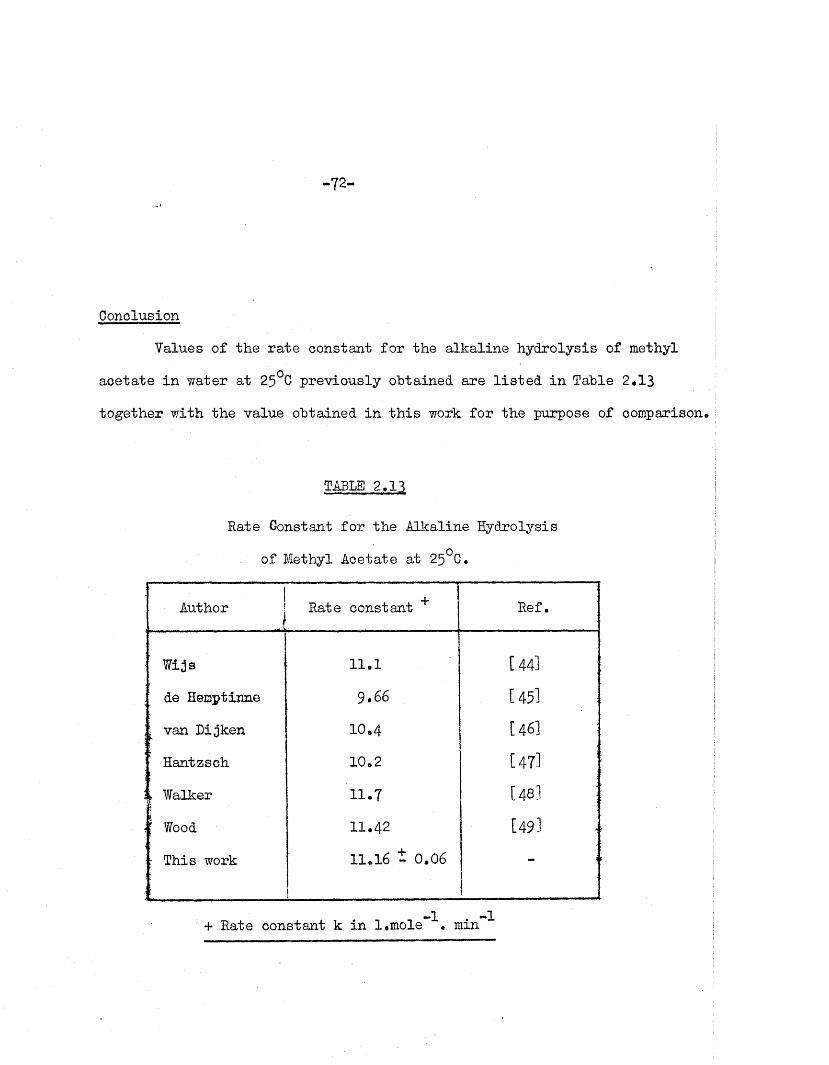
Gonolusion
Values of the ra te constant fo r the a lka line hydrolysis of methyl
ace ta te in water a t 25°C previously obtained are l is te d in Table 2*13
together with the value obtained in th is work fo r the purpose of comparison*
TABLE 2*13
Rate Constant fo r the Alkaline Hydrolysis
of Methyl Acetate a t 25°C.
IAuthor | +Rate constant Ref.
Wijs 11.1 i—i
&
' de Hemptinne 9.66 [45l
i van L ijken 10*4 [ 46]
Hantzsch 10*2
rt2 1—
1
l Walker 11.7 1—1
4*. CO
[ Wood 11.42 1—1
VOj
- This work 11*16 t 0.06
i
— i
+ Rate constant k in l.mole \ min ^
-73-
+ -1 The value of 11.7 - 0*1 k.cal.m ole found fo r the energy of
ac tiv a tio n fo r the a lk a lin e hydrolysis of methyl ace ta te in water i s of the
expected magnitude. The a lka line hydrolysis of ethy l ace ta te proceeds by
the same mechanism (bim olecular acyl-oxygen bond-fission 33^,2) but a t a•“1 -1slower sp e c ific ra te (k * 6*5 l#mole~ .min~ )? the energy of a c tiv a tio n
fo r th is reac tio n i s close to the value found fo r methyl acetate* Two
values fo r the energy of a c tiv a tio n fo r the a lka line hydrolysis of e thy l
aceta te in water have been reported in the l ite ra tu re ? Smith and Olsson1[50] found E = 11.3 k .cal.m ole , and more recen tly Halonen £51]» using
improved t i t r a t i o n technique in determining the ra te constants, found-1E « 11.8 k .cal.m ole . a
SECTION 3
The Alkaline Hydrolyses of Ethylene and Propylene Carbonates
I t has already heen pointed out th a t I f hydrolysis i s c a rried out with
the concentration of the e s te r in excess of, or equal to , th a t of the base
NaOH, the carbonate-bicarbonate equilibrium i s p rogressively displaced to
the bicarbonate side as more and more hydroxyl ions are used up* In order to
determine the ra te -co n stan t fo r the hydro lysis, the r a t io of the
instantaneous concentrations of and HCO^*must be known*
I t was thought th a t a hydrogen electrode pH-meter attached to the
recording potentiom eter might be su itab le fo r measuring the r a t io of these
concentrations provided th a t the hydrogen electrode responded s u f f ic ie n tly
rap id ly t the changing pH. This technique was not e n tire ly sa tis fa c to ry
(see Appendix l ) . A lte rn a tiv e ly the hydrolysis might be ca rried out in
barium hydroxide so lu tio n . In th is case the bicarbonate produced in the
hydrolysis i s converted to the carbonate and removed by p re c ip ita tio n as
BaCO # Prelim inary in v es tig a tio n s showed th a t i t was possib le to obtain ra te
constants fo r the hydrolysis of ethylene carbonate under these conditions
(see Appendix 2 ). However, the p re c ip ita tio n of barium bicarbonate as
w ell as barium carbonate, and th e ir f in i t e s o lu b i l i t ie s in water, introduced
an uncerta in fa c to r in to the in te rp re ta tio n of the conductance measurements.
For these reasons i t was decided to carry out the hydrolyses in
re la t iv e ly concentrated so lu tions of sodium hydroxide so th a t there should
be an excess of 0H*“ present at the completion of hydro lysis, and to follow

-75 -
the change in hydroxyl ion concentration conductim etrically . This lim its
the accuracy somewhat, since only a f ra c tio n of the to ta l 0H~ i s used up,
and the change in conductance i s thus much sm aller than th a t obtained in the
hydrolysis of methyl a ce ta te .
In s u f f ic ie n tly high hydroxyl ion concentration the overa ll reac tio n
may be represented by the equation
R - CH - Ch R - CH - OH| o - o + 20H" — | + cor". . . . ( 2 .9)
ch2 - o x ch2- OH J
Where R i s H -(ethylene) or CH^-(propylene). The conversion of the cyclic
carbonate to the corresponding glycol was found to be quan tita tive? i f the
e s te r were in excess, the amount of g lycol produced was equivalent to the
i n i t i a l concentration of the base, and i f the base were in excess, the
amount of clycol was equivalent to the i n i t i a l concentration of the cyclic
carbonate (see experimental g lycol-det em anation ).
I f the rate-determ in ing step involves the a ttack of one OH on a
neu tra l molecule, and i f x i s the amount of glycol produced a f te r time t ,
2x w ill be the amount of hydroxyl ions used up, since the bicarbonate-
carbonate conversion i s very rap id in excess a lk a li hydroxide. The ra te
equation, th e re fo re , becomes
~ = k (a-x) (b-2x) . . . (2.10)dt
where k i s the ra te constant, a and b are the i n i t i a l concentrations of the
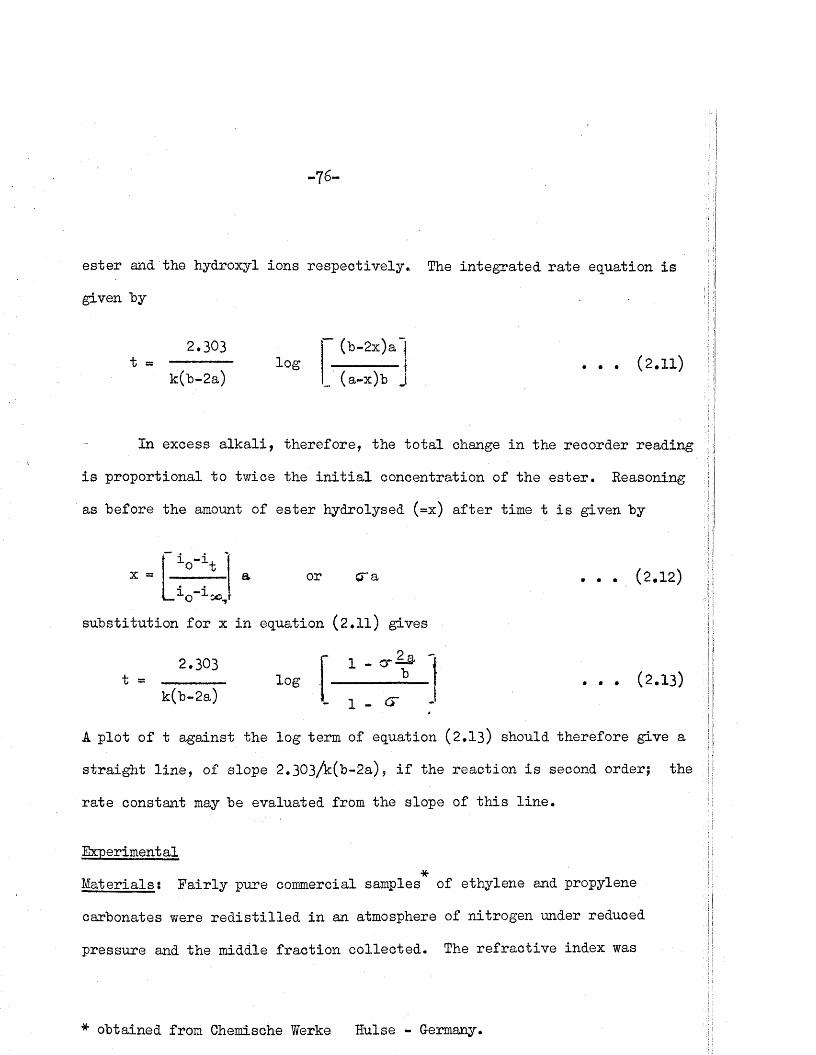
-76-
e s te r and the hydroxyl ions resp ec tiv e ly . The in teg ra ted ra te equation is
given "by
2.303
k(b-2a)log
(b-2x)a j ((a-x)b J
. . . (2.11)
In excess a lk a l i , there fo re , the to ta l change in the recorder reading
i s p roportional to twice the i n i t i a l concentration of the e s te r . Reasoning
as before the amount of e s te r hydrolysed (=x) a f te r time t i s given by
’-o-H1 - 1 , , •— O
or era . . . ( 2. 12)
su b s titu tio n fo r x in equation (2 .1 l) gives
i - c r 2log
2.303t =
k(b-2a)
1 - cr-=-& b . . . (2.13)
! - &
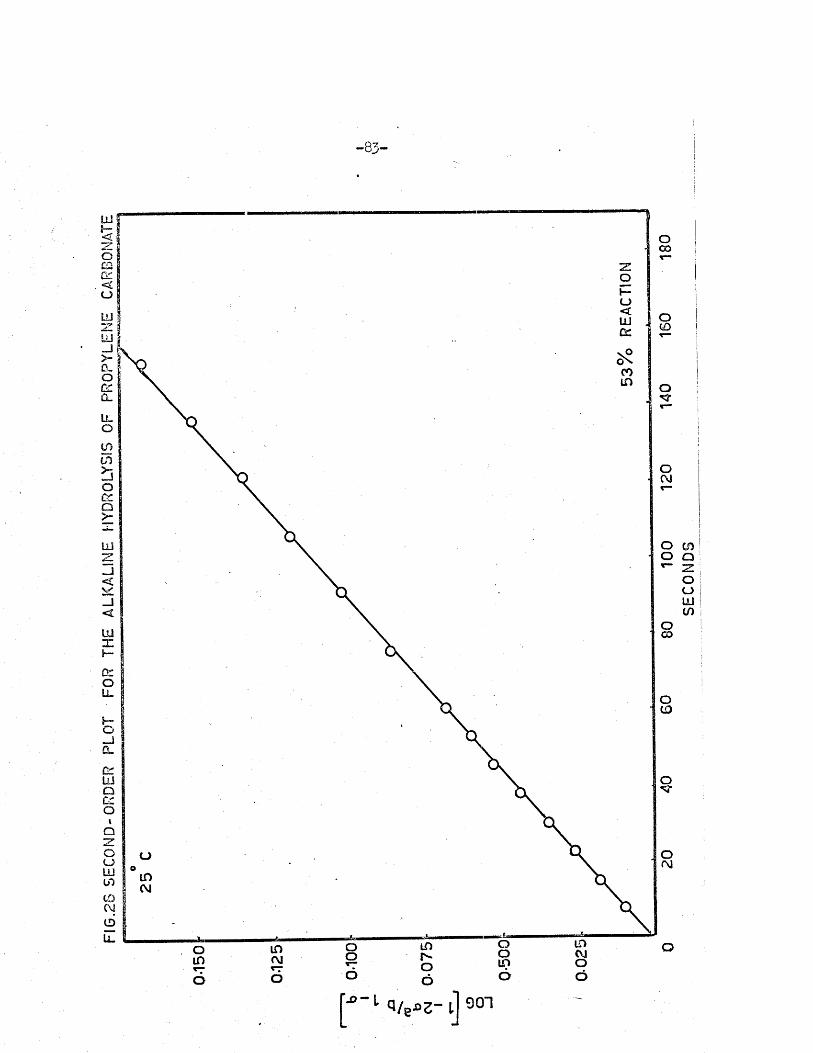
A p lo t of t against the log term of equation (2.13) should therefo re give a
s tra ig h t l in e , of slope 2 . 303/k (b -2a ) , i f the reac tio n i s second orderj the
ra te constant may be evaluated from the slope of th is l in e .
*Experimental
M aterials s F a ir ly pure commercial samples of ethylene and propylene
carbonates were r e d i s t i l le d in an atmosphere of n itrogen under reduced
pressure and the middle fra c tio n co llec ted . The re fra c tiv e index was
* obtained from Chemische Werke Hulse - Germany.
- 7 7 -
measured at 40° fo r ethylene carbonate (experim ental n ^ = 1.4198) l ite ra tu re
value = 1.4199 [ 1 ] ) and at 25° fo r propylene carbonate (experimental
njip = 1.4212, l i t e r a tu r e value n ^ = 1.4212 [ l ] ) . Solutions of 0.15M
were prepared by d isso lv ing the appropriate amount of e s te r in water
(lOO ml)? the ra te s of the water hydrolyses of ethylene and propylene carbon
a te s were known to be very slow [ 2 ] . The preparation of sodium hydroxide
so lu tion has been described elsewhere (p.59)* Carbonate-free conductivity
water was used in the preparation of a l l so lu tio n s .
Glycol Determination (product analysis)
A q u a lita tiv e te s t was f i r s t ca rried out to confirm the production
of ethylene and propylene glycols from the a lka line hydrolysis of the
corresponding e s te r s . Mixtures of ethylene carbonate and sodium hydroxide,
and propylene carbonate and sodium hydroxide were heated under re f lu x , ^
upon ex trac tio n w ith e ther and separation yielded ethylene glycol b.p,198°C
and propylene glycol b .p . 189°C resp ec tiv e ly . The amounts of glycol
produced were determined using the method described by Fleury and Lange
[52] • Two se ts of glycol determ inations were ca rried outs in the f i r s t
a known amount of sodium hydroxide was added to a so lu tion containing an
excess of carbonate e s te r in w ater, and in the second a known amount of the
carbonate e s te r was added to an excess of aqueous sodium hydroxide solution*
-78-
Procedure ;
( i ) To about 0.001 mole of the e s te r in water (50 ml.) 0.1M sodium
hydroxide so lu tion (5 ml.) was added, and the mixture allowed to stand fo r
20 min. fo r the completion of the hydro lysis. The so lu tion was then
buffered a t pH 4*8, with ace tic acid and sodium ace ta te so lu tion , and a
q uan tity of standardised potassium periodate so lu tion in excess of th a t
required to oxidise the glycol was added. 30 min. were allowed fo r the
completion of the oxidation, and then the pH of the so lu tion was increased
to 7 by the add ition of so lid sodium bicarbonate (4 g .) Excess potassium
iodide was then added, and the iodine l ib ra te d by the excess periodate was
t i t r a t e d with standard arsenious oxide so lu tio n . The end-point was located
by means of fre sh s ta rch so lu tion added as the end-point was approached.
The weight of glycol found was 99*1$ (mean of four estim ations) of the
th e o re tic a l value calcu lated from the i n i t i a l concentration of the sodium
hydroxide used.
( i i ) The same procedure as ou tlined above was followed except th a t ,
in th is case, the i n i t i a l sodium hydroxide concentration was four times
th a t of the e s te r . The weight of glycol found was 100.2$ (mean of four
estim ations) of the th e o re tic a l amount calcu lated from the i n i t i a l
concentration of the e s te r used.
Hate Determ ination.
The rate? of hydrolyses of ethylene and propylene carbonates were
followed by the procedure described on page 55 • concentration
- 7 9 -
of the sodium hydroxide was four to eigh t times th a t of the e s te r . Typical
curves of the o s c i l la to r current change with time during the hydrolysis are
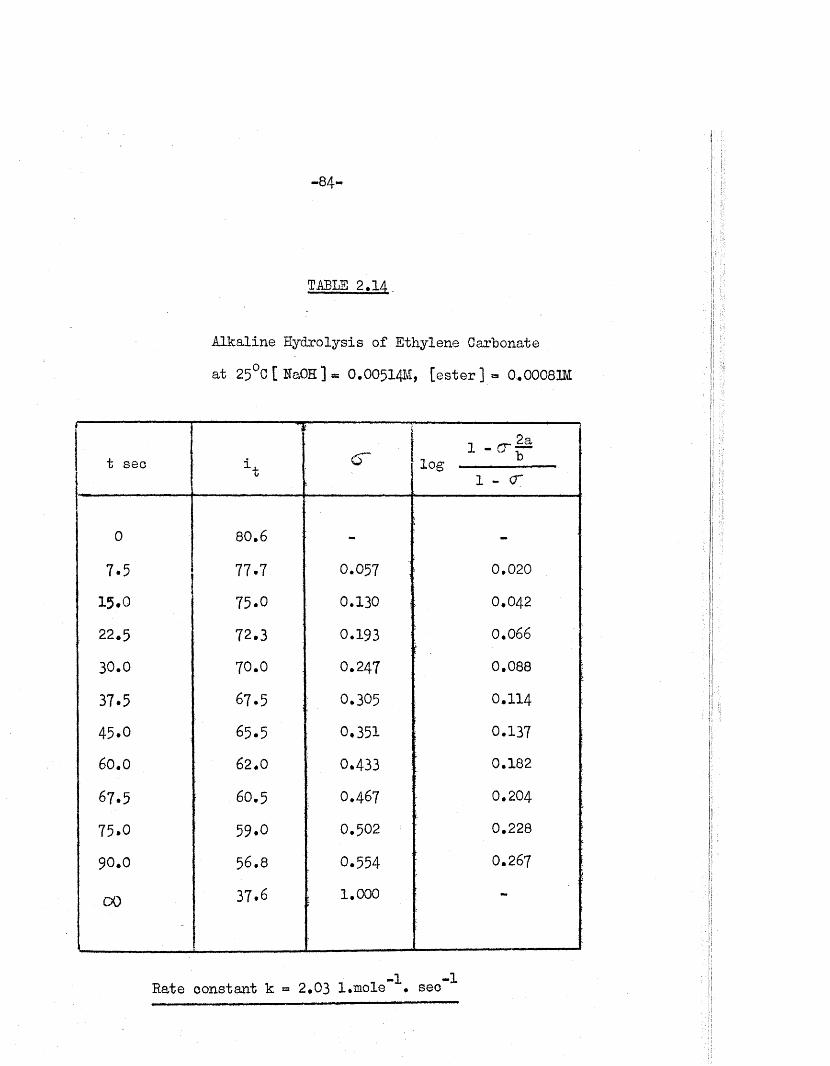
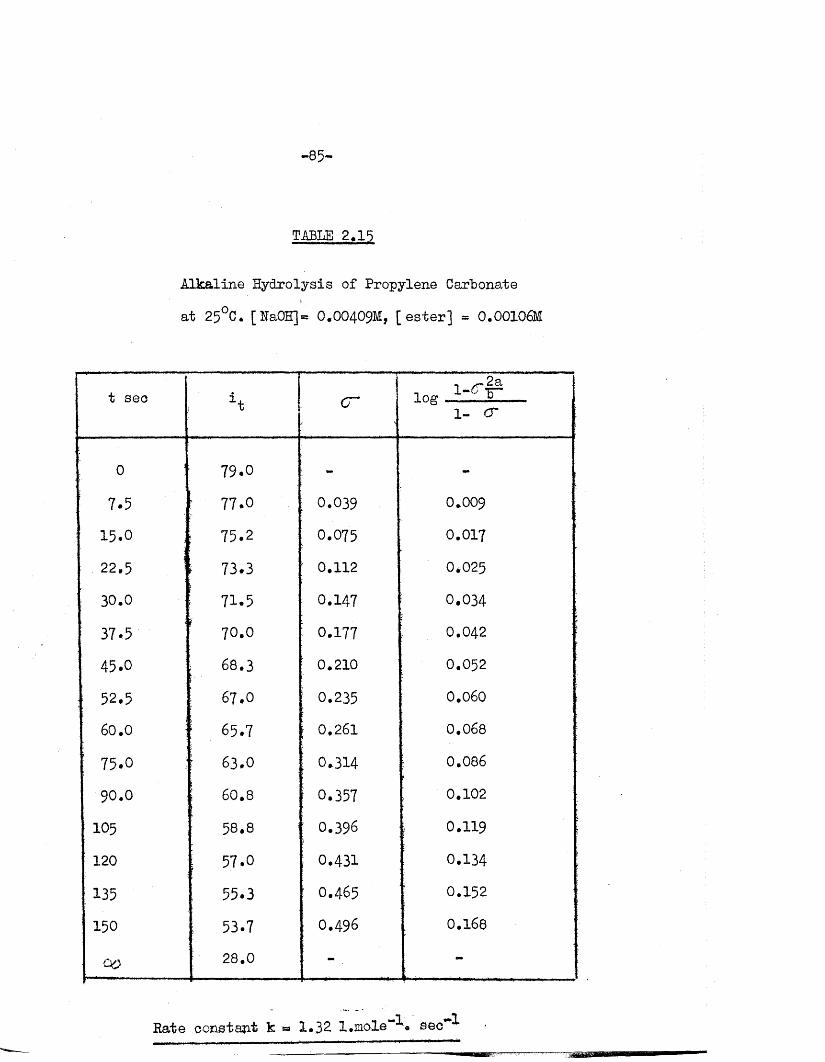
reproduced in F igs. 23 and 24. Typical re s u lts are recorded in Tables 2.14
and 2.15* Hydrolyses were ca rried out a t 15°, 25° and 35°. The mean values
of the ra te constants obtained a t these temperatures are l i s te d in Tables
2.16 - 2.21 and the re levan t energies of ac tiv a tio n , calcu lated as fo r the
hydrolysis of methyl ace ta te (equation 2.8 S e c .l) , are given in Table 2.22.
Further the s a l t e ffe c t on the ra te of hydrolysis of ethylene carbonate at
25°C was in v estig a ted by following the reac tio n in the presence of varying
concentrations of potassium ch lo ride .
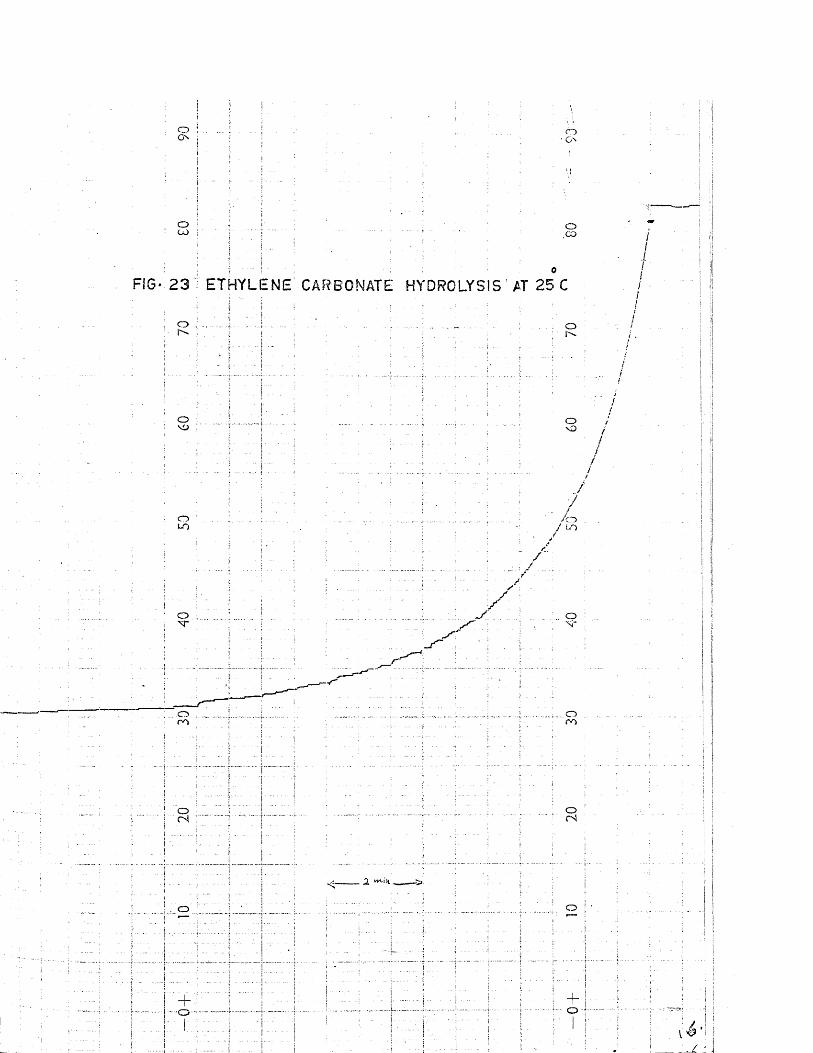
; ■ ! 0 ETHYLENE CARBONATE HYDROLYSIS AT 25 C

oCO
oCO
oh'sor->
FIG. 24. PROPYl
oLO
oo
ro
OcN
oo
oo

UJ
uuU J
IT )
U
in
OJ co
f ' V W i ] s ° ' '
SEC
ON
DS
FIG
.26
SEC
ON
D-O
RDER
PL
OT
FOR
THE
ALKA
LINE
HY
DROL
YSIS
OF
PR
OPY
LENE
CA
RBO
NATE
- 83-
g o
c_>oUJ
o
CD
o
o
o
-84-
TABLE 2.14
Alkaline Hydrolysis of Ethylene Carbonate
a t 25°C [ HaOH ] = O.OO5I 4M, [ e s t e r ] * 0,0008m
t sec *t< r
i - c r | a1^0. 1 0 . .
1 - <r
0 80.6 -•
7.5 77.7 0.057 1 0.020
15.0 75.0 0.130 0.042
22.5 72.3 0.193 0.066\
30.0 70.0 0.247 0.088
37.5 67.5 ; 0.305 0.114
45.0 65.5 0,351 0.137
60.0 62.0 0.433 0.182
67.5 60.5 O.467 0.204
75.0 59.0 0,502 0.228
90.0 56.8 0.554 0.267
00 37.6
........ ........
i 1,000
Rate constant k « 2.03 l.mole \ sec
-85
TABLE 2.15
Alkaline Hydrolysis of Propylene Carbonate
a t 25°C. [ NaOH] = O.OO409M, [ e s t e r ] = 0.00106M
t sec i t ! c r J log 1 ^ 1- cr
0 79.0 - -
77.0 0.039 0.009
15.0 75.2 0.075 0.017
22.5 1i 73.3 ; 0.112 0*025
: 30.0•
71.5f
0.147 0.034j
37 «5 70.0 : 0.177 0.042
45.0 \ 68.3 ' 0.210 0.052
;; 52.5 j 67.0 0.235 0.060
60.0 I 65.7 | 0.261 0.068
75.0 r 63.0 : 0.314 0.086
90.0 ; 60.8 I 0.357 0.102
105 58.8 : 0.396 0.119
120 57.0 0.431 0.134
135 55.3 0.465 0.152
150 ; 53.7 0.496 0.168
28.0 -
*•"1 **1Rate oonstant k « 1*32 l.mole*- « sec**
-86-
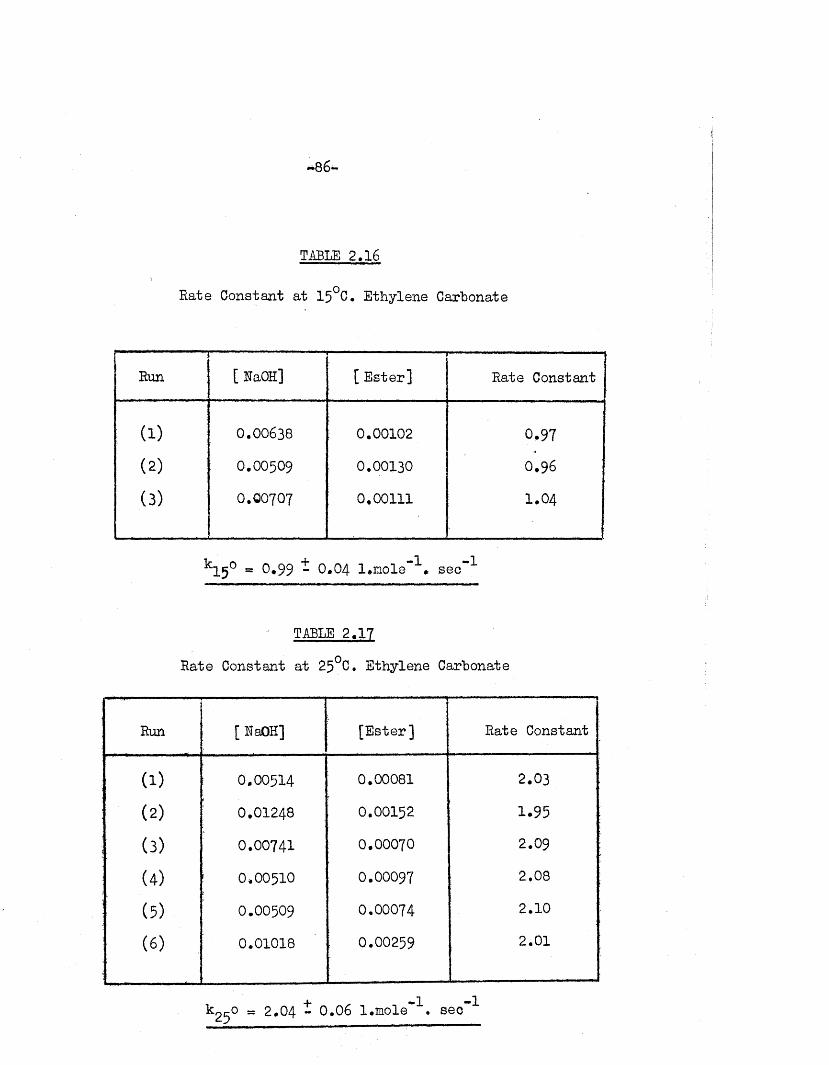
TABLE 2.16
Rate Constant a t 15°C. Ethylene Carbonate
■r ' Run
1—— .
[ RaOH] [ E ster] Rate Constant
( i ) 0.00638 0.00102 0.97
(2) 0.00509 0.00130 0,96
(3) 0.00707 0.00111 1.04
k15° a 0,99 - 0.04 l.m ole"^. sec"'*’
TABLE 2.17
Rate Constant a t 25°C. Ethylene Carbonate
Run [RaOH] [E ste r] Rate Constant
(1) 0.00514 0.00081 2.03
(2) 0.01248 0.00152 1.95
(3) 0.00741 0.00070 2.09
(4) 0.00510 O.OOO97 2.08
(5) 0.00509 0.00074 2.10
( 0 0.01018 0.00259 2.01
+ -1 -1k ^ o « 2.04 - 0.06 l.mole . sec
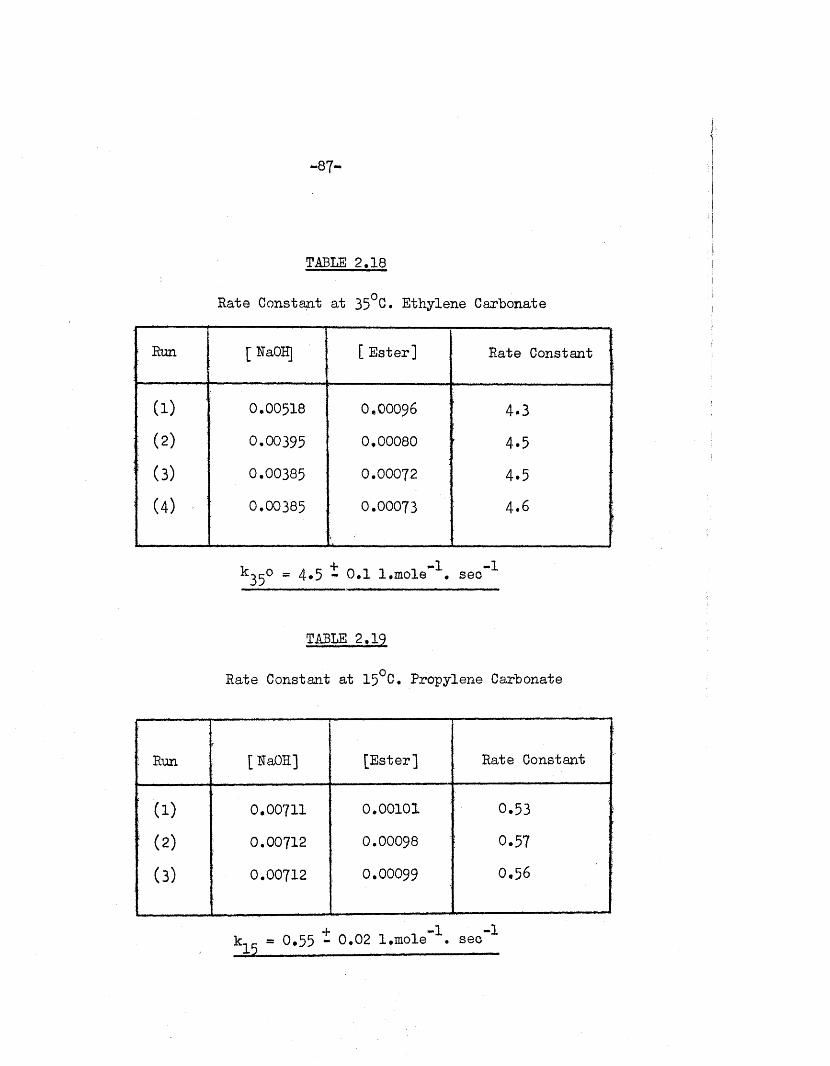
TABLE 2.18
Rate Constant at 35°C. Ethylene Carbonate
! Run [ RaOH] [ E ster] Rate Constant
(1) 0.00518 O.OOO96 4-3
( 2 )0.00395 0,00080 4.5
! (3) 0.00385 0.00072 4.5
(4) 0.00385 0.00073 4*6
k35o « 4.5 t o . l l.mole*1. sec"1
TABLE 2.19
Rate Constant a t 15°C. Propylene Carbonate
: Run [ RaOH] [E ster] Rate Constant
; t o 0.00711 0.00101 0.53
! ( 2) 0.00712 0.00098 : 0.57
( 3) 0.00712 0.00099 0.56
- 8 8 -
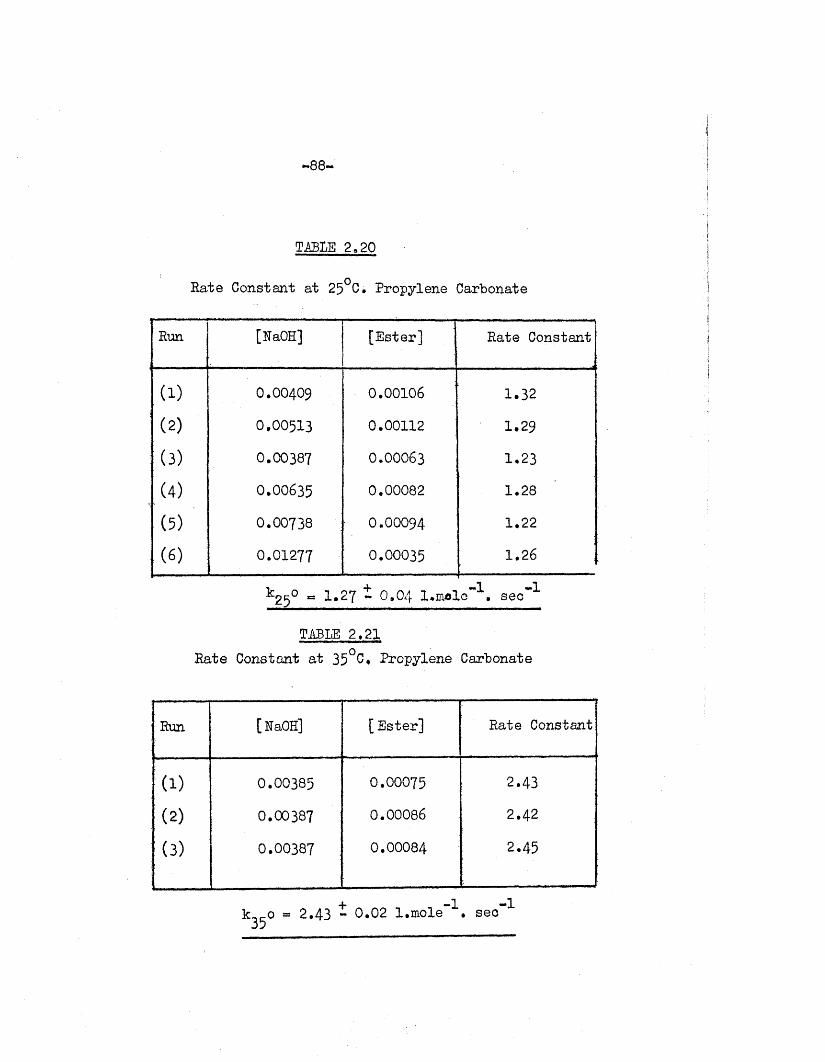
TABLE 2.20
Rate Constant at 25°C. Propylene Carbonate
Run [NaOH] [E ster] Rate Constant
( 1) O.OO4O9 0.00106 1.32
( 2) 0.00513 0.00112 1.29
(3) 0.00387 0 .00063 1.23
(4) 0.00635 0.00082 1.28
(5) 0.00738 O.OOO94 1.22
( 6) 0.01277 0.00035 1.26
^25° « 1.27 - 0.04 l.m ole"1. sec"1
TABLE 2.21Rate Constant a t 35°C. Propylene Carbonate
Run [RaOH] [ E ster] Rate Constant
(1) 0.00385 0.00075 2.43
( 2) 0.00387 0.00086 2.42
(3) 0.00387 0.00084 2.45
k .-o = 2.43 - 0.02 l.m ole”1 . sec"1 3?
LOG
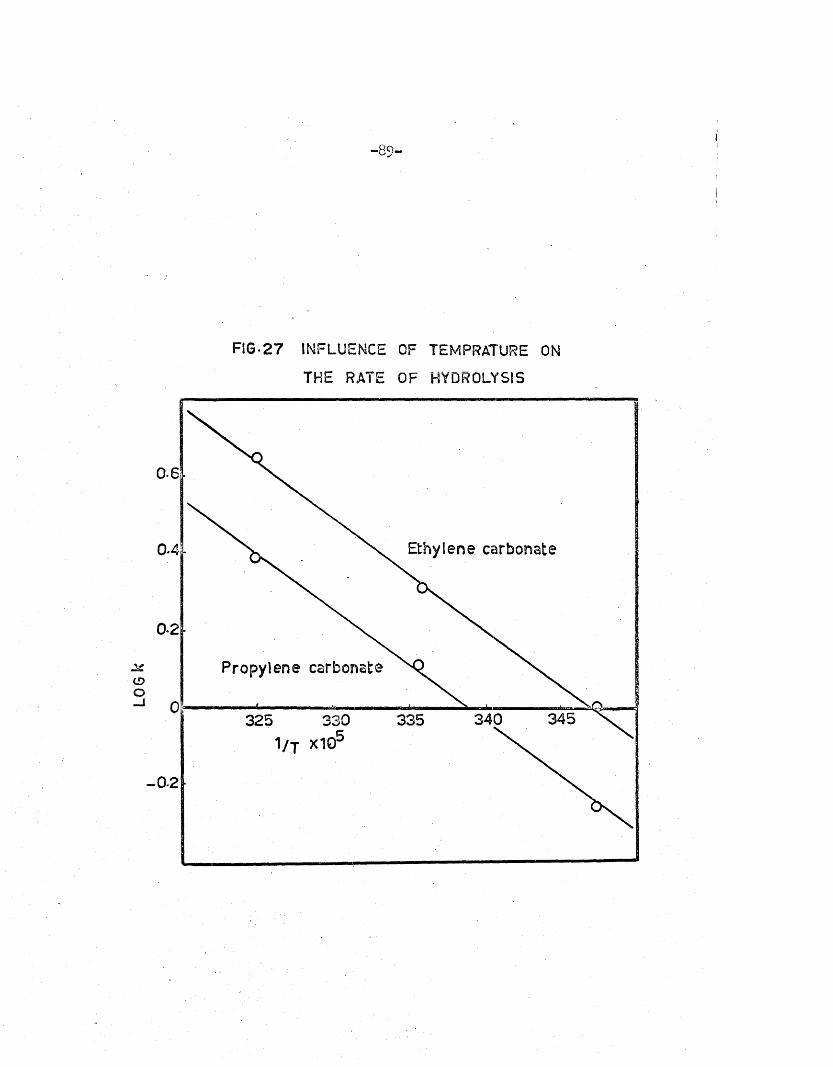
k- 89-
FIG*2 7 INFLUENCE OF TEMPRATURE ON
THE RATE OF HYDROLYSIS
0-6
Ethylene carbonate0.4
0*2 •
Propylene carbonate
345340330 3353251 / j X1Q'
- 0-2
a. O4**
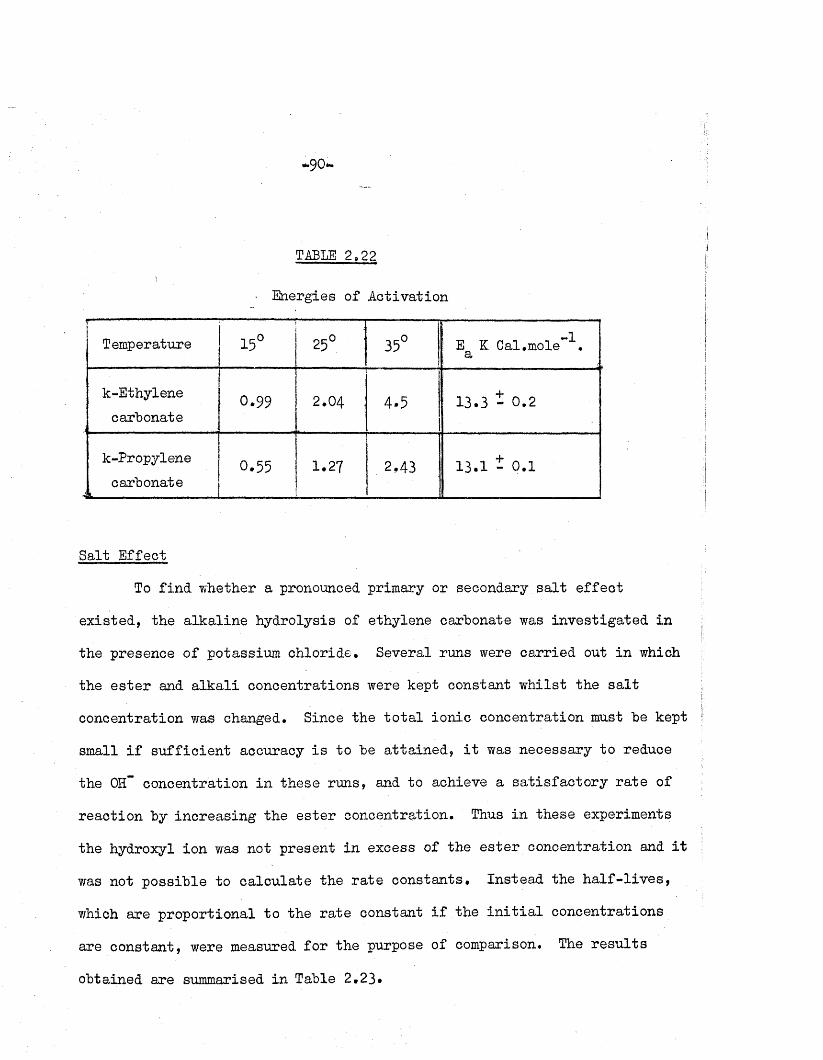
TABLE 2,22
■ Energies of A ctivation
Temperature 15° 25° : 35° E K Cal.mole”! a
k-Ethylenecarbonate
0.99 2.04 4.5 13.3 - 0 . 2
k-Propylenecarbonate
4--------- -------------0.55 1.27 2.43 13.1 - 0.1
Salt E ffect
To fin d whether a pronounced primary or secondary s a l t e ffe c t
ex isted , the a lka line hydrolysis of ethylene carbonate was investiga ted in
the presence of potassium chloride* Several runs were carried out in which
the e s te r and a lk a li concentrations were kept constant w hilst the s a l t
concentration was changed. Since the to ta l ion ic concentration must he kept
small i f su ff ic ie n t accuracy i s to he a tta in ed , i t was necessary to reduce
the 0H“ concentration in these runs, and to achieve a sa tis fa c to ry ra te of
reaction hy increasing the e s te r concentration. Thus in these experiments
the hydroxyl ion was not present in excess of the e s te r concentration and i t
was not possib le to ca lcu la te the ra te constants. Instead the h a lf - l iv e s ,
which are p roportional to the ra te constant i f the i n i t i a l concentrations
are constant, were measured fo r the purpose of comparison. The re s u lts
obtained are summarised in Table 2.23.
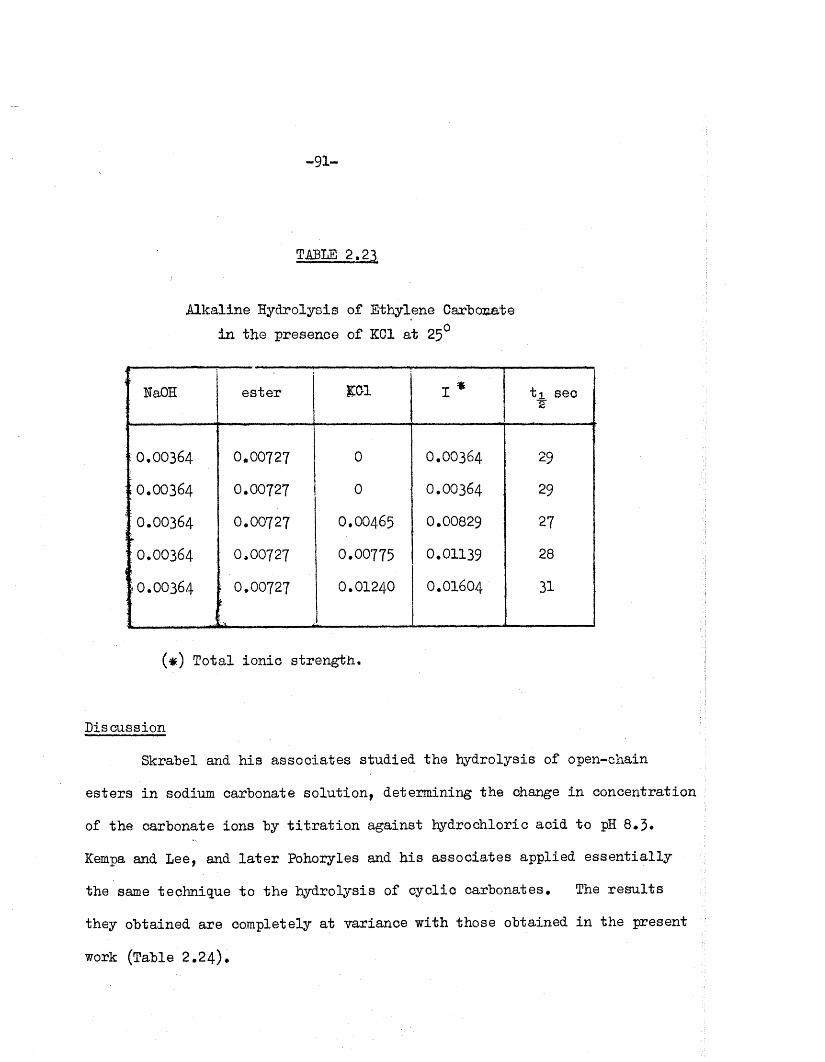
-9 1 -
TABLE 2.23
Alkaline Hydrolysis of Ethylene Carbonate in the presence of KC1 a t 25°
HaOH e s te r KOI I * t i sec 2
:0,00364 0.00727 0 O.OO364 29
; 0.00364 0.00727 0 O.OO364 29
: 0.00364 0.00727 O.OO465 0.00829 27
;0.00364 0,00727 0.00775 0.01139 28
*0.00364
i .........- ;
? 0.00727t
0.01240 O.OI6O4 31
(#) T otal ion ic s treng th .
Discussion
Skrahel and h is assoc iates studied the hydrolysis of open-chain
e s te rs in sodium carbonate so lu tion , determining the change in concentration
of the carbonate ions by t i t r a t i o n against hydrochloric acid to pH 8 .3 .
Kempa and Lee, and l a t e r Pohoryles and h is associates applied e sse n tia lly
the same technique to the hydrolysis of cyclic carbonates. The re s u lts
they obtained are completely a t variance w ith those obtained in the present
work (Table 2 .24 ).

-9 2 -
Two possible explanations may be put forward fo r these differences*
F ir s t , th a t the hydrolysis in a lk a li carbonate so lu tions takes place by
a d iffe re n t mechanism from th a t occurring in a lk a li hydroxide so lu tions;
th is seems u n like ly in view of the mechanism of the hydrolysis which w ill
be discussed la ter* Second, th a t the technique used by Skrabal in the
stud ies of open-chain e s te rs i s inapplicab le to the hydrolysis of cyclic
carbonates* Therefore, i t may be worthwhile to examine the assumptions
made in ca lcu la tin g the ra te constants*
The ra te of hydrolysis as expressed by equation (2,4)> which was*
used by Kempa and Lee, and Pohoryles et a l , , c lea rly depends on the
concentration of the bicarbonate ions. In the case of the open-chain
e s te rs studied by Skrabal the bicarbonate ions were produced e n tire ly from
the hydrolysis of the carbonate ions, w hilst in the hydrolyses of cyclic
carbonates * fo r every hydroxyl ion used up there w ill be produced two
bicarbonate ions* one from the carbonate hydrolysis as in the stud ies of
Skrabal and one from the cyclic carbonate hydrolysis (see equation 2 .1 ) .
In su b s titu tio n fo r the bicarbonate ion concentration in the in teg ra ted
ra te equation, the previous authors do not use the true bicarbonate ion
concentrations.
F«r the equilibrium in equation (2 .2) to be maintained, the hydroxyl
ion concentration must be sm aller than th a t assumed; the denominator of
* In the paper published by Pohoryles et a l . [3 j th e ra te equation was given erroneously as
. a k TT Kf [ ester! [ HCO~ 1 ,d t 0H 5 5
which should have been the same as equation (2 .4 ); subsequent equations based on the above were a lso in co rrec t.
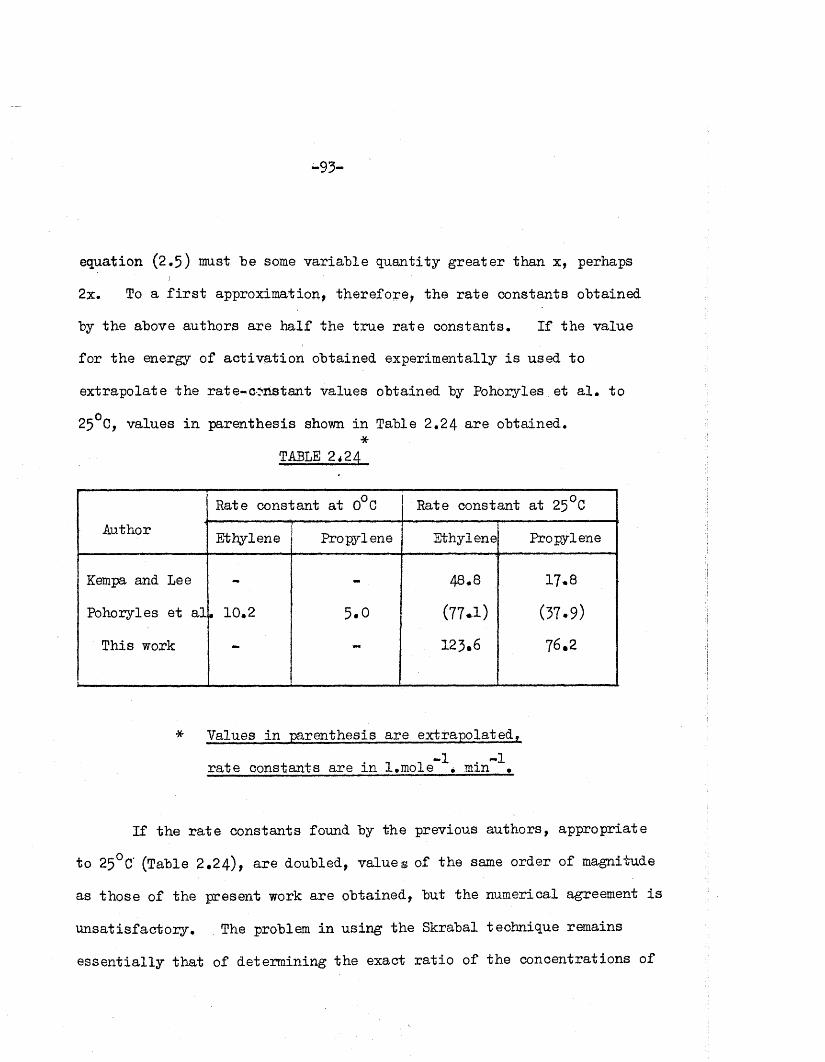
- 93-
equation (2.5) must be some v ariab le quan tity g rea te r than x, perhapsj
2x. To a f i r s t approximation, th ere fo re , the ra te constants obtained
by the above authors are h a lf the tru e ra te constants. I f the value
for the energy of ac tiv a tio n obtained experim entally i s used to
ex trapolate the ra te -co n stan t values obtained by Pohoryles et a l . to
25°C, values in parenthesis shown in Table 2.24 are obtained.*
TABLE 2<24
AuthorRate constant a t 0°C Rate constant a t 25°C
Ethylene Propylene Ethylene Propylene
Kempa and Lee - - 48.8 17.8
Pohoryles e t a l . 10.2 5.0 (7 7 a ) (37.9)
This work
.........
- - 125.6 76.2
* Values in parenthesis are ex trapo la ted9
ra te constants are in l.m ole \ min
I f the r a te constants found by the previous authors, appropriate
to 25°C (Table 2 .24), a re doubled, v a lu es of the same order of magnitude
as those of the present work are obtained, but the numerical agreement is
u n sa tis fac to ry . The problem in using the Skrabal technique remains
e sse n tia lly th a t of determining the exact r a t io of the concentrations of
-9 4 -
carbonate to bicarbonate. Further, the method of t i t r a t i o n involvesJ
approximations th a t may not be wholly ju s t i f ia b le ; th is i s discussed
fu rth e r in appendix 3*
I f the hydrolysis is to be studied in d i lu te a lk a li carbonate
so lu tions, a p ro fita b le l in e of in v es tig a tio n , as an a lte rn a tiv e to the
t i t r a t io n method, may be to follow the change of pH spectrophotom etrically
by using a su ita b le in d ic a to r , m-Cresol purple, fo r example (pH 7*6 yellowr-
9*2 purple) whose change of o p tica l density w ith pH a t a su itab ly chosen
wavelength can be accura te ly determined* may be added to the reaction
mixture and the o p tic a l density measured a f te r known in te rv a ls . U ntil
such unambiguous measurements are made to determine the exact r a t io of
carbonate to bicarbonate concentrations, re s u lts obtained by the Skrabel
technique remain doubtful. The values obtained in the present work-1 —1(2,04 and 1,27 1* mole . s e c . fo r ethylene and propylene carbonates
respec tive ly ) may, th e re fo re , be taken as the more re l ia b le ra te constants
fo r the a lk a lin e hydrolyses of the two cyclic e s te rs . Before attem pting
to explain the sign ificance of the d ifference between the two ra te constants,
possib le mechanisms fo r the hydrolyses w ill be considered.
On the basis of tra c e r s tu d ies ,S a re l et a l . [4 ] suggested a
te n ta tiv e mechanism, in which the hydrolysis was regarded as a two-stage
process, the f i r s t involving a B^c 2 process followed by a Baci or Ss i
process. The f i r s t stage seems consisten t w ith experimental evidence;

-9 5 -
however, the second seems u n like ly . In view of the add itional information !
obtained from the present in v es tig a tio n s , regarding the e ffe c ts of change
of temperature and ion ic s treng th upon the hydrolysis the whole mechanism
w ill be reconsidered here and a lte rn a tiv e mechanisms fo r the second stage
discussed.
In d iscussing the mechanism fo r the hydrolysis of the cyclic
carbonates i t w ill be convenient to consider f i r s t the mechanisms of some
analogous hydrolyses. The a lk a lin e hydrolysis of the open-chain e s te r
d ie th y l carbonate has been shown to proceed in two stages [54]5 the f i r s t•*1 **xstage is a second order process ( k « 2.65 1* mole* . min* ) , and is
followed by a re la tiv e ly f a s te r f i r s t -o rd e r reaction (k = 0.051 min*'*').
Sarel e t a l . erroneously in te rp re t the second stage as being slower than
the f i r s t . In sa tu ra ted a lip h a tic carboxylic e s te rs the strong ly polarc £ + ^ mu
carbonyl group (^; c ■= o ) suscep tib le to bim olecular nucleophilic
a tta c k , w hilst the re la t iv e ly uncharged a lky l carbon atom is much' le s s
reac tiv e by the same mechanism. Consequently, under basic or ac id ic
conditions, such e s te rs react by bim olecular acyl-oxygen h e te ro ly s is
(B^2 and A ^2 resp ec tiv e ly ) .
Although the bim olecular alkyl-oxygen f is s io n i s observed in
some cases, fo r example (3-lactones under n eu tra l or s l ig h tly ac id ic jj
conditions [55 ], the usual bimolecular acyl-oxygen hydrolysis mechanism is j
again followed under basic or strongly ac id ic conditions. Results of i
-9 6 -
t ra c e r stud ies [4 ] of the acid - and base-catalysed hydrolyses of the cyclic18carbonates of 2 ,2 -d ia lky l pro pane-1,3-diol in water enriched w ith 0 showed
th a t the d io l produced was iso to p ic a lly normal, suggesting th a t cleavage of
the carbonate occurs w ith carbonyl-oxygen bond-fission . However, during
the hydrolysis some exchange occurred between the oxygen in the carbonyl18group of the unreacted e s te r and 0 of the so lven t. This was found to
occur during the hydrolysis only; no exchange occurred when the e s te r was
examined under n eu tra l conditions, These observations suggest th a t a t
le a s t the i n i t i a l stage of the hydrolysis is a rev e rsib le process,
Kempa and Lee found th a t the water-hydro ly s is of ethylene carbonate
was a slow process in which carbonic acid and ethylene glycol were formed.
F u r th e r ,. ethylene chlorohydrin in concentrated aqueous potassium bicarbonate
so lu tion forms ethylene carbonate on heating fo r a few hours [56]; and
propylene carbonate i s formed when 1,2-propylene chlorohydrin i s tre a te d
with potassium carbonate so lu tion and the reaction stopped when the a lk a li
disappeared [57]* These reactions presumably occur in the follow ing
manner:
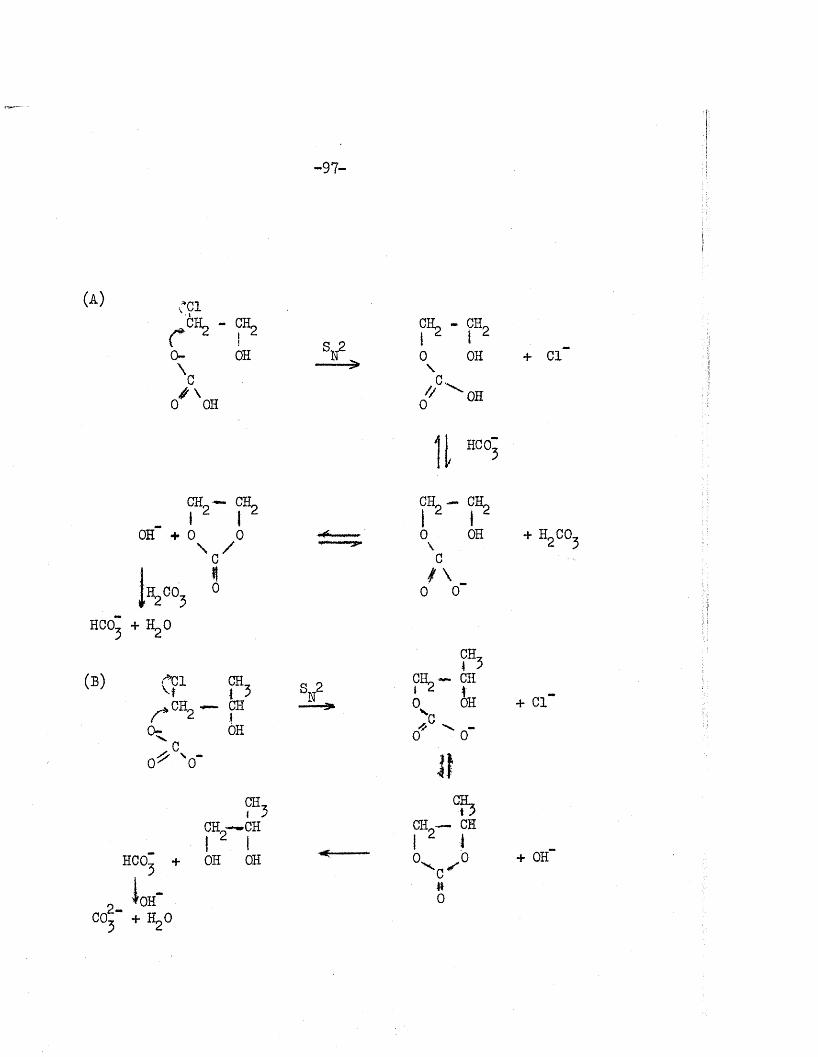
-9 7 -
(A ) {•ClCH2 -
0—
0 ^ X0H
i(OH
\
/ /CL
0
- CHri ‘OH
OH
HCO-
CH2 - CH. CH.
OH + 0 0' < /
i H9C0*(« 2 5HCO, + Ho0 5 2
(B)
HCO
{’Cl CH_I 3
^ ’ CV — CHtL OH
" c0 ^ V
CH, < 3CH2— CH1 1
L 4- OH OH0
p 'OH COj + HgO
“TS9" 0 OH \
c/ \
0 0“
0
0
CH.
CH, J 3 CHSh
0“
%- CH
i✓°
+ Cl
+ h2co3
+ Cl
+ OH

-9 8 -
I t can be seen th a t in case (B) some of the propylene carbonate
produced w ill undergo hydrolysis to produce propylene glycol and bicarbonate
ions | the l a t t e r combine w ith the remainder of the hydroxyl ions and thus
prevent fu r th e r hydrolysis of the propylene carbonate. Hence the
comparatively low y ie ld of propylene carbonate obtained in th is method.
However, Sarel et a l . suggested a d iffe re n t mechanism fo r the ethylene
carbonate formations
- CHg + HC0~ ===*' CH - CH2 ~ Cl + H20
OH Cl 0 Cf
u 0
- j®2 + Cl’0 0
X C^6
This mechanism seems un like ly in view of the fac t th a t the
reac tion i s carried out near n e u tra li ty ; only in f a i r ly strong ly
basic conditions w ill ethylene chlorohydrin behave as an acid . Further,
i f the above mechanism represents the reverse of the hydrolysis discussed18here, as Sarel et a l . also suggest, th is would lead to 0 exchange between
the solvent and an oxygen atom in the ring , and consequently would be
in te rp re ted as a lky l oxygen bond-fission .
Investiga tions of the influence of changes in the ion ic stren g th
i

- 9 9 -
of the reac tio n medium upon the a lk a lin e hydrolysis of ethylene carbonate
showed th a t th e re was no marked primary or secondary s a l t e ffec t (Table 2 ,23).
Reactions involving a neu tra l molecule and an ion usually do not show a
pronounced s a l t e ffe c t; the small changes in the ra te constants observed
with changes in io n ic s treng th are a ttr ib u te d to small e ffec ts upon the
a c t iv i t ie s of the reac tin g species. Reactions which show marked s a l t
e ffec ts are those involving d isso c ia tio n of weak acids or bases in th e ir
mechanisms, or in which both of the reac tan ts involved in the rate-determ in
ing step are charged species.
On the basis of the evidence outlined above, the a lk a lin e hydrolysis
of the cy c lic carbonates may be considered as a two-stage process. The
f i r s t stage i s a r e la tiv e ly slow second-order reaction , involving
bimolecular acyl-oxygen bond-fission and the second, a r e la tiv e ly
fa s t pseudo f i r s t - o rd e r reaction , also involving bimolecular acyl-oxygen
bond-fission . The following reaction sequence is suggested fo r the
mechanism of hydro lysis:
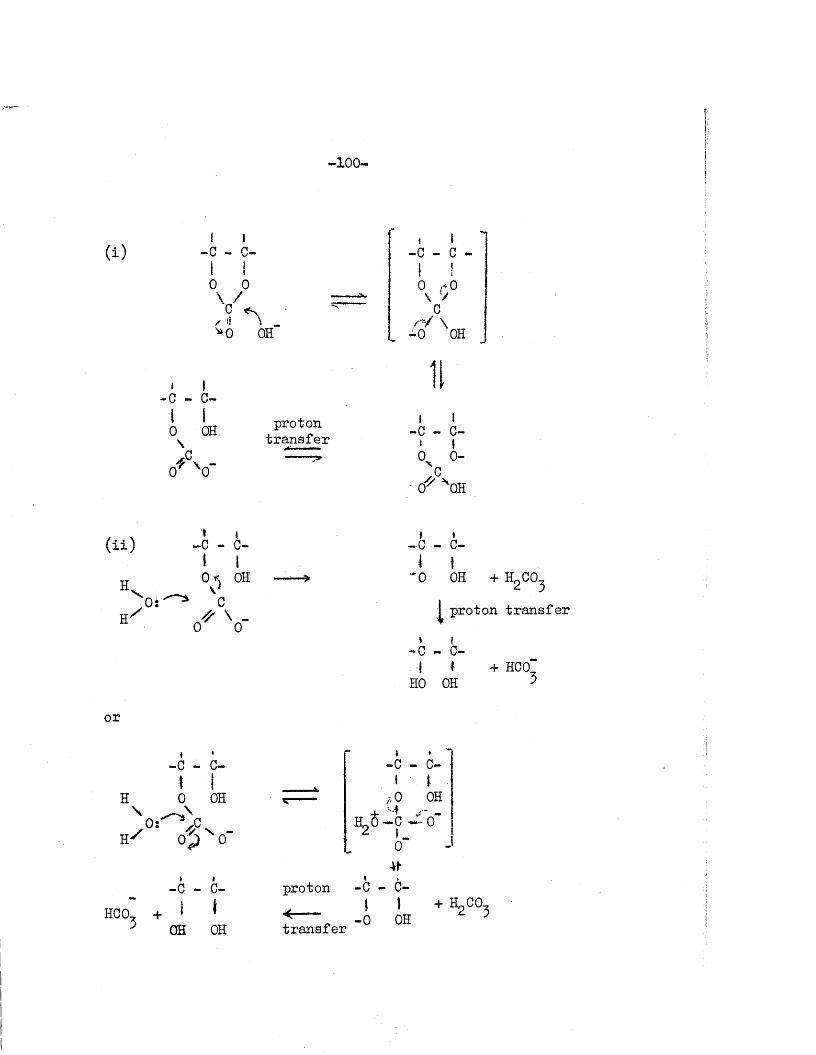
- 1 0 0 -
(O -C - c -i !0 0V V✓ '! i -
^ 0 OH
- c - c -! ! o ,->o \ v
cr~ f \
-0 OH
» I•c - c -
0 GH +p ro t° n -C - C-^ tra n s fe r i jc o o-
0* V >' 0X X0H
( i i )
H
H
\ 0:
►C - C-
0 * OH V'
C# \ ~0 0
i t~c - c -
OH + h2co3
^ proton tra n s fe r
-C - C- ! *
HO OH+ HCO.
or
H
H
\0:
i «-C - C-
t I0 OH\1 r s, \ .
o j 0
HCO, +
-c -
OH
«c -fOH
<-c
proton
tra n s fe r
c°h^ - c
0~
-C - c -i l
- 0 OH
- C-iOH
/ • *
~~0
H ^

- 1 0 1 -
The ra te constants fo r the a lk a lin e hydrolyses of ethylene and
propylene carbonates are approximately in the r a t io 5 to 3» so th a t the
e ffe c t of the methyl group i s to reduce the ra te constant by 2 /5 . This
e ffec t may be a ttr ib u te d to the readiness of the methyl group to re lease
e lectrons to the neighbouring oxygen atom (+ I e f fe c t) , which renders the
carbonyl group le ss polar than in the case of ethylene carbonate, and
consequently makes i t le ss suscep tib le to the a ttack of the nucleophilic
reagent. Sarel et al* a ttr ib u te d the lower ra te constants of the
su b s titu ted cyc lic e s te rs to the increase in the in te rn a l s t r a in of the
cyclic reac tion in term ediate. I f th is were the case, the energy b a rr ie r
fo r th e propylene carbonate hydrolysis would be expected to be appreciably
higher than th a t of the ethylene carbonate hydro lysis. However, the
energies of a c tiv a tio n fo r the ra te -c o n tro llin g reactions of the two e s te rs/ 4- —1 +are p ra c tic a lly the same (13.3 - 0.2 k .cal.m ole and 13# 1 - 0«1
—1k. cal.mole fo r ethylene and propylene carbonates re sp ec tiv e ly ) .
Therefore, i t may be concluded th a t the d ifference in the ra te
constants i s ch ie fly due to the polar e ffec t of the methyl group, which
m anifests i t s e l f in a lower frequency fa c to r fo r the propylene carbonate
hydrolysis than fo r the ethylene carbonate hydrolysis ( pZ « X x 10"^
9 —1 —1and 4 ,4 x 10 1. mole. sec. fo r ethylene and propylene carbonates
re sp e c tiv e ly ) .
- 1 0 2 -
p a a t h i
VINYLENE CARBONATE AND O-PHENYLENE CARBONATE
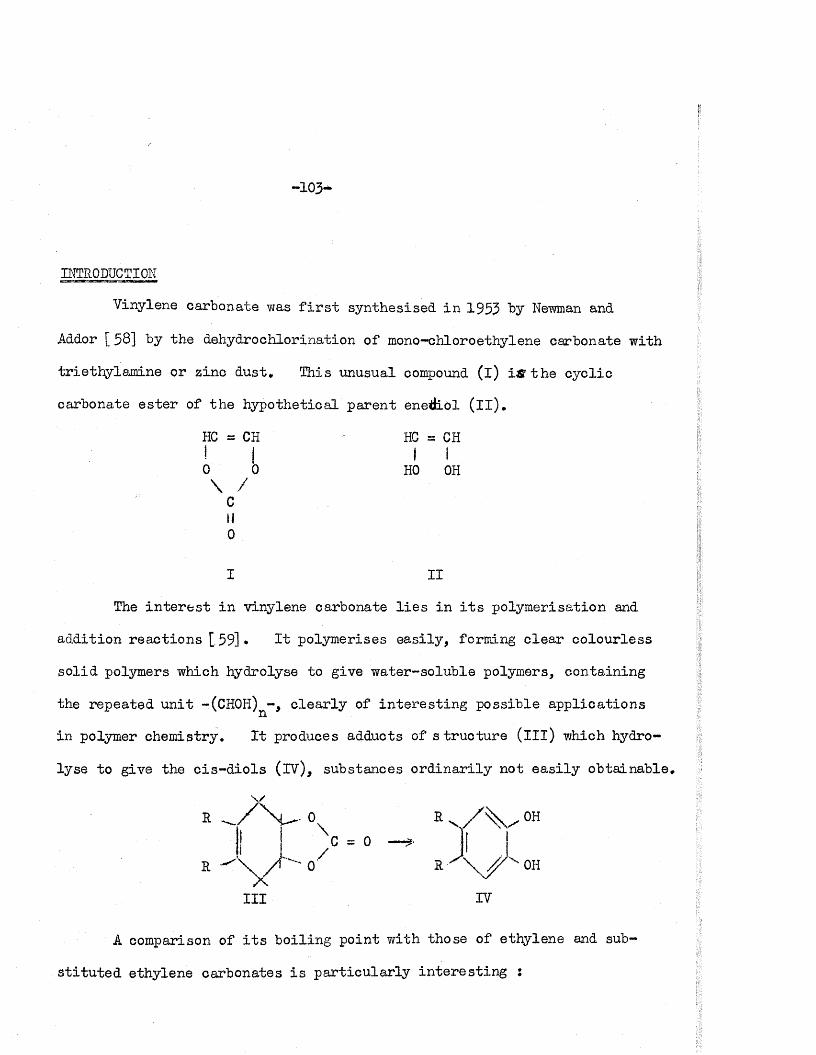
-103-
INTRODUCTION
Vinylene carbonate was f i r s t synthesised in 1953 "by Newman and
Addor [ 58] by the dehydrochlox’ina tion of mono—chloroethylene carbonate with
triethylam ine or zinc dust. This unusual compound ( i) iff th e cyclic
carbonate e s te r of the hypothetical paren t ene& ol ( i l ) .
HC = CH ' HC = CHI I I I0 b HO OH\ /
cII0
I I I
The in te r e s t in vinylene carbonate l ie s in i t s polym erisation and
addition reac tio n s [59]* I t polymerises easily , forming c le a r co lourless
so lid polymers which hydrolyse to give w ater-soluble polymers, containing
the repeated u n it -(CHOH)^-, c le a r ly of in te re s tin g possible app lica tions
in polymer chem istry. I t produces adducts of s tru c tu re ( i l l ) which hydro
lyse to give the c is -d io ls (IV), substances o rd in a rily not e a s ily obtainable .
E - ^ / V - 0 ^ E OH1 c = 0 —?
R ^ "" 0 / R ' \ / / " OHJI I I IV
A comparison of i t s bo iling point with those of ethylene and sub
s t i tu te d ethylene carbonates i s p a r tic u la r ly in te re s tin g :

-104-
ethylene carbonate 248°
mono-chloroethylene carbonate 212°
sym-dichloroethylene carbonate 178°
vinylene carbonate 162°
Id r is Jones and h i s coWforkers [ 60] studied the in fra - re d spectra
of cyclic carbonates, including vinylene carbonate, in d e ta i l and discussed
the e f fe c t of su b s titu en ts on the carbon-oxygen stre tch in g v ib ra tio n w ith
reference to open-chain carbonate e s te r s . Slayton, Simmons, and G oldstein
[ 6l] studied the ro ta t io n a l spectra of vinylene carbonate, in th e microwave
region, and claimed to have obtained accurate values fo r the p rin c ip a l
moments of in e r t ia , showing th a t the molecule i s p lanar. They also ob
tained a value fo r the dipole moment in the vapour phase from the Stark
e ffe c t, and suggested a resonant s tru c tu re :
HC — CH HC — CHl! \ _ / \\0 0 <§ o 0
+ \ / \ / +'c c
il H0 0
Recently Johnson and Patton [ 62] succeeded in preparing vinylene
carbonate by the thermal dehydrochlorination of the mono-chloroethylene
carbonate, but the y ie ld (39/°) was low.
In the p resent work vinylene carbonate was prepared using an improved
Version of the Newman and Addor method [ 63] • The d ie le c tr ic constant of
the pure l iq u id was determined and the dipole moment was obtained from

-105-
measurements in benzene so lu tion phase. The a lk a lin e hydrolysis was also
studied; ra te constants were determined a t 15°, 20°, and 25°C, and the
energy of ac tiv a tio n calculated*
The la s t in the group of cyclic carbonates studied in the present
work was o-phenylene carbonate. I t has been known in the l i t e r a tu r e since
1880 [ 64] and i s in several of i t s p ro p ertie s a lien to the group. I t i s
a co lou rless c ry s ta llin e so lid m*p» 119° - 120°C, inso lub le in -water and
extremely stab le towards acids; fo r example, i t forms 4-nitro-o-phenylene
carbonate on warming with fuming n i t r i c acid [ 65] . In a lk a lin e so lu tions ,
however, i t hydrolyses very rap id ly to give the parent compound catecho l.
I t s d ipole moment has been measured by Mecke e t a l . [ 66]; a value of
4.14D was obtained.
In the present work an attempt was made to study the ra te of i t s a l
kaline hydrolysis by the high frequency conductance technique, but th is was
found u n sa tis fac to ry in view of the very high ra te of th is reac tion . In
order to obtain a value fo r the ra te constant, the hydrolysis was followed
by the continuous recording of the change in amplitude of an o s c i l la to r
signal of low frequency fed v ia the reac tio n c e l l to a cathode ray
oscilloscope. D eta ils of the p reparation of the o-phenylene carbonate and
of the apparatus used to follo¥f i t s ra te of a lka line hydrolysis are given
in Section 3*
- 1 0 6 -
SEC TION 1
D ie lec tric Constant and Djpole Moment
Cyclic carbonates, and p a r tic u la r ly ethylene carbonate have been of
considerable in te r e s t as solvents fo r h ighly po lar organic compounds and
polymeric substances. The main c r i te r io n of solvent action i s generally
considered to be the cohesive energy density (which i s re la te d to the
d ipole-d ipole in te ra c tio n energy, and to the hydrogen bonding energy) of the
solvent compared with th a t of the so lu te . Walker [ 67] suggested th a t the
solvent power of a liq u id i s g rea tes t where solvent and solute have nearly
equal cohesive energy d e n s itie s .
The d ie le c tr ic constants and dipole moments of some cyclic carbonates
have been measured previously (see Table 3 .26). However, the d ie le c tr ic
constant of vinylene carbonate has not been reported previously; i t
seemed desirab le , th e re fo re , to measure the d ie le c tr ic constant of the pure
l iq u id . I t s dipole moment in the vapour phase has been measured from
microwave stud ies [ 6l] • In view of the f a c t th a t dipole moments measured
from microwave stud ies sometimes d if fe r from those obtained by o ther methods
i t was decided to determine the dipole moment of vinylene carbonate from
d ie le c tr ic measurements in so lu tions . Erom the knowledge of i t s d ie le c tr ic
p ro p erties , possib le interm olecular association in the l iq u id phase of
vinylene carbonate may be in vestiga ted .
A c o rre la tio n between dipole moment and d ie le c tr ic constant fo r pure
-107-
l iq u id s i s given by the Mg" fa c to r proposed by Kirkwood [68]; the calcu la
tio n of th is fa c to r has been modified by H arris and Alder [6 9 ], The
appropriate equations are given elsewhere [70], In Table 3.26 are summarised
the dipole moments, d ie le c tr ic constan ts, and ”gn fa c to rs fo r a number of
cyclic carbonates, including those obtained fo r vinylene carbonate. I t
i s generally assumed th a t "g" fa c to rs su b s ta n tia lly g rea ter than u n ity
in d ica te a h e a d - to - ta il association of dipoles in the l iq u id phase, w h ils t
values le s s than u n ity (e*g. n itro benzene) r e s u l t from head-to-head associa
tion* The ng” values in Table 3*26 show the cyclic carbonates to be
associated h e a d - to - ta il probably by strong dipole in te ra c tio n ; the more
specific hydrogen-bonding forces produce la rg e r values, e .g . fo r water "g”
has the value 2.57*
EXPERIMENTAL
Preparation
Virylene carbonate was prepared by the method of Neman and Addor [ 39]
with some of the improvements suggested by F ie ld and Schaefgen [ 63]* Fresh
ly - d is t i l le d ethylene carbonate (2 mole) was placed in 500 ml. two-necked
quartz f la sk f i t t e d with a tube fo r introducing chlorine gas, and a re f lu x
water-condenser f i t t e d with a guard-tube containing anhydrous calcium
ch loride. A mercury lamp with a quartz bulb was used to supply the U.V.
l ig h t . Dry ch lo rine was passed through the liq u id while the temperature
was maintained a t 65° - 68®C. The ch lo rination was continued u n t i l the

- 1 0 8 -
increase in weight was 64 g. (30 h r . ) . F ractional d i s t i l l a t io n in an
atmosphere of n itrogen gave two main fra c tio n s : dichloroethylene carbonate
(b .p . 56°C a t 5 - 6 mm*), and mono-chloroethylene carbonate (b .p . 83°0 a t
1.5 mm*)*
To pure mono-chloroethylene carbonate (l.O mole) in dry peroxide-
free e the r (100 m l.) [ 71] , contained in a 500 ml, three-necked f la s k f i t t e d
with a re f lu x water-condenser, a tap -funnel, and a mercury-sealed motor-
driven s t i r r e r , dry triethylam ine ( l . l mole d is t i l le d from sodium m etal)
was added over 4 hr s. while s t i r r in g and reflux ing . A small amount of
an an ti-ox idan t (2 :6 - te r t-b u ty l-p —ere so l) was added to the reaction mixture
in order to in h ib i t the polym erisation of the vinylene carbonate produced.
A fter reflux ing and s t i r r in g fo r a fu r th e r 20 hr s. the dark so lid s were
removed and washed several times Tdth a mixture of dry ether and dry benzene.
The solvent was removed and vacuum d is t i l la t io n yielded 6ofo vinylene car
bonate (b .p . 62°C a t 20 mm.). Further p u rif ic a tio n was e ffec ted by
reflux ing the vinylene carbonate under reduced pressure (b .p . about 70°C)
with sodium borohydride (2$ by weight) fo r ■§■ h r. and f in a l ly d i s t i l l in g
under vacuum. Pure vinylene carbonate (m.p. 22°G, specific conductance«*7 **1 251.7 x 10 ohm. cm.” , re fra c tiv e index n^ =s 1.4191 c . f . l i t . value
n ~ = 1 .T O ) was obtained.
Die le c tr ic Constant Measurement
jara tus
The instrum ent used fo r the determ ination of d ie le c tr ic constant

-109-
of pure vinylene carbonate has been described by Few, Smith and W itten [ 72] *
I t consisted of a c ry s ta l-tu n ed am plifier coupled to a regenerative
o s c i l la to r ; the tuned c ir c u i t included a fixed inductance and variab le
capacitance, co n stitu ted by th ree cap a c ito rs as shown in F ig .28. A 0-500
microammeter was connected as the anode load of the tuned-am plifier, so th a t
i t behaved as a c r i t i c a lly -tuned valve voltmeter. A p rec is io n
variab le a i r condenser, manufactured by H. W. Sullivan Ltd. (London) was
used in the tuning c i r c u i t . I t had a nominal capacitance range of 40 to
380 hjjF w ith a scale accuracy of - 0.01 ppF. An NPL c e r t i f ic a te of c a l i
b ration was used to convert scale readings to absolute capacitances.
When the o s c i l la to r was tuned through 1 Me/s, the anode cu rren t rose
and f e l l in th e c h a ra c te r is tic form of a resonance curve; however, when
the frequency corresponded to series-resonan t frequency of the quartz
c ry s ta l the anode cu rren t f e l l suddenly, giving a sharp dip as shown in
F ig .29.
The b rass c e l l used was constructed in these lab o ra to rie s by the
techn ica l s t a f f according to a design o f W issenschaftlich-Technische
Werkst&tten (Germany); a diagram showing a c ro ss-sec tio n of the c e l l i s
given in F ig .30. This type of c e l l i s supposed to elim inate e rro rs due to
the fr in g in g e ffe c ts which are common to a l l p la te-type "condenser c e l ls " .
The c e l l contains about 1 .5 ml- of liq u id ; i t s temperature was kept con
stan t by means of a pump c ircu la tin g o i l from a constant-tem perature o i l—
bath through the c a v itie s in the outer block of the c e l l ; the temperature

OS
CIL
LATO
R
-H O -
200 CELL
L.
F IG .28 DIAGRAM OF TUNED CIRCUIT
STA
ND
AR
DC
ON
DEN
SER
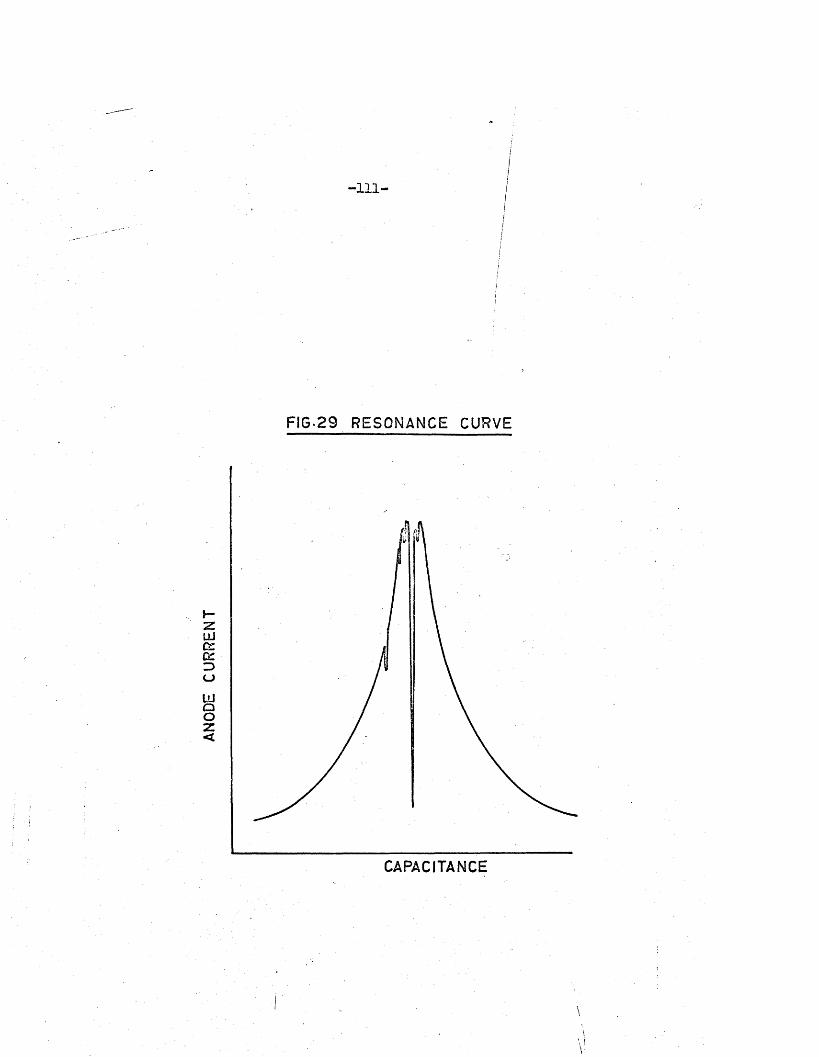
Ii!
FIG-29 RESONANCE CURVE
zU JCiZcc3CJU JQOz<
CAPACITANCE
\
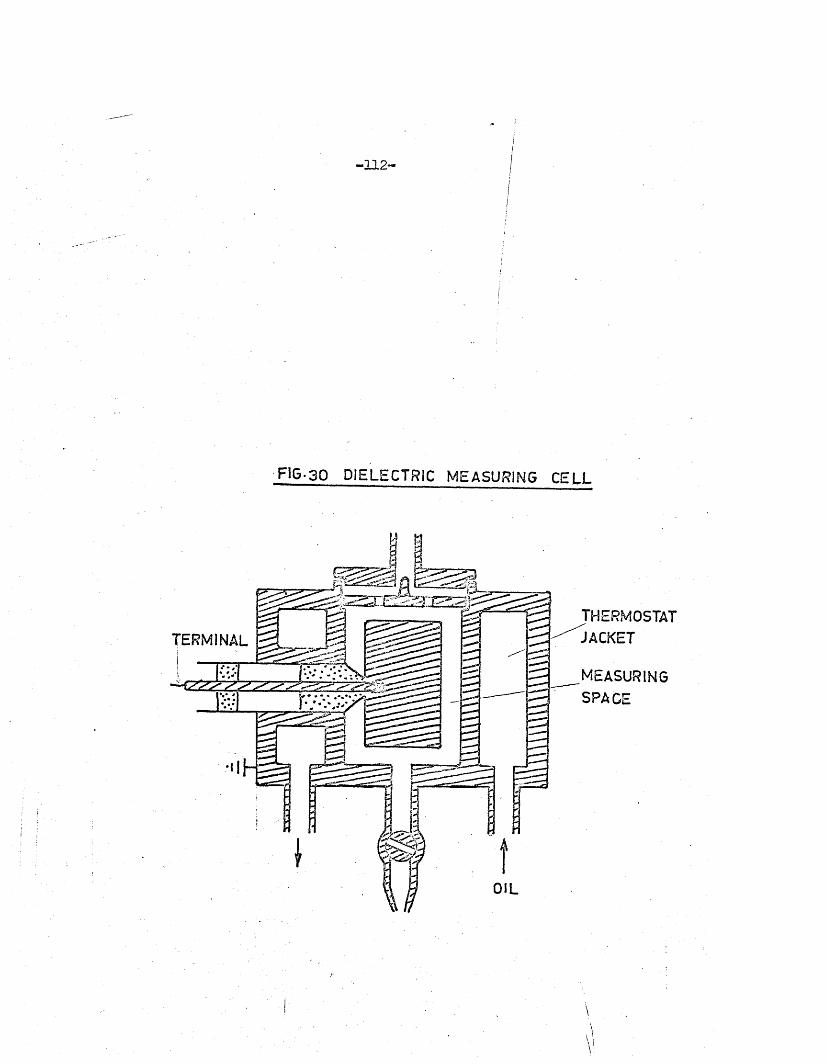
FIG-30 d ie l e c t r ic m e a s u r in g c e l l
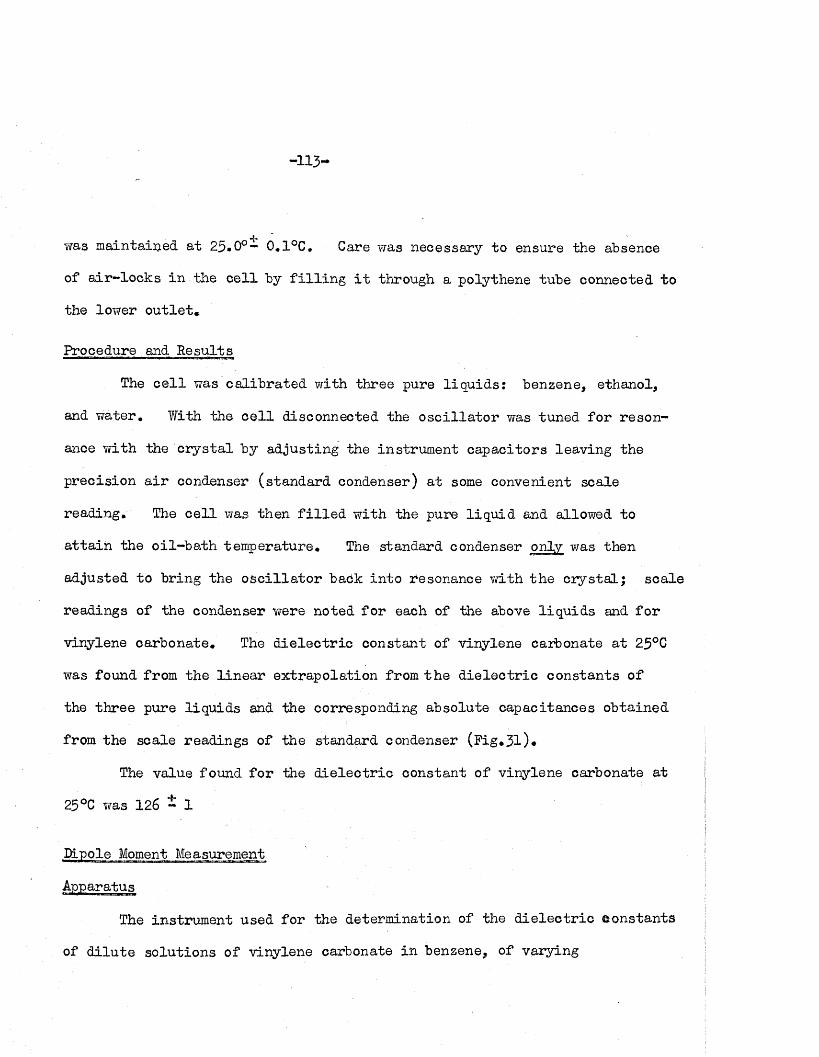
-113'
was maintained a t 25*0°— 0.1°C, Care was necessary to ensure the absence
of a ir - lo c k s in the c e l l by f i l l i n g i t through a polythene tube connected to
the lower o u tle t .
Procedure and Results
The c e l l was ca lib ra ted with three pure liq u id s : benzene, ethanol,
and w ater. Vfith the c e l l disconnected the o s c i l la to r was tuned fo r reson
ance w ith the c ry s ta l by adjusting the instrum ent capacito rs leaving the
p recision a i r condenser (standard condenser) a t some convenient scale
reading. The c e l l was then f i l l e d w ith the pure l iq u id and allowed to
a tta in the o il-b a th tem perature. The standard condenser only was then
adjusted to bring the o s c i l la to r badk in to resonance w ith the C rystal; scale
readings of the condenser were noted fo r each of the above liq u id s and fo r
vinylene carbonate. The d ie le c tr ic constant of vinylene carbonate a t 25°C
was found from the l in e a r ex trapo la tion from th e d ie le c tr ic constants of
the th ree pure liq u id s and the corresponding absolute capacitances obtained
from the scale readings of the standard condenser (P ig .3 l)#
The value found fo r the d ie le c tr ic constant of vinylene carbonate a t
25°C was 1 2 6 - 1
The instrum ent used fo r the determ ination of the d ie le c tr ic constan ts
of d ilu te so lu tions of vinylene carbonate in benzene, of varying
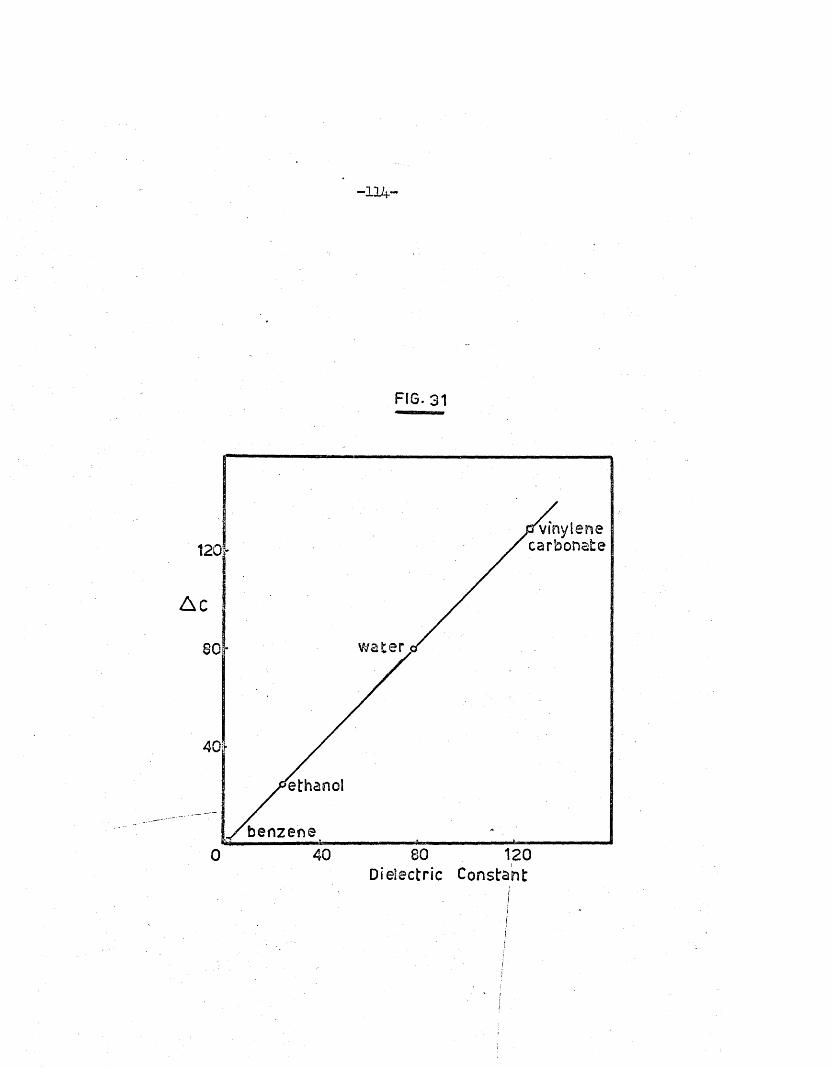
-114-
FIG. 31
Ac
w a t e r80
40
ethanol
benzene12040 800
Dielectric Constantii .i
ii

-115-
mo le - f ra c tio n s , fo r the evaluation of the dipole moment w ill "be b r ie f ly
described here; fu rth e r d e ta i ls are given by Kempa [ 75]• I t consisted of
a c ry s ta l-co n tro lle d Pierce o s c il la to r , of frequency 1 Mc/s, heterodyned
with a variable-frequency O sc illa to r having some novel fea tu re s . Zero
beat was in d ica ted simultaneously by a cathode-ray oscilloscope and by an
audio de tec to r; a block diagram of the circuit i s s-howh in Fig*32, The
tuned-tank c ir c u i t (F ig .33) of the variab le frequency o s c i lla to r included
a h ig h -s ta b i l i ty fixed a ir -d ie le c tr ic condenser as a reference capacitance,
A re lay system operated from an ex ternal voltage supply was used to in te r
change the reference and measuring sections of the apparatus. This device
elim inates the e ffe c t o f small frequency d r i f ts of the variab le o s c i l la to r
and obviates the need fo r s ta b iliz in g the mains supply.
The measuring section consisted of a variable a ir condenser and a
micrometer-screw condenser having l in e a r scales covering 40 |-ipF (1800 scale
d iv is ions) and 5 I4J.F (2500 scale d iv isions) respec tive ly ; the sc a le s
were c a lib ra ted against the p rec ision variable a i r condenser mentioned on
page 109, The measuring accuracy of the instrum ent was about - 0,00001 t-ipF.
The c e l l used (F ig ,34) was an a l l -g la s s type of condenser c e l l
s im ila r to th a t described in the l i te r a tu r e [74]# I t consisted of two
concentric g lass tubes fused together a t one end with in le t and o u tle t
tubes fo r the so lu tions to be measured. The in te rn a l surfaces of the
c e l l were s ilv e red using the standard procedure described in the l i t e r a tu r e
[75]# The capacitance of the c e l l used was 41#53 fifiF /dielectric u n it,

-116-
FIG. 3 2 BLOCK DIAGRAM OF DIELECTROMETER
cryshal
osciliahor
ampli j f ' f ie r *"T
m ixer
cell i
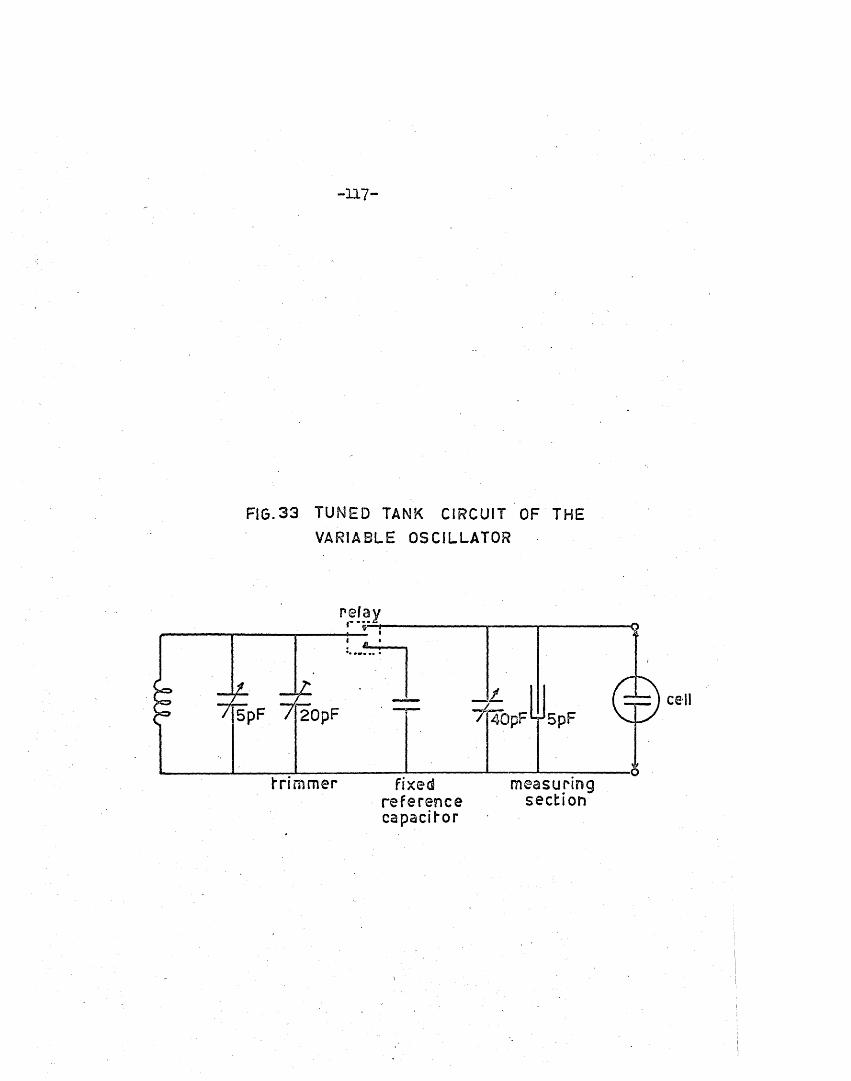
-117-
FIG.33 TUNED TANK CIRCUIT OF THE
VARIABLE OSCILLATOR
5pF 20pF
measuringsection
cell

F I G . 3.4 DIPOLE M O M E N T GEL
-119-
and i t s volume capacity was about 29 ml. The temperature of the c e l l and
i t s contents was kept constant by immersion in a constant tem perature o i l—
bath; the tem perature was maintained a t 29.00 - 0.09°C.
Procedure
The c e l l was- f i r s t c a lib ra ted with three reference substances a t 29°G:
dry n itrogen gas Cs =
pure benzene £ = 2.2729spure carb^'on disulphide £ = 2.6342s
(Eg i s the s ta t ic d ie le c tr ic constan t).
The f re sh ly silvered c e l l was thoroughly washed with benzene, and
a f te r drying, f i l l e d with n itrogen at atmospheric pressure, and l e f t in the
o il-b a th to a t ta in the equilibrium tem perature. The scale readings of the
measuring capacitance adjusted fo r zero beat were noted. The c e l l was then
f i l l e d w ith benzene and the increase in capacitance determined; sim ila r
measurements were made w ith carbon disulphide in the c e l l . A l in e a r p lo t
was obtained between the d ie le c tr ic constants and the capacitance readings;
the c a lib ra tio n fa c to r fo r the c e ll was found to be 2.610 x 10 ^ d ie le c tr ic
u n it/sc a le division*
Five so lu tions of pure vinylene carbonate’in benzene were prepared
by weighing accurately 0.3 to 1*3 g. of vinylene carbonate and the re q u is ite
amount of benzene (30 to 40 g .) to give the w eigh t-frac tions 0,01 to 0.04.
D ie lec tric measurements were made on these so lu tions; in the in te rv a l

- 120-
a l l owed fo r each sample to a t ta in equilibrium temperature and to give
reproducible scale readings (15 - 20 m in.) re f ra c tiv e ind ices were measured
on the remainder of the so lu tion , using a p rec is io n Abbe refractom eter
(Bellingham and Stanley 60) . The re s u lts obtained (mean of th re e ) , in
cluding th a t of pure benzene, are recorded in Table 3*25
D ie lec tr ic and R efractive Index Measurements on
Vinylene Carbonate Solution in Benzene
Weight f ra c tio n \2 iw2 x 10 •
0
14560
1.8937
2.2944
3.3246
3.9744
A Scale d iv i sion
1105
1835
2208
3142
3790
Refractive index 25nD
1.49769
1.49720
I .49669
I . 4964O
1.49585
1.49569
Method of C alculations and Results
For the evaluation of the dipole moment, from d ie le c tr ic constant
and re fra c tiv e index measurements on d ilu te so lu tions of vinylene carbonate

- 121-
in benzene, the sim plified method of Guggenheim [76] was used. This method
obviates the need fo r measuring the d e n s itie s of the so lu tions; the re
f ra c tiv e index and d ie le c tr ic constant of the so lu tions are ex trapolated
to in f in i te d ilu tio n separa te ly . The f in a l equation developed by Guggen
heim fo r benzene as solvent at 25°C i s
(JP2 = 0.18811 M2« - 0 .19062,- M2 S> . . . (3 .1)
where i s the o rien ta tio n p o la riza tio n of the so lu te , i t s molecular2
weight, c< the slope d a n d » th e slope dn /dw^.
The d ipole moment jj, i s r e la te d to the o rien ta tio n p o la riza tio n by
[i = (9 k /W )^ . ((jP.T)^ . . . (3 .2 )
T/here k i s Boltzman*s constant, N Avogadrofs number, and T the temperature
in degrees absolute*
The c a lib ra tio n fa c to r fo r the c e l l used was 2.610 x 10 ^ d ie le c tr ic
u n it per scale d iv is io n , and the slopes c* and . (Figs. 35 and 36) were
9.5238 x 10⁴ and -0*168 re sp ec tiv e ly . * Using equations (3*l) and (3 .2 ) the
o rien ta tio n p o la riza tio n and the dipole moments fo r vinylene carbonate were
calcu lated :
hp2 = 405.02
n = 4.45 ± 0.01 D.
Discussion
The dipole^moment of 4.45 D fo r vinylene carbonate agrees w ell with
th a t derived from microwave stud ies by Slayton, Simmons and Goldstein who
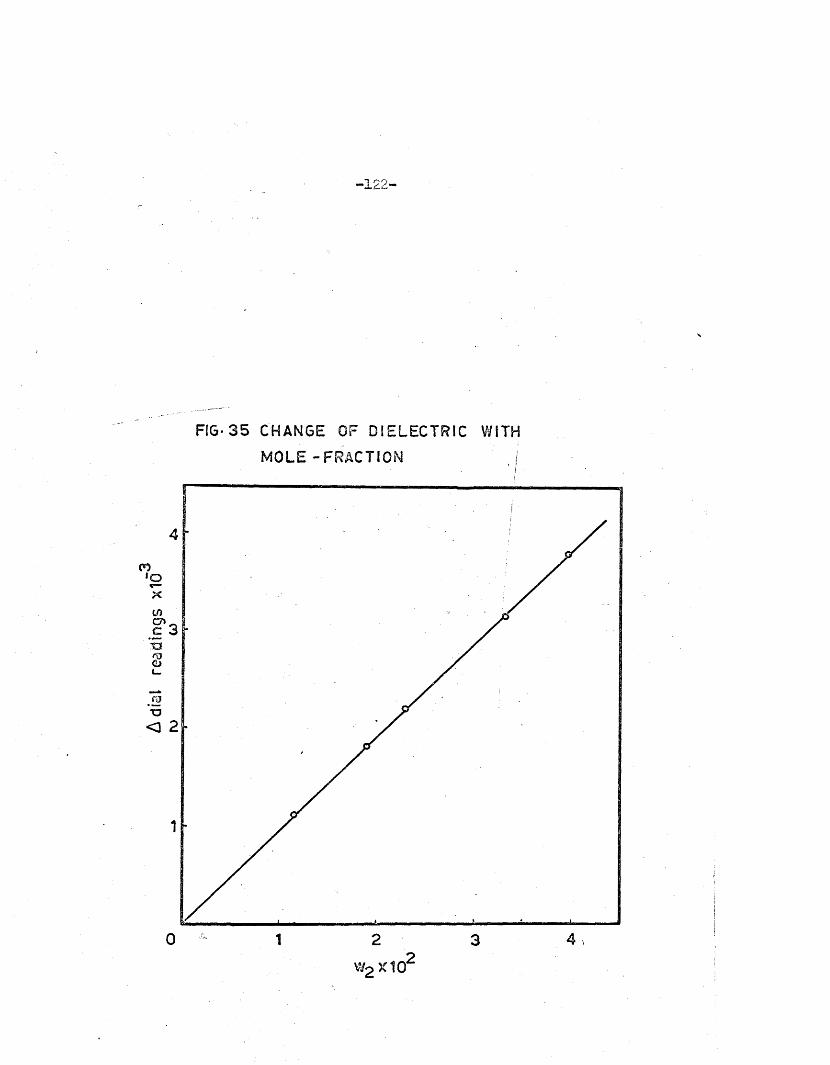
- 122-
FIG-3 5 CHANGE OF DIELECTRIC WITH
MOLE -FRACTION
“o
c 3
0 1 2 3
W2 >C102
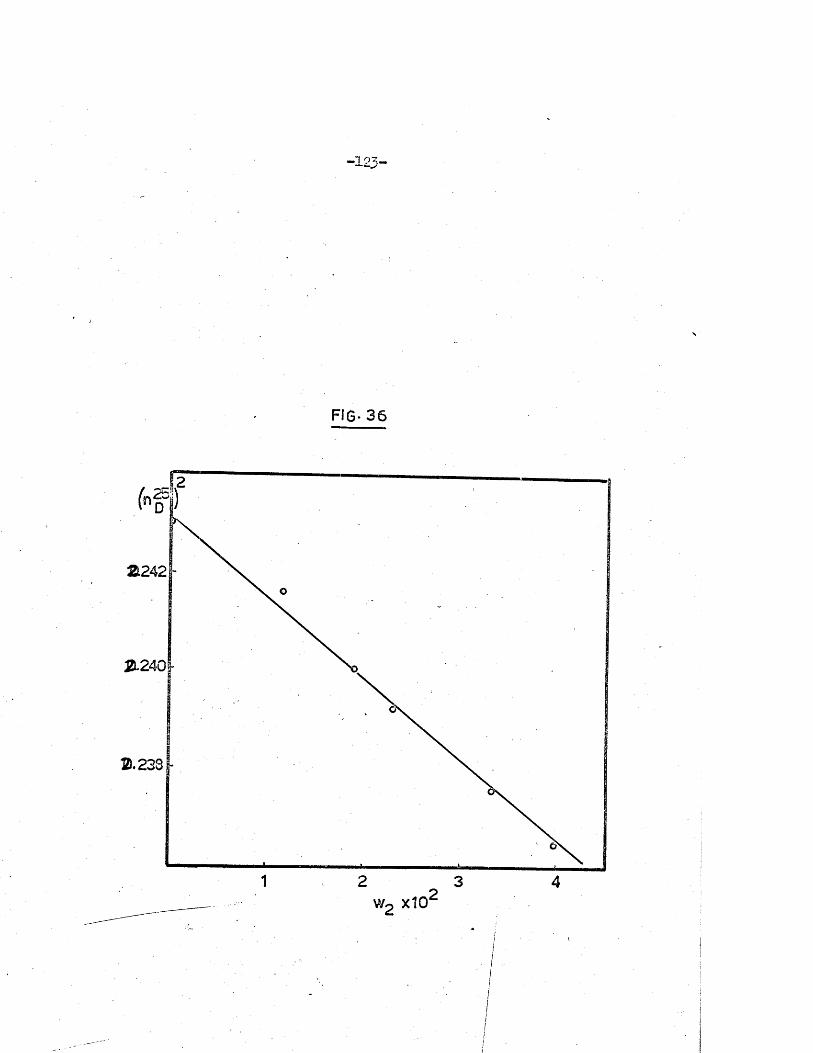
2L240i
2 .238h
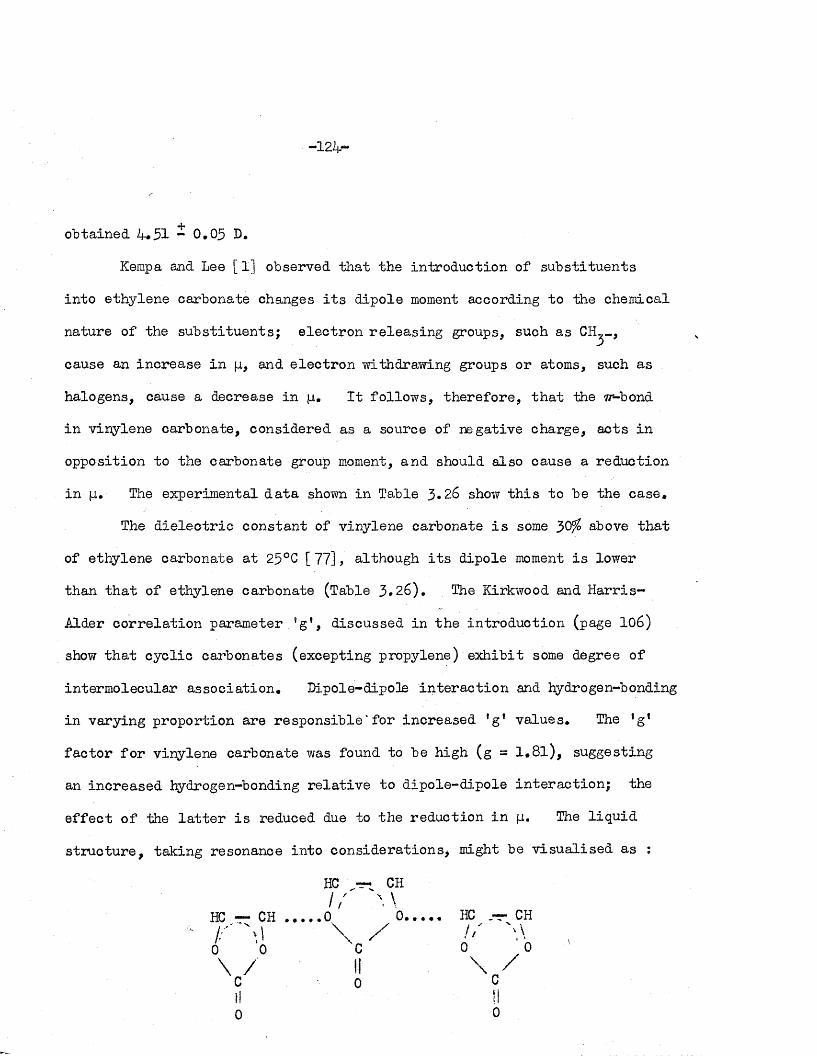
obtained 4*51 “ 0,05 D.
Kempa and Lee [1] observed th a t the in troduction of su b stitu en ts
in to ethylene carbonate changes i t s dipole moment according to the chemical
nature of the su b s titu en ts ; e lec tron re leas in g groups, such as CH^-,
cause an increase in p, and e lec tro n withdrawing groups or atoms, such as .
halogens, cause a decrease in ji. I t follow s, there fo re , th a t the w*-bond
in vinylene carbonate, considered as a source of negative charge, ac ts in
opposition to the carbonate group moment, and should also cause a reduction
in jj, . The experimental d a ta shown in Table 3*26 show th is to be the case.
The d ie le c tr ic constant of vinylene carbonate i s some 30% above th a t
of ethylene carbonate a t 23°C [ 77], although i t s dipole moment i s lower
than th a t of ethylene carbonate (Table 3*26). The Kirkwood and H arris -
Alder c o rre la tio n parameter ’g ’, discussed in the in troduction (page 106)
show th a t cyclic carbonates (excepting propylene) exh ib it some degree of
in term olecular assoc ia tion . Dipole-dipoHe in te ra c tio n and hydrogen-bonding
in varying proportion are responsib le*for increased fg* values. The 'g 1
fac to r fo r vinylene carbonate was found to be high (g = 1 .8 l) , suggesting
an increased hydrogen-bonding re la tiv e to d ipole-d ipole in te ra c tio n ; the
e ffe c t of the l a t t e r i s reduced due to the reduction in fi. The liq u id
s tru c tu re , taking resonance in to considera tions, might be v isu a lised as ;

-125-
However, hydrogen-bonding should be re f le c te d in an increased bo iling
po in t, which i s in fa c t observed in the case of chloro-m ethylethylene car
bonate (Table 3*26), the b o ilin g poin t of vinylene carbonate i s the lowest
in the group considered. Further study of the stru c tu res of these liq u id s
i s required , before molecular p roperties (dipole moment) and condensed
phase p ro p erties (d ie le c tr ic constant, bo iling po in t) can be s a t is fa c to r i ly
co rre la ted ,
TABLE 3,26
D ie lec tric Constants, Dipole Moments, Kirkwood and Harris-A lder
C orrela tion Parameter, and Boiling Points of Various Compounds
Compound
Ethylene carbonate%I Propylene Carbonate
iI Jt-< C1-ethylene carbonate
*-j sym-Cl^-ethylene carbonate
Cl-methylethylene carbonate
| Vinylene carbonate1
o-Phenylene carbonate
Hydrogen cyanide
i Water
Chloroform
Pyridine
56 measured a t 40 °C.
s l-i‘ o i's* ■ b .p .
9 5.3 4.78 1.27
00CM
61.7 4.94. 1.08 232
62.0 3.99 1.45 212
31.8 3 M 1.22 178
97.5 4.68 1.93 252
126 4.45 1.81 162
- 4 .14 - -
116 2.80 3.6 26
78.5.
1.84 2.57.
100
CO• 1.15 1.0 61
12.5 2.20 0.7 115
178 jassocd.
jm,p,l20°C.

- 126-
The A lk a l in e H y d r o ly s is o f V in y le n e C a rb o n a te
The reactions of vinylene carbonate were investiga ted by Newman
and Addor [59]. I t undergoes the Diels-A lder reactions with l,3r"butadiene,
2 ,3-dimethy1 -1 ,3-butadiene, cyclopentadiene, hexachloroeyclopendadiene,
furan and anthracene. On hydrolysis, the primary products y ie ld the
corresponding d io l. Hydrolysis of vinylene carbonate followed by treatm ent
w ith excess phenyl hydrazine gives glyoxal phenyl osazone.
Unlike ethylene carbonate, vinylene carbonate i s only sparingly
so luble in water* The hydrolysis was therefo re stud ied in IQffo (by volume)
ethano1-water mixtures* Prelim inary in v estig a tio n s in the present work
showed th a t the a lk a lin e hydrolysis of vinylene carbonate in th is medium
a t 25°C was much more rap id than th a t of ethylene carbonate. The
experimental data obtained, l ik e those fo r the hydrolyses of ethylene and
propylene carbonates, gave s tra ig h t lin e s fo r second-order p lo ts , but unlike
ethylene and propylene carbonates, the " ra te constants" varied with change
of the r e la t iv e concentrations of e s te r (a) and base (b ). For examplei
TSien a/b = 0*117, ."k ” = 25,3 l.mole*'*' sec \
and when a/b = 0.157, ” *2” = 21.3 l.m ole .^ sec
However, the experimental data gave s tra ig h t lin e s of constant slopes
fo r f i r s t - o rd e r p lo ts with respect to vinylene carbonate* fo r both examples
c ite d above a value of 0,064 sec'"1, was found fo r the f i r s t -o rd e r ra te
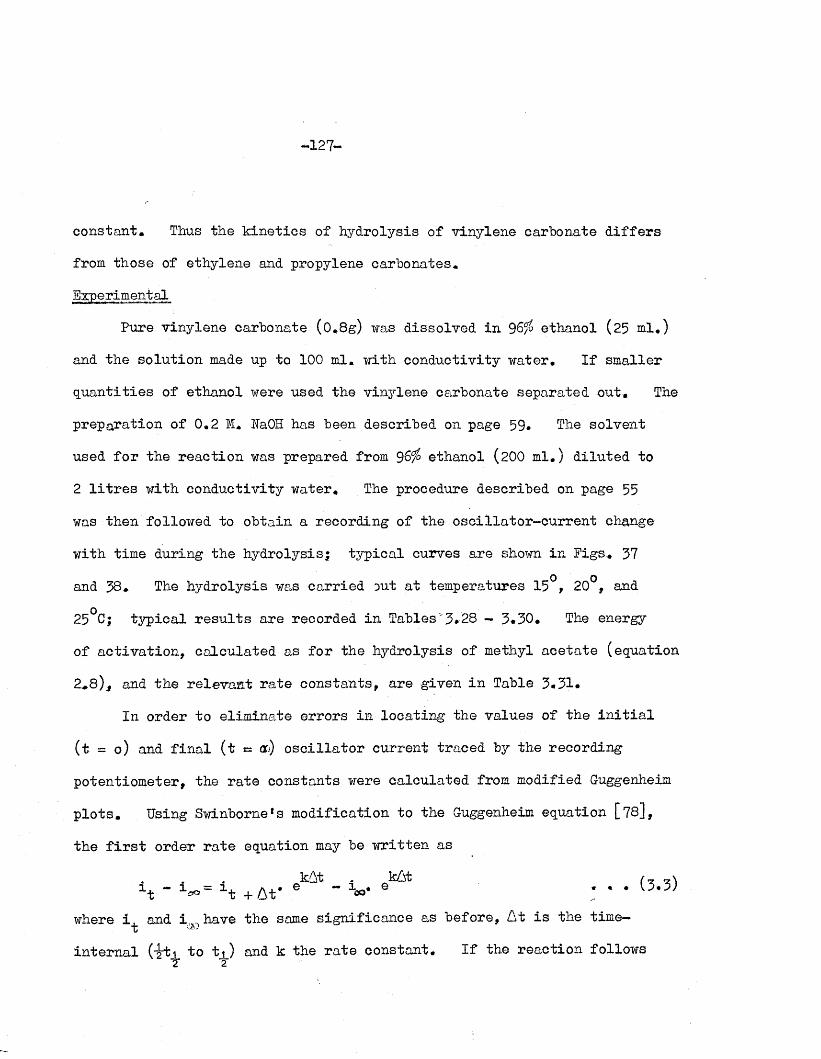
-127-
constan t. Thus the k in e tic s of hydrolysis of vinylene carbonate d if fe rs
from those of ethylene and propylene carbonates.
Experimental
Pure vinylene carbonate (0.8g) was dissolved in 96^ ethanol (25 m l,)
and the so lu tio n made up to 100 ml. with conductiv ity w ater. I f sm aller
q u a n titie s of ethanol were used the vinylene carbonate separated ou t. The
preparation of 0,2 M. NaOH has been described on page 59. The solvent
used fo r the reac tio n was prepared from 9&fo ethanol (200 m l.) d ilu ted to
2 l i t r e s with conductiv ity w ater. The procedure described on page 55
was then followed to obtain a recording of the o sc illa to r-c u rre n t change
with time during the hydrolysisj ty p ica l curves are shown in F igs. 37
and 38. The hydrolysis was ca rried out a t tem peratures 15°, 20°, and
25°C; ty p ic a l r e s u l ts a re recorded in Tables'3 .28 — 3*30. The energy
of a c tiv a tio n , ca lcu la ted as fo r the hydrolysis of methyl ace ta te (equation
2^8), and the re lev an t r a te constan ts, a re given in Table 3,31*
In order to elim inate e rro rs in loca ting the values of the i n i t i a l
( t = o) and f in a l ( t *= <x) o s c i l la to r curren t traced by the recording
potentiom eter, the ra te constants were calcu lated from modified Guggenheim
p lo ts . Using Swinborne*s m odification to the Guggenheim equation [78],
the f i r s t order ra te equation may be w ritten as
1t ~ 1 » °= x t + A t* e " v e ; * * { 3 ' 3 ’
where i , and i . have the same sign ificance as before, At i s the time— tin te rn a l (^ ti to tj_) and k the r a te constan t. I f the reac tio n follows
2 2

O'CO.
HG- 37 VINYLENE - CARBONATE HYDROLYSIS AT 25C
of"v
- ... r
..
O's-£>
■7//
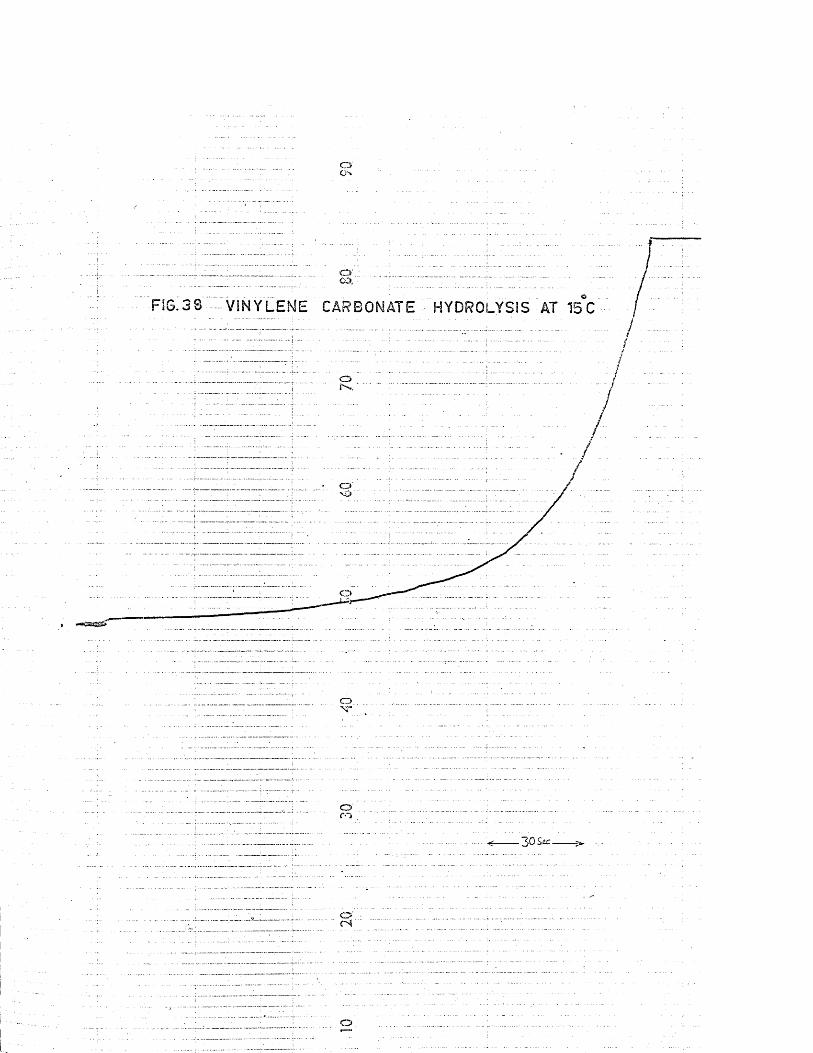
F1G.38 ViNYLENE CARBONATE HYDROLYSIS AT 15C
Or-',.
O
O'c~i
. 3 0 Sec -
O'CN
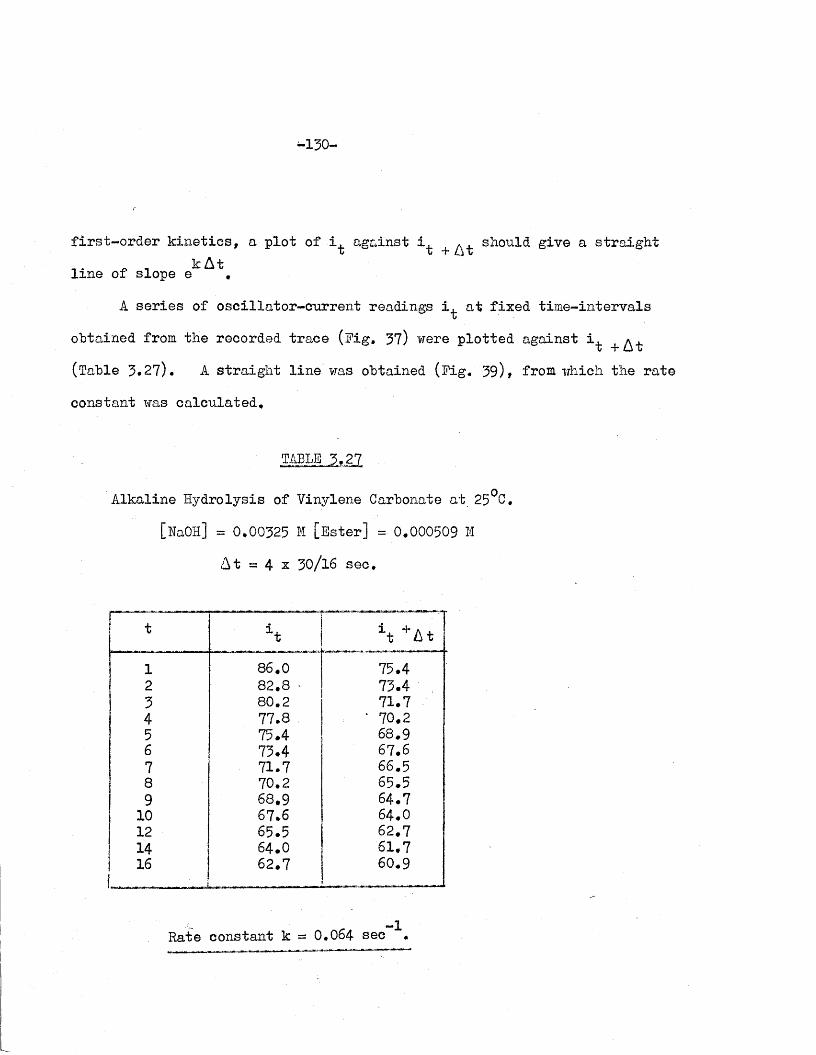
- 130-
f i r s t - o r d e r k i n e t i c s , a p l o t o f i ^ a g a in s t i ^ + ^ s h o u ld g iv e a s t r a i g h t
.p 1 kAt l i n e o f s lo p e e ,
A s e r ie s o f o s c i l l a t o r - c u r r e n t r e a d in g s i ^ a t f i x e d t i r a e - in t e r v a ls
o b ta in e d f ro m th e re c o rd e d t r a c e ( F ig . 37) w ere p lo t t e d a g a in s t i ^
(T a b le 3*27). A s t r a ig h t l i n e was o b ta in e d ( F ig . 39)t f ro m w h ic h th e r a t e
c o n s ta n t was c a lc u la t e d .
A lk a l in e H y d r o ly s is o f V in y le n e C a rb o n a te a t 25°C,
[NaOH] = 0.00325 M [ E s t e r ] = 0.000509 M
A t = 4 x 3 0 / l6 s e c .
t 1t S + A t
1 86,0 75.42 82.8 • 73.43 80.2 71.74 77.8 * 70.25 75.4 68.96 73.4 67.67 71.7 66.58 70.2 65.59 68.9 64.7
10 67.6 64.012 65.5 62.714 64.O 61,716
. . . .
62.7 60.9
R a te c o n s ta n t k = 0.064 sec \

-131-
FIG-39 SWINBORNE PLOT FOR THE ALKALINE
HYDROLYSfS OF VINYLENE CARBONATE
65
60 " 65 70 j
' t + At
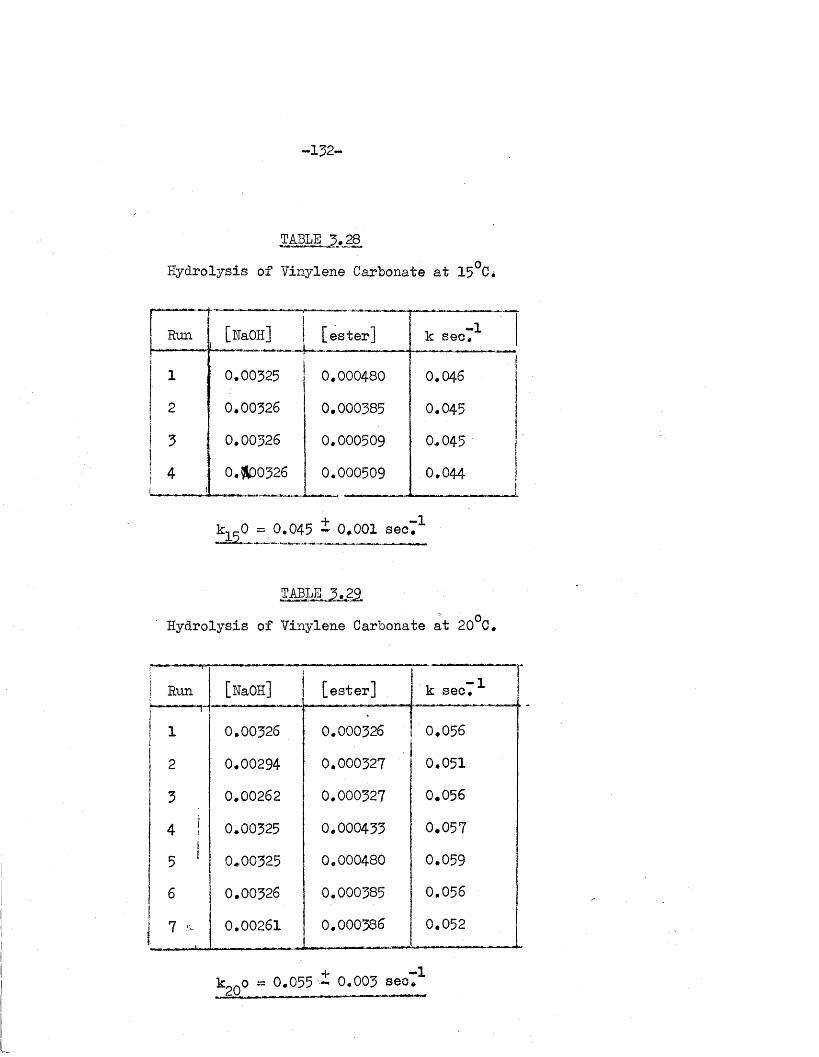
-132-
TABLE 3 .2 8
H y d r o ly s is o f V in y le n e C a rb o n a te a t 15°C*
Rumi
[HaOH] | [ e s t e r ]L_. . ______ L........... - ............
i -1k s e c .
;1 0.00325 0.000480 0.046
2 0.00326 0.000385 0.045
5 0.00326 0.000509 0.045
4.
0.800326 0.000509-——-- —-—--------- - -
0.044 j
+ -1 kj^O = 0.045 - 0*001 sec.
TABLE 3 .2 9
H y d r o ly s is o f V in y le n e C a rb o n a te a t 20°C .
Rum [HaOH] [e s te r] k secT ^“T""l
1 0.00326 0.000326 0.056
2 0.00294 0.000327 0.051
3 0.00262 0.000327 0.056
4 1 0.00325 0.000433 0.057
5 1 0.00325 0.000480 0.059
6 0.00326 0.000385 0.056
7 ^. .. . L. .
0.00261 0.000386 0,052
+ -1k ^ 0 = 0.055 ■- 0.003 sec*
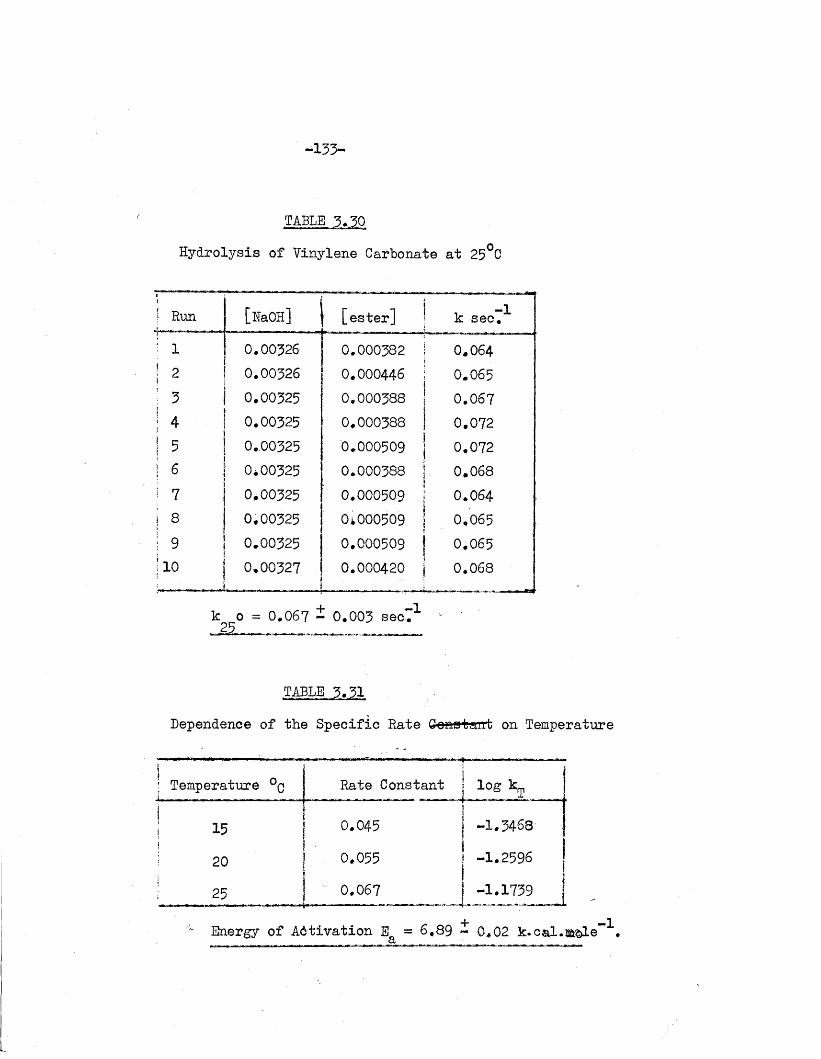
-133-
TABLE 3.30
Hydrolysis of Vinylene Carbonate a t 25°C
i1 Run
.
[HaOH] r i 1 LesterJ i - 1k sec.
i l 0.00326 0.000382 j 0,064! 2X
0.00326 0.000446 !j
0.065\ 3 0.00325 0.000388 | 0.067! 4 0.00325 0.000388 | 0.072j 5 0.00325 0.000509 0.072S 6 0,00325 0.000388 j 0,068j 7 0.00325 0.000509 j 0.064i s 0,00325 0^000509 j 0,065! 9,
0.00325 0.000509 j 0.065|10 • ; _________________
0,00327---------------- J
0.000420 j 0.068 .r-*™ . »n— ,» „ JIB
k ^ o = 0.067 ~ 0.003 secT1
TABLE 3.31
Dependence of the Specific Rate Qonot ant on Temperature
-f-])i
; Temperature °q Rate Constant log kT j
ij 15 0.045 -1.3463j
20 0.055 -1.2596
1 25 0.067 -1.1739
Energy of A dtivation EQ = 6.89 - 0,02 k .c a l.a $ le ,Q . . . . _' . .

LOG
k
-134-
iii!iI
F IG -40 INFLUENCE OF TEMPERATURE ON THE
ALKALINE HYDROLYSIS OF VINYLENE CARBONATE
-1.20
-1 .28
-1 .32
3 4 0 3 4 53351/ X10'5

-135-
Product Analysis
I f vinylene carbonate in a lk a lin e so lu tions reac ts in the. same way
as ethylene and propylene carbonates, the products of the hydrolysis m i l
be the o le f in ic d io l CH(OH): CHOH and bicarbonate ion* However, th is
in term ediate product of the hydrolysis would quickly rearrange to give
glycolaldehyde CE^{0E)*CE0 [79]* The production of an aldehyde,
presumably glycolaldehyde, and bicarbonate ions from the hydrolysis was
confirmed by a number of q u a lita tiv e te s ts on so lu tions of vinylene
carbonate in ethanol-w ater mixture:
(1) add ition of excess NaOH so lu tion followed by barium chloride
so lu tio n produced a white p re c ip ita te immediately (BaCO^);
(2) add ition of barium chloride so lu tion alone produced no
p re c ip ita tio n ;
(3) add ition of NaOH so lu tion to (2) produced a white p re c ip ita te
a f te r a few seconds;
(4 ) add ition of NaOH so lu tion followed by ammoniacal s i lv e r n i t r a te
produced a s l iv e r m irror a t room temperature j
(5) add ition of NaOH so lu tion followed by Fehling!s so lu tion
produced a red co lo ra tion a t room temperature;
(6) add ition of NaOH so lu tion followed by treatm ent w ith excess
phenyl hydrazine gave glyoxal phenyl osazone, as a lso reported
by Newman and Addor#

—136—
Discussion
The nature of the products of the hydrolysis of vinylene carbonate
show th a t i t reac ts s im ila rly with a lk a li hydroxide to ethylene and
propylene carbonates. Comparisons of the ra te constants show th a t
the vinylene carbonate hydrolysis i s considerably fa s te r than th a t of
ethylene carbonate fo r comparable e s te r concentrations.
An important d ifference i s th a t vinylene carbonate hydrolysis
follows f i r s t - o rd e r k in e tic s w hilst the o ther cyclic carbonates undergo
hydrolysis according to second-order k inetics* I f the mechanism of
hydrolysis i s the same in a l l th ree cases, the rate-determ ining step
in vinylene carbonate hydrolysis must be the second stage discussed on
p'age 100. In th is the charged open-chain in term ediate undergoes
bimolecular acyl-oxygen bond-fission with w ater. Since water i s present
in la rge excess the o v e ra ll reac tio n w ill follow f i r s t -o rd e r k in e tic s .
I t would seem, th ere fo re , th a t the e ffe c t of the x-bond in vinylene
carbonate i s to acce lera te the f i r s t stage of the reac tio n , in which the
rin g i s opened by a B ^2 mechanism, r e la tiv e to the second stage .
The case fo r th is p roposition may be argued as follow s: In the
resonance s tru c tu re fo r vinylene carbonate (see page 104), the lone p a irs
of the two oxygen atoms in the rin g may take p a rt in the resonance as in
furan ( I )
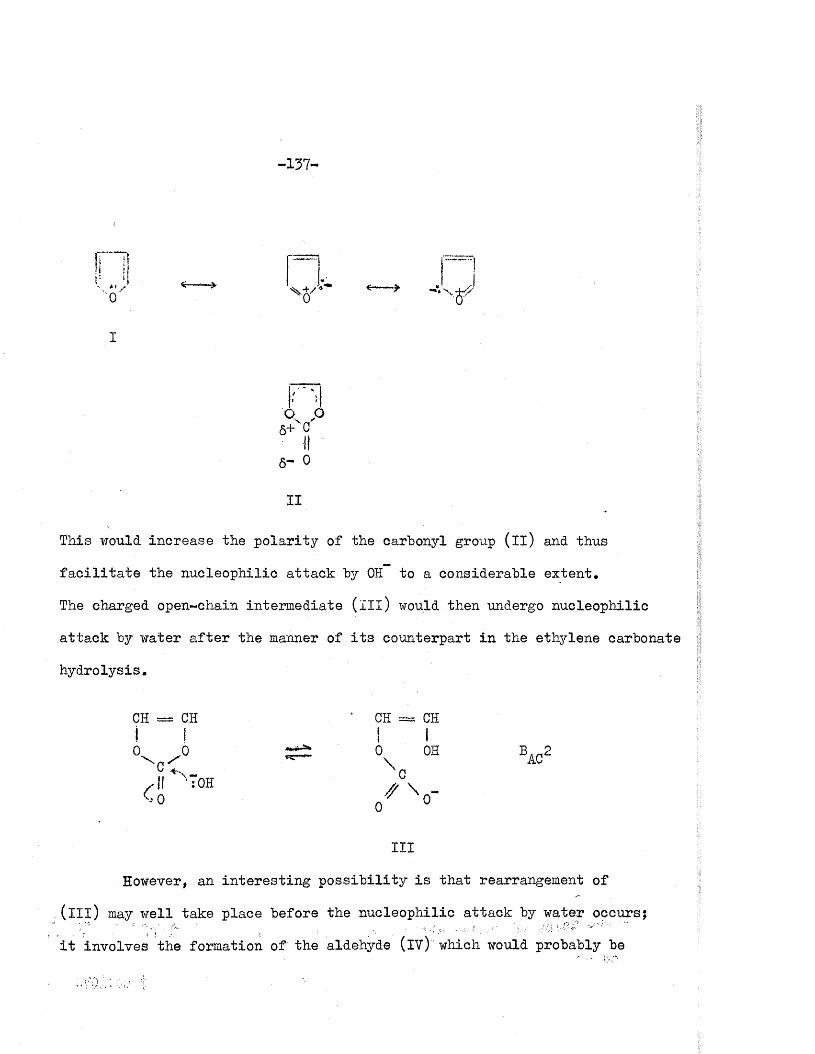
-137-
O. p 6+vC
II6- 0
I I
This would increase the p o la r ity of the carbonyl group ( i l ) and thus
f a c i l i t a t e the nucleophilic a ttack by OH to a considerable extent*
The charged open-chain interm ediate ( i l l ) would then undergo nucleophilic
a tta c k by water a f te r the manner of i t s counterpart in the ethylene carbonate
hydro lysis.
CH = CH ■ • CH = CHI I I I0 0 ^ 0 OH BArt2
\ CAC‘
.11 -OHCo / 0
I I I
However, an in te re s tin g p o s s ib i l i ty i s th a t rearrangement of
( i l l ) may well take place before the nucleophilic a ttac k by water occurs;
i t involves the form ation o f the aldehyde (IV) which would probably be

more s tab le than e ith e r ( i l l ) or i t s counterpart in the ethylene carbonate
hydro lysis. Evidence in support of th is "tautomeric e ffec t" i s found in
the l i t e r a tu r e rep o rts of the unsaturated diolCH(OH):CH0H as being an
unstable reac tio n in term ediate in the formation of glycolaldehyde [79]
CH = CH
OH\
// V -
?H2ij0.
CHII0
;c.
h i IV
The o vera ll mechanism may there fo re be represented as follow s:
(A) CH[0
CH
6 + l j O H 6-0
CH :I0
CH|OH
\ -/ x 0
protontra n s fe r
CH =» CHI I*0 On
\ / O '/" V c \-<T OH
HCH = CH
0
/ / " OH
0*
11 tautomerism
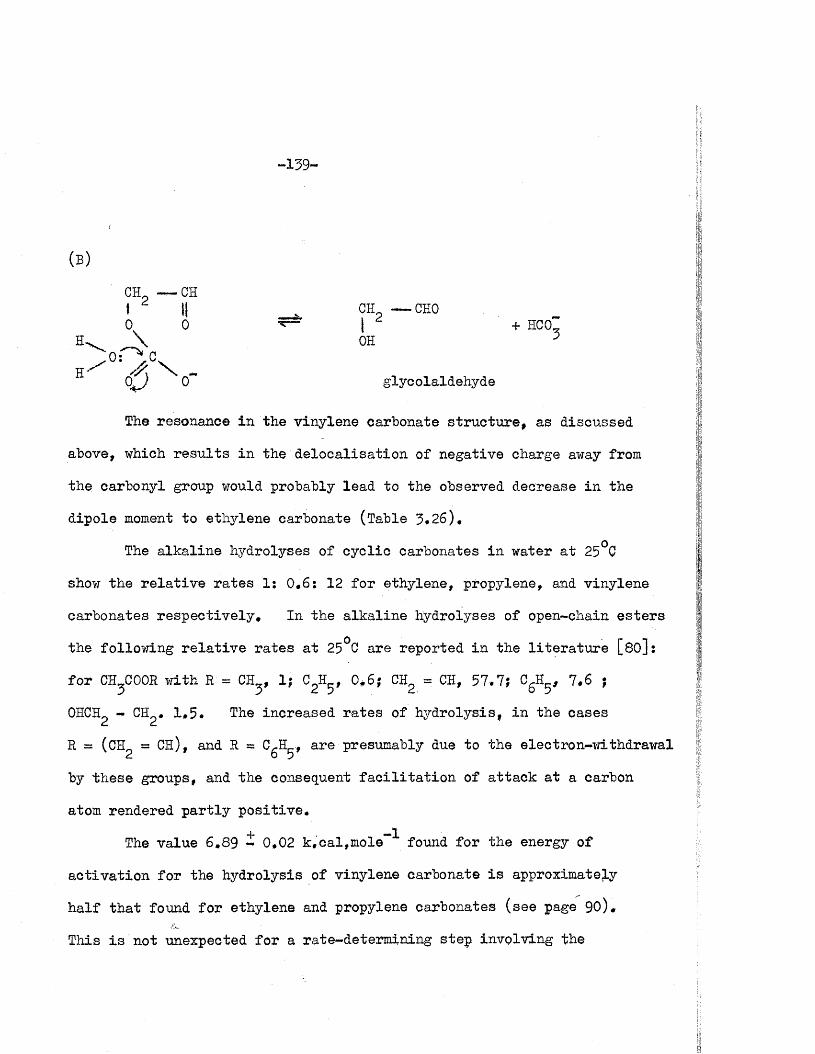
-139-
(B)
CH — CHI l| . CH — CHO0 0 •*- I * + HCO~
H ^ \ OH ^0:H ' ' & \'O J 0~ glycolaldehyde
The resonance in the vinylene carbonate s tru c tu re , as discussed
above, which re s u l ts in the d e lo ca lisa tio n of negative charge away from
the oarbonyl group would probably lead to the observed decrease in the
dipole moment to ethylene carbonate (Table 3*26),
The a lk a lin e hydrolyses of cyclic carbonates in water a t 25°C
show the re la t iv e ra te s 1: 0*6: 12 fo r ethylene, propylene, and vinylene
carbonates re sp ec tiv e ly . In the a lk a lin e hydrolyses of open-chain e s te rs
the follow ing re la t iv e ra te s a t 25°C are reported in the l i te r a tu r e [80]:
fo r CH„C00R with R = CH_, 1? C0H_, 0 ,6; CH = CH, 57*7; C.H_, 7.6 ;j j 2 p 2 o p
OHCH - CH . 1.5* The increased ra te s of hydro lysis, in the cases
R = (CH = CH), and R = C^H , are presumably due to the electron-w ithdraw al
by these groups, and the consequent f a c i l i ta t io n of a ttack a t a carbon
atom rendered p a r t ly p o s itiv e .+ -1 The value 6,89 - 0,02 k ,cal,m ole found fo r the energy of
a c tiv a tio n fo r the hydrolysis of vinylene carbonate i s approximately
h a lf th a t found fo r ethylene and propylene carbonates (see page 90).
This i s not unexpected fo r a rate-determ ining step involving the

-lifO-
(
the combination of a n eu tra l molecule, with a carba3=kkf the
reac tio n in term ediate .
In conclusion i t should be mentioned th a t vinylene carbonate
i s a substance worthy of more extensive in v es tig a tio n in view of i t s
unique p ro p e rtie s . The resonance s tru c tu re fo r instance could be
confirmed from heats of hydrogenation and from bond-1ength measurements*
I t s behaviour under acid conditions, and the p o s s ib i l i ty of complex
form ation w ith m etals, would also be of in te r e s t .

- 1 4 1 -
SECTION 3
o-Phenylene Carbonate
Methods fo r the p reparation of o-phenylene carbonate have been
the highest y ie ld (80fo) i s th a t of Hanslick, Bruce, and M asc itti [ 84 ] ,
in which o-phenylene carbonate i s obtained from the reac tio n of catechol
in a lk a li so lu tion with phosgene dissolved in toluene:
Very l i t t l e concerning i t s p roperties has been reported in the l i t e r a tu r e ,
and so an account of prelim inary stud ies of i t s p roperties w ill be given
here .
in water) but very soluble in a lcohdl. I t i s odourless when pure, but
on storage acquires the c h a ra c te r is tic odour of phenols. I t i s s tab le
towards acids; thus, treatm ent with faming n i t r i c acid gave
4-nitro-o-phenylene carbonate. In a lka line so lu tio n s , however, i t
hydrolyses rap id ly to form catechol and bicarbonate ion; the e le c tr ic a l
conductance of i t s so lu tion in ethanol-w ater mixture increases slowly but
s te a d ily w ith tim e, and a concentrated so lu tion of o-phenylene carbonate
contained in a stoppered f la sk evolved an appreciable amount of carbon
dioxide when opened a few days l a t e r . The add ition of d ilu te sodium
reported by several authors [ 81-83 ]; however, the method which gives
+ C0C1„ + 2NaOH
o-Phenylene carbonate i s a white c ry s ta llin e substance m . p .
119° - 120°C, in so lub le in water («uf. catechol, which i s very soluble

-142-
hydroxide to i t s so lu tion in ethanol-w ater mixture produced a tra n s ie n t
blue colour which changed to brown and f in a l ly to dark brown in colour;
when the same reac tio n was ca rried out in de-aerated water a f a in t ly
brown-coloured so lu tion was f in a l ly obtained*
Studies of i t s a lk a lin e hydrolysis in d ilu te so lu tions using
the high-frequency technique showed th a t o-phenylene carbonate decomposed
a t a much fa s te r r a te than the cyclic e s te rs previously stud ied . The
ra te of change in conductance during the reac tio n was close to th a t of
an acid-base n e u tra liz a tio n reac tio n , which had been used to find the
lower l im it of h a l f - l i f e of reactions which could be followed by th is
instrum ent (2-3 se c ). Consequently, the recording could not. be regarded
as su f f ic ie n tly r e l ia b le fo r q u a lita tiv e measurements* The f e a s ib i l i ty
of studying i t s a lk a lin e hydrolysis by using a cathode-ray tube osc illograph
was in v estig a ted ; a high-speed camera attachment followed the change in
voltage across the c e l l , developed by a low-frequency a lte rn a tin g curren t
passing through the reac tion m ixture. D etails of the apparatus and the
p r in c ip le of operation w ill be given la te r (page 144)*
-143-
EXPERIMENTAL
Preparation of o-Phenylene Carbonate
The method of Hanslick, Bruce, and M asc itti, was used fo r the
p reparation of o-phenylene carbonate. Catechol (l.O m ole,), f re sh ly
re c ry s ta ll iz e d from toluene, was dissolved in de-aerated water (250 m l.)
containing sodium hydroxide (2.2 mole.) in a 5 - l i t r e three-necked f la sk
previously f i l l e d w ith n itrogen . The fla sk was f i t t e d with an e f f ic ie n t
m ercury-sealed motor-driven s t i r r e r and a gas in le t tube^ and was
immersed in an ic e - s a l t bath. A p o sitiv e n itrogen pressure of 1 to 2
cm.Hg was maintained in side the f la sk by a ttach ing the gas in le t tube
to the n itrogen source through a T-tube dipping in to mercury. Eighteen
g lass ampules, each containing a so lu tion of phosgene (12.5 g . ) in toluene
(100 m l.) , were f i r s t cooled in an ic e - s a l t bath and the contents then
added to the f la sk over a period of 1 hr; the to ta l amount of phosgene
used was 2.3 mole. Vigorous s t i r r in g was maintained throughout the
add ition of the phosgene so lu tio n s , and the temperature was kept below
5°C by the add ition of clean pieces of ic e , made from d is t i l l e d water,
to the reac tio n mixture as requ ired . S tir r in g was continued a t 0 - 5°C
fo r 1 h r, a f te r the add ition of phosgene was completed. The mixture was
then allowed to reach room tem perature and the so lid formed was f i l t e r e d
o ff . The aqueous layer of the f i l t r a t e was separated and re jec ted ;
the so lid was- dissolved in the toluene portion by warming. The toluene
so lu tio n was f i l t e r e d warm and the solvent d i s t i l l e d under reduced pressure
-144-
u n t i l the product began to c ry s ta l l iz e . The residue was warmed to
red isso lve the so lid , and the so lu tion tran sfe rred in to a sm aller f la sk
from which i t was c ry s ta lliz e d and separated; the y ie ld was 74^* A fter
r e c ry s ta l l iz a tio n from toluene and drying in a vacuum desiccato r, pure
o-phenylene oarbonate (m.p* 119° - 120° C) was obtained*
N*B* 0wing to the harmful e ffec t of phosgene the reac tio n
was ca rried out in a shed on the roof of the bu ild ing
and the operator was pro tected by a re s p ira to r .
Apparatus
A block diagram of the apparatus used to follow the change
in conductance during the a lk a lin e hydrolysis of o-phenylene carbonate
i s shown in Pig. 41* The p rin c ip le of operation involves the continuous
recording, on a moving film , of the change in vo ltage, across a re s is tan ce
(r) , of the output sig n a l of a low-frequency o s c i l la to r fed through the
rea c tio n ce ll* The moving film provides the time scale from which the
r a te of change of voltage may be ca lcu la ted . The value of the re s is tan c e
(r) , was chosen to correspond to the mean of the i n i t i a l and f in a l
re s is tan c es of the t e s t so lu tion ; maximum change in am plitutde of the
s ig n a l was thus obtained.
The recording section of the apparatus consisted of a So lartron
type CD 513.2 cathode-ray oscilloscope with camera attachment focussed
on the screen. A Solartron type OS 101 o s c i l la to r was used as 1000 c /s
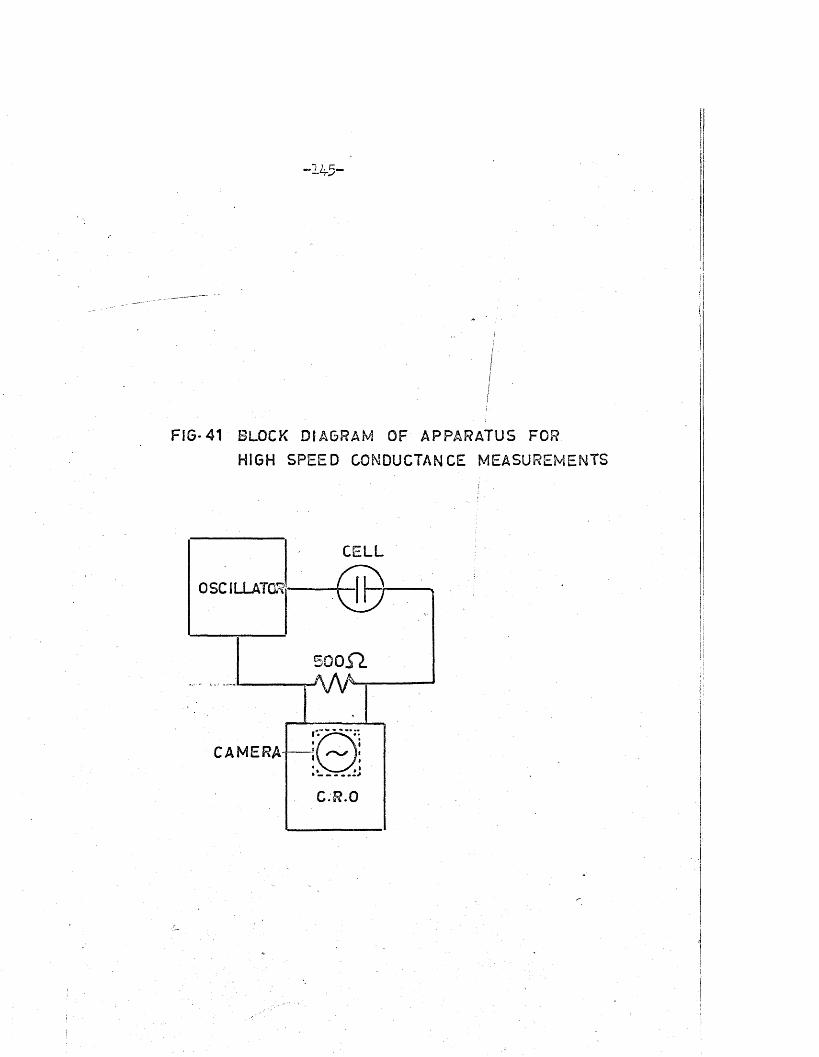
FIG-41 BLOCK DIAGRAM OF APPARATUS FORHIGH SPEED CONDUCTANCE MEASUREMENTS
CELL
500j"l
CAMERA-
C.R.O
- 1 4 6 -
s ig n a l generator. The oscilloscope time-base was switched o ff so th a t
the sig n a l appearing on the screen consisted of a sin g le v e r t ic a l l in e
in the centre of the screen. To obtain a large change in the l in e
he igh t, the input voltage was am plified considerably by su itab le
adjustment of the in te rn a l am plifier of the oscilloscope so th a t only
the top portion of the l in e was brought on to the screen. The ra p id ity
of response of the oscilloscope was determined by using a va riab le
re s is tan c e boz in place of the c e lls the response to sudden changes in
re s is tan c e ( i . e . changes in the input voltage) was p ra c tic a lly
instan taneous. The camera, a Cossor model 1423, was loaded with a
r o l l of high s e n s i t iv i ty recording film (Kodak R.55, width 35 mm, length
7.5 &•)* The film was moved across the screen by a film -drive u n it
incorporated in to the camera a t the ra te of ,0.05 to 25 inches per second
as requ ired .
The conductiv ity c e l l was of conventional type, consisting of two
p a ra l le l b rig h t platinum electrodes fized in a b o ro -s ilic a te g lass c e l l
(F ig . 42). E ffic ie n t s t i r r in g was required in order to achieve a rap id
r a te of mizing; th is was e ffected by using a magnetic s t i r r e r .
I t should be emphasised a t the outset th a t measurements of changes
in conductance of the te s t so lu tion obtained by th is technique are not as
accurate as those obtainable from high-frequency measurements, in view
of the lim ited width of the film and the lack of temperature co n tro l.
However, the 'tim e-lag in response to changes of conductance i s considerably
sm aller than in the high-frequency technique, and the ra te of mizing of the
rea c ta n ts i s the ch ief lim ita tio n of th is method.

FIG- 4 2 CONDUCTIVITY CELL

-148-
Operating Procedure
Ethano1-water mixture 3:1 by volume (100 m l,) was placed in the
c e l l and 0,2 M so lu tio n of sodium hydroxide in water (2 ml*) added. The
o s c i l la to r was se t a t 1000 c /s and the amplitude con tro ls on the
oscilloscope were adjusted such th a t the change in lin e -h e ig h t with the
change in conductance to be expected occupied maximum film width. The
s t i r r e r was s ta r te d and the so lu tion allowed to reach equilibrium
tem perature. When a constant lin e -h e ig h t was shown on the screen the
film -d rive u n it was s ta r te d , the camera sh u tte r opened, and the e s te r
so lu tio n quickly in jec ted from a syringe p ip e tte . . Pour to f iv e seconds
were allowed to pass a f te r the add ition of the e s te r before the camera
sh u tte r was closed and the film -drive stopped; a ty p ic a l recorded trace
i s reproduced in Pig. 43a,
Acid-base n e u tra liz a tio n reac tio n s , a re , to a l l in te n ts and purposes,
instan taneous. In order to measure the tim e-in te rv a l required fo r mixing
of the re a c ta n ts , the change in conductance accompanying the n e u tra liz a tio n
of sodium hydroxide with hydrochloric acid was recorded; the re s u lt i s
shown in Pig. 43^.
Results
( i ) Acid-base n e u tra liz a tio n :
[WaOH] = 0.00213 M
[HCl] = 0.00182 M
H a lf- l ife tj_ = 0,25 secT 2
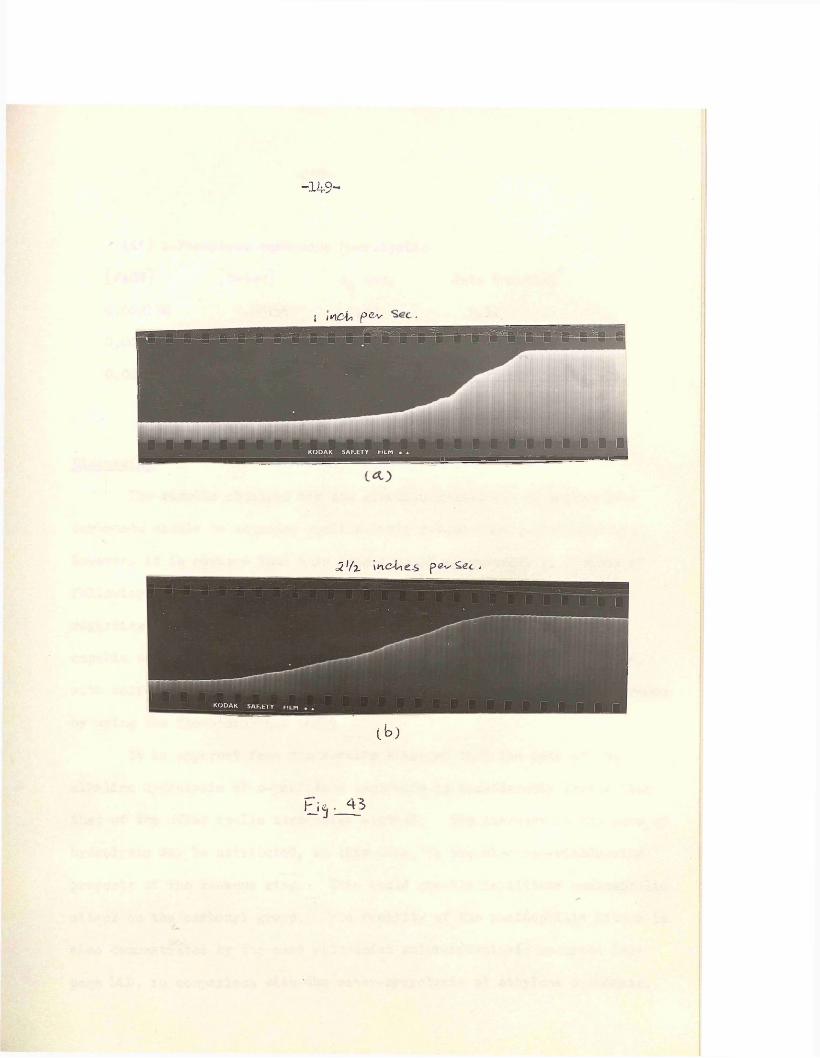
- 149-
i m Cii P 12 *
J? Vx inches p« Sec *
( b )
Ei^ _ 1 3

- 150-
- ( i i ) o-Phenylene carbonate hydrolysis!
[NaOH] [E ster] tj_ sec. 2*
Rate Constant
0 . 00213M 0.00195 0.62 1*12
0. 00213M 0.00511 0*55 1.26
0.00213M 0.00511 0*54 1.28
* Rate Constant in sec"1 a t 20°C.
Discussion
The re s u l ts obtained fo r the a lk a lin e hydrolysis of o-phenylene
carbonate should be regarded q u a lita tiv e ly ra th e r than q u a n tita tiv e ly .
However, i t i s obvious th a t th is technique of measurement i s capable of
follow ing rap id conductance changes* With refinem ents, p a r tic u la r ly
regarding the problem of rap id ly mixing the rea c ta n ts , i t should be
capable of follow ing reac tio n s, in which changes in conductance occurs,
w ith h a lf - l iv e s 0 ,1 —6 sec. The problem of mixing may be e a s ily overcome
by using the flow-technique [ 85]#
I t i s apparent from the re s u lts obtained th a t the ra te of the
a lk a lin e hydrolysis of o-phenylene carbonate i s considerably f a s te r than
th a t of the o ther cyclic carbonates stud ied . The increase in the ra te of
hydrolysis may be a ttr ib u te d , in th is case, to the electron-withdrawing
property of the benzene rin g . This would g rea tly f a c i l i t a t e nucleophilic
a ttac k on the carbonyl group. The f a c i l i ty of the nucleophilic a tta c k i s
also demonstrated by the ease with which w ater-hydrolysis occurred (see
page 143) , in comparison with the w ater-hydrolysis of ethylene carbonate.
-151-
A P P E N D I C E S

-152-
( 1 ) "pH- Measurements
As the prelim inary determ inations of the ra te constants fo r the
a lk a lin e hydrolyses of ethylene and propylene carbonates in w ater, from
high frequency measurements, d iffe red markedly from those of previous
authors, an attem pt was made to determine the ra te constants by an
independent method. The p o s s ib i l i ty of using the change in pH which
accompanies such hydrolyses was investigated* In th is appendix a b r ie f
account w ill be given of the apparatus constructed fo r pH-change
measurements and some of the re s u l ts obtained.
The apparatus consisted of a hydrogen e lectrode, a calom el-saturated
KC1 reference e lec trode , a vibron e lectrom eter, and a recording potentiom eter
a block diagram of the apparatus i s shown in Fig, 44# The platinum
electrodes were e lec tro p la ted with platinum -black as described in the
l i te r a tu r e [ 86] . The use of the vibron was necessary because the recording
potentiom eter did not have an in f in i te impedence and consequently required
a sm all but f in i t e cu rren t before i t s balancing c ir c u i t came in to e f fe c t .
For most purposes the vibron has an in f in i te input impedence ( lO ^ V i),
and supplies an am plified output fo r ex ternal recorders. The so lu tion
was s t i r r e d by a magnetic s t i r r e r and the complete apparatus was placed ino + oa small therm ostated room kept a t 25 - 0,5 C. A ll so lu tions used were
previously kept a t 25°C in a therm ostated w ater-bath u n t i l tem perature-
equilibrium was reached. The apparatus formed a pH-meter which was
c a lib ra te d w ith two bu ffer systems, in the range of in te re s t (pH =9*18 and

jij
iII
FIG-4 4 DIAGRAM OF APPARATUS FOR
pH MEASUREMENTS
RECORDER

11.72), prepared from standard buffer so lu tion ta b le ts (supplied by
Burroughs Wellcome L td ., London),
Procedure
Conductivity water (96 m l.) was placed in the c e l l and 0.25 M
sodium hydroxide so lu tion added (2 m l,) . Hydrogen gas was f i r s t
p u rif ie d by passing i t through w ash-bottles containing ( i ) a so lu tion of
a lk a lin e pyrogallo l ( i i ) very d ilu te sulphuric acid ( i i i ) water and (iv )
a sample of the so lu tio n used in the c e l l , and then passed through the c e l l
a t the ra te of 2 - 3 bubbles per second. The magnetic s t i r r e r was s ta r te d
and the system allowed to come to constant e.m*f, (l5 - 20 m in.)j the
condition of equilibrium was ind icated by a v e r t ic a l lin e traoed by the
recording potentiom eter. The e s te r so lu tio n , 0,50 M (2 m l.) , which was
previously sa tu ra ted with hydrogen gas was then added from a syringe
p ip e t te . Experimental curves showing the change in pH with time during
the a lk a lin e hydrolysis of ethylene and propylene carbonates are shown in
P igs, 45 and 46 .
C alculations
The a c t iv i ty c o e ff ic ien ts of the hydroxyl ions of the system were
f i r s t calcu la ted from the Debye-Huckel equation ( i ) , so th a t the pH
values might be converted in to concentration terms:A Z. Z0 \fl~ / . \

F IG -4 5 ETHYLENE

o
FIG .46 PROPYLE
toCO
oCO
. ' . X pO .
tovo
ono
CO(N-OcS
coo

- 1 5 7 -
gwhere A and B are constants (A = 0*509 and B = 0.328 x 10 , in water
0 \a t 25 C), a d istance of c lo ses t approach (= 3*3 x 10 cm), and I the
to ta l ion ic streng th ( = From the hydroxyl ion concentration,
and using the second d issoc ia tion constant of carbonic acid
(k =s 4*69 x 10 ^ ) , the instantaneous concentrations of HC0Z and C0~2 5 3
were found* The amount of e s te r hydrolysed x = [HC0~] + [C0^**]j these
r e s u l ts are given in Tables A .l and A.3# The re levan t ra te equation
•ff = k [a - i ] [OH” ] . . . (ii)
(where a i s the i n i t i a l e s te r concentration) was solved g raph ically , since
i t contained two independent va riab les and was impossible to in te g ra te .
The re s u l ts obtained from the ra te constants are given in Tables A.2 and A.4.
TABLE A .l
pH-Measurements of the Hydrolysis
of Ethylene Carbonate
[NaOH] = 0.00500M [E ster] = 0.0100 M.
oj :
! CD o pH [6h“ ].£± 1f i i HC0" ! j
1 «£■___ I .. 3 . . . ............. ______
05
11,6711.57
-34.68 x 103.69 I
0.9240.923
i 1
: 0,026 X
I\
10~3 0.488x10**^ 1 0.514x10 ^
10 11.48 2.98 j 0.921 : 0.055 : 0.848 ! 0,90414 11.40 2.51 ; 0.919 ; 0,085 { 1.088 j 1.17319 11.32 2.08 0.918 ! 0.122 1.299 i 1,42125 11.23 1.71 0.917 i 0,170 ! 1.482 ! 1.65230 11.15 1.42 0.916 j 0.222 : 1.614 I 1,83640 10.99 0,97 0.915 10.360 ; 1.789 j 2.14950 10.82 0,66 0.915 1 0.552 1 1.866 j 2,41860 10.65 0.45 0.915 ' 0.805 1 1.852 ! 2.65790 10.24 0.17 0,916 i 1.799 1.511 1 3.310

- 1 5 9 *
TABLE A.2
Rat© Constant a t 25 C Ethylene Carbonate
f t sec \I _____ s
dx/dt [a—x][OH- ] | k
1 10 Ij 6.98zl0-5 2.92zlO-5 j 2.3820 j 4.62 1.90 ;
i2.43
30 | 3.26 1.25 2,6040 j
4-2.47
-----—---------0.87 i! 2.84
4
Mean kOI_o 25 2.56 l.m ole’"^, sec-1
t sec j pH“h
11.67 11.61 11.58 11.53 11.48 11.40 11.32
11.15 i 11.01 ] 10.78 !! I
OH
TABLE A.3
pH - Measurements of the Hydrolysis of Propylene Carbonate
[NaOH] = 0.00500 M [E ster] = 0.0102 MF Tf - HC0, co i
o6
10
172335477090
120
4.68x10 4.06 3.76 3.35 3.04 2.51 2.08 1.42 1.01 0.60
-3 0.9240.9230.9230.9220.9210.9190.9180.9160.9150.915
0.014x10 0.023 0.038 0.052 0.088 0.123 0.223 0.344 0.654
-3 0.289x10 0.440O.664 0.820 1.130
1.304 1.617 1.773 1.865
,-3 0.303x10 0.463 0.702 0.872 1.218 1.427 1.840 2*117 2.519
-3
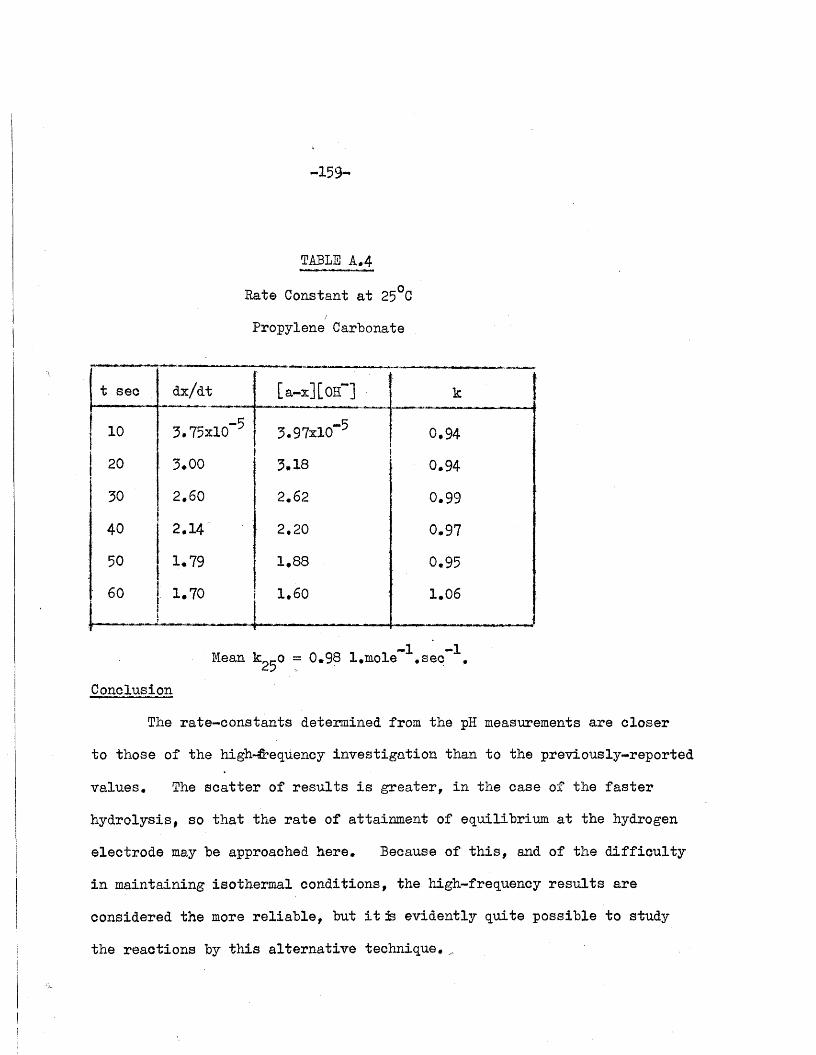
-159-
TABLE A.4
Rat© Constant a t 25°Cf
Propylene Carbonate
t sec dx/dt [a-x][0H- ] k
10 3,75xl0~5 3.97xl0-5 0.94
20 3*00 3.18 0.94
30 2,60 2.62 0.99
40 2.14 2.20 0.97
50 1*79 1.88 0.95
60 : 1.70
.......................
1.60
________________ 1
1.06
-1 -1Mean k-,-0 = 0.98 l,mole .sec . doConclusion
The ra te -co n stan ts determined from the pH measurements are c lo ser
to those of the high-frequency in v es tig a tio n than to the previously-reported
values. The s c a t te r of r e s u lts i s g rea te r, in the case of the f a s te r
hydro lysis, so th a t the ra te of attainm ent of equilibrium a t the hydrogen
e lectrode may be approached here. Because of th is , and of the d if f ic u l ty
in m aintaining isotherm al conditions, the high-frequency re s u lts are
considered the more re l ia b le , but i t is ev idently qu ite possib le to study
the reactions by th is a lte rn a tiv e technique, ^
- 1 6 0 -
(^) Hydrolysis of Ethylene. Carbonate in Barium Hydroxide Solutions
In th is appendix are given the re s u lts obtained when barium
hydroxide replaced sodium hydroxide in the e s te r hydrolyses; the use
of barium hydroxide as an a lte rn a tiv e to excess sodium hydroxide was
discussed on Page 74* The procedure outlined on Page 55 was followed
in obtaining the o s c il la to r curren t change with time during the hydrolysis;
an actual recorder curve i s shown in Pig, 47#
The to ta l change in o s c i l la to r current ( i - i ^ ) y using the previous
no ta tion , i s proportional to the concentration of the base b, and the
amount of the base used up a t time t (2x) i s proportional to ( i - i , ) ,O "cx being the amount of e s te r hydrolysed a t time t , Therefore,
2x =* ( i - 0 ( 1 - 0 b or c?b ( i i i )0 X O
using th is r e s u l t in the in teg ra ted ra te equation
k = f f i - b ) l o g t e S a ( i v )
the following equation i s obtained
, 2.303 l - ^ ^ a . . . (v)k - tla t* ) los “IT S
The re s u l ts obtained from the recorder trace are given in Table A, 5,
and a p lo t of the log term in equation (v) against time i s shown in
Pig, 48, The ra te constant calcu lated from the slope was 1,2 l,mole’*^,sec’


-162-
F tG .4 8 SECOND-ORDER PLOT FOR ETHYLENE
CARBONATE HYDROLYSIS IN B a(0H )2
o
40302 00 1 0SECONDS

- 163-
TAHjE ^A ,^
Hydrolysis of Ethylene Carbonate in
Barium Hydroxide so lu tion a t 25°C
[Ba(0H)2] = 0.00^62 11 [E ster] = 0*00932 M
t sec. s ii - I log - r —J. -wL ..............- ____ . __
0 84.0 |-----------1■.
I5f
3.8 79.0 1\ 0.079 0.029 |7.5■ 74.0 II 0.159 0.061
10.0 72.0 0,190 0.07615.0 67.0 j 0.270 0.11418.8 63.0 | 0.333 0.14622.5 60.0 j 0.381 0.17630.0 54.5 j 0.468 0.23337*5 50.0 | ■0.540 O..29O45.0 46.0 | 0.603 0.346 |
; 60.0 40.0 |21.0 j.
1
0.698 0.456 j!i----------- --------------a
Rate Constant k„_ = 1 2b-1 -1 .2 l.m ole . sec .
The value fo r the ra te constant obtained i s thus lower than th a t
obtained with excess sodium hydroxide (see P art I I , Sec. 3)* However,
in spection of the recorder trac e of o sc illa to r-c u rre n t change with time
during the hydrolysis (Fig, 47) shows th a t a re s id u a l condunctance
corresponding to 21 recorder u n its (about l /5 th of the to ta l conductance)
- 164-
The so lu b ili ty product of barium carbonate i s 8*1 x 10~^ a t 25°C,
the res id u a l conductance from th is source may be neglected* However,
barium bicarbonate i s appreciably soluble under these conditionsj th is
was confirmed by the absence of p re c ip ita te when barium chloride so lu tion
was added to sodium bicarbonate in concentrations comparable to those
produced in the e s te r hydrolysis. On the assumption th a t barium bicarbonate
only was produced a t the end of the hydrolysis, the in teg ra ted ra te -equation
(v i) was obtained*
su b s titu tio n of the data obtained from Fig. 47 in Equation (v i) gave the
s tra ig h t l in e p lo t shown in Fig. 49* A value of k = 2.5 l.m ole ^ .s e c ~ \
was obtained.
I t i s obvious, however, th a t the two assumptions made represen t
two extreme stages of the ac tual process; some barium carbonate was in
fa c t p re c ip ita te d , whil s t the res idua l conductance ind icated incomplete
p re c ip ita tio n , presumably due to barium bicarbonate form ation. Gravimetric
analysis of p re c ip ita te s co llec ted a t the end of e s te r hydrolyses under
comparable conditions showed th a t p re c ip ita tio n was in fa c t incomplete
(amount of BaCO found = 0.0182 g . , th e o re tic a l amount fo r complete
p re c ip ita tio n = 0.0440 g . )•
In re tro sp ec t i t i s in te rs t in g to note th a t the ra te constant
obtained from stud ies of the hydrolysis in excess sodium hydroxide i s
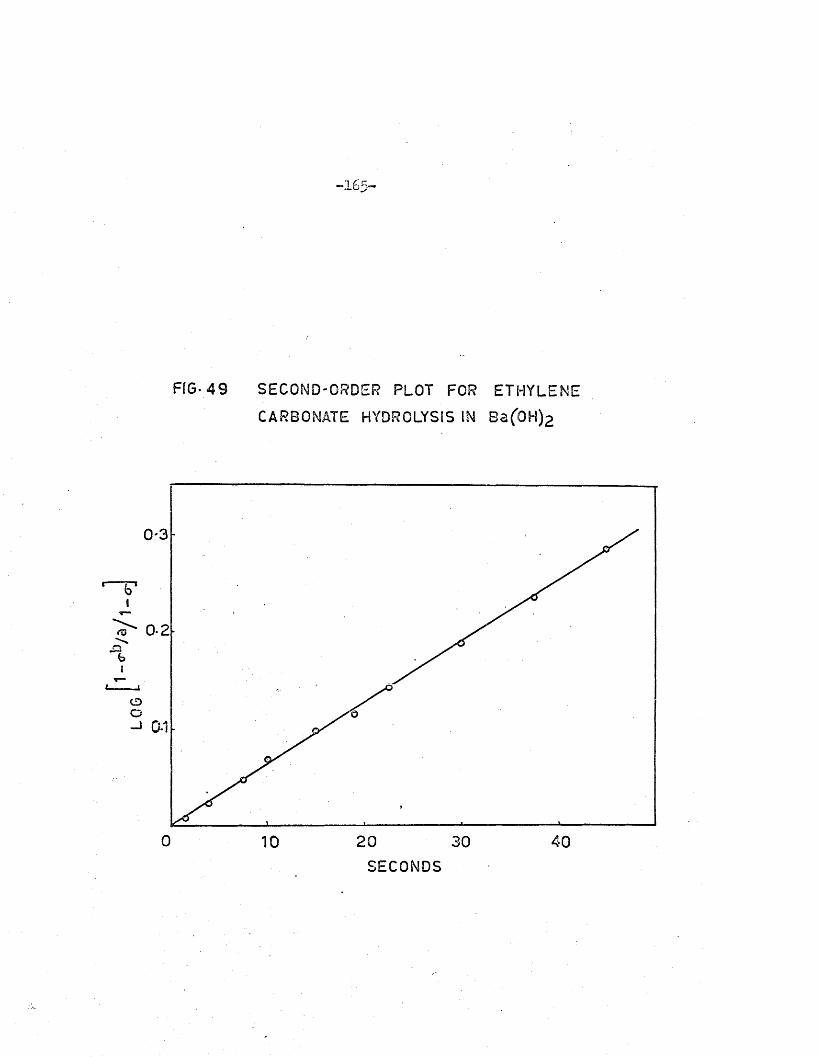
LOG
F IG -49 SECOND-ORDER PLOT FOR ETHYLENE
CARBONATE HYDROLYSIS IN Ba('0H)2
VI
0-2bI
0 20 4030
SECONDS

*-*16
interm ediate in magnitude between those obtained from these two extreme
assumptions* I t would be in te re s tin g to carry out e s te r hydrolysis
with barium hydroxide in a so lu tion previously sa tu ra ted with barium
carbonate*
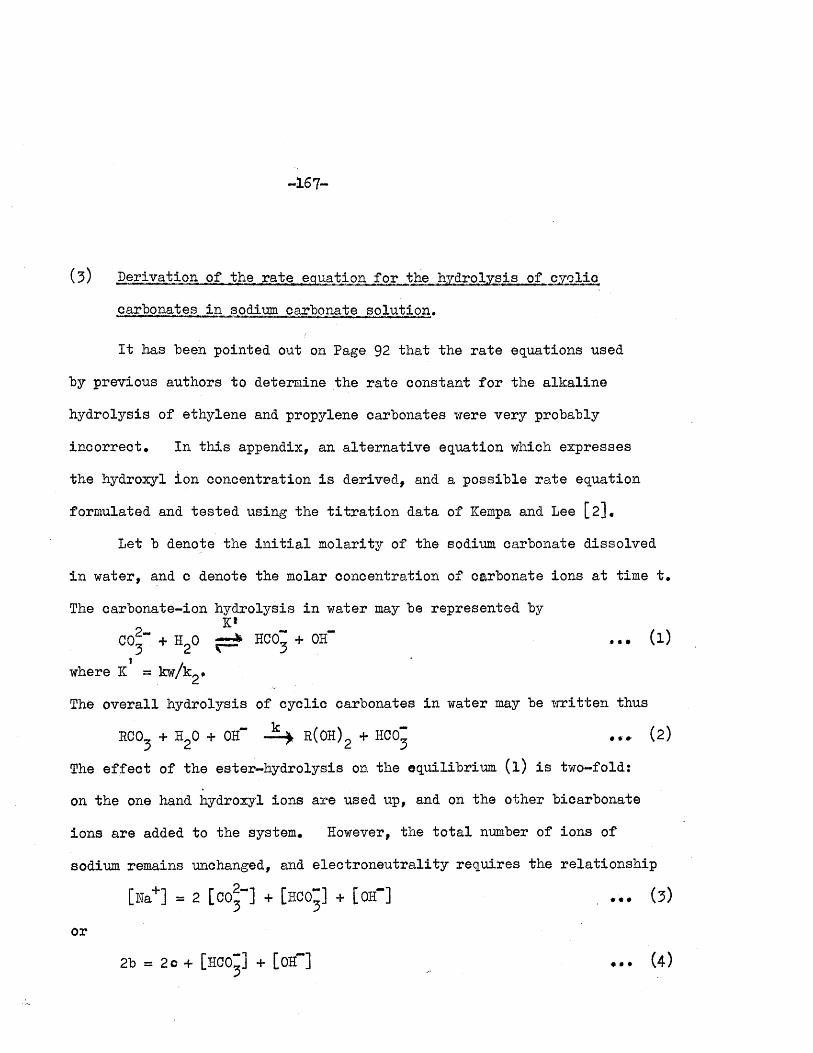
-167-
(3) Derivation of the ra te equation fo r the hydrolysis of cyclic
carbonates in so d im carbonate so lu tio n .
I t has been pointed out on Page 92 th a t the ra te equations used
by previous authors to determine the ra te constant fo r the a lk a lin e
hydrolysis of ethylene and propylene carbonates were very probably
in c o rre c t. In th is appendix, an a lte rn a tiv e equation which expresses
the hydroxyl ion concentration i s derived, and a possib le ra te equation
formulated and te s te d using the t i t r a t i o n data of Kempa and Lee [ 2]#
Let b denote the i n i t i a l m olarity of the sodium carbonate dissolved
in w ater, and c denote the molar concentration of carbonate ions a t time t .
The carbonate-ion hydrolysis in water may be represented byK*
C0^“ + H20 j p * HCOj + OH- . . . ( l )
where K = kw/k2•
The o v e ra ll hydrolysis of cyclic carbonates in water may be w ritten thus
ECO, + H20 + OH" E(OH)2 + HCO" . . . ( 2 )
The e ffe c t of the ester-hydro lysis on the equilibrium ( l ) i s two-fold:
on the one hand hydroxyl ions are used up, and on the other bicarbonate
ions are added to the system. However, the to ta l number of ions of
sodium remains unchanged, and e le c tro n e u tra lity requ ires the re la tio n sh ip
[E a+] = 2 [ C o |“ ] + [ECO"] + [OH- ] . . . . (3)
or
2b = 2 c + [HC0“ ] + [OH- ] . . . ( 4 )
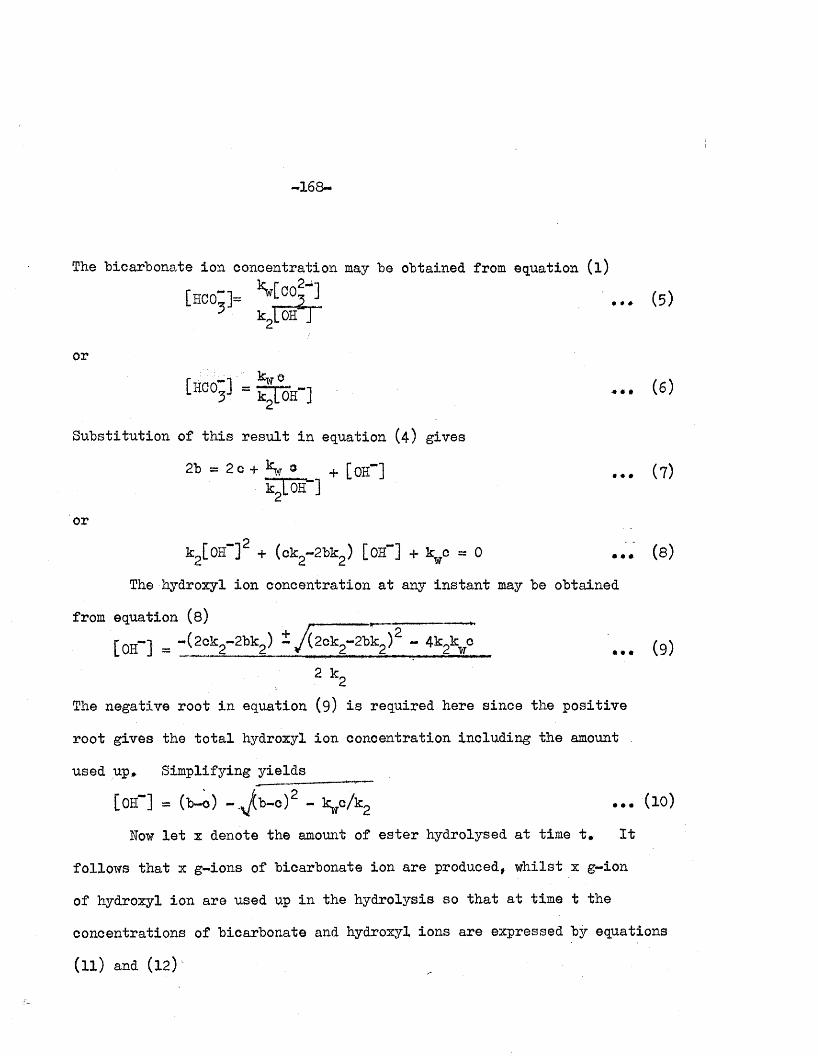
-168-
The bicarbonate ion concentration may "be obtained from equation ( l )
[hco:]= . . . (5 )k2i ™ r
or
[HC03] . . . (6)
S u b stitu tio n of th is re s u lt in equation (4 ) gives
2b = 2c + \ 0 + [OH- ] . . . ( 7)
or.- t2k2[0H~ T + (ok2-2bk2) [0H“ ] + kwc = 0 . . . (8)
The hydroxyl ion concentration a t any in s ta n t may be obtained
from equation (8)
rOH-1 - - ( 2^ 2~ 2bk 2 ) i y f z o y Z M g ) * - 4* 2V (g )
2 k2
The negative roo t in equation (9) i s required here since the p o sitiv e
roo t gives the to ta l hydroxyl ion concentration including the amount
used up* Sim plifying y ie lds
[OH- ] = (b-o) - ^ b - c r - v / k2 ••• ^10)
Now l e t x denote the amount of e s te r hydrolysed a t time t* I t
follows th a t x g-ions of bicarbonate ion are produced, w hilst x g-ion
of hydroxyl ion are used up in the hydrolysis so th a t a t time t the
concentrations of bicarbonate and hydroxyl ions are expressed by equations
( 11) and (12)

^•169**
[HCO“] t = [HCO"]t=o + x . . . (11)
[0H"]t = [0H“ ] t=o - x . . . (12)
sub trac tion of (l2 ) from ( l l ) gives
[HCO"]t - [0H“ ] t = [HCOj]t=o - [0H"]=o + 2x . . . ( l? )
However, a t t=o
^ t = o = [0 H -]t=o
Therefore equation (13) becomes
[HCO- ] - [OH- ] = 2 x . . . (14)
u t i l iz in g equation (4 ) in (14) gives
2b - 2c - 2[0H~] = 2x
or
b - c - [0H~] = x . . . (15)
S u b stitu tio n of th is r e s u lt in the ra te equation
| | = k (a - x ) (OH**) (16)
equation (17) i s obtained
| | = k ( a - b + c + 0H~) (0H~) . . . (17)a tI f the i n i t i a l concentrations of the e s te r and the sodium carbonate are
equal equation (17) s im p lifies to (18)
I t i s possib le to express the hydroxyl ion concentration in terms
of x and constant q u an titie s ; however, the equation becomes very cumbersome
and d i f f ic u l t to in te g ra te , and a graphical so lu tion may be attem pted.
^ = k(c + 0H“ )(0H“ ) . . . ( 11)dt

- 170-
TABLE A6
Hydrolysis of Ethylene Carbonateo ^in Sodium Carbonate a t 25 C.
[E ster] = [Ha2C03] = 0.05692 M
t min. [CO*'] [OH*] dx/dt j [0 +OH-][oH-]i . . . ......... ....... . .. - ..... . .
k !1
„' 1 n t
- -Ii -
11 0.02473 0*00022 4.6 x 10"*| /• j 5 . 4 i 10 85
25■
0.02124'
0.00015 2.7 j 3.1■
87
55! 0.01617 0.00008 1.1 i 1.3:
84
70 0.01506 0.00007 -1!i
95i
0.01284 0.00006 - i
i-
0.01141■
0.00005 i
s1160!
!0.00951
______ _______
0.00004... . . . . . . . ....
-____ . . ..
$
11j . . . . . ....... .... _______
Data published by Kempa and Lee [ 2] ,
* __ - -T,
-1 -1Their value fo r the ra te constant k = 48*8 l.m ole . min •
I t can be rea d ily seen from Table A,6 th a t g rea t accuracy i s required
in determining the carbonate ion concentration a t any in s ta n t in order to
give reasonably accurate values fo r the hydroxyl ion concentration* An
e rro r of 1$ in the carbonate ion concentration i s magnified up to 20$ in the
r a te equation*

-171-
Fur t her, t i t r a t i o n to constant pH (8.3 in the present example) i s only
ju s t i f ie d i f the to ta l carbonate and bicarbonate ion concentration remains
the same. In the present case, th is to ta l concentration of ions i s
increasing with the hydrolysis, becoming twice the i n i t i a l concentration
a t the end of the reac tio n . Therefore, t i t r a t io n to a constant r a t io of
bicarbonate to carbonate introduces a system atic e rro r in expressing the
hydroxyl ion concentration, A considerable increase in the i n i t i a l
a lk a l i carbonate concentration would help to minimize th is e rro r , but
the reac tio n then becomes considerably fa s te r and the t i t r a t i o n method
i s rendered d i f f ic u l t .
All these disadvantages induce one to conclude th a t the Skrabal
technique i s unsu itab le fo r cyclic carbonate e s te r-h y d ro ly sis .

GENERAL CONCLUSIONS
-173-
The work described in th is th e s is has been concerned mainly with
the app lica tion of high frequency conductance measurements to the study
of the rapid hydrolyses of cyclic carbonates.
The high-frequency o s c i l la to r described was found eminently su itab le
fo r following changes in conductances associated with the re la t iv e ly rap id
hydrolyses of some organic e s te rs . ¥ i th appropriate c a lib ra tio n s , the j;;j
apparatus i s also su itab le fo r measurements of absolute conductances ofi i i
e le c tro ly te so lu tions over a usefu l concentration range. I t i s p a r t ic u la r ly ;|* i . i
su itab le fo r processes in which p o la riza tio n or contamination of conventional j;j
e lectrodes render conventional conductance measurements inaccurate or ;j
inconvenient.
Unlike the capac ita tive -type of high frequency o s c i l la to r th is
o s c i l la to r has been found in se n s itiv e to changes in the d ie le c tr ic constant ''
of the liq u id in the c e l l . Determinations of the dependence of ||
conductance and d ie le c tr ic constant of e le c tro ly te so lu tions on frequency !]
has ind icated th a t the d ispersion e ffe c t i s unimportant with regard to
measurements of re a c tio n -ra te s , a t the frequency employed (about 20 M c/s).
Studies of the a lk a lin e hydrolysis of methyl ace ta te a t 25°C by
th is technique yielded a ra te -co n stan t in good agreement with the mean of rj
the many values reported previously. The energy of a c tiv a tio n fo r th is
reac tio n (no t, so f a r as i s known, previously reported) has been measured.
Studies of ethylene and propylene carbonates in a lka line so lu tions j
have shown th a t these e s te rs undergo rap id hydrolysis to produce the f|
-174-
corresponding glycol q u an tita tiv e ly . The ra te constants found fo r th e ir
hydrolyses in excess sodium hydroxide so lu tions d iffe red markedly from
the value previously reported fo r the same hydrolyses in a lk a li carbonate
so lu tio n s . The d ifferences may he ascribed to incomplete rep resen ta tion
by previous authors of the bicarbonate concentration in the ra te equation.
An a lte rn a tiv e equation has been suggested which gives c lo ser r a t e-const ants II
to those obtained in the present work. However, i t i s shown th a t the l j
t i t r a t i o n technique i s in su f f ic ie n tly accurate fo r these determ inations. i i
The decrease in the second-order ra te constant fo r hydro lysis, on |l
su b s titu tio n of a methyl group in ethylene carbonate, i s a ttr ib u te d to the
po lar e ffe c t of the methyl group. This e ffe c t m anifests i t s e l f in a
lowering of the frequency fa c to r , since the energies of a c tiv a tio n fo r 'Ithe hydrolyses of the two e s te rs are approximately the same.
Studies of the a lk a lin e hydrolysis of vinylene carbonate have
ind ica ted d is s im ila r it ie s in the k in e tic s and in the energy of a c tiv a tio n
from those of ethylene and propylene carbonates. The hydrolysis has been
shown to follow ‘f i r s t -o rd e r k in e tic s , with a re la t iv e ly f a s te r r a te , and
with an energy of a c tiv a tio n of about h a lf those of ethylene and propylene
carbonates. These d ifferences are a ttr ib u ta b le to the 7c-bond of the
vinylene group* This seems to f a c i l i t a t e the nucleophilic a ttack of
hydroxyl ions causing the f i r s t stage of the hydrolysis to be f a s te r than
the second, and thus to surrender con tro l of the ra te of the reac tio n .
Determination of the d ie le c tr ic constant of vinylene carbonate a t

-175-
25°C gave a remarkably high value. I t s dipole moment derived from
d ie le c tr ic constant measurements of i t s so lu tion in benzene i s in good
agreement with th a t obtained from microwave stud ies of the vapour phase.
Evaluations of the Kirkwood-Harris-Alder co rre la tio n parameter tg I
(which i s a measure of interm olecular in te rac tio n ) in d ica te increased
hydrogen-bonding, re la tiv e to d ipole-d ipole in te ra c tio n , in vinylene
carbonate.
The a lk a lin e hydrolysis of o-phenylene carbonate i s considerably
f a s te r than th a t of the previous e s te rs . Studies of th is hydrolysis
by the high-frequency o s c i lla to r were rendered inaccurate by the
lim ita tio n s of the apparatus. The osc illograph ic technique fo r studying
th is hydrolysis i s discussed; i t gave an approximate value fo r the r a te -
constant with respect to the e s te r concentration. This technique with
fu r th e r refinem ents i s probably capable of giving accurate values fo r the
ra te -co n stan ts of comparatively f a s t reac tio n s.
- 176-
R E P E R E N C E S
-177-
[1] Kempa And. Lee, J . Chem, Soc., 1938, 1936*
[ 2] Kempa and Lee, J . Chem. Soc., 1959, 1576.
[ 5] Pohoryles, Levin and S are l, J . Chem. Soc,, I960, 3082.
[4 ] S are l, Levin and Pohoryles, J . Chem. Soc., I960, 3079*
[ 5] Levin, Pohoryles and S are l, J . Chem, Soc., 1963, 3949*
[6] Plom and Elving, Analyt, Chem., 1953, 25., 541.
[ 7] Ladd and Lee, Talanta, I960, £,274.
[8J Clayton, Hazel, McNabb and Schnable, Analyt, Chim. Acta,
1956, 14, 269.
[9J Jensen and Parrack, Ind, Eng. Chem., Anal. Ed., 1946, 18. 595.
[10] Blake, G.G., J . Sci. I n s t r , , 1947, ,24.. 101.
[11] R e illy and McCurdy, Analyt* Chem., 1953, 25, 86.
[ 12] Hakano, K . , J . Chem. Soc. Japan, 1954, 75. 773.
[ 13] H all, Gibson, P h ill ip s and C ritc h fie ld , Analyt. Chem*, 1954,
26, 1539.
[ 14] Charles and Pawlikowski, J . Phys. Chem., 1958, 62, 440,
[15] Ermakov, Zagorets, and Smirnov, Russ* J , Phys, Chem., 1962, 625*
[16] Ermakov, Zagorets, and Smirnov, Russ, J , Phys. Chem., 1962, 757.
[ 17] Ermakov and Zagorets, Russ. J . Phys, Chem,, 1962, 881.
[18] Ermakov and Zagorets, Russ. J . Phys. Chem., 1962, 1043.
[19] Zagorets, Smirnov and Ermakov, Russ, J . Phys, Chem*, 1962, 1487.
[ 20] Ermakov and Zagorets, Russ, J . Phys, Chem., 1963, 88.
[21] Ermakov, Smirnov and Zagorets, Russ. J . Phys. Chem., 1963, 280,

-178-
la s trem sk ii, P .S i, Zhur* S truk. K h ii,, 1962, 2 , 279.
L i t t le , V. I . , Proc. Phys* Soc., 1958, 72, 441.
Debye and Falkenhagen, Phys. Z ., 1928, 2£, 121, 401.
Sack, H., Phys. Z,, 1928, 2£, 627
Brendel, M itte ls trae d t, and Sack, Phys. Z ., 1929* 10, 576.
Falkenhagen, L eist and Kelbg, Ann, d, Phys. 1952, 11, 51•
Falkenhagen and Kelbg, Z. Electrochem,, 1952, 56, 834#
Falkenhagen and Kelbg, Z. Phys. Chem, 1953, 202,, 56.
Falkenhagen, H,, Wiss. Ann., 1953, 8, 465.
L e is t, Wiss. Z ., Univ. Rostock, 1953, 2, 187#
Fuoss and Accascina, "E lec tro ly tic Conductance", In tersc ience
P ub lishers, 1959, p . 203.
Shedlovsky, T ,, J . Am. Chem. Soc., 1932, 54. 1411*
S iv ertz , V ., J . Am, Chem. Soc., 1940, § 2 , 1379,
Gunning and Gordon, J . Chem. Phys., 1942, 10. 126.
Darken and Meier, J . Am. Chem. Soc., 1942, 6£, 621.
Wien, M,, Phys. Z ., 1930, 11, 793i 1931, 12, 183; Ann, d. Phys.
1931, 11, 429.
T e ile r and Ginsberg, J . Chem. Phys,, 1956, 25., 783.
Haggis, Hasted and Buchanan, J . Chem. Phys., 1952, 20, 1452.
Shurtt and Rogen, Proc. Roy. Soc., 1936, 157A, 359.
Dunning and Shutt, Trans, Faraday Soc., 1938, 14, 467.
Skrabal and Baltadschiewa, Monatsh, 1924, 95.
Bruson and Hooper, U.S. Patent 2, 1951, 570201*
Wijs, J . J . , Z eitsch r. Phys. Chem., 1895, 11, 492.
de Hemptinne, A., Z e itrsch r. Phys. Chem., 1894, 12# 561.
van Dijken, B ., Rec. Trav. Chim., 1895, 14. 106.
Hantzsch, A., B er., 1899. 52. 5066.
Walker, J . , Proc. Roy. Soc., 1906, 78A, 157.
Wood, J .K ., J . Chem. Soc., 1906, 89, 1851.
Smith and Olsson, Z. Phys. Chem,, 1925, 99, 118.
Halonen, E.A., Acta. Chem, Scand,, 1956, 10. 485*
Fleury and Lange, J . Pharm, Chim, 1955, 17, 107*
P riva te Communications,
M illar and Case, J . Am. Chem, Soc,, 1955, £2, 810.
Cowdrey, Hughes, Ingold, Masterman and S co tt, J . Chem. Soc
1957, 1252
Steimmig and Wittwer, German Paten t, 1928, 516281.
Steimmig and Wittwer, U.S. P aten t, 1907891.
Newman and’ Addor, J . Am, Chem. Soc,, 1955, 2!5, 1265*
Newman and Addor, J . Am. Chem. Soc., 1955, XLt 5789
Id r is Jones, J . Chem. Soc., 1957, 618.
Slayton, Simmons and Goldstein, J , Chem, Phys,, 1954, 22.
Johnson and Patton , J . Org. Chem., I960, .25. 1042.
F ield and Schaefgen, J . Poly. S c i., 1962, j>8, 555-
Bender, B er., 1880, 3/5, 697.
t
1678,
-180—
[ 65] R iedell, J .D ., German P aten t, 264012,
[66] Mecke, R ,, Z e its c h r if t Naturforsch, 1955, K)b, 367*
[67] Walker, E .E ., J . Appl* Chem., 1952, 2, 470,
[68] Kirkwood, J . Chem, Phys,, 1939, X* 911*
[69] H arris and Alder, J . Chem, Phys,, 1953, 21, 1031.
[ 70] Stokes and Robinson, "E lectro ly te Solu tions", Butterworths
Sci, Pub) 1955, p .9.
[71] Vogel, A .I ., "P rac tica l Organic Chemistry" Longmns, London,
1948, p « l6 l,
[ 72] Pew, Smith and W itten, Trans. Paraday Soc., 1947, 43. 374*
[73] Kempa, R, to be published.
[ 74] Smith, J.W ., "E lec tric Dipole Moments", Biitterworths Sci*
Pub., 1955, p . 47*
[ 75] Sudgen, J , Chem. Soc., 1950, 770.
[ 76] Guggenheim, E.A., Trans, Paraday Soc., 1949, 4J5, 714*
[77] Seward and V ierra,. J . Phys. Chem,, 1958, 62, 129,
[ 78] Swinborne,* E .S ., J . Chem, Soc,, I960, 2371.
[79] Penton and Jackson, J . Chem, Soc., 1899, 75, 575*
[80] Haaamet, L .P ., "Physical Organic Chemistry", McGraw-Hill,
1940, p. 211.
[81] Einhorn and Lindenberg, Ann, d. Chim,, 1898, .300. 141*
-181-
[82] Nachfolger, German Patent 72806,
[83] Staab, H.A, German Patent 1058510
[84] Hanslick, Bruce and M uscitti, Org, Syn., 1955, 74*
[85] P ries and Weissberger, "Techniques of Organic Chemistry",
Vol, 8, In tersc ience P ublishers, 1953, p* 669*
[86] Pindlay, A, "P rac tica l Physical Chemistry", Longmans 1959,
p , 206*