High-concentration solar dishes based on pneumatic ... · E Young’s modulus f focal length h...
12
High-concentration solar dishes based on pneumatic reflecting membranes Fabian Da ¨hler a , Gianluca Ambrosetti b , Javier A. Montoya-Zegarra c , Konrad Schindler c , Aldo Steinfeld a,⇑ a ETH Zurich, Dept. of Mechanical and Process Engineering, 8092 Zurich, Switzerland b Airlight Energy Manufacturing SA, Via Industria 10, 6710 Biasca, Switzerland c ETH Zurich, Dept. of Civil, Environmental and Geomatic Engineering, 8093 Zurich, Switzerland Received 28 August 2015; received in revised form 11 November 2015; accepted 19 November 2015 Communicated by: Associate Editor Michael Epstein Abstract The ability of pressurized circular membranes to approximate a paraboloid of revolution is investigated with the goal of designing a high-precision and lightweight solar dish concentrator. The optical performance of elastic and elasto-plastic deforming membrane mate- rials is thoroughly analyzed by means of finite element structural modelling combined with Monte Carlo ray-tracing simulations using the yield strength, elastic modulus, and tangent modulus as parameters. The simulation results are verified experimentally by accurate scans of PET and aluminum membranes. They reveal that elasto-plastically deforming membranes can reach a peak concentration ratio of 3070 at a rim angle of 20° – a 14-fold value vis-a `-vis that of conventional elastic membranes – while keeping strains at reasonable low level. Anisotropy detrimentally affects the aluminum membrane’s performance, but optimal overstretching in the plastic regime can fur- ther boost its peak concentration ratio. Ó 2015 Elsevier Ltd. All rights reserved. Keywords: Solar dish; Membrane; High concentration; Elasto-plastic deformation 1. Introduction Because of their lightweight and easy packing, pneu- matic (inflated) membranes are applied as concentrators in space applications for antennas and telescopes (Jenkins, 2001, 2006), and in solar energy applications for parabolic trough (Bader et al., 2009, 2011) and dish sys- tems (Schlaich, 1999; Zanganeh et al., 2012). For example, a 3 MW solar pilot plant in Ait Baha, Marocco, uses 6000 m 2 of active surface with pneumatic membranes for parabolic trough concentrators (Airlight Energy, 2015). In the standard approach, a reflective film is clamped to a circular support frame and a slight vacuum is applied to deform it as close as possible to a paraboloidal shape. However, the shape obtained by this procedure is in gen- eral not parabolic and leads to serious spherical aberra- tions (Meinel and Meinel, 2000). Current 3D solar concentrators based on pneumatic membranes suffer from limited concentration beyond very small rim angles, and thus require multiple facet designs (Zanganeh et al., 2012). This article discusses challenges encountered with these kind of solar concentrators and presents a novel ave- nue with elasto-plastic membranes, which significantly improves their performance. To evaluate each design, the deflection of the membranes is simulated using finite http://dx.doi.org/10.1016/j.solener.2015.11.021 0038-092X/Ó 2015 Elsevier Ltd. All rights reserved. ⇑ Corresponding author. E-mail address: [email protected] (A. Steinfeld). www.elsevier.com/locate/solener Available online at www.sciencedirect.com ScienceDirect Solar Energy 124 (2016) 89–100
Transcript of High-concentration solar dishes based on pneumatic ... · E Young’s modulus f focal length h...

Available online at www.sciencedirect.com
www.elsevier.com/locate/solener
ScienceDirect
Solar Energy 124 (2016) 89–100
High-concentration solar dishes based on pneumaticreflecting membranes
Fabian Dahler a, Gianluca Ambrosetti b, Javier A. Montoya-Zegarra c, Konrad Schindler c,Aldo Steinfeld a,⇑
aETH Zurich, Dept. of Mechanical and Process Engineering, 8092 Zurich, SwitzerlandbAirlight Energy Manufacturing SA, Via Industria 10, 6710 Biasca, Switzerland
cETH Zurich, Dept. of Civil, Environmental and Geomatic Engineering, 8093 Zurich, Switzerland
Received 28 August 2015; received in revised form 11 November 2015; accepted 19 November 2015
Communicated by: Associate Editor Michael Epstein
Abstract
The ability of pressurized circular membranes to approximate a paraboloid of revolution is investigated with the goal of designing ahigh-precision and lightweight solar dish concentrator. The optical performance of elastic and elasto-plastic deforming membrane mate-rials is thoroughly analyzed by means of finite element structural modelling combined with Monte Carlo ray-tracing simulations usingthe yield strength, elastic modulus, and tangent modulus as parameters. The simulation results are verified experimentally by accuratescans of PET and aluminum membranes. They reveal that elasto-plastically deforming membranes can reach a peak concentration ratioof 3070 at a rim angle of 20� – a 14-fold value vis-a-vis that of conventional elastic membranes – while keeping strains at reasonable lowlevel. Anisotropy detrimentally affects the aluminum membrane’s performance, but optimal overstretching in the plastic regime can fur-ther boost its peak concentration ratio.� 2015 Elsevier Ltd. All rights reserved.
Keywords: Solar dish; Membrane; High concentration; Elasto-plastic deformation
1. Introduction
Because of their lightweight and easy packing, pneu-matic (inflated) membranes are applied as concentratorsin space applications for antennas and telescopes(Jenkins, 2001, 2006), and in solar energy applications forparabolic trough (Bader et al., 2009, 2011) and dish sys-tems (Schlaich, 1999; Zanganeh et al., 2012). For example,a 3 MW solar pilot plant in Ait Baha, Marocco, uses6000 m2 of active surface with pneumatic membranes forparabolic trough concentrators (Airlight Energy, 2015).
http://dx.doi.org/10.1016/j.solener.2015.11.021
0038-092X/� 2015 Elsevier Ltd. All rights reserved.
⇑ Corresponding author.E-mail address: [email protected] (A. Steinfeld).
In the standard approach, a reflective film is clamped toa circular support frame and a slight vacuum is appliedto deform it as close as possible to a paraboloidal shape.However, the shape obtained by this procedure is in gen-eral not parabolic and leads to serious spherical aberra-tions (Meinel and Meinel, 2000). Current 3D solarconcentrators based on pneumatic membranes suffer fromlimited concentration beyond very small rim angles, andthus require multiple facet designs (Zanganeh et al.,2012). This article discusses challenges encountered withthese kind of solar concentrators and presents a novel ave-nue with elasto-plastic membranes, which significantlyimproves their performance. To evaluate each design, thedeflection of the membranes is simulated using finite

Nomenclature
Latin characters
A areac constant in parabola equation c = 1/(4f)c clamping pointCg;95 geometric concentration ratio at 95% interceptD membrane diameterE Young’s modulusf focal lengthh membrane thicknessp pressurer radiusR membrane radiusw vertical displacementz vertical axiszrec vertical distance between rim and receiver
Greek characters
e straine0 prestrainh angular subtense of sun (4.65 mrad)r stressr0 prestressm Poisson’s ratio/rim rim angle
Subscriptsc center of membraneg geometrici at inner sideo at outer side
90 F. Dahler et al. / Solar Energy 124 (2016) 89–100
element structural analysis with ANSYS� MechanicalAPDL (ANSYS Mechanical APDL Release, 2013). Theoptical characteristics are then determined by Monte Carlo(MC) ray-tracing using an in-house software code(Petrasch, 2010). A prototype solar dish is used to experi-mentally validate the simulation model by measuring theshape of PET and aluminum membranes with a high-precision optical scanning system. The performance ofthe different designs is compared by means of the solarconcentration ratio.
Fig. 1. Cross-section of a membrane dish concentrator. Indicated are theradial r and vertical z axes, dish radius R, membrane area A1, centraldeflection wc, rim angle /rim, shortest distance between rim and centeralong the membrane l, and half sun angle of incident sunrays h.
2. Pneumatic membrane as solar concentrator
The schematic of a single reflective membrane clampedto a circular supporting frame under vacuum is illustratedin Fig. 1. Indicated are the radial r and vertical z axes, dishradius R (D ¼ 2R), membrane area A1, central deflectionwc, rim angle /rim, shortest distance between rim and centeralong the membrane l, and half sun angle subtended byincident sunrays h = 4.65 mrad. /rim is defined as the anglebetween the axis of revolution z and the line connecting thereceiver center and concentrator rim. If D/h P 80, themembrane is devoid of bending rigidity (Ventsel andKrauthammer, 2001). If wc=h > 5, in-plane stresses are pre-dominant and bending moments become negligible(Ventsel and Krauthammer, 2001). These criteria hold for/rim > 1� for all membranes discussed in this work, pro-vided some restrictions are considered for the clampingof the membrane as discussed in Section 4. Previous studies(Lyman and Houmard, 1963; Vaughan, 1980; Barton andWinger, 2009; Zanganeh et al., 2012) considered reflectiveplastic films, especially metallized PET films, because oftheir low cost and robustness. They exhibit a purely elasticbehavior for most of the rim angles usually obtained in
membrane concentrators. For small deflections, isotropicmembranes in the elastic regime generate a profile shape– the so-called ‘‘Hencky surface” – that can be describedanalytically by a series expansion derived by Hencky(1915). Generalizations were derived for initially tensionedmembranes (Campbell, 1956; Wilkes, 1998) and for largedeflections (Fichter, 1997).
2.1. Difference to the paraboloid of revolution
The paraboloid of revolution provides the theoreticalmaximum concentration ratio for a concave concentrator
C ¼ sin2ð2/rimÞ=sin2ð2hÞ (not including obstruction byreceiver) (Harper et al., 1976; Winston et al., 2005). It isthus of interest to compare the 3D shape of pneumatic

F. Dahler et al. / Solar Energy 124 (2016) 89–100 91
mirrors to the parabolic shape. Assuming rotational sym-metry for isotropic membrane materials, it is sufficient toconsider the 2D radial profile, where a and c are freely cho-sen to match the parabola to the membrane profile. We fixthe first parameter by equating the two profiles at the rim.The second parameter is fixed by determining the receiverposition zrec that yields the highest concentration ratio forthe membrane and choose the parabola with the same/rim. Note that the optimal receiver position is not exactlyat the paraxial focus because incident sunrays subtend hand, thus, the concentrated radiation is distributed withina certain angular subtense (Cooper et al., 2014).
An elastic membrane profile was obtained by FEM sim-ulations with the following membrane parameters: Young’smodulus E = 5 GPa, Poisson’s ratio m = 0.38, ratio D/h = 87,000, prestrain e0 = 0.01%. Fig. 2a shows the differ-ence between elastic membrane and parabolic profilesalong r at /rim ¼ 20�. This curve is commonly referred toas the w-curve (Thomas and Veal, 1991; Marker andJenkins, 1997) due to its shape when plotted across the fulldiameter. The membrane profile lies above the parabolicone towards the center of the concentrator; the oppositeis true towards the rim. Thus, greater deflection in the cen-ter of the membrane is required. Comparison in terms oftheir ability to concentrate incident sunlight is performedby determining the geometric concentration ratio Cg;95 atthe intercept factor of 95%, as 5% spillage losses is toler-ated to reduce the influence of the tails in the flux distribu-tions at the focal (receiver) plane. Cg;95 for the elasticmembrane is assessed by MC (Petrasch, 2010). The receiverconsists of a flat disk with its center at the axis of symme-try. The concentrator is assumed to be uniformly illumi-nated across the full aperture; thus, the receiver’s shadowcast on the mirror is not taken into account. The incidentsolar radiation is modelled to subtend a half sun angleh = 4.65 mrad. Results are plotted in Fig. 2b, which showsCg;95 versus /rim. Peak Cg;95 = 205 occurs at relatively low/rim = 12�, while in theory ideal concave mirrors achievetheir maximum concentration for full interceptCg;100 = 11,600 at /rim = 45� (Harper et al., 1976;
Fig. 2. (a) Vertical displacement difference between elastic membrane and pintercept versus rim angle for an elastic membrane. Membrane parameters: E
Winston et al., 2005). This large discrepancy calls for sig-nificant improvements to the purely elastic single mem-brane, a fortiori as advanced applications would requiresolar concentration ratios exceeding 1000 suns, such asultra-high-concentration photovoltaics (Algora and Rey-Stolle, 2012), solar dish Stirling engines (Mancini et al.,2003), solar gas turbines (Pozivil et al., 2015), and solarthermochemical fuels (Romero and Steinfeld, 2012). Forthe latter high-temperature applications, high concentra-tion leads to lower the re-radiation losses through smallerreceiver apertures and, consequently, higher solar energyconversion efficiencies.
2.2. Maximum deformation of membrane
A further limitation is imposed by the strains that occurdue to the surface area increase during deformation froman initially flat membrane to the desired shaped. The mem-brane’s ultimate tensile strength sets strict limits on /rim.Fig. 3a shows the average values for area increase DA=A0
and radial strain er as a function of /rim for an initially flatmembrane with surface area A0 that is assumed to bedeformed to a perfect paraboloid of revolution with surfacearea A1(Fig. 1). Along the radial direction, the membrane isstretched from an initial radius R to a final length l. Thestrain and the area increase are then given by:
er ¼ lnlR
� �¼ ln
1
2u
ffiffiffiffiffiffiffiffiffiffiffiffiffiu2 þ 1
pþ uþ arcsin hðuÞ
� �� �ð1Þ
DAA0
¼ A1 � A0
A0
¼ 2
3u2u2 þ 1� �3=2 � 1� �
� 1 ð2Þ
with u � 2cR � tanð/rim=2Þ. Derivation of these formulaeis given in Appendix A.
The achievable /rim of a single membrane concentratorlargely depends on the maximum strain a material can bearwithout fracturing. However, high strains can becomeproblematic even if the membrane does not fracture. Forexample, loss of reflectivity at high strains has beenreported for coated membrane materials such as PET(Meinel and Meinel, 2000; Barton and Winger, 2009).
arabolic profile vs. radius at /rim ¼ 20�. (b) Concentration ratio at 95%¼ 5 GPa, m = 0.38, D/h = 87,000, e0 = 0.01%.

Fig. 3. (a) Strain and area increase versus rim angle for an initially flat membrane that is deformed to a perfect paraboloid of revolution. (b) Concentrationratio at 95% intercept versus prestrain for a perfectly elastic membrane. Membrane parameters: E = 5 GPa, m = 0.38, D/h = 87,000, /rim ¼ 20�.
Fig. 5. Concentration ratio at 95% intercept factor as a function of therim angle for aluminum and perfectly elastic membranes. Also indicated isthe concentration ratio for a perfect paraboloid of revolution. Thealuminum line is dashed for /rim > 30� because this range is not accessiblein practice due to fracturing.
92 F. Dahler et al. / Solar Energy 124 (2016) 89–100
Further complication pertinent to high strains is given bycreep. High strains may be partially avoided or fully elim-inated by pre-shaping the membrane (Meinel and Meinel,2000) or welding multiple membrane segments (Frieseet al., 1983; Thomas and Veal, 1984). A simple methodto increase concentration is by straining the membranebefore inflation (prestrain), which in theory yields a perfectparabolic shape for very large e0 (Appendix B). Fig. 3bshows Cg;95 versus e0. To achieve high concentration, asignificant amount of prestrain is required, worsening thedifficulties aforementioned.
3. Elasto-plastic membranes
Alternatively, membranes that easily reach the plasticregime, such as metal sheets, are considered. For a realisticsimulation, the properties of commercially available sil-vered aluminum sheets (MIRO High Reflective 95 by Ala-nod Solar) are used. Fig. 4 shows the stress–strain data ofthese sheets that were experimentally obtained in traction
Fig. 4. Stress–strain curves for aluminum and PET membranes. Theultimate strengths indicated correspond to the average across all samplesmeasured. Experimental data obtained in traction measurements (Appen-dix D).
measurements (see Appendix D). Since the measured sheetsare anisotropic, a directionally averaged curve is used inthe simulations for isotropic materials. A slight prestrainof e0 = 0.01% is assumed for all simulations.
3.1. Elasto-plastic versus elastic membranes
Cg;95 is plotted as a function of /rim for aluminum andperfectly elastic membranes in Fig. 5. Also indicated isthe curve for a perfect paraboloid of revolution. The alu-minum line is dashed for /rim > 30� because this range isnot accessible in practice due to fracturing. Plastic defor-mation strongly affects Cg;95 at high /rim. As long as thereis no or little plastic strain in the aluminum membrane,the difference in Cg;95 is marginal up to /rim ¼ 10�. Theeffect of plastic deformation on the radial strain profile isshown in Fig. 6. Towards the center of the membrane,where the membrane profile lies above the parabolic one(see Fig. 2a), additional strain and thus additional vertical
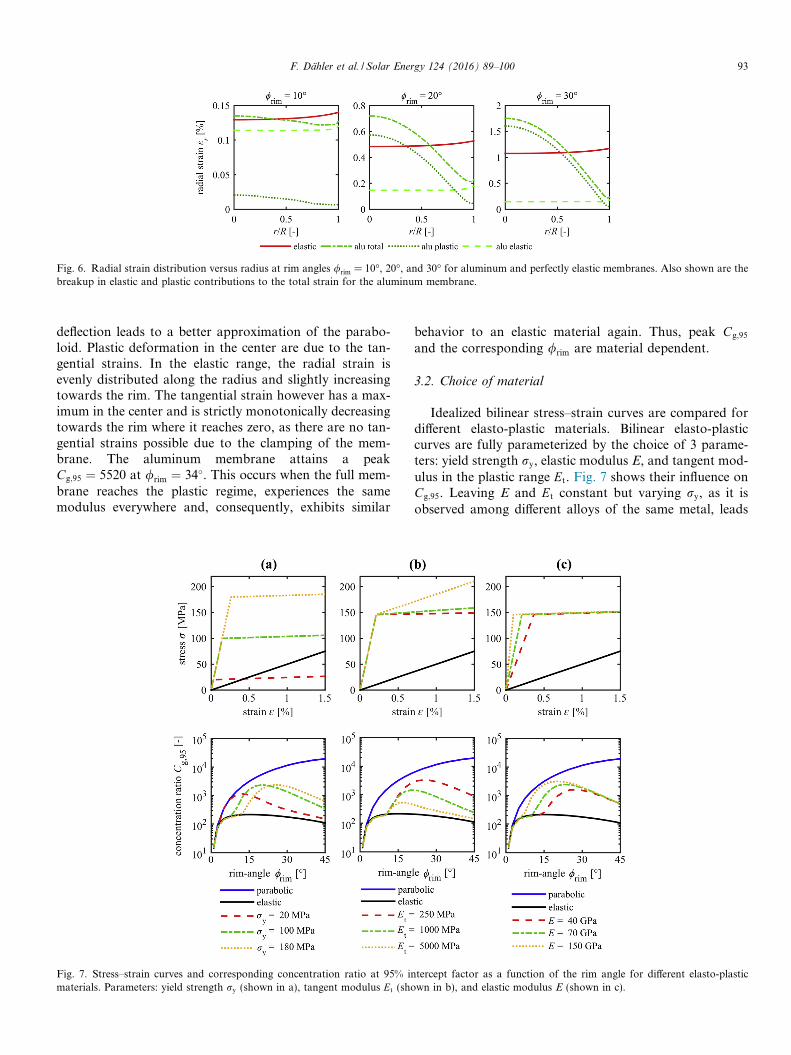
Fig. 6. Radial strain distribution versus radius at rim angles /rim = 10�, 20�, and 30� for aluminum and perfectly elastic membranes. Also shown are thebreakup in elastic and plastic contributions to the total strain for the aluminum membrane.
F. Dahler et al. / Solar Energy 124 (2016) 89–100 93
deflection leads to a better approximation of the parabo-loid. Plastic deformation in the center are due to the tan-gential strains. In the elastic range, the radial strain isevenly distributed along the radius and slightly increasingtowards the rim. The tangential strain however has a max-imum in the center and is strictly monotonically decreasingtowards the rim where it reaches zero, as there are no tan-gential strains possible due to the clamping of the mem-brane. The aluminum membrane attains a peakCg;95 ¼ 5520 at /rim ¼ 34�. This occurs when the full mem-brane reaches the plastic regime, experiences the samemodulus everywhere and, consequently, exhibits similar
Fig. 7. Stress–strain curves and corresponding concentration ratio at 95% inmaterials. Parameters: yield strength ry (shown in a), tangent modulus Et (sho
behavior to an elastic material again. Thus, peak Cg;95
and the corresponding /rim are material dependent.
3.2. Choice of material
Idealized bilinear stress–strain curves are compared fordifferent elasto-plastic materials. Bilinear elasto-plasticcurves are fully parameterized by the choice of 3 parame-ters: yield strength ry, elastic modulus E, and tangent mod-ulus in the plastic range Et. Fig. 7 shows their influence onCg;95. Leaving E and Et constant but varying ry, as it isobserved among different alloys of the same metal, leads
tercept factor as a function of the rim angle for different elasto-plasticwn in b), and elastic modulus E (shown in c).

Fig. 8. Difference between the aluminum membrane and parabolicprofiles as a function of radius for strong, optimized, and noneoverstretching. Also shown is the case of a purely elastic membrane.
94 F. Dahler et al. / Solar Energy 124 (2016) 89–100
to a shift of Cg;95 along /rim. The magnitude of the maxi-mum Cg;95 is affected only slightly by ry, but mainly byEt, where low values are favorable for high concentration
Fig. 9. Scheme of the 0.5 m-dia prototype dish. The membrane was clamped benuts. Two membranes types were tested: (1) a 23 lm-thick PET film; and (2)
Fig. 10. Top: central vertical displacement as a function of the pressure differemeasurements. Bottom: the corresponding difference between the membrane aaluminum membrane; and (c) overstretched aluminum membrane.
ratios and by E, where the opposite is true. Et has no influ-ence on /rim at which the plastic deformation starts tooccur as it is not affecting the yield point. Increasing E
results in lower strain at ry (see Fig. 7c); therefore yieldingand thus higher concentrations occur at lower /rim. Bestresults are obtained for an ideal plastic membrane withE ! 1 and Et ! 0. In fact, it can be shown theoreticallythat a perfect rigid-plastic membrane yields a parabolicshape (Appendix C).
3.3. Overstretching
Under certain conditions, overstretching of the mem-brane leads to a better approximation of a paraboloid.The straightforward approach is to inflate a membraneby increasing the pressure difference until the desired finaldeflection at the center wc;final is reached. When overstretch-ing a membrane, the pressure is first increased up to adeflection wc;overstretch > wc;final and then released untilwc;final is obtained. The additional plastic deformation dueto overstretching (or ‘‘pre-shaping”) under controlled
tween a steel vacuum chamber and a steel ring tightened to the chamber bya 200 lm-thick aluminum sheet.
nce across the scanned membrane, numbered in chronological order of thend parabolic profiles. Results are presented for: (a) PET membrane; (b)

F. Dahler et al. / Solar Energy 124 (2016) 89–100 95
conditions can be favorable because it occurs mainly in thecenter of the membrane where additional strain is neededto approximate a parabolic profile, and because the finalpressure on the membrane is reduced significantly due tothe lower elastic strains.
Fig. 8 shows the effect of overstretching. The differencebetween the aluminum membrane and parabolic profilesis plotted as a function of radius for a membrane thatunderwent strong, optimized, and none overstretching. Inall cases, the final membrane shape is chosen such thatwc;final matches the deflection of a paraboloid with/rim ¼ 20�. Also shown is the case of a purely elastic mem-brane. For the case of non-overstretching, the membraneprofile falls below the parabolic one. The opposite is truefor the case of strong overstretching. For the optimizedcase, Cg;95 increases from 730 (none) to 2710. If theconstraint of vertical displacement (wc;final) is dropped,optimized overstretching can yield Cg;95 ¼ 3070 at/rim = 20�.
Fig. 11. Difference between the scanned membrane and the paraboloid ofrevolution across whole dish for; (a) PET membrane at Dp = 2.6 kPa; (b) anon-overstretched aluminum membrane at Dp = 25 kPa; and an over-stretched (with Dp ¼ 40 kPa) aluminum membrane at Dp ¼ 25 kPa.
4. Experimental validation
4.1. Prototype
A prototype dish of 0.5 m diameter was fabricated. It isshown schematically in Fig. 9. The membrane was clampedbetween a steel vacuum chamber and a steel ring tightenedto the chamber by nuts. Vacuum underneath the mem-brane was generated by a mechanical vacuum pump andfinely regulated with a pressure controller (Bronkhorst,EL-PRESS). Two membranes were tested: (1) a 23 lm-thick PET film1; and (2) a 200 lm-thick aluminum sheet.2
Measured stress–strain data for both membranes is pro-vided in Appendix D. The chosen clamping did not allowrotational freedom of the foils at the rim (in contrast tothe simulations). For stiffer membranes, this leads to anunwanted bending of the membrane near the rim. Whereasfor the thin PET membranes the effect is negligible, concen-tration reductions of up to 10% were observed in simula-tions for the thicker aluminum membranes.
4.2. Shape determination
The pressure difference across the membrane was stabi-lized at different levels. The resulting shape of the mem-brane at each pressure level was then determined byoptical triangulation with a fringe projection system(ATOS Core 300 by GOM mbH) and processing in com-mercial reverse engineering software (Geomagic Studio�
Geomagic Studio, 2014). The measurements requiredwhite coating of the membranes to avoid specular reflec-tion. To assess the accuracy of the scanning system, a
1 Lumirror U50 by Toray Plastics with reflective aluminum coating(Appendix D).2 MIRO High Reflective 95 by Alanod Solar (Appendix D).
heavily pre-stressed PET membrane was scanned inunpressurized state. The measured data across the fullarea indicated a maximum deviation of 43 lm and a stan-dard deviation of 7 lm from a plane. Each of the mea-sured membrane profiles was compared to thecorresponding ideal parabolic profile: at each measure-ment point, a parabola with the same central deflectionwc was matched to the scanned profile and the differencebetween membrane and ideal paraboloid along the radialdirection was extracted.
Fig. 10 (top) shows the central vertical displacement as afunction of the pressure difference across the membrane,and (bottom) the corresponding difference between themembrane and parabolic profiles as a function of radius,for both PET and aluminum membranes. For PET mem-branes (Fig. 10a), increasing pressure led to increased wc
and larger difference to the parabolic profile. For the range
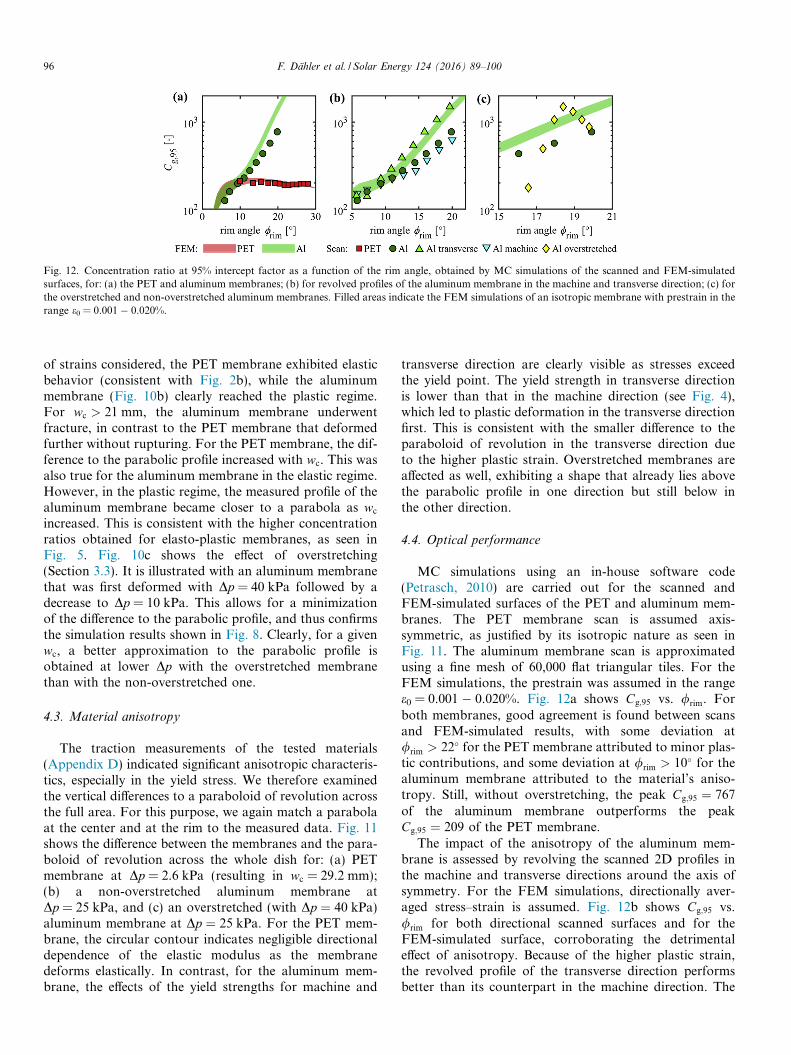
Fig. 12. Concentration ratio at 95% intercept factor as a function of the rim angle, obtained by MC simulations of the scanned and FEM-simulatedsurfaces, for: (a) the PET and aluminum membranes; (b) for revolved profiles of the aluminum membrane in the machine and transverse direction; (c) forthe overstretched and non-overstretched aluminum membranes. Filled areas indicate the FEM simulations of an isotropic membrane with prestrain in therange e0 = 0.001 � 0.020%.
96 F. Dahler et al. / Solar Energy 124 (2016) 89–100
of strains considered, the PET membrane exhibited elasticbehavior (consistent with Fig. 2b), while the aluminummembrane (Fig. 10b) clearly reached the plastic regime.For wc > 21 mm, the aluminum membrane underwentfracture, in contrast to the PET membrane that deformedfurther without rupturing. For the PET membrane, the dif-ference to the parabolic profile increased with wc. This wasalso true for the aluminum membrane in the elastic regime.However, in the plastic regime, the measured profile of thealuminum membrane became closer to a parabola as wc
increased. This is consistent with the higher concentrationratios obtained for elasto-plastic membranes, as seen inFig. 5. Fig. 10c shows the effect of overstretching(Section 3.3). It is illustrated with an aluminum membranethat was first deformed with Dp = 40 kPa followed by adecrease to Dp = 10 kPa. This allows for a minimizationof the difference to the parabolic profile, and thus confirmsthe simulation results shown in Fig. 8. Clearly, for a givenwc, a better approximation to the parabolic profile isobtained at lower Dp with the overstretched membranethan with the non-overstretched one.
4.3. Material anisotropy
The traction measurements of the tested materials(Appendix D) indicated significant anisotropic characteris-tics, especially in the yield stress. We therefore examinedthe vertical differences to a paraboloid of revolution acrossthe full area. For this purpose, we again match a parabolaat the center and at the rim to the measured data. Fig. 11shows the difference between the membranes and the para-boloid of revolution across the whole dish for: (a) PETmembrane at Dp = 2.6 kPa (resulting in wc = 29.2 mm);(b) a non-overstretched aluminum membrane atDp = 25 kPa, and (c) an overstretched (with Dp ¼ 40 kPa)aluminum membrane at Dp ¼ 25 kPa. For the PET mem-brane, the circular contour indicates negligible directionaldependence of the elastic modulus as the membranedeforms elastically. In contrast, for the aluminum mem-brane, the effects of the yield strengths for machine and
transverse direction are clearly visible as stresses exceedthe yield point. The yield strength in transverse directionis lower than that in the machine direction (see Fig. 4),which led to plastic deformation in the transverse directionfirst. This is consistent with the smaller difference to theparaboloid of revolution in the transverse direction dueto the higher plastic strain. Overstretched membranes areaffected as well, exhibiting a shape that already lies abovethe parabolic profile in one direction but still below inthe other direction.
4.4. Optical performance
MC simulations using an in-house software code(Petrasch, 2010) are carried out for the scanned andFEM-simulated surfaces of the PET and aluminum mem-branes. The PET membrane scan is assumed axis-symmetric, as justified by its isotropic nature as seen inFig. 11. The aluminum membrane scan is approximatedusing a fine mesh of 60,000 flat triangular tiles. For theFEM simulations, the prestrain was assumed in the rangee0 = 0.001 � 0.020%. Fig. 12a shows Cg;95 vs. /rim. Forboth membranes, good agreement is found between scansand FEM-simulated results, with some deviation at/rim > 22� for the PET membrane attributed to minor plas-tic contributions, and some deviation at /rim > 10� for thealuminum membrane attributed to the material’s aniso-tropy. Still, without overstretching, the peak Cg;95 ¼ 767of the aluminum membrane outperforms the peakCg;95 ¼ 209 of the PET membrane.
The impact of the anisotropy of the aluminum mem-brane is assessed by revolving the scanned 2D profiles inthe machine and transverse directions around the axis ofsymmetry. For the FEM simulations, directionally aver-aged stress–strain is assumed. Fig. 12b shows Cg;95 vs./rim for both directional scanned surfaces and for theFEM-simulated surface, corroborating the detrimentaleffect of anisotropy. Because of the higher plastic strain,the revolved profile of the transverse direction performsbetter than its counterpart in the machine direction. The

F. Dahler et al. / Solar Energy 124 (2016) 89–100 97
peak Cg;95 ¼ 1498 and 628 for the revolved transverse andmachine profiles, respectively. Also shown is the Cg;95 forthe full 3D scanned membrane. Interestingly, the optimal/rim varies for each direction and, thus, the optimal /rim
for the full 3D membrane is not optimal for the singledirections. This is consistent with the performance of thefull 3D membrane, which approaches that of the revolvedmachine direction.
The effect of overstretching the aluminum membrane isshown in Fig. 12c. Cg;95 is plotted vs. /rim for the over-stretched and non-overstretched surfaces and for theFEM-simulated surface. Overstretching is achieved by set-ting /rim ¼ 19:9� and subsequently releasing the pressure.Peak Cg;95 ¼ 1489 is reached at /rim ¼ 18:4�, which corre-sponds to a factor 7 higher than that of the PET membrane.Further pressure release leads to a case in which over-stretching was too strongly for the corresponding /rim
and, therefore, results in a profile that is above the parabola,as seen in Fig. 8. This in turn results in a drop of Cg;95.
5. Conclusion
We developed a simulation model based on finite ele-ment structural analysis and Monte Carlo ray-tracing toinvestigate the optical performance of solar concentratorsbased on pneumatic reflecting membranes. Elasto-plasticmembranes with high elastic modulus and low tangentmodulus in the plastic regime yield the highest concentra-tion ratio. Further improvement was obtained by optimaloverstretching. The simulation results were verified experi-mentally with high precision scans of PET and aluminummembranes, yielding peak Cg;95 ¼ 1489 for the aluminummembrane and 7-fold outperforming that for the elasticPET membrane. Anisotropy detrimentally affected thealuminum membrane but was negligible in the PET mem-brane. We conclude that elasto-plastic membranes are wellsuited for high-concentration solar dishes.
Acknowledgements
We gratefully acknowledge the financial support by theSwiss Federal Office of Energy and the European Unionunder the 7th Framework Program – Grant Nr. 609837(STAGE-STE). We thank Daniele Crivelli from SUPSI –University of Applied Sciences and Arts of SouthernSwitzerland for the characterization of the membranematerials.
Appendix A
A.1. Calculation of average radial strain and area increase
from a flat surface to a paraboloid
A flat circular surface of radius R is assumed to bedeformed to a perfect paraboloid of revolution. Given a
parabolic profile zðrÞ ¼ aþ cr2, the length l along the pro-file (see also Fig. 1) is calculated as
l ¼Z R
0
ffiffiffiffiffiffiffiffiffiffiffiffiffiffiffiffiffiffiffi1þ 4c2r2
pdr
¼ 1
4c2cR
ffiffiffiffiffiffiffiffiffiffiffiffiffiffiffiffiffiffiffiffiffiffið2cRÞ2 þ 1
qþ arcsinhð2cRÞ
� �: ðA:1Þ
The radial true strain is then
er ¼ lnlR
� �
¼ ln1
2u
ffiffiffiffiffiffiffiffiffiffiffiffiffiu2 þ 1
pþ uþ arcsinhðuÞ
� �� �ðA:2Þ
where u � 2cR � R=ð2f Þ ¼ 1=ð2F #Þ ¼ tanð/rim=2Þ is
defined, with the focal length f, the f/number F # and therim angle /rim. The area increase DA=A0 is derivedanalogously
DAA0
¼ 2
3u2u2 þ 1� �3=2 � 1� �
� 1 ðA:3Þ
with A0 being the membrane surface area before and A1
after inflation.
Appendix B
B.1. Membrane profile for very large prestress
Campbell (1956) derives a solution for an initially ten-sioned circular membrane subjected to uniform lateralpressure using a power series approach,
wðrÞ ¼ RpREh
� �1=3 X1n¼0
A2nrR
� �2n !: ðB:1Þ
E denotes Young’s modulus, h the membrane thickness, pthe pressure applied on the membrane and R the radiusof the flat membrane. The coefficients A2n are given byCampbell (1956)
A0 ¼ �X1n¼1
A2n
!; A2 ¼ � 1
B0
; A4 ¼ � 1
2B40
;
A6 ¼ � 5
9B70
; A8 ¼ � 55
72B100
; A10 ¼ � 7
6B130
;
A12 ¼ � 205
108B160
; etc: ðB:2Þ
The parameter B0 depends on the stress in the center of themembrane rc and the prestrain r0 by
B0 ¼ rc þ r0
kwith k ¼ E
4
pREh
� �2=3
: ðB:3Þ
For r0 � rc and r0 � k, then B0 � 1, and terms A2n mightbe neglected for n > 1,
B0 � r0
k) A0 � �A2 � � k
r0
: ðB:4Þ

98 F. Dahler et al. / Solar Energy 124 (2016) 89–100
Inserting into equation (B.1) yields
wðrÞ ¼ pR2
4r0h1� r
R
� �2� �; ðB:5Þ
which is parabolic. By setting r = 0 we find an expressionfor the central deflection for large prestrain (Lyman andHoumard, 1963)
wc ¼ pR2
4r0h: ðB:6Þ
Appendix C
C.1. Membrane profile for rigid-plastic membrane
The formulae for lateral and radial equilibrium in a cir-cular membrane are given by Hencky (1915), Campbell(1956)
rrw0 ¼ � pr2h
; ðC:1Þ
rh ¼ rrrð Þ0 ðC:2Þwhere rr and rh denote the stress in radial and tangentialdirection, w the vertical deflection, p the pressure on themembrane, and h the membrane thickness. Differentiationwith respect to the radial direction r is indicated by an
apostrophe ð Þ0 ¼ @=@rð Þ. Assuming that strains occur inthe rigid-plastic membrane, the von Mises yield criterionfor plane stress (rz ¼ 0) (Chakrabarty, 2006)
r2r � rrrh þ r2
h ¼ r2Y ðC:3Þ
must be fulfilled across the full membrane. Inserting Eq.(C.2) in Eq. (C.3) leads to
r2r þ rrrr
0r þ r2r02
r ¼ r2Y: ðC:4Þ
Integrating the normal equilibrium Eq. (C.1) with theassumption of constant membrane thickness yields
wðrÞ ¼ p2h
Z R
r
r�
rrðr�Þ dr�
¼ p2h
f ðRÞ � f ðrÞð Þ; with f 0ðrÞ¼: rrrðrÞ : ðC:5Þ
If rr in Eq. (C.4) is replaced by f (r) as defined in Eq. (C.5)a differential equation for f can be obtained
3r2f 0ðrÞ2 � 3r3f 0ðrÞf 00ðrÞ þ r4f 00ðrÞ2 ¼ r2Yf
0ðrÞ4: ðC:6ÞA power series approach,
f ðrÞ ¼X1n¼0
cnrn; ðC:7Þ
is applied to solve Eq. (C.6). The solution is required to besymmetric in r therefore all constants cn with uneven nmust equal zero. Inserting the series approach in the differ-ential equation and setting c1 ¼ 0 yields
X1n¼2
3� 3 n� 1ð Þ þ n� 1ð Þ2� �
n2c2nr2n
¼X1n¼2
r2Yn
4c4nr4n�4: ðC:8Þ
By equating coefficients an equation connecting c2n�2 andcn is obtained
c2n�2 ¼ rYn2c2n
2n� 2ð Þffiffiffiffiffiffiffiffiffiffiffiffiffiffiffiffiffiffiffiffiffiffiffiffiffiffiffiffiffiffiffiffiffiffiffiffiffiffiffiffiffiffiffiffiffiffiffiffiffiffiffiffi3� 3 2n� 3ð Þ þ 2n� 3ð Þ2
q : ðC:9Þ
For n = 2 the two coefficients c2n�2 and cn are equal and aregiven by
c2 ¼ � 1
2rY
: ðC:10Þ
The uneven coefficients may be represented by c2n�1 ¼ 0,equation (C.9) then implies for n P 2
c2n�1 ¼ 0 ) c4n�4 ¼ 0;
c4n�4 ¼ 0 ) c8n�6 ¼ 0;
c4n�4 ¼ 0 ) c4n ¼ 0;
c4n ¼ 0 ) c8n�2 ¼ 0:
ðC:11Þ
Setting cn ¼ 0 for n – 2 in Eqs. (C.5), (C.7) and (C.10), thevertical displacement is given by
wðrÞ ¼ pR2
4rYh1� r
R
� �2� �ðC:12Þ
which is parabolic. Furthermore, the central deflection wc
can easily be related to the applied pressure p by settingr = 0 in Eq. (C.12)
wc ¼ pR2
4rYh: ðC:13Þ
Appendix D
D.1. Properties of PET and aluminum membranes
The engineering stress–strain relationship was deter-mined for the PET membrane (Lumirror U50 transparent23 lm thick film by Toray Plastics, Inc.) and the aluminummembrane (0.2 mm thick MIRO High Reflective 95 foils byAlanod Solar). The measurements were carried out with aZwick/Roell Z050 electronic dynamometer in accordancewith the ISO6892 and ISO_527-1&3 standards and at roomtemperature between 22.6 �C and 23.1 �C. The requiredspecular reflectivity of the PET film was obtained byPVD-coating with aluminum. To account for anisotropy,10 (and 7) samples have been cut out in the membrane’smachined direction and 10 (and 6) samples in its transversedirection for the aluminum (and PET) membrane. Thestress–strain relationship averaged across these samplesand the corresponding standard deviation are given inTable 1. The ultimate tensile strength in each direction isgiven in Table 2 and the strain at fracture in Table 3.

Table 1Engineering stress and strain data with standard deviation for the PET and aluminum membranes.
PET Aluminum
Strain [%] Stress [MPa] Strain [%] Stress [MPa]
Machine direction Transverse direction Machine direction Transverse direction
0.0 0.00 ± 0.00 0.00 ± 0.00 0.00 0.00 ± 0.00 0.00 ± 0.000.2 11.25 ± 0.41 11.95 ± 0.35 0.05 34.45 ± 0.95 34.51 ± 1.110.4 22.55 ± 0.83 24.00 ± 0.75 0.10 67.42 ± 2.01 67.55 ± 1.770.6 33.61 ± 1.13 35.63 ± 0.92 0.15 95.55 ± 2.42 94.93 ± 2.170.8 44.14 ± 1.44 46.43 ± 1.10 0.20 114.95 ± 1.94 114.23 ± 2.051.0 53.94 ± 1.73 56.24 ± 1.13 0.25 126.47 ± 1.35 127.04 ± 1.741.2 62.99 ± 1.94 64.89 ± 1.07 0.30 133.05 ± 0.94 135.31 ± 1.401.4 71.09 ± 1.99 72.16 ± 0.88 0.35 137.14 ± 0.74 140.70 ± 1.131.6 78.14 ± 1.95 77.88 ± 0.54 0.40 139.92 ± 0.66 144.43 ± 0.951.8 83.98 ± 1.78 82.09 ± 0.30 0.45 141.95 ± 0.62 147.14 ± 0.832.0 88.57 ± 1.64 84.95 ± 0.45 0.50 143.47 ± 0.62 149.15 ± 0.752.2 92.07 ± 1.52 86.85 ± 0.70 0.55 144.63 ± 0.62 150.74 ± 0.762.4 94.59 ± 1.46 88.07 ± 0.81 0.60 145.48 ± 0.61 151.96 ± 0.762.6 96.76 ± 1.35 88.87 ± 0.92 0.65 145.93 ± 0.61 152.84 ± 0.762.8 98.19 ± 1.31 89.41 ± 0.97 0.70 146.02 ± 0.60 153.39 ± 0.773.0 99.24 ± 1.25 89.77 ± 0.99 0.75 145.94 ± 0.60 153.81 ± 0.723.5 100.89 ± 1.21 90.36 ± 1.01 0.80 145.88 ± 0.61 153.98 ± 0.714.0 101.90 ± 1.18 90.84 ± 0.90 0.85 145.85 ± 0.61 154.13 ± 0.754.5 102.63 ± 1.22 91.38 ± 0.87 0.90 145.83 ± 0.62 154.30 ± 0.765.0 103.18 ± 1.22 91.99 ± 0.78 0.95 145.93 ± 0.57 154.45 ± 0.775.5 103.62 ± 1.23 92.58 ± 0.74 1.00 145.92 ± 0.58 154.58 ± 0.786.0 103.92 ± 1.26 93.26 ± 0.69 1.50 145.70 ± 0.60 155.65 ± 0.546.5 104.29 ± 1.34 93.98 ± 0.71 2.00 145.05 ± 0.87 155.15 ± 0.697.0 104.63 ± 1.37 94.93 ± 0.53 2.50 144.47 ± 0.84 n/a7.5 104.96 ± 1.46 95.72 ± 0.46 3.00 144.08 ± 0.46 n/a8.0 105.35 ± 1.54 96.55 ± 0.508.5 105.71 ± 1.53 97.45 ± 0.559.0 106.12 ± 1.61 98.40 ± 0.549.5 106.53 ± 1.69 99.43 ± 0.5010.0 107.29 ± 1.67 100.54 ± 0.49
Table 2Tensile strength and standard deviation for the PET and aluminum membranes.
PET Aluminum
Strain [%] Stress [MPa] Strain [%] Stress [MPa]
Machine direction 22.01 ± 12.55 115.33 ± 11.84 0.701 ± 0.041 146.06 ± 0.64Transverse direction 15.38 ± 5.36 111.92 ± 11.43 1.148 ± 0.314 154.32 ± 1.54
Table 3Strain at fracture and standard deviation for the PET and aluminum membranes.
PET AluminumStrain [%] Strain [%]
Machine direction Transverse direction Machine direction Transverse direction
Average 22.29 ± 12.56 15.63 ± 5.32 2.430 ± 1.168 1.693 ± 0.764Maximum 35.11 ± n/a 20.64 ± n/a 4.419 ± n/a 2.759 ± n/aMinimum 2.55 ± n/a 6.98 ± n/a 1.183 ± n/a 0.664 ± n/a
F. Dahler et al. / Solar Energy 124 (2016) 89–100 99
References
Airlight Energy. <www.airlightenergy.com/csp> (accessed 10.11.15).Algora, C., Rey-Stolle, I., 2012. The interest and potential of ultra-high
concentration. Next Generation of Photovoltaics. Springer, pp. 23–60.ANSYS Mechanical APDL Release 14.5.7, 2013. Ansys, Inc.Bader, R., Haueter, P., Pedretti, A., Steinfeld, A., 2009. Optical design of a
novel two-stage solar trough concentrator based on pneumaticpolymeric structures. J. Sol. Energy Eng. 131, 031007.
Bader, R., Pedretti, A., Steinfeld, A., 2011. A 9-m-aperture solar parabolictrough concentrator based on a multilayer polymer mirror membranemounted on a concrete structure. J. Sol. Energy Eng. 133, 031016.
Barton, S.A., Winger, I.L., 2009. Parabolic-dish Solar Concentrators ofFilm on Foam. Available from: arXiv:0903.1601.
Campbell, J., 1956. On the theory of initially tensioned circularmembranes subjected to uniform pressure. Quart. J. Mech. Appl.Math. 9, 84–93.
Chakrabarty, J., 2006. Theory of Plasticity. Elsevier/Butterworth-Heinemann.

100 F. Dahler et al. / Solar Energy 124 (2016) 89–100
Cooper, T., Schmitz, M., Good, P., Ambrosetti, G., Pedretti, A., Steinfeld,A., 2014. Nonparabolic solar concentrators matching the parabola.Opt. Lett. 39, 4301–4304.
Fichter, W.B., 1997. Some Solutions for the Large Deflections ofUniformly Loaded Circular Membranes. NASA Langley ResearchCenter.
Friese, G.J., Bilyeu, G.D., Thomas, M., 1983. Initial ’80s Development ofInflated Antennas. L’Garde.
Geomagic Studio, 2014. 3D Systems, Inc.Harper, D.A., Hildebrand, R.H., Stiening, R., Winston, R., 1976. Heat
trap: an optimized far infrared field optics system. Appl. Opt. 15,53–60.
Hencky, H., 1915. Ueber den Spannungszustand in kreisrundenPlatten mit verschwindender Biegungssteifigkeit. Z. Math. Phys. 63,311–317.
Jenkins, C.H.M., 2001. Gossamer Spacecraft: Membrane and InflatableStructures Technology for Space Applications. American Institute ofAeronautics & Astronautics.
Jenkins, C.H.M., 2006. Recent Advances in Hossamer Spacecraft.American Institute of Aeronautics and Astronautics, Arlington, Texas.
Lyman, R., Houmard, J.E., 1963. Inflatable foam-rigidized approach tosolar concentrators, power systems for space flight. Progr. Astronaut.Aeronaut., 687–711
Mancini, T., Heller, P., Butler, B., Osborn, B., Schiel, W., Goldberg, V.,Buck, R., Diver, R., Andraka, C., Moreno, J., 2003. Dish-Stirlingsystems: an overview of development and status. J. Sol. Energy Eng.125, 135–151.
Marker, D., Jenkins, C., 1997. Surface precision of optical membraneswith curvature. Opt. Express 1, 324–331.
Meinel, A.B., Meinel, M.P., 2000. Inflatable membrane mirrors for opticalpassband imagery. Opt. Eng. 39, 541–550.
Petrasch, J., 2010. A free and open source Monte Carlo ray tracingprogram for concentrating solar energy research. In: Proceedings ofthe ASME 4th International Conference on Energy Sustainability, pp.125–132.
Pozivil, P., Ettlin, N., Stucker, F., Steinfeld, A., 2015. Modular design andexperimental testing of a 50 kWth pressurized-air solar receiver for gasturbines. J. Sol. Energy Eng. 137, 031002.
Romero, M., Steinfeld, A., 2012. Concentrating solar thermal power andthermochemical fuels. Energy Environ. Sci. 5, 9234–9245.
Schlaich, J., 1999. Tension structures for solar electricity generation. Eng.Struct. 21, 658–668.
Thomas, M., Veal, G., 1984. Highly Accurate Inflatable Reflectors.L’Garde, Inc.
Thomas, M., Veal, G., 1991. Scaling Characteristics of InflatableParaboloid Concentrators. Air Force Research Lab.
Vaughan, H., 1980. Pressurising a prestretched membrane to form aparaboloid. Int. J. Eng. Sci. 18, 99–107.
Ventsel, E., Krauthammer, T., 2001. Thin Plates and Shells: Theory:Analysis, and Applications. CRC Press.
Wilkes, J.M., 1998. Applications of Power Series Solutions of MembraneEquilibrium Equations to the Optical Evaluation of MembraneMirrors with Curvature. Air Force Research Laboratory.
Winston, R., Minano, J.C., Benıtez, P., 2005. Nonimaging Optics. ElsevierAcademic Press, Amsterdam.
Zanganeh, G., Bader, R., Pedretti, A., Pedretti, M., Steinfeld, A., 2012. Asolar dish concentrator based on ellipsoidal polyester membranefacets. Sol. Energy 86, 40–47.