Beyond the Fossil City: Towards low Carbon Transport and ...

High Carbon from a Land Down Under Quantifying CO2 from Australia’s fossil fuel mining and exports
Australia is the world’s third biggest exporter and fifth biggest miner of fossil fuels by CO2 potential.
Its exports are behind only Russia and Saudi Arabia, and far larger than Iraq, Venezuela and any country in the EU. Yet Australia’s economy is more diverse
and less fossil fuel intensive than many other exporters. Australia has an opportunity and
obligation to decarbonise its exports in line with the Paris Agreement.
July 2019
Tom Swann
ABOUT THE AUSTRALIA INSTITUTE
The Australia Institute is an independent public policy think tank based in Canberra. It
is funded by donations from philanthropic trusts and individuals and commissioned
research. We barrack for ideas, not political parties or candidates. Since its launch in
1994, the Institute has carried out highly influential research on a broad range of
economic, social and environmental issues.
OUR PHILOSOPHY
As we begin the 21st century, new dilemmas confront our society and our planet.
Unprecedented levels of consumption co-exist with extreme poverty. Through new
technology we are more connected than we have ever been, yet civic engagement is
declining. Environmental neglect continues despite heightened ecological awareness.
A better balance is urgently needed.
The Australia Institute’s directors, staff and supporters represent a broad range of
views and priorities. What unites us is a belief that through a combination of research
and creativity we can promote new solutions and ways of thinking.
OUR PURPOSE – ‘RESEARCH THAT MATTERS’
The Institute publishes research that contributes to a more just, sustainable and
peaceful society. Our goal is to gather, interpret and communicate evidence in order to
both diagnose the problems we face and propose new solutions to tackle them.
The Institute is wholly independent and not affiliated with any other organisation.
Donations to its Research Fund are tax deductible for the donor. Anyone wishing to
donate can do so via the website at https://www.tai.org.au or by calling the Institute
on 02 6130 0530. Our secure and user-friendly website allows donors to make either
one-off or regular monthly donations and we encourage everyone who can to donate
in this way as it assists our research in the most significant manner.
Level 1, Endeavour House, 1 Franklin St
Canberra, ACT 2601
Tel: (02) 61300530
Email: [email protected]
Website: www.tai.org.au
ISSN: 1836-9014
High Carbon from a Land Down Under 1
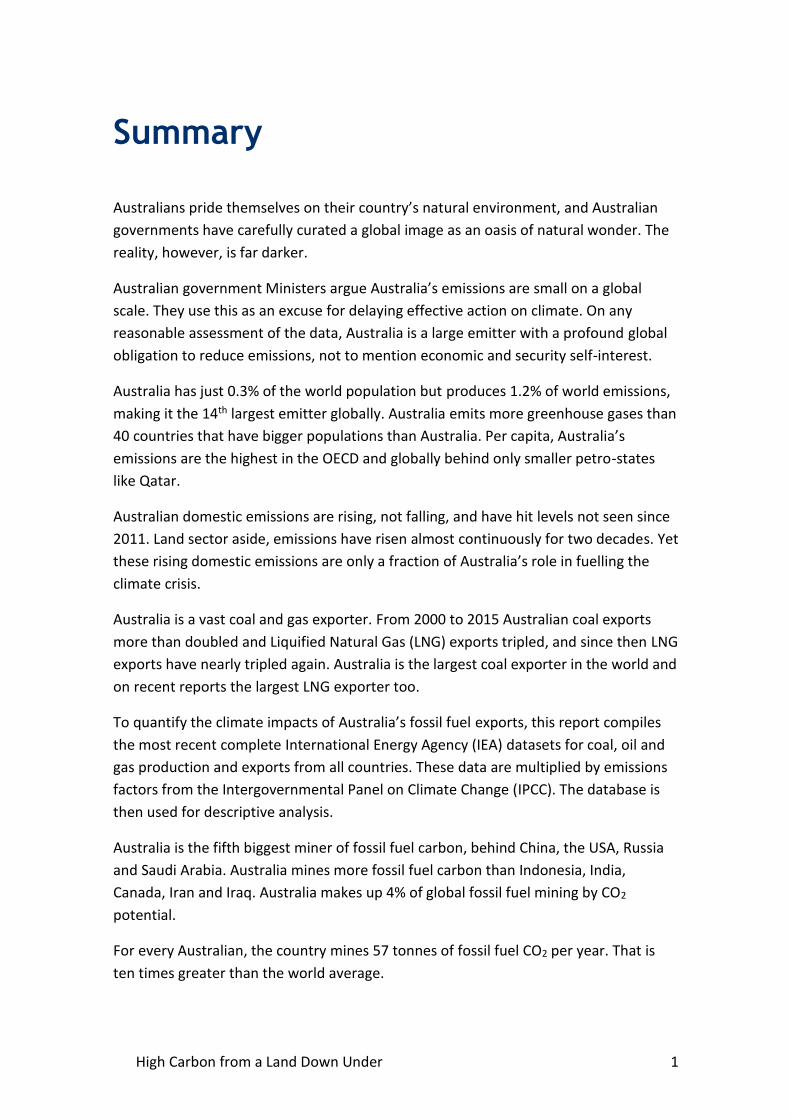
Summary
Australians pride themselves on their country’s natural environment, and Australian
governments have carefully curated a global image as an oasis of natural wonder. The
reality, however, is far darker.
Australian government Ministers argue Australia’s emissions are small on a global
scale. They use this as an excuse for delaying effective action on climate. On any
reasonable assessment of the data, Australia is a large emitter with a profound global
obligation to reduce emissions, not to mention economic and security self-interest.
Australia has just 0.3% of the world population but produces 1.2% of world emissions,
making it the 14th largest emitter globally. Australia emits more greenhouse gases than
40 countries that have bigger populations than Australia. Per capita, Australia’s
emissions are the highest in the OECD and globally behind only smaller petro-states
like Qatar.
Australian domestic emissions are rising, not falling, and have hit levels not seen since
2011. Land sector aside, emissions have risen almost continuously for two decades. Yet
these rising domestic emissions are only a fraction of Australia’s role in fuelling the
climate crisis.
Australia is a vast coal and gas exporter. From 2000 to 2015 Australian coal exports
more than doubled and Liquified Natural Gas (LNG) exports tripled, and since then LNG
exports have nearly tripled again. Australia is the largest coal exporter in the world and
on recent reports the largest LNG exporter too.
To quantify the climate impacts of Australia’s fossil fuel exports, this report compiles
the most recent complete International Energy Agency (IEA) datasets for coal, oil and
gas production and exports from all countries. These data are multiplied by emissions
factors from the Intergovernmental Panel on Climate Change (IPCC). The database is
then used for descriptive analysis.
Australia is the fifth biggest miner of fossil fuel carbon, behind China, the USA, Russia
and Saudi Arabia. Australia mines more fossil fuel carbon than Indonesia, India,
Canada, Iran and Iraq. Australia makes up 4% of global fossil fuel mining by CO2
potential.
For every Australian, the country mines 57 tonnes of fossil fuel CO2 per year. That is
ten times greater than the world average.

High Carbon from a Land Down Under 2
While Australia mines large amounts of carbon per capita, the Australian economy is
less fossil fuel intensive than other exporters, being diverse and based largely on
services. Australia is the 29th most fossil fuel intensive considered in terms of GDP.
Most of Australia’s fossil fuel production is exported. The CO2 potential of these
exports is more than twice as much as the greenhouse gas emissions Australia emits
domestically.
Australia is the third biggest fossil fuel exporter globally, in CO2 potential.
Figure: World’s biggest fossil fuel exporters, CO2 Gt potential of exports
Source: IEA (2018) World Energy Balances; IPCC (2006) IPCC Guidelines, as described in text;
Commonwealth of Australia (2019) Quarterly Update of Australia's National Greenhouse Gas
Inventory for September 2018
Australia comes behind only Russia and Saudi Arabia. Australia’s fossil fuel exports are
bigger than exports from Indonesia, Canada, Iraq, UAE or Qatar, and nearly four times
bigger than exports from Venezuela and Colombia.
On the most recent complete IEA data, Australian fossil fuel exports are just ahead of
to those from the United States of America (USA). That is despite the USA having a
population 13 times larger, GDP 15 times larger and export value 8 times larger.

High Carbon from a Land Down Under 3
Australia makes up 7% of all fossil fuel exports by CO2 potential. Most traded fossil
fuels are oil but, unusually, Australia’s fossil fuel exports are dominated by coal.
Australia makes up 29% of world coal trade by CO2 potential. Australian gas exports
are 6% of world gas trade.
Australia’s fossil exports can also be compared with in various country groupings.
• In the OECD, Australia is the largest fossil fuel exporter in CO2 potential, making
up 20% of the OECD total.
• In the G20, Australia makes up 12% of fossil fuel exports, with the highest
exports per capita and second highest production per capita.
• In the Commonwealth, Australia is the largest fossil fuel miner and exporter,
with a full third of Commonwealth exports by CO2 potential.
• Compared with the European Union, Australia’s fossil fuel exports are 74% as
large as all of those from all EU countries together, and more than twice as big
as any EU country. Australia’s fossil fuel production is one and a half times the
size of the EU countries’ production put together.
• Australia’s exports are equal to a quarter of all the exports from the
Organisation of the Petroleum Exporting Countries (OPEC).
Australia is a massive fossil fuel exporter, but its exports overall are far more
diversified and less dominated by fossil fuel than many other exporting countries.
Relative to the value of a country’s overall exports, Australia is the 24th biggest fossil
fuel exporter. Australian exports vastly more fossil fuel carbon than many exporting
countries, despite its overall exports being vastly less fossil fuel intensive. Australia
exports nearly twice as much CO2 potential as Iraq and yet compared to the value of
exports, Australian exports are half as CO2 intensive as Iraq’s.
Australia has a unique opportunity, and obligation, to face up to the climate crisis
through policies to limit its carbon exports, starting with a moratorium on new coal
mines. Coal makes up more than 80% of Australia’s exported fossil fuel CO2 potential.
Those in the global community making efforts to confront the climate crisis should
understand the scale of Australia’s fossil fuel exports and policies to expand them.
Exports are often ignored in official climate change policy. Treaties and status quo
debate focuses on demand for carbon, rather than supply. This ignores the fact that
increasing supply and supply infrastructure will tend to “lock in” increased emissions.
The scale of exports from countries like Australia bring into stark relief why efforts to
reduce world emissions must limit both demand and supply.
High Carbon from a Land Down Under 4
Introduction
Australians pride themselves on their country’s natural environment. Tourism Australia
has long advertised the country as an oasis of natural wonder: pristine beaches and
varied landscapes, capital cities cradled by clear blue waterways and covered by even
bluer skies, with not a whiff of pollution in sight. Such an advertising campaign was
even overseen by Australia’s current Prime Minister Scott Morrison, in his former role
as the head of Tourism Australia.
The careful curation of Australia’s global image has been assisted by its large land mass
and modest population. The reality is far darker.
Australia is a major greenhouse gas polluter, with higher emissions than 90% of
countries and among the highest emissions per capita in the world. But this is only one
small part of Australia’s growing carbon footprint.
Australia extracts and exports vast amounts of coal and gas. The greenhouse gases
from these exports are far bigger than emissions from within Australia, putting
Australia among Russia and Saudi Arabia in terms of fossil fuel exports.
Australian governments are actively promoting even greater coal and gas exports.
Australian politicians work hard to avoid confronting the climate impacts of Australian
fossil fuel impacts, but the reality is those impacts are enormous.
Time to uncover its true size.

High Carbon from a Land Down Under 5
Australia’s domestic emissions
In Australian political debate, those seeking to delay or limit climate action often argue
that Australia produces a small share of global emissions. The Treasurer Josh
Frydenberg, in his former role as Minister for Environment stated:
while Australia’s share of the global carbon footprint is just 1.3 per cent,
Australia is playing its part on the world stage through bilateral and multi-lateral
initiatives and the ratification of the Paris Agreement to reduce our emissions
by 26 to 28 per cent on 2005 levels by 2030 - one of the largest reductions on a
per capita and GDP intensity basis in the G20.1
The Treasurer’s statement is misleading. Australia’s current Paris targets not in per
capita or per GDP terms, but absolute terms. Moreover, the data show that Australia’s
emissions per capita and per GDP are very high. This increases the obligation on
Australia to cut emissions.
ABSOLUTE TERMS
Australia is a heavy emitter in terms of total domestic emissions.
(Data in this section are from 2016, include all greenhouse gases but exclude the land
sector.)
In 2016 Australia emitted 1.2% of world greenhouse gas emissions. This made Australia
the world’s 14th biggest emitter of greenhouse gas pollution,2 despite having just 0.3%
of world population. (See Figure 1).
1 Minister for the Environment, the Hon Josh Frydenberg (2017) Media Release: 2017 review of climate
change policies final report released, http://www.environment.gov.au/minister/frydenberg/media-
releases/mr20171219.html 2 All Kyoto GHG, excluding LULUCF, 2016 PIK data, accessed via WRI (2019) Climate Watch,
https://www.climatewatchdata.org/

High Carbon from a Land Down Under 6
Figure 1: Top 20 biggest GHG emitting countries (2016, ex LULUCF)
Source: All Kyoto GHG, excluding LULUCF, 2016 PIK data, accessed via WRI (2019) Climate
Watch, https://www.climatewatchdata.org/; World Bank (2017) Population – 2016,
https://data.worldbank.org/indicator/sp.pop.totl?end=2016&start=2016
Australia’s 2016 emissions were greater than those of 190 countries.3 If Australia
should not have to reduce emissions, then neither should these ‘lower’ emitting
countries. These ‘lower’ emitting countries are home to 42% of the world population
(3.1 billion people) that together emit 30% of world emissions.
40 countries that emit less than Australia nonetheless have a bigger population than
Australia. This includes Turkey, United Kingdom, France, Thailand, Italy and Pakistan.
PER CAPITA
Per capita, Australian emissions are the highest in the OECD and among the highest in
the world. The only countries with higher per capita emissions than Australia are
smaller petro-states like Kuwait, Qatar and UAE.
3 NB: Datasets differ on what counts as a country. This dataset includes some smaller territories that
have some independence from the nation state with formal recognition at the United Nations.
0
5
10
15
20
25
0%
5%
10%
15%
20%
25%
30%C
hin
a
Un
ited
Sta
tes
Ind
ia
Ru
ssia
Jap
an
Bra
zil
Ge
rman
y
Iran
Sou
th K
ore
a
Mex
ico
Can
ada
Sau
di A
rab
ia
Ind
on
esia
Au
stra
lia
Sou
th A
fric
a
Turk
ey
Un
ited
Kin
gdo
m
Fran
ce
Thai
lan
d
Ital
y
18
8 o
ther
co
un
trie
s
Glo
bal
Ave
rage
Ton
nes
per
per
son
Shar
e o
f w
orl
d e
mis
sio
ns
Share of world emissions (LHS) Emissions per capita (RHS)

High Carbon from a Land Down Under 7
Figure 2: Emissions per capita - top 20 countries
Source: All Kyoto GHG, excluding LULUCF, 2016 PIK data, accessed via WRI (2019) Climate
Watch, https://www.climatewatchdata.org/; World Bank (2017) Population – 2016,
https://data.worldbank.org/indicator/sp.pop.totl?end=2016&start=2016
EMISSIONS INCREASING
Though Australia has signed the Paris Agreement, its emission reduction target is an
inadequate contribution to the global goal of limiting warming4 and Australia’s
government refuses to consider increasing it. Instead, Australia’s government plans to
cut the target in half by using ‘carry-over’ credits from the Kyoto Protocol, despite this
being unauthorised under the Agreement and opposed by many other countries.5
Even then, Australia is not on track to meet the target. Australian emissions are
increasing, not decreasing.
4 Merzian and Campbell (2018) Advance Australia’s Fair Share, http://www.tai.org.au/content/advance-
australias-fair-share 5 Merzian (2019) Taking Way Too Much Credit, http://www.tai.org.au/content/taking-way-too-much-
credit
0
10
20
30
40
50
60
70
80
90
Qat
ar
Trin
idad
an
d T
ob
ago
Bru
nei
Un
ited
Ara
b E
mir
ate
s
Ku
wai
t
Bah
rain
Au
stra
lia
Om
an
Sau
di A
rab
ia
Un
ited
Sta
tes
Can
ada
Kaz
akh
stan
Ru
ssia
Turk
men
ista
n
Luxe
mb
ou
rg
Ne
w Z
eal
and
Sin
gap
ore
Esto
nia
Pal
au
Glo
bal
ave
rage
tCO
2 p
er c
apit
a
High Carbon from a Land Down Under 8
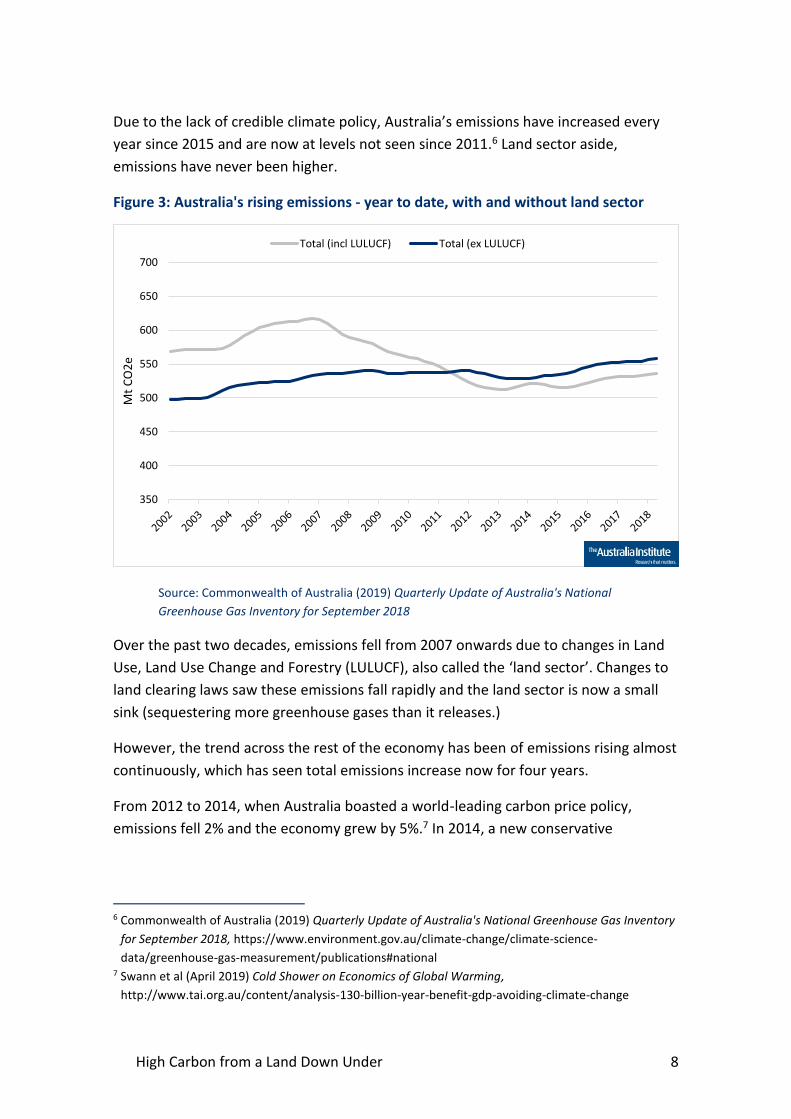
Due to the lack of credible climate policy, Australia’s emissions have increased every
year since 2015 and are now at levels not seen since 2011.6 Land sector aside,
emissions have never been higher.
Figure 3: Australia's rising emissions - year to date, with and without land sector
Source: Commonwealth of Australia (2019) Quarterly Update of Australia's National
Greenhouse Gas Inventory for September 2018
Over the past two decades, emissions fell from 2007 onwards due to changes in Land
Use, Land Use Change and Forestry (LULUCF), also called the ‘land sector’. Changes to
land clearing laws saw these emissions fall rapidly and the land sector is now a small
sink (sequestering more greenhouse gases than it releases.)
However, the trend across the rest of the economy has been of emissions rising almost
continuously, which has seen total emissions increase now for four years.
From 2012 to 2014, when Australia boasted a world-leading carbon price policy,
emissions fell 2% and the economy grew by 5%.7 In 2014, a new conservative
6 Commonwealth of Australia (2019) Quarterly Update of Australia's National Greenhouse Gas Inventory
for September 2018, https://www.environment.gov.au/climate-change/climate-science-
data/greenhouse-gas-measurement/publications#national 7 Swann et al (April 2019) Cold Shower on Economics of Global Warming,
http://www.tai.org.au/content/analysis-130-billion-year-benefit-gdp-avoiding-climate-change
350
400
450
500
550
600
650
700
Mt
CO
2e
Total (incl LULUCF) Total (ex LULUCF)

High Carbon from a Land Down Under 9
government gave Australia the dubious distinction of being first country to repeal its
carbon price.
Australia’s electricity sector remains dominated by coal power. Under current policy,
electricity emissions have fallen, due to increasing renewables. This trend has been
more than overpowered by emissions growth in other sectors. Australia’s vehicle fleet
is also highly fuel-inefficient with a very low number of electric vehicles.
However, a key reason for Australia’s increasing emissions is the large expansion in
coal and gas production for export. These activities are emissions intensive in Australia,
and the exports themselves produce far larger volumes of CO2 overseas.

High Carbon from a Land Down Under 10
Australia’s vast fossil fuel exports
Discussion of climate impacts have traditionally ignored emissions in fossil fuel exports.
Examples like Australia show why this needs to change.
COAL
Australia exports roughly equal volumes of thermal coal, for power plants (mostly from
NSW), and coking coal, for making steel (mostly from Queensland).
Over the last two decades, Australian coal exports have more than doubled.
Figure 4: Coal exports from Australia, year to date, tonnes
Source: OCE (2018) Resources and Energy Quarterly December 2018, rolling annual exports
The data show total coal exports peaked in 2015 and have since levelled. However,
government forecasters project exports to increase in coming years and there are
plans for many new mines to export even more coal.
0
50
100
150
200
250
300
350
400
450
Mill
ion
to
nn
es o
f co
al
Thermal coal (for power) Coking coal (for steel)

High Carbon from a Land Down Under 11
There are current proposals for 53 new coalmines in Australia, with total production of
415 million tonnes (Mt) a year. 8 New coal from proposed new mines is even larger
than current exports. There are also many proposals to expand existing mines,
extending their mine life.
The focus of thermal coal expansion is the Galilee Basin in Queensland, where the
frontrunner is the Adani Carmichael mine. The Adani mine has been subject to years of
controversy about approvals and plans to subsidise it at every level of government.
The Galilee Basin mines would produce thermal coal.
Despite the huge volumes of coal involved, coal mining in Australia employs less than
0.5% of Australia’s workforce, five times less than the arts and recreation sector
employs.9
GAS
Australia has recently seen a very large expansion in liquid natural gas (LNG) exports,
more than doubling in the decade to 2015, then to 2018 more than doubling again.
Figure 5: Australia’s exports of liquid natural gas (LNG)
8 OCE (2019) Major Projects List – December 2018,
https://publications.industry.gov.au/publications/resourcesandenergyquarterlymarch2019/documents
/Resources-and-Energy-Quarterly-December-2018-Major-Projects-Data.xlsx 9 ABS (2019) 6291.0.55.003 - Labour Force, Australia, Detailed, Quarterly, Feb 2019,
https://www.abs.gov.au/AUSSTATS/[email protected]/DetailsPage/6291.0.55.003Feb%202019?OpenDocumen
t
0
10
20
30
40
50
60
70
Mill
ion
to
nn
es o
f LN
G

High Carbon from a Land Down Under 12
Source: OCE (2018) Resources and Energy Quarterly December 2018, rolling annual exports
The increase in LNG will continue, with numerous large projects recently finishing
construction and 19 proposals for new projects or expansions. Most of the current and
proposed production is be offshore from the north and north-west of the country.
There is also a large onshore industry, increasingly ‘fracked’ unconventional gas, which
has attracted staunch opposition. Australia also exports unrefined oil product, in
particular gas condensate.
FOSSIL FUEL SUBSIDIES
Australian governments have a long tradition of subsidising mining. State governments
have often built mining infrastructure, costing billions. The Adani coal mine has
courted numerous taxpayer subsidies, including cash grants, unlimited water licenses,
waived rehabilitation requirements and subsidised loans (including deferred royalty
payments). Australia’s export credit agency has funded numerous fossil fuel project
and its mandate was recently expanded to include funding infrastructure to assist
Australia fossil fuel exports in current and new markets.10
10 Swann (May 2019) Rushed through the Senate when no-one was looking,
https://medium.com/@TheAustraliaInstitute/rushed-through-the-senate-when-no-one-was-looking-
bf1bd2734df3

High Carbon from a Land Down Under 13
Data and methods
This section describes the data and methods used in later sections to present data on
CO2 potential of fossil fuels produced, and exported, globally.
DATA
Energy data are from the International Energy Agency (IEA). 11 This data includes
production, exports and imports of fossil fuels, broken down in the main fuel types:
• Coal and coal products
• Natural gas
• Crude, NGL and feedstocks (‘primary oil’)
• Oil products (‘secondary oil’ or ‘refined’)
The analysis uses the most recent complete data set for each fuel type from the 2018
release. 2017 data are used for coal and gas. 2016 data are used for oil.12
The IEA gives data in kilotonnes of oil equivalent (ktoe), a standardised energy unit.
This data accounts for differing energy content of fuel types (e.g. higher vs lower
energy content coal), which is the main factor in their emissions potential.
Emission CO2 factors for each fuel type are from the Intergovernmental Panel on
Climate Change (IPCC).13 The analysis uses representative default CO2 factors for each
fuel type and assumes full combustion.14 The calculations are shown in Table 1 below.
11 IEA (2018) World Energy Balances, from OECD iLibrary 12 The IEA 2019 statistics were put up for sale in the week prior to publication of this report. They are
not yet available to The Australia Institute. The results presented here are unlikely to have changed
greatly except where indicated in the text of the report. 13 IPCC (2016) 2006 IPCC Guidelines for National Greenhouse Gas Inventories Volume 2 Energy,
https://www.ipcc-nggip.iges.or.jp/public/2006gl/pdf/2_Volume2/V2_1_Ch1_Introduction.pdf 14 Bituminous coal, natural gas, crude oil, motor oil.

High Carbon from a Land Down Under 14
Table 1: IPCC emissions factors used in this report
Fuel type kg CO2 / TJ TJ / ktoe kg CO2 / ktoe t CO2 / ktoe
Coking / other bituminous
94,600 41.868 3,960,713 3,961
Natural Gas 56,100 41.868 2,348,795 2,349
Crude Oil 73,300 41.868 3,068,924 3,069
Motor Gasoline 69,300 41.868 2,901,452 2,901
Reference IPCC IEA Derived Derived
Source: IPCC (2016) 2006 IPCC Guidelines for National Greenhouse Gas Inventories V2 Energy,
https://www.ipcc-nggip.iges.or.jp/public/2006gl/pdf/2_Volume2/V2_1_Ch1_Introduction.pdf;
IEA (2019) Unit Converter, https://www.iea.org/statistics/resources/unitconverter/
The IPCC gives default conversion factors for CO2 potential in terms of energy content
in different fuel types. This is given as kilograms of CO2 per terajoule (TJ). Converting
energy and mass units give gives tonnes of CO2 per ktoe for each fuel type.
Note there are significant non-CO2 ‘fugitive’ emissions from fossil fuel extraction,
especially gas, which are not included here, as they are domestic emissions. Nearly all
of emissions from fuel combustion are CO2, which is the focus of this analysis.
Data on Gross Domestic Product (GDP) and the value of exports are from the World
Bank in current $US.15 Data on population are from the International Monetary Fund.16
Countries were also coded for membership of groups like the G20, OPEC and OECD.
ANALYSIS
All energy and socio-economic data were compiled into one database.
Using the conversion factors, data on each country’s coal, gas and oil production and
exports were converted into CO2 potential. Derived data for total exported CO2 were
checked against aggregate data from the United Nations indicators for the Sustainable
Development Goals. There was a close correlation for nearly all countries.17
15 World Bank (2019) World Bank Open Data, https://data.worldbank.org/ 16 IMF (2019) IMFDataMapper,
https://www.imf.org/external/datamapper/LP@WEO/OEMDC/ADVEC/WEOWORLD 17 The UN gives CO2 potential of exports per capita; population data was used to extrapolate absolute
emissions. Outliers in the UN data compared with the data derived here are primarily countries with
major oil refinery industries, suggesting the UN data only includes primary oil exports. The UN data is
also incomplete, missing key exporters such as Iran.

High Carbon from a Land Down Under 15
The database was used for descriptive analysis of fossil fuel extraction and export in
terms of CO2 potential. Analysis included breakdowns by fuel type and by share of
country group total, and per capita, per GDP and per export value.
ON PRIMARY AND SECONDARY OIL EXPORTS
Australia exports large amounts of coal and gas but relatively small amounts of oil.
However, as shown below, most world fossil fuel exports are oil.
Care is needed with data on oil exports. Crude oil and other extracted hydrocarbons
must generally be processed before use. The IEA provides separate data for ‘primary’
oil or as extracted and ‘secondary’ oil or as refined into products for use. Countries
may do any of the following for different kinds of oil and in different markets:
• extract and export primary oil;
• extract primary oil, refine it and export refined product;
• extract, refine and consume domestically;
• import primary oil to refine and consume; or
• import primary oil to export refined product.
Refined oil is here excluded from analysis of produced or extracted fossil fuels. But
taking this approach to exports would provide incomplete data.
As shown below, many oil extracting countries refine oil and export refined products
alongside primary oil products, including Russia, Saudi Arabia, USA and Iraq. Focusing
on primary oil exports and ignoring refined exports would ignore some of the oil
extracted and exported from these countries.
For this reason, the analysis of exported fossil fuel CO2 potential here includes the
separate data for primary and secondary oil. This approach avoids excluding oil that
extracted and refined in the same country.
It also counts some oil flow as both primary export from one country and secondary
export from another, via refineries in the latter country. Many countries import
primary oil, refine it, and then export it. Singapore and the Netherlands are clear
examples.
The approach is appropriate for the present purposes. Refineries are an essential part
of the oil supply chain, in both extracting and intermediary countries. Including refined
export data best reflects this role. However, it is important to note the export figures
do not sum to a figure for ‘total export consumption’.

High Carbon from a Land Down Under 16
Australia: the world’s fifth biggest
miner of fossil fuels
Australia may be the 14th biggest emitter, but in terms of total fossil fuels mined,
Australia’s carbon footprint is far bigger.
The CO2 footprint of Australia’s total fossil fuel production is exports is 1.4 billion
tonnes (as of 2017).
This makes Australia the fifth biggest miner of fossil fuel carbon in the world.
Figure 6: World’s biggest fossil fuel mining countries, by CO2 potential
Source: IEA (2018) World Energy Balances; IPCC (2006) IPCC Guidelines, as described in text
Figure 6 shows that Australia’s CO2 extraction is behind only China, USA, Russia and
Saudi Arabia. It is ahead of Indonesia and India and far ahead of Iran, Iraq and Qatar.
Australia has 0.3% of the world population, but mines 4% of the world’s fossil fuel CO2.
7.9
4.8
3.9
1.9
1.4 1.3 1.3 1.2 1.10.7 0.7 0.6 0.6 0.5 0.5 0.5 0.5 0.4 0.4 0.4
0
1
2
3
4
5
6
7
8
9
Ch
ina
USA
Ru
ssia
Sau
di A
rab
ia
Au
stra
lia
Ind
on
esia
Ind
ia
Can
ada
Iran
Iraq
UA
E
Qat
ar
Sou
th A
fric
a
No
rway
Kaz
akh
stan
Ku
wai
t
Bra
zil
Mex
ico
Ven
ezu
ala
Alg
eria
Bill
ion
to
nn
es o
f C
O2
Gas
Oil
Coal

High Carbon from a Land Down Under 17
Figure 7: World’s biggest fossil fuel mining countries, by CO2 potential
Source: IEA (2018) World Energy Balances; IPCC (2006) IPCC Guidelines, as described in text
CO2 MINED PER CAPITA
For every Australian, companies operating in Australia mine 57 tonnes of fossil fuel
CO2 per year. That is ten times more than the world average.
To help put that in context, annual CO2 potential from Australian fossil fuel production
weighs about the same as 100 cows or 35 mid-size cars per Australian.
High Carbon from a Land Down Under 18
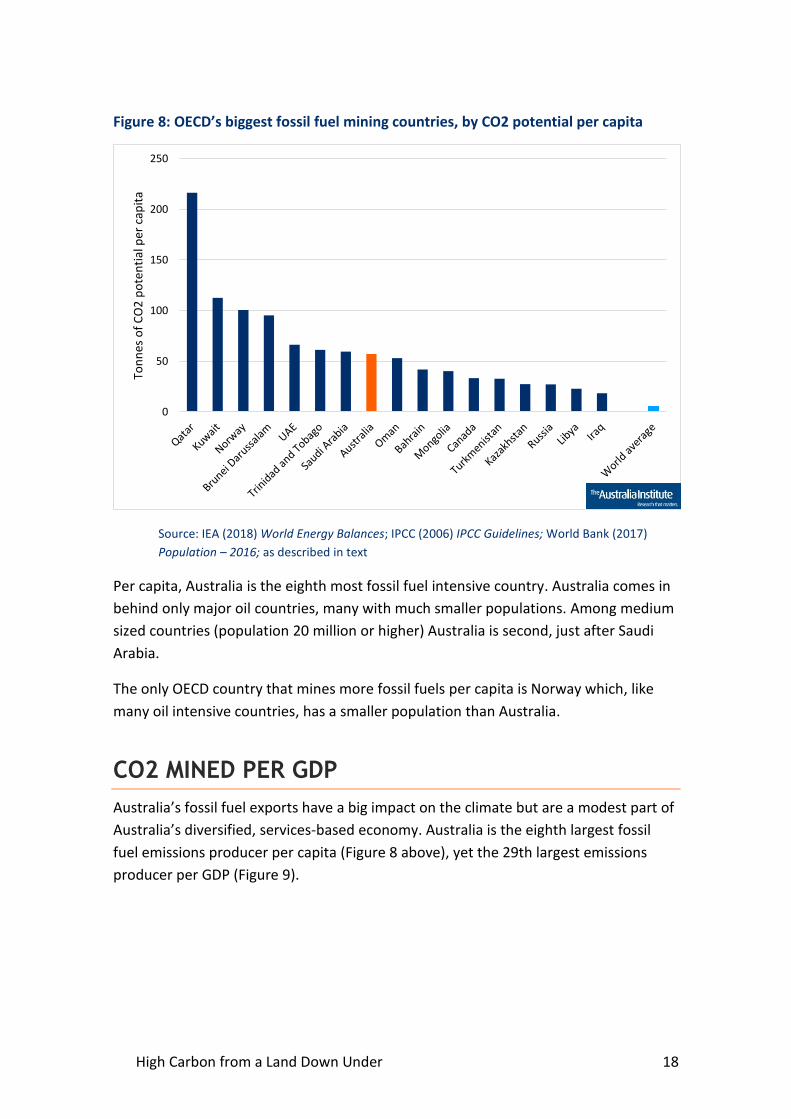
Figure 8: OECD’s biggest fossil fuel mining countries, by CO2 potential per capita
Source: IEA (2018) World Energy Balances; IPCC (2006) IPCC Guidelines; World Bank (2017)
Population – 2016; as described in text
Per capita, Australia is the eighth most fossil fuel intensive country. Australia comes in
behind only major oil countries, many with much smaller populations. Among medium
sized countries (population 20 million or higher) Australia is second, just after Saudi
Arabia.
The only OECD country that mines more fossil fuels per capita is Norway which, like
many oil intensive countries, has a smaller population than Australia.
CO2 MINED PER GDP
Australia’s fossil fuel exports have a big impact on the climate but are a modest part of
Australia’s diversified, services-based economy. Australia is the eighth largest fossil
fuel emissions producer per capita (Figure 8 above), yet the 29th largest emissions
producer per GDP (Figure 9).
0
50
100
150
200
250
Ton
nes
of
CO
2 p
ote
nti
al p
er c
apit
a

High Carbon from a Land Down Under 19
Figure 9: World’s biggest fossil fuel mining countries, by CO2 potential per $USm GDP
Source: IEA (2018) World Energy Balances; IPCC (2006) IPCC Guidelines, as described in text
Figure 9 shows that while Australia produces more fossil fuel CO2 per capita than
countries like Iraq, Iran, Russia and Kazakhstan, Australia’s economy is far less
dependent on fossil fuel CO2. In other words, Australia has a much more diverse
economy than these other countries. Australia has many more sources of income and
employment than fossil fuels, unlike countries such as Qatar and Libya, where GDP is
dominated by oil and gas production.
Despite being a massive fossil fuel producer, in absolute terms and by population,
Australia’s economy is far less dependent on fossil fuel carbon than other fossil fuel
dependent countries.
This reflects the diverse nature of Australia’s economy. Most Australian jobs are in
services. Coal mining in Australia employs less than 0.5% of Australia’s workforce, five
times less than the arts and recreation sector employs.18 Despite this diversity,
Australia is unsurprisingly well above most countries with CO2 per GDP twice the world
average.
18 ABS (2019) 6291.0.55.003 - Labour Force, Australia, Detailed, Quarterly, Feb 2019,
https://www.abs.gov.au/AUSSTATS/[email protected]/DetailsPage/6291.0.55.003Feb%202019
2,000
4,000
6,000
8,000
10,000
12,000
Ton
nes
of
CO
2 p
ote
nti
al p
er U
S$m
GD
P

High Carbon from a Land Down Under 20
Australia: the third biggest fossil
fuel exporter
China and the USA both produce a large amount of fossil fuels, but with such large
populations they consume much more of what they produce. Australia by contrast,
produces fossil fuels well in excess of domestic consumption and most of what is
produced is exported.
Australia exports fossil fuels equal to 1.1 billion tonnes of CO2 a year. This is more than
double Australia’s domestic emissions, as shown in Figure 10 below:
Figure 10: Australia's domestic emissions vs fossil fuel exports
Source: IEA (2018) World Energy Balances; IPCC (2006) IPCC Guidelines, as described in text;
Commonwealth of Australia (2019) Quarterly Update of Australia's National Greenhouse Gas
Inventory for September 2018
Note the data compared above are from 2017. Both Australia’s domestic emissions
and its gas emissions are higher in 2019.
Compared with all other countries, Australia is third biggest fossil fuel exporter by CO2
potential.
530 Mt CO2e
1,147 Mt CO2
Australia's domestic emissionsAustralia's fossil fuel exports (CO2
potential)
High Carbon from a Land Down Under 21
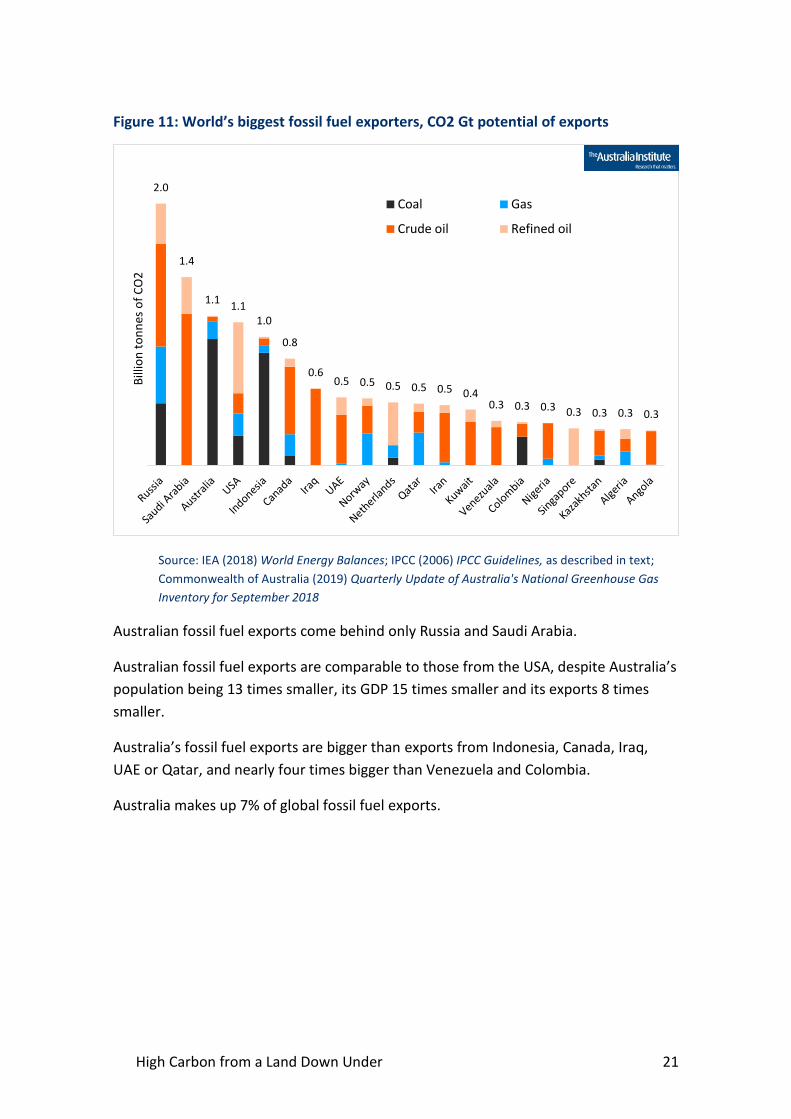
Figure 11: World’s biggest fossil fuel exporters, CO2 Gt potential of exports
Source: IEA (2018) World Energy Balances; IPCC (2006) IPCC Guidelines, as described in text;
Commonwealth of Australia (2019) Quarterly Update of Australia's National Greenhouse Gas
Inventory for September 2018
Australian fossil fuel exports come behind only Russia and Saudi Arabia.
Australian fossil fuel exports are comparable to those from the USA, despite Australia’s
population being 13 times smaller, its GDP 15 times smaller and its exports 8 times
smaller.
Australia’s fossil fuel exports are bigger than exports from Indonesia, Canada, Iraq,
UAE or Qatar, and nearly four times bigger than Venezuela and Colombia.
Australia makes up 7% of global fossil fuel exports.
2.0
1.4
1.11.1
1.0
0.8
0.60.5 0.5 0.5 0.5 0.5 0.4
0.3 0.3 0.3 0.3 0.3 0.3 0.3
Bill
ion
to
nn
es o
f C
O2
Coal Gas
Crude oil Refined oil

High Carbon from a Land Down Under 22
Figure 12: World’s biggest fossil fuel exporters, CO2 potential
Source: IEA (2019) World energy balances; IPCC (2006) IPCC Guidelines, as described in text
As discussed in the method section, the analysis here includes secondary or refined oil
products and is based on the most recent complete IEA datasets for each fuel from the
April 2019 release: 2017 for coal and gas and 2016 for oil.19
The USA has in recent years been exporting increasing amounts both refined and crude
oil. Both of these increased in 2017. The USA may soon be a net exporter and may
have overtaken Australia. At the same time, Australia’s gas exports have increased
since 2017 and it is now the world’s largest exporter of Liquified Natural Gas (LNG).
Complete data for more recent years is needed for this comparison.
19 The analysis includes both oil products refined in the country of extraction and where imported for
refining. The latter includes the USA, the Netherlands and Singapore. Excluding secondary oil sees these
countries all fall much further down the list. The USA is unique among these countries: it is at the same
time a major producer, a major exporter and a major importer of different forms of oil.
High Carbon from a Land Down Under 23
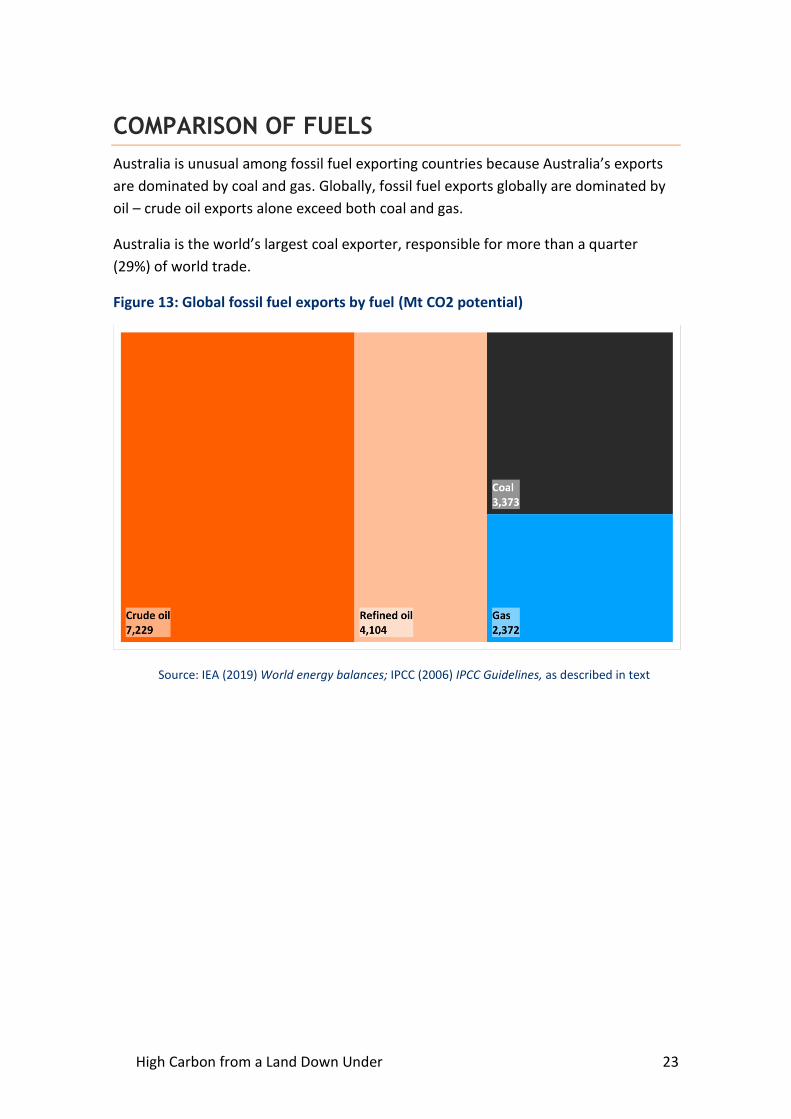
COMPARISON OF FUELS
Australia is unusual among fossil fuel exporting countries because Australia’s exports
are dominated by coal and gas. Globally, fossil fuel exports globally are dominated by
oil – crude oil exports alone exceed both coal and gas.
Australia is the world’s largest coal exporter, responsible for more than a quarter
(29%) of world trade.
Figure 13: Global fossil fuel exports by fuel (Mt CO2 potential)
Source: IEA (2019) World energy balances; IPCC (2006) IPCC Guidelines, as described in text

High Carbon from a Land Down Under 24
Figure 14: Share of global coal exports
Source: IEA (2019) World energy balances; IPCC (2006) IPCC Guidelines, as described in text
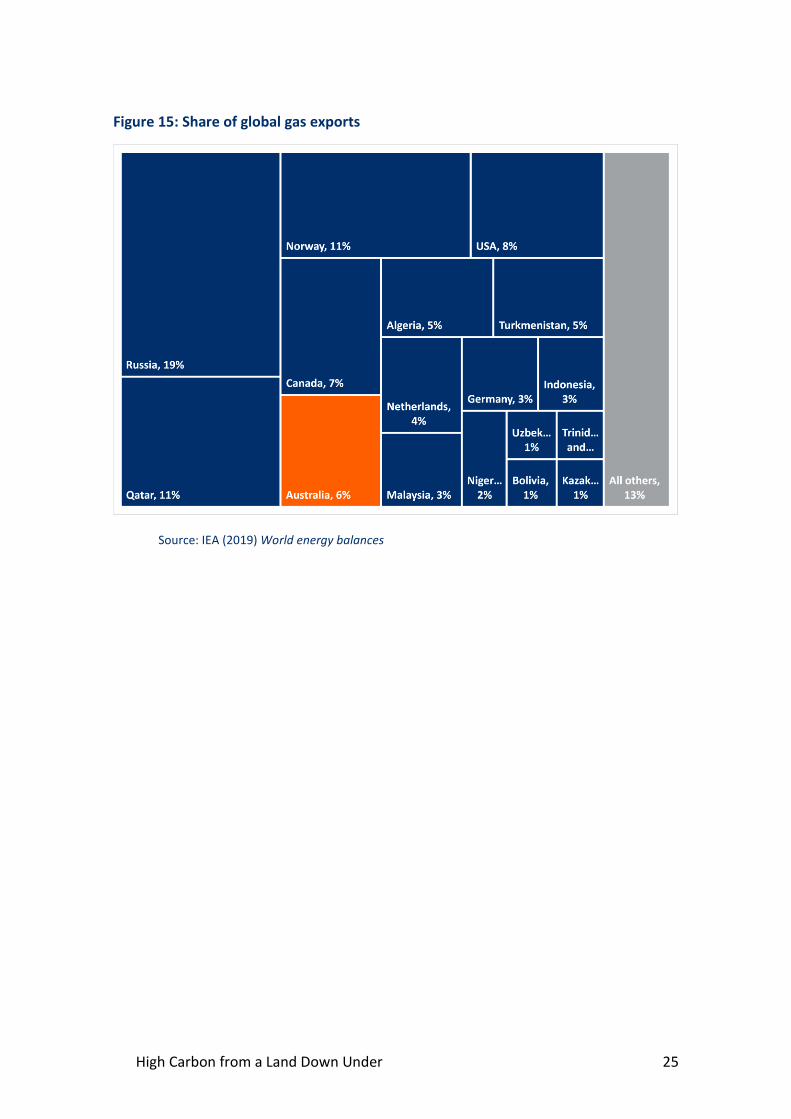
On the 2017 data, Australia is the sixth biggest gas exporter in the world. Other gas
producing countries, like Russia, use pipelines to export gas. Australia’s gas exports are
LNG. As noted, Australia’s LNG exports have increased since 2017. Australia’s LNG
exports overtook Qatar’s in late 2018, making Australia the world’s biggest LNG
exporter.20
20 Jaganathan (2018) Australia grabs world's biggest LNG exporter crown from Qatar in Nov,
https://www.reuters.com/article/us-australia-qatar-lng/australia-grabs-worlds-biggest-lng-exporter-
crown-from-qatar-in-nov-idUSKBN1O907N
High Carbon from a Land Down Under 25
Figure 15: Share of global gas exports
Source: IEA (2019) World energy balances

High Carbon from a Land Down Under 26
CO2 EXPORTED PER OVERALL EXPORT VALUE
Australia’s exports of fossil fuels are enormous by global standards, but Australia is far
less economically reliant on fossil fuel exports than other exporting countries.
The following figures show CO2 exported per value of all exports, and per GDP.
Figure 16: Fossil fuel intensity of exports (tCO2 exported / US$m exports)
Source: IEA (2019) World energy balances; IPCC (2006) IPCC Guidelines; World Bank (2019)
World Bank Open Data, as described in text
Despite being the third biggest fossil fuel exporter globally, Australia’s economy is less
dominated by those exports than many other exporting economies.
Relative to exports overall, Australia is the 24th biggest fossil fuel exporter. Australia
exports far more than Mongolia, Iraq, and Mozambique, but Australian exports overall
are half as fossil fuel intensive as exports from these countries.
Similarly, relative to GDP, Australia’s economy is the 27th biggest fossil fuel exporter.
0
2000
4000
6000
8000
10000
12000
14000
16000
tCO
2 e
xpo
rted
/ U
S$m
exp
ort
s

High Carbon from a Land Down Under 27
Figure 17: Fossil fuel export intensity of GDP (tCO2 exported / US$m GDP)
Source: IEA (2019) World energy balances; IPCC (2006) IPCC Guidelines; World Bank (2019)
World Bank Open Data, as described in text
These results are even more striking because Australia is the seventh biggest fossil fuel
exporter per capita.
0
1000
2000
3000
4000
5000
6000
7000
8000
9000tC
O2
exp
ort
ed /
US$
m G
DP
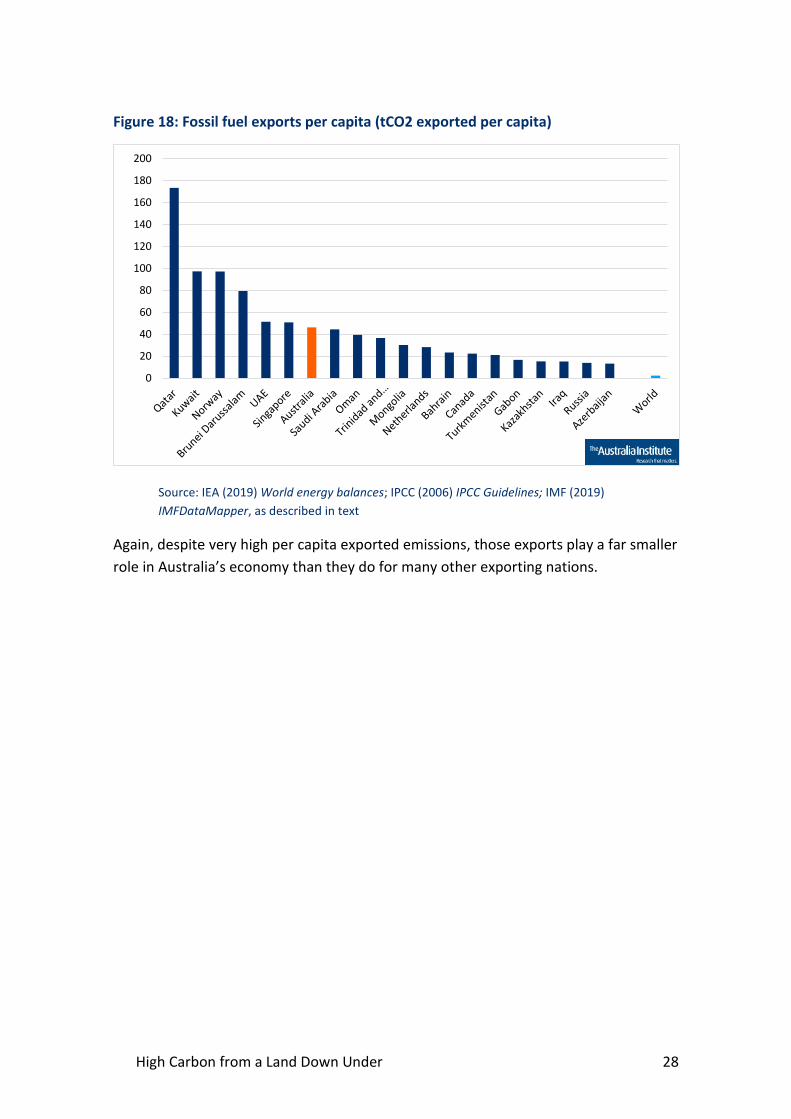
High Carbon from a Land Down Under 28
Figure 18: Fossil fuel exports per capita (tCO2 exported per capita)
Source: IEA (2019) World energy balances; IPCC (2006) IPCC Guidelines; IMF (2019)
IMFDataMapper, as described in text
Again, despite very high per capita exported emissions, those exports play a far smaller
role in Australia’s economy than they do for many other exporting nations.
0
20
40
60
80
100
120
140
160
180
200

High Carbon from a Land Down Under 29
Australia and friends
Australia is a huge fossil fuel exporter by world standards, but even bigger in the
context of country groups that it is a member of: the OECD, the G20 and the
Commonwealth.
IN THE OECD
Australia is the biggest fossil fuel exporter in the OECD, just ahead of the USA.
Australia’s fossil fuel exports make up 20% of OECD exports.
In per capita terms, Australia is the second biggest producer and exporter of fossil fuels
in the OECD. The US is the twelfth largest exporter per capita, and the fourth largest
producer per capita. Norway is the largest, due to nearly all its substantial oil
production being exported, and its small population.
Figure 19: OECD fossil fuel exports (Mt CO2 potential)
Source: IEA (2019) World energy balances; IPCC (2006) IPCC Guidelines
0
200
400
600
800
1000
1200
1400
Mt
CO
2 p
ote
nti
al

High Carbon from a Land Down Under 30
Figure 20: OECD fossil fuel exports, share of total
Source: IEA (2019) World energy balances, IPCC (2006) Guidelines, as described in text
Figure 21: OECD fossil fuel exports, share of total
Source: IEA (2019) World energy balances; IPCC (2006) IPCC Guidelines; IMF (2019)
IMFDataMapper, as described in text
-
20
40
60
80
100
120
tCO
2 p
er c
apit
a
Exports per capita Production per capita

High Carbon from a Land Down Under 31
IN THE G20
The Group of 20 (G20) includes the governments of nineteen countries, which together
make up around 85% all of world economic activity (measured by GDP) and two thirds
of the world’s population.21 (Note it also includes the EU – here excluded.)
Australia makes up 12% of G20 fossil fuel exports.
The G20 includes the largest exporters, but leaves out many smaller countries with
substantial exports. As a result, Australia’s fossil fuel production and exports are a
bigger share of the G20 than they are of the global total.
Australia ranks third in the G20, the same place it ranks in the world overall. G20
members Russia and Saudi Arabia are larger exporters than Australia.
Figure 22: G20 country fossil fuel exports – Mt CO2 potential
Source: IEA (2019) World energy balances, IPCC (2006) Guidelines, as described in text
In terms of fossil fuel production in the G20, Australia makes up 5% of G20 fossil fuel
production. It comes in at fifth place, as it does globally.
In per capita terms, Australia is the largest exporter of fossil fuels in the G20, just
ahead of Saudi Arabia, and the second largest producer of fossil fuels, just behind
Saudi Arabia.
21 DFAT (2019) The G20, https://dfat.gov.au/trade/organisations/g20/Pages/g20.aspx
500
1,000
1,500
2,000
2,500

High Carbon from a Land Down Under 32
Figure 23: G20 country fossil fuel exports – Mt CO2 potential per capita
Source: IEA (2019) World energy balances; IPCC (2006) IPCC Guidelines; IMF (2019)
IMFDataMapper, as described in text
-
10
20
30
40
50
60
70
Exports per capita Production per capita
High Carbon from a Land Down Under 33
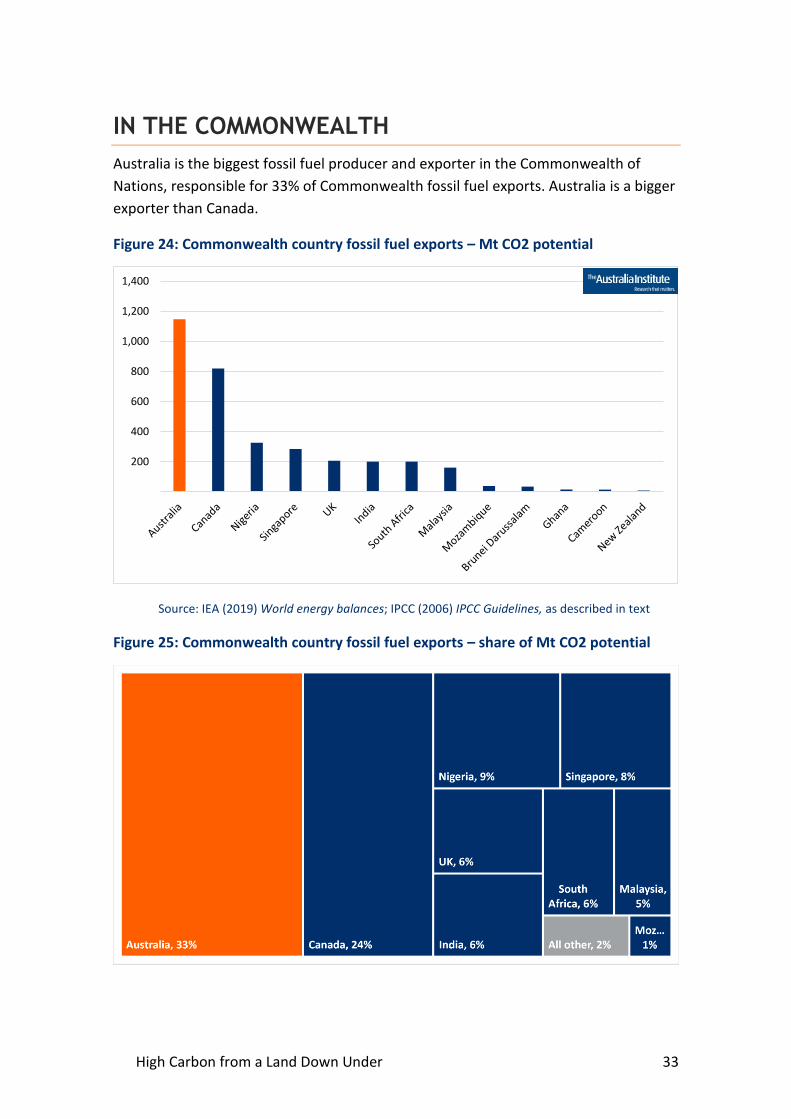
IN THE COMMONWEALTH
Australia is the biggest fossil fuel producer and exporter in the Commonwealth of
Nations, responsible for 33% of Commonwealth fossil fuel exports. Australia is a bigger
exporter than Canada.
Figure 24: Commonwealth country fossil fuel exports – Mt CO2 potential
Source: IEA (2019) World energy balances; IPCC (2006) IPCC Guidelines, as described in text
Figure 25: Commonwealth country fossil fuel exports – share of Mt CO2 potential
200
400
600
800
1,000
1,200
1,400

High Carbon from a Land Down Under 34
Source: IEA (2019) World energy balances; IPCC (2006) IPCC Guidelines; IMF (2019)
IMFDataMapper, as described in text
Australia is also the largest producer of fossil fuels in the Commonwealth, producing
25%, more than India (23%) or Canada (22%).
Figure 26: Commonwealth country fossil fuel production – Mt CO2 potential
Source: IEA (2019) World energy balances; IPCC (2006) IPCC Guidelines, as described in text
0
200
400
600
800
1000
1200
1400
1600

High Carbon from a Land Down Under 35
VS EU
Australia fossil fuel exports are more than double any country in the European Union.22
Figure 27: Australia vs EU country fossil fuel exports – Mt CO2 potential
Source: IEA (2019) World energy balances; IPCC (2006) IPCC Guidelines, as described in text
Australia’s fossil fuel CO2 exports are 2.4 times bigger than the Netherlands’, 5.6 times
bigger than Germany’s, and 8.2 times bigger than Germany’s.
Australia’s fossil fuel exports contain CO2 potential of 74% of the fossil fuel exports of
the entire EU.
The EU has a population more than 20 times bigger than Australia and a combined
GDP 13 times bigger than Australia’s. Yet EU countries export only 1.35 times as much
CO2 as Australia.
22 These figures include exports between countries within EU; they are not restricted to EU country
exports out of the EU.
0
200
400
600
800
1000
1200
1400
mtC
O2
exp
ort
s
High Carbon from a Land Down Under 36
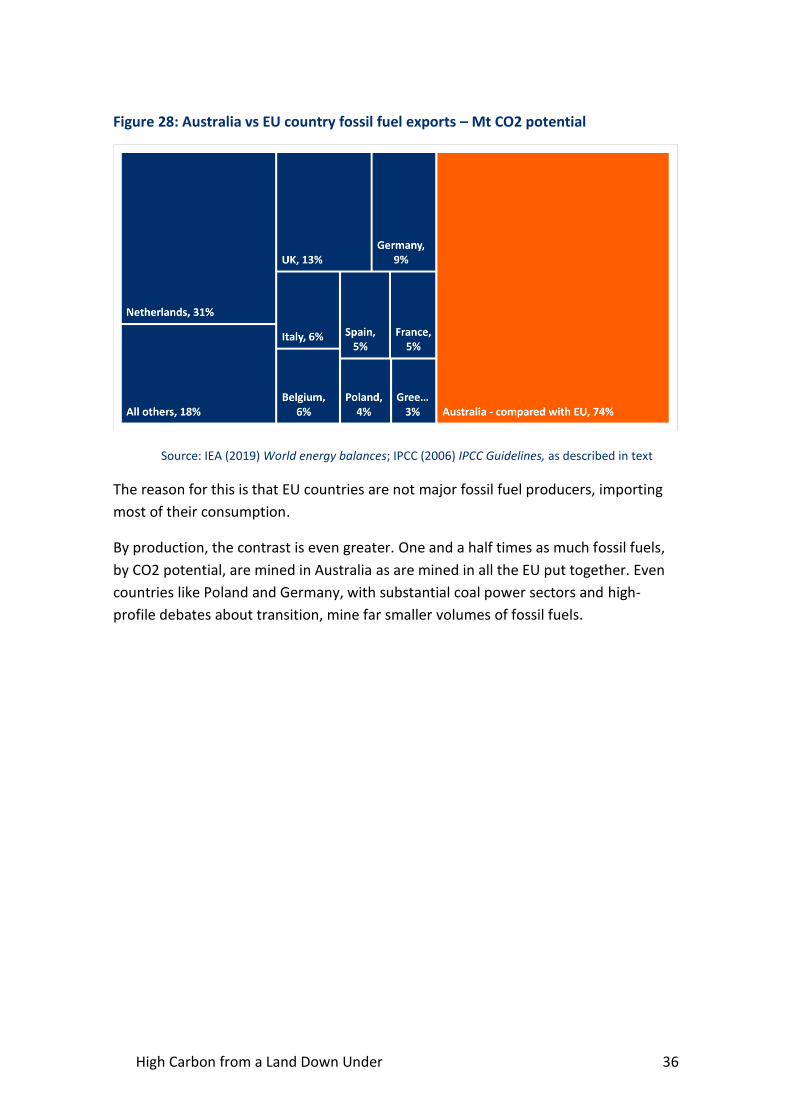
Figure 28: Australia vs EU country fossil fuel exports – Mt CO2 potential
Source: IEA (2019) World energy balances; IPCC (2006) IPCC Guidelines, as described in text
The reason for this is that EU countries are not major fossil fuel producers, importing
most of their consumption.
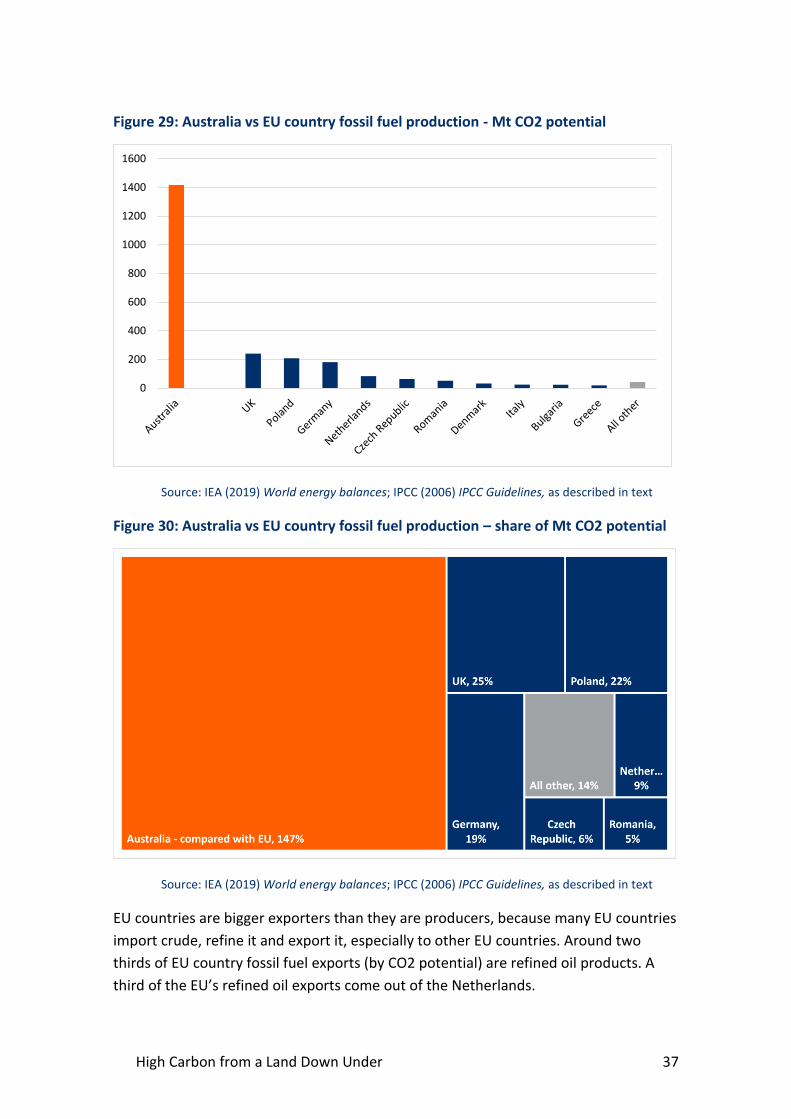
By production, the contrast is even greater. One and a half times as much fossil fuels,
by CO2 potential, are mined in Australia as are mined in all the EU put together. Even
countries like Poland and Germany, with substantial coal power sectors and high-
profile debates about transition, mine far smaller volumes of fossil fuels.
High Carbon from a Land Down Under 37
Figure 29: Australia vs EU country fossil fuel production - Mt CO2 potential
Source: IEA (2019) World energy balances; IPCC (2006) IPCC Guidelines, as described in text
Figure 30: Australia vs EU country fossil fuel production – share of Mt CO2 potential
Source: IEA (2019) World energy balances; IPCC (2006) IPCC Guidelines, as described in text
EU countries are bigger exporters than they are producers, because many EU countries
import crude, refine it and export it, especially to other EU countries. Around two
thirds of EU country fossil fuel exports (by CO2 potential) are refined oil products. A
third of the EU’s refined oil exports come out of the Netherlands.
0
200
400
600
800
1000
1200
1400
1600

High Carbon from a Land Down Under 38
VS OPEC
If Australia was in OPEC, it would have the second biggest carbon exports, behind only
Saudi Arabia. Australia’s CO2 exports are twice as big as Iraq’s, the second biggest
OPEC exporter.
Figure 31: Australia vs OPEC country fossil fuel exports – Mt CO2 potential
Source: IEA (2019) World energy balances; IPCC (2006) IPCC Guidelines, as described in text
Australia’s carbon exports are 24% of the carbon exports from the 13 OPEC
countries.23
23 NB: Equatorial Guinea is also an OPEC country with small exports by comparison to most OPEC
countries. It is excluded as its IEA data is unavailable.
0
200
400
600
800
1000
1200
1400
1600
mtC
O2
exp
ort
ed

High Carbon from a Land Down Under 39
Figure 32: Australia vs OPEC country fossil fuel exports – share of Mt CO2 potential
Source: IEA (2019) World energy balances; IPCC (2006) IPCC Guidelines, as described in text
High Carbon from a Land Down Under 40
Why exports matter
For decades, climate policymakers have focused on reducing emissions within
individual countries. Under UN emissions accounting, countries are responsible only
for emissions from within their territory. Fossil fuels they mine and export are
irrelevant.
This misses half the picture. Climate policy should cut with ‘both arms of the scissors’,
addressing both fossil fuel demand and supply.24
Basic principles of economics suggest that increasing supply of a good puts downwards
pressure on the price of that good. By increasing the supply of coal, coal power
becomes cheaper. This encourages increased coal consumption in both the short-term
(increased generation) and in the longer term (new coal assets or delayed retirement)
over other energy sources that do not cause the same harms.
Conversely, efforts to reduce consumption of fossil fuels lower prices, encouraging
consumption in other markets. This can cause rebound effects that increase emissions
elsewhere, as well as a ‘green paradox’ where resource owners race to exploit
resources ahead of constraints on demand.
Stopping new supply puts upwards pressure on prices. It therefore secures revenue
and employment in existing operations, while allowing sensible planning for the end of
existing operations.
Building new high carbon assets ‘locks in’ emissions, allowing their operation at
marginal costs lower than required to justify construction. Stopping new supply
infrastructure stops lock-in, prevents stranded assets and redirects capital to low
carbon alternatives.
Implementing and administering supply side policy costs relatively little. It is easy to
stop new coalmines and to tell whether a country is building new ones.
Supply policy is easy to understand and mobilise around support around. It can
mobilise support both from those who would be impacted by new projects, and the
owners of existing fossil fuel assets, who stand benefit from higher prices.
24 This section summarises arguments in Green and Denniss (2018) Cutting with both arms of the
scissors: the economic and political case for restrictive supply-side climate policies,
https://link.springer.com/content/pdf/10.1007%2Fs10584-018-2162-x.pd

High Carbon from a Land Down Under 41
Some countries and subnational jurisdictions have announced moratoria on new coal
or oil production, including China and the US (both temporary and elapsed), France,
New Zealand and Myanmar. There are moratoria on unconventional gas in many states
of the USA and Australia.
Yet such supply side climate policy remains largely alien to official climate policy.
Words like ‘coal’ and ‘oil’ and ‘fossil fuels’ do not appear in the Paris Agreement nor in
any previous treaties. There is no provision under the Paris Agreement for including
supply side policies as part of Nationally Determined Contributions or ‘Paris pledges’.
Indeed, there is no authoritative data set on the emissions from internationally traded
fossil fuels.
On the economics of fossil fuels, official climate policy-making misses half the story –
and for Australia, most of it.
MORE EXPORTS PUSH EMISSIONS DOWN?
Fossil fuel companies and most Australian politicians generally try to avoid talking
about the climate implications of Australia’s exports. Pressed on the issue they have
traditionally claimed either that the exports make no difference to world emissions or
that they are not Australia’s responsibility.
Recently, many have changed approach. For example, the Minister for Energy and
Emission Reduction welcomed rising domestic emissions from LNG exports because
the gas will help countries transition away from coal.
The Australian government is now accepting the basic principle that what Australia
does and does not export has an impact on world emissions. But this acceptance is
selective and dubious.
Neither the government nor the gas industry have provided clear evidence as to
whether and to what extent LNG is in fact displacing coal, rather than displacing other
LNG producers, or renewables, or increasing overall energy consumption.
Moreover, Australian governments continue to reject responsibility for the vast scale
of Australia’s exported emissions. Those arguing that LNG displaces coal have not
supported a moratorium on new coal mines.

High Carbon from a Land Down Under 42
Conclusion
Australian government ministers argue Australia’s emissions are small on a global
scale. They use this as an excuse for delaying effective action on climate. But on any
reasonable assessment of domestic emissions alone, Australia is a large emitter and
Australia’s emissions are rising, not falling.
Australia is in the top 10% of global emitters, and our emissions are climbing.
Australia’s domestic emissions are larger than forty other countries that have larger
populations.
However, Australia’s role in fuelling the climate crisis is far greater than even its large
and rising domestic emissions would suggest.
Australia’s fossil fuel industries already make it the third largest fossil fuel exporter in
the world, and it plans to increase its coal and gas exports.
The Australian Parliament ratified the Paris Agreement less than a year after it was
signed (a record speed for Australia’s Parliament)25 and the Agreement continues to
have the support of most Australians.26 The Paris Agreement’s global goal requires
countries to increase ambition over time to achieve large emissions cuts in the next
decade and reach net zero emissions by mid-century. The Agreement calls on
developed countries like Australia to lead the way. And Australia is well positioned to
do so.
Australia’s economy is far more diversified and less dominated by fossil fuels than
many other major exporting countries.
Australia has the opportunity, and obligation, to face up to the climate crisis through
policies to limit its carbon exports, starting with a moratorium on new coal mines.
Those in the global community making efforts to confront the climate crisis must
understand the scale of Australia’s fossil fuel existing exports and policies to increase
Australia’s fossil fuel exports even further.
25 Foreign Minister Julie Bishop (2016) Media Release – Paris Agreement Ratification,
https://foreignminister.gov.au/releases/Pages/2016/jb_mr_161110a.aspx?w=tb1CaGpkPX%2FlS0K%2
Bg9ZKEg%3D%3D 26 Bennett (2018) Climate of the Nation Report 2018, http://www.tai.org.au/content/climate-nation-
2018