High capacity gas storage in corrugated porous graphene with a specific surface area-lossless...
9
Electronic Supplementary Information (ESI) High Capacity Gas Storage in Corrugated Porous Graphene with a Specific Surface Area-Lossless Tightly Stacking Manner Guoqing Ning, Chenggen Xu, Liang Mu, Guangjin Chen, Gang Wang, Jinsen Gao, Zhuangjun Fan, Weizhong Qian and Fei Wei 1. Detailed experimental methods 1) Preparation of MgO template First, purchased MgO powder (Sinopharm Chemical Reagent Co. Ltd.) was mixed with deionized water accompanied with ultrasonic agitation. The mixture was boiledfor 24 hr in a reflux apparatus. After filtration and drying, the material obtained was ground into a fine powder. Finally, the powder was calcined at 500°Cfor 30 min to remove water. 2) Synthesis of nanomesh graphene (NMG) Porous graphene was synthesized by CH 4 cracking at 875 °C in a vertical quartz reactor with diameter of 50 mm and length of 1500 mm. A sintered porous plate was used as the gas distributor at the bottom of the reactor. Gas entered the bottom preheater of the reactor, then passed through the gas distributor, and finally flowed out into the atmosphere. On the top of the quartz reactor, there was a stainless steel plate with a hopper for feeding catalyst. In a typical run, the quartz reactor was mounted in an electrical tube furnace and was heated to 875 °C in an argon flow of 1000 ml/min at atmospheric pressure. Once the reaction temperature was reached, 500 ml/min CH 4 was introduced into the reactor. Then, the MgO template (about 30 g) was fed into the reactor over 5 min from the top hopper. After 10 min carbon deposition, CH 4 was turned off and the reactor was cooled to room temperature in an Ar atmosphere. The as-obtained material was collected for purification and characterization. 3) Purification In a typical purification process, first, ~30 g unpurified material was mixed with 200 mL deionized water accompanied with violent agitation, resulting in an even suspension. Then 750 mL diluted hydrochloric acid (condensed hydrochloric acid diluted by deionized water with a volume ratio of 1:4, excessive amount) was added into the suspension, followed by reflux for 1 hour. Finally, the as-obtained black suspension was filtrated and dried at 100 °C overnight in an oven (labelled as G-W) or at -20 °C for 24 h in a freeze drying mathine (G-F). The material obtained was Electronic Supplementary Material (ESI) for Chemical Communications This journal is © The Royal Society of Chemistry 2012
Transcript of High capacity gas storage in corrugated porous graphene with a specific surface area-lossless...

Electronic Supplementary Information (ESI)
High Capacity Gas Storage in Corrugated Porous
Graphene with a Specific Surface Area-Lossless
Tightly Stacking Manner
Guoqing Ning, Chenggen Xu, Liang Mu, Guangjin Chen, Gang Wang, Jinsen Gao, Zhuangjun Fan,
Weizhong Qian and Fei Wei
1. Detailed experimental methods
1) Preparation of MgO template
First, purchased MgO powder (Sinopharm Chemical Reagent Co. Ltd.) was mixed with deionized
water accompanied with ultrasonic agitation. The mixture was boiledfor 24 hr in a reflux apparatus.
After filtration and drying, the material obtained was ground into a fine powder. Finally, the powder
was calcined at 500°Cfor 30 min to remove water.
2) Synthesis of nanomesh graphene (NMG)
Porous graphene was synthesized by CH4 cracking at 875 °C in a vertical quartz reactor with
diameter of 50 mm and length of 1500 mm. A sintered porous plate was used as the gas distributor at
the bottom of the reactor. Gas entered the bottom preheater of the reactor, then passed through the
gas distributor, and finally flowed out into the atmosphere. On the top of the quartz reactor, there
was a stainless steel plate with a hopper for feeding catalyst. In a typical run, the quartz reactor was
mounted in an electrical tube furnace and was heated to 875 °C in an argon flow of 1000 ml/min at
atmospheric pressure. Once the reaction temperature was reached, 500 ml/min CH4 was introduced
into the reactor. Then, the MgO template (about 30 g) was fed into the reactor over 5 min from the
top hopper. After 10 min carbon deposition, CH4 was turned off and the reactor was cooled to room
temperature in an Ar atmosphere. The as-obtained material was collected for purification and
characterization.
3) Purification
In a typical purification process, first, ~30 g unpurified material was mixed with 200 mL
deionized water accompanied with violent agitation, resulting in an even suspension. Then 750 mL
diluted hydrochloric acid (condensed hydrochloric acid diluted by deionized water with a volume
ratio of 1:4, excessive amount) was added into the suspension, followed by reflux for 1 hour.
Finally, the as-obtained black suspension was filtrated and dried at 100 °C overnight in an oven
(labelled as G-W) or at -20 °C for 24 h in a freeze drying mathine (G-F). The material obtained was
Electronic Supplementary Material (ESI) for Chemical CommunicationsThis journal is © The Royal Society of Chemistry 2012

ground into a fine powder for characterization and application.
For contrast, the other two purification processes were also performed: ①diluted hydrochloric
acid (by water, 1:1 in volume) was used; ② concentrated hydrochloric acid was directly added
drop by drop.
4) Tablet pressing and volume measurement
The freeze-dried NMG sample (G-F) was used to make NMG tablets by a tablet press machine.
Photos of the tablets were taken to measure their volume. The tablets can be regarded as cylinders,
and the volume of the tablets was calculated by measuring the height and the diameter of the
cylinders on the photos. As shown in Fig. S1, the diameter of the tablets (1.3 cm) is fixed by the
mould, and the height of the pile of tablets was measured using the diameter as a ruler.
Fig. S1 A photo of piled NMG tablets.
5) Gas storage
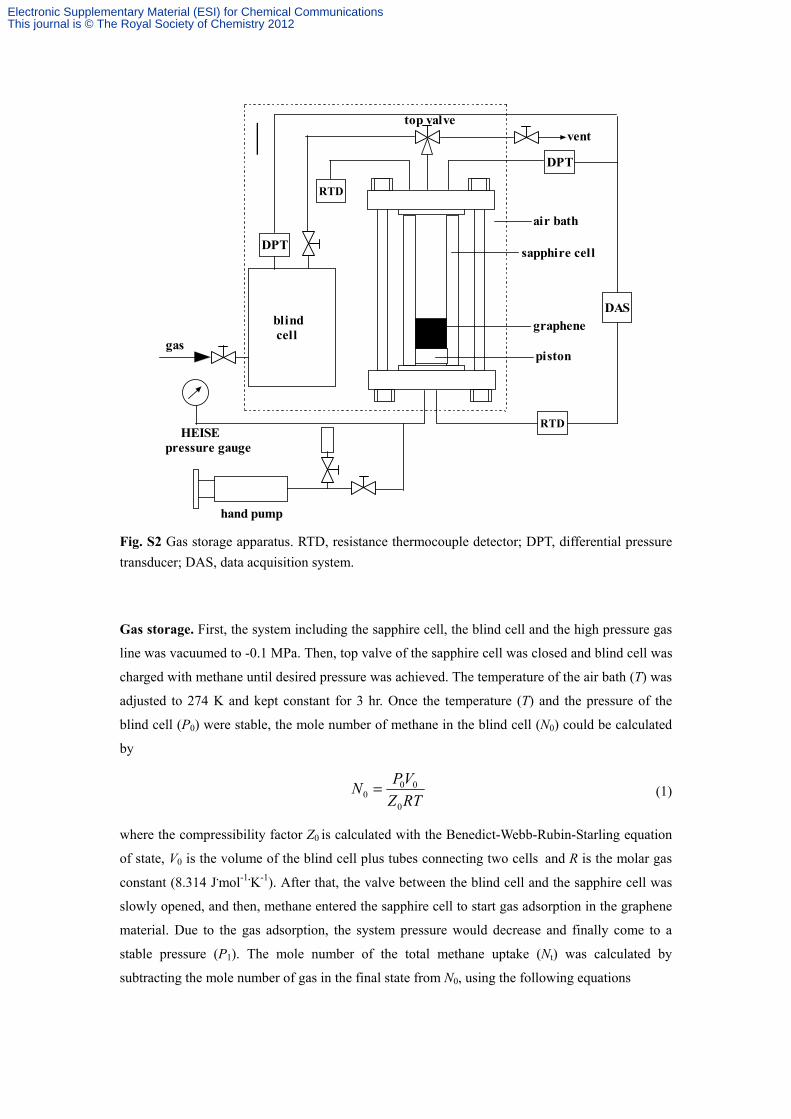
Fig. S2 is the sketch map of the gas storage apparatus. Methane and hydrogen storage in
graphene materials was performed at 274 K and up to 9 MPa. Carbon dioxide storage
was tested at 274 K and up to 3 MPa since the liquefaction pressure of carbon dioxide
is 3.6 MPa at 274 K. The process for methane storage and the calculation method are
described as followed for an example.
Sample loading. First, the sapphire cell was dismounted from the apparatus, washed with distilled
water, and dried. It was then loaded with 1-10 mL or 1-5 g graphene material, which was weighed
precisely using a balance with a precision of 0.1 mg. In the case of testing methane uptake in
wetted material, a certain amount of distilled water was immersed into the graphene slowly and
evenly. After that, the cell was installed into the apparatus again.
Electronic Supplementary Material (ESI) for Chemical CommunicationsThis journal is © The Royal Society of Chemistry 2012
RTD
DPT
vent
RTD
top valve
hand pump
air bath
sapphire cell
graphene
piston
DAS
HEISEpressure gauge
DPT
blind cell
gas
Fig. S2 Gas storage apparatus. RTD, resistance thermocouple detector; DPT, differential pressure
transducer; DAS, data acquisition system.
Gas storage. First, the system including the sapphire cell, the blind cell and the high pressure gas
line was vacuumed to -0.1 MPa. Then, top valve of the sapphire cell was closed and blind cell was
charged with methane until desired pressure was achieved. The temperature of the air bath (T) was
adjusted to 274 K and kept constant for 3 hr. Once the temperature (T) and the pressure of the
blind cell (P0) were stable, the mole number of methane in the blind cell (N0) could be calculated
by
RTZ
VPN
0
000 = (1)
where the compressibility factor Z0 is calculated with the Benedict-Webb-Rubin-Starling equation
of state, V0 is the volume of the blind cell plus tubes connecting two cells and R is the molar gas
constant (8.314 J.mol-1.K-1). After that, the valve between the blind cell and the sapphire cell was
slowly opened, and then, methane entered the sapphire cell to start gas adsorption in the graphene
material. Due to the gas adsorption, the system pressure would decrease and finally come to a
stable pressure (P1). The mole number of the total methane uptake (Nt) was calculated by
subtracting the mole number of gas in the final state from N0, using the following equations
Electronic Supplementary Material (ESI) for Chemical CommunicationsThis journal is © The Royal Society of Chemistry 2012

RTZ
VPNN
1
110t −= (2)
Cs01 VVVV −+= (3)
where Z1 is the compressibility factor at T and P1, V1 is the volume of the free space in the
sapphire cell and the blind cell, Vs is the volume of the sapphire cell and VC is the volume of the
carbon material.
The gravimetric capacity of the total methane uptake (Mt in mmol/g or Wt in mg/g) was
determined by
m
NM
1000tt
×= (4)
m
MNW
1000tt
×= (5)
where m is the mass of the carbon material, M is the molecule molar mass of methane.
The volumetric capacity of the total methane uptake (St, v(STP)/v) was determined by
C
tt
22400
V
NS
×= (6)
where 22400 mL/mol is the molar gas volume at standard temperature and pressure.
The mole number of methane adsorped in the pores of the carbon material (Np) was calculated by
subtracting the mole number of gas in the free space in the carbon material from Nt, using the
following equation
RTZ
εVPNN
1
c1tp −= (7)
CfC
f 11Vρ
m
V
Vε −=−= (8)
where ε is the void ratio of the carbon material, Vf is the framework volume of the carbon material,
ρf is the framework density of the carbon material (2.2 g/mL). The net storage capacity of carbon
material excluding the free gas in the void of carbon material bed is then defined as,
m
NS
1000pn
×= (9)
6) Characterization
The NMG samples were characterized by TEM (JEM 2010 operated at 120 kV), SEM (Quanta
200F), atomic force microscope (AFM, SPM-9600), Raman spectroscopy (Renishaw RM2000,
633nm), X-ray photoelectron spectroscopy (XPS, PHI700) and thermogravimetric analysis (TGA,
Electronic Supplementary Material (ESI) for Chemical CommunicationsThis journal is © The Royal Society of Chemistry 2012

Q500) in air flow with a temperature scan of 10°C/min. The specific surface areas (SSA) and pore
size distribution of the samples were measured by N2 adsorption at 77 K using a Micrometritics
ASAP 2010. The mesopore distribution (1.7-300 nm) was calculated by the Barrett-Joyner-Halenda
(BJH) method. The micropore distribution (<2 nm) was calculated by the original
Horvath-Kawazoe (HK) method. The SSA was calculated by the Brunauer-Emmett-Teller (BET)
method. A degasification at 300°C for 30 min was performed before the nitrogen adsorption.
Electronic Supplementary Material (ESI) for Chemical CommunicationsThis journal is © The Royal Society of Chemistry 2012

2. Supplementary images
Fig. S3 TEM images of Mg(OH)2 layers (a) and porous MgO layers after calcination (b, c), which
is used as templates for the synthesis of NMG.
Fig. S4 Typical Raman spectrum of the NMG in comparison with graphite. The 2D peak of the
NMG (2620 cm-1) is obviously downshifted as compared to that of graphite (2685 cm-1),
indicating that the NMG is mainly composed of one to two graphene layers.1 The upshift of
G-band and the downshift of D band for the NMG can be attributed to the existence of more pores
and edges.1-2
Electronic Supplementary Material (ESI) for Chemical CommunicationsThis journal is © The Royal Society of Chemistry 2012

Fig. S5 (a) TGA curves of the NMG samples purified by different processes: No.1, adding
concentrated hydrochloric acid drop by drop; No.2, using 1:1 diluted hydrochloric acid; No.3,
using 1:4 (VHCl:VH2O) diluted hydrochloric acid. (b) TGA curves of the NMG sample No.1 before
and after acid washing for the second time. (d) XPS survey spectrum of the sample No.2, showing
the MgO residues (8.8 wt.%) detected by TGA are covered by graphene layers. (c) A model and (e)
the corresponding AFM image showing MgO particles encapsulated in combined graphene sheets.
Electronic Supplementary Material (ESI) for Chemical CommunicationsThis journal is © The Royal Society of Chemistry 2012

Fig. S6 (a) Typical kinetic curve of methane adsorption in dry NMG. (b) Kinetic curves of
methane adsorption in wetted graphene (G-W with 40 wt. % H2O) at different pressure. The peak
contributed from the formation of methane hydrate (indicated by the arrow) can be found at ~8.5
MPa, and no hydrate was formed at ~ 5 MPa. (c) Total volumetric methane uptake of G-W and the
wetted ones.
Electronic Supplementary Material (ESI) for Chemical CommunicationsThis journal is © The Royal Society of Chemistry 2012

Fig. S7 TGA curves of the NMG (a) and the MOF material PCN-14 (b).3
Reference
1. A. Ferrari, J. Meyer, V. Scardaci, C. Casiraghi, M. Lazzeri, F. Mauri, S. Piscanec, D. Jiang, K. Novoselov and S. Roth, Phys. Rev. Lett., 2006, 97, 187401.
2. D. V. Kosynkin, A. L. Higginbotham, A. Sinitskii, J. R. Lomeda, A. Dimiev, B. K. Price and J. M. Tour, Nature, 2009, 458, 872-U875.
3. S. Ma, D. Sun, J. M. Simmons, C. D. Collier, D. Yuan and H.-C. Zhou, J Am Chem Soc, 2008, 130, 1012-1016.
Electronic Supplementary Material (ESI) for Chemical CommunicationsThis journal is © The Royal Society of Chemistry 2012