
High accuracy calibration of a dynamic vapor sorption instrument...
11
General rights Copyright and moral rights for the publications made accessible in the public portal are retained by the authors and/or other copyright owners and it is a condition of accessing publications that users recognise and abide by the legal requirements associated with these rights. Users may download and print one copy of any publication from the public portal for the purpose of private study or research. You may not further distribute the material or use it for any profit-making activity or commercial gain You may freely distribute the URL identifying the publication in the public portal If you believe that this document breaches copyright please contact us providing details, and we will remove access to the work immediately and investigate your claim. Downloaded from orbit.dtu.dk on: Mar 11, 2019 High accuracy calibration of a dynamic vapor sorption instrument and determination of the equilibrium humidities using single salts Rörig-Dalgaard, Inge; Svensson, Staffan Published in: Review of Scientific Instruments Link to article, DOI: 10.1063/1.4949513 Publication date: 2016 Document Version Publisher's PDF, also known as Version of record Link back to DTU Orbit Citation (APA): Rörig-Dalgaard, I., & Svensson, S. (2016). High accuracy calibration of a dynamic vapor sorption instrument and determination of the equilibrium humidities using single salts. Review of Scientific Instruments, 87(5), 054101. DOI: 10.1063/1.4949513
-
Upload
nguyenphuc -
Category
Documents
-
view
215 -
download
0
Transcript of High accuracy calibration of a dynamic vapor sorption instrument...

General rights Copyright and moral rights for the publications made accessible in the public portal are retained by the authors and/or other copyright owners and it is a condition of accessing publications that users recognise and abide by the legal requirements associated with these rights.
Users may download and print one copy of any publication from the public portal for the purpose of private study or research.
You may not further distribute the material or use it for any profit-making activity or commercial gain
You may freely distribute the URL identifying the publication in the public portal If you believe that this document breaches copyright please contact us providing details, and we will remove access to the work immediately and investigate your claim.
Downloaded from orbit.dtu.dk on: Mar 11, 2019
High accuracy calibration of a dynamic vapor sorption instrument and determination ofthe equilibrium humidities using single salts
Rörig-Dalgaard, Inge; Svensson, Staffan
Published in:Review of Scientific Instruments
Link to article, DOI:10.1063/1.4949513
Publication date:2016
Document VersionPublisher's PDF, also known as Version of record
Link back to DTU Orbit
Citation (APA):Rörig-Dalgaard, I., & Svensson, S. (2016). High accuracy calibration of a dynamic vapor sorption instrument anddetermination of the equilibrium humidities using single salts. Review of Scientific Instruments, 87(5), 054101.DOI: 10.1063/1.4949513

High accuracy calibration of a dynamic vapor sorption instrument and determinationof the equilibrium humidities using single saltsInge Rörig-Dalgaard and Staffan Svensson Citation: Review of Scientific Instruments 87, 054101 (2016); doi: 10.1063/1.4949513 View online: http://dx.doi.org/10.1063/1.4949513 View Table of Contents: http://scitation.aip.org/content/aip/journal/rsi/87/5?ver=pdfcov Published by the AIP Publishing Articles you may be interested in Highly sensitive and stable relative humidity sensors based on WO3 modified mesoporous silica Appl. Phys. Lett. 106, 063105 (2015); 10.1063/1.4908116 Use of an open-ended coaxial cavity method to characterize powdery substances exposed to humidity Appl. Phys. Lett. 103, 142907 (2013); 10.1063/1.4824187 Investigations of a method for determining pumping speed and sorption capacity of nonevaporable gettersbased on in situ calibrated throughput J. Vac. Sci. Technol. A 29, 051602 (2011); 10.1116/1.3626535 Wavelength-encoded optical psychrometer for relative humidity measurement Rev. Sci. Instrum. 78, 025103 (2007); 10.1063/1.2472591 Determination of the humidity of soil by monitoring the conductivity with indium tin oxide glass electrodes Appl. Phys. Lett. 80, 2785 (2002); 10.1063/1.1469215
Reuse of AIP Publishing content is subject to the terms at: https://publishing.aip.org/authors/rights-and-permissions. Download to IP: 192.38.67.115 On: Wed, 20 Jul
2016 13:11:56
REVIEW OF SCIENTIFIC INSTRUMENTS 87, 054101 (2016)
High accuracy calibration of a dynamic vapor sorption instrumentand determination of the equilibrium humidities using single salts
Inge Rörig-Dalgaard1,a) and Staffan Svensson1,21Department of Civil Engineering, Technical University of Denmark, Kongens Lyngby, Denmark2School of Engineering, University of Borås, Borås, Sweden
(Received 20 August 2015; accepted 1 May 2016; published online 18 May 2016)
We present a procedure for accurately calibrating a dynamic vapor sorption (DVS) instrumentusing single salts. The procedure accounts for and tailors distinct calibration tests according to thefundamental properties of each salt. Especially relevant properties influencing the calibration arethe heat of solution, heat of condensation, and the kinetics connected to the salt phase transition,as these influence the microclimate surrounding the salts during calibration. All these issues weredealt with to obtain precise calibration results. The DVS instrument comprises two control modes togenerate and measure the relative humidity (RH). Both control modes were separately examined andcombined to overcome the shortcomings of each of the two control modes and thereby obtain the mostaccurate results. Repeated calibration testing with the single salts (LiCl, MgCl2, Mg(NO3)2, NaCl, andKNO3) enables five discrete sorption isotherm measurements within the range of 11%–93%RH. Theequilibrium RH of the solution for LiCl, MgCl2, Mg(NO3)2, NaCl, and KNO3 was determined with astandard deviation of 0.06%-0.15% (0.45% for KNO3) RH. By comparing the measured calibrationvalues with the well-known equilibrium RH of each salt solution, the presented method’s resultsare both accurate with significant agreement and precise with small variation. Published by AIPPublishing. [http://dx.doi.org/10.1063/1.4949513]
I. INTRODUCTION
A material’s equilibrium moisture state relative to thesurrounding climate is of utmost importance to its physical,chemical, biological, and mechanical performance. To obtaina material’s hygroscopic behavior, the specimen should beaccurately weighed under equilibrium moisture conditionsin a known equilibrium moisture conditions at a knowntemperature. Additionally, the mass–climate relation must bedetermined with an acceptable level of uncertainty. Watervapor pressure (humidity) is a delicate climate parameterand the equilibrium relative humidity (RH) of a salt solutionis essential for testing and calibrating hygrometers and forcontrolling humidity in closed spaces.1 Saturated aqueoussolutions of salts react to changes of the surrounding RH, sothese solutions can be used for calibration purposes in an opensystem. In an open system, an imposed water vapor pressureleads to changes in the moisture content of a given material,whereas, in a closed system, the salt solutions control theclimate. When studying a materials’ equilibrium condition,an open system—where a known vapor pressure controls theprocess, is, therefore, a requirement.
The equilibrium RH of a solution is a physical propertyfor which the rate of evaporation of water molecules fromthe solution is the same as the rate of condensation into thesolution. Vapor will condense into a solution in an environmentwith a humidity above the equilibrium RH of the solution andevaporate in an environment, a humidity below the equilibrium
a)Author to whom correspondence should be addressed. Electronic mail:[email protected]
RH of the solution. Different saturated solutions have differentspecific equilibrium RH and saturated solutions of pure saltshave a very precise equilibrium RH for any given temperature.Therefore, salts are useful for calibrating equipment requiringhumidity precision.
A new method for validating the RH generated in sorptionbalances was reported for salt solutions with an equilibriumRH of 11%–75% RH (i.e., LiCl, MgCl2, Mg(NO3)2, andNaCl).2,3 This validation was based on the rate of samplemass loss, which was proportional to the vapor pressuredifference between the sample surface and the gas stream.To determine the equilibrium RH of the salt solution, Wadsöet al.2 used quasi-randomly chosen constant RH levels,alternating between those above and below the equilibriumRH of the solution of each salt, and assumed that the rateof mass change was constant. The equilibrium RH levelsfound were based on the vapor pressure generated throughthe mass flow controllers of the dynamic vapor sorption(DVS) instrument. The mass transfer Biot numbers of the saltswere determined to check whether internal gradients couldbe neglected. The shortcoming of Wadsö et al., however, isnot to include the effect of the salt phase transition on thesurrounding microclimate as temperature change (dT) andRH change (dRH) while changing the moisture content (dm)through the imposed relative humidity of the gas stream,when validating the method with the sorption balance. Thetemperature change can be caused by heat of condensationand heat of solution. A temperature change alters the wateractivity in the solution through crystallization or dissolution ofthe salt resulting in non-accurate calibration results. Therefore,the present challenge is to interpret correctly how underthese circumstances the imposed water vapor pressure can
0034-6748/2016/87(5)/054101/9/$30.00 87, 054101-1 Published by AIP Publishing. Reuse of AIP Publishing content is subject to the terms at: https://publishing.aip.org/authors/rights-and-permissions. Download to IP: 192.38.67.115 On: Wed, 20 Jul
2016 13:11:56

054101-2 I. Rörig-Dalgaard and S. Svensson Rev. Sci. Instrum. 87, 054101 (2016)
be desirably adjusted or, respectively, calibrated under non-equilibrium experimental conditions aiming to ensure thatthe imposed gas stream has the desired water vapor pressure.Bearing this in mind, the salt for calibration has to be preparedwith a high precision to minimize the influence from theexperimental preparation by precisely weighing the dry saltand the exactly needed added water for reaching equilibriumRH of the solution.
The small size of the calibration sample used in the DVSinstrument (∼25 mg) means that a small moisture change canresult in substantial dissolution of the salt. In principle, theconcentration of the solution is fixed at the solubility limitof the salt as long as some crystals are present; however, inpractice, it is found that the calibration of the RH has anuncertainty as large as ±2.5%, if the moisture content ofthe sample is not properly controlled. Such an uncertaintymight be related to the competition between the kinetics ofdissolution of the salt, diffusion of ions within the sample,and exchange of moisture with the environment as the RHchanges with time. Although the details of the mechanismhave not been quantified, the procedure described in this workguarantees a highly accurate and reproducible calibration forsingle and mixed salts.
The present work aims to describe how a highly accuratecalibration of the DVS instrument can be achieved by usingthe well-defined equilibrium RH of the salt solutions. To avoidunwanted effects during this calibration, it is necessary totake into account the specific properties of each salt, crystalsize, reaction kinetics, released heat, and hydration state. Boththe basic principle of the DVS instrument and its potentialinfluence on the results are described below. The most accuratecalibration method for each considered salt is clarified anddiscussed.
II. SALT PHASE TRANSITION AND MEASUREMENT
A. Phase transition and crystal size dependence
For pure single salts, the deliquescence point or deliques-cence relative humidity (DRH) is the humidity level abovewhich a solid begins to absorb moisture from the surroundingatmosphere.4 The deliquescence point for a salt is definedas the onset of dissolution.5 For pure single salts, the DRHis identical to the equilibrium RH of the solution. Crystalsdissolve completely if the DRH is exceeded. Prior to thedeliquescence point, a water film may form, as shown forNaCl.5 It is evident that some ions are present within the thinwater films resulting in non-accurate transition from salt tosolution for NaCl; however, the mechanism of salt dissolutionhas thus far been poorly described.5
The solubility of solids is size-dependent; however, the ef-fect of curvature on the interfacial energy of the crystal–liquidinterface is negligible at crystal sizes greater than 0.1 µm.6 Asystem can reach thermodynamic equilibrium provided thatthermal equilibrium, mechanical equilibrium, and chemicalequilibrium coexist.7 Because equilibrium between the saltand the ambient air is reached after a relatively long time, insalt–water interactions, the kinetics of phase change must beconsidered when analyzing salt crystallization.8
B. The contribution of the kinetics
To minimize experimentally induced errors, it is benefi-cial to be able to use as many measurement results as possibleand for this purpose, the limiting conditions are examined inthe following. The boundary conditions are dependent on thekinetics. In general, adsorption diagrams are plotted as thelogarithm of vapor pressure (ln P) against the reciprocal ofthe temperature (1/T), since the lines pictured for the layer ofcondensation and phase boundaries tend to be straight lines insuch diagrams. This is explained by the nearly constant heatsof condensation (also called heats of adsorption), as describedby the Clausius–Clapeyron equation. The differential heat ofadsorption, qi, is defined by9
qi = −kB∂lnP∂( 1
T) |i-layer, (1)
where kB is Boltzmann’s constant and the ith-layer is the layerfor which the differential heat of adsorption is determined.Equation (1) describes a general link between the pressureand adsorption.
A practical way to measure the equilibrium RH fora solution, RHeq, is to take into account the kinetics ofdissolution during deliquescence; to this end, an empiricalrelation to determine the deliquescence point has beendeduced.10 During a phase transition induced by a changein the relative humidity (e.g., a deliquescence reaction carriedout at various constant values of RH that lie above RHeq), thetotal reaction time (tc) increases with proximity of RH to RHeq.An accurate empirical expression relating the dissolution timeto the imposed RH is11
RH = RHeq exp(B t−1c ), (2)
where B is an adjustable parameter and can be determined bylinear least squares analysis from experimental measurementsof tc at different levels of relative humidity. Equation (2) wasshown to be valid for deliquescence of NaCl by using X-raydiffractometry under controlled conditions of temperature andrelative humidity (RH-XRD).11
When RH approaches RHeq in Eq. (2), tc is very largeand the curvature of the curve calculated by (2) would thenbe relatively small. Provided RH approaches RHeq and tc isvery large, the empirical kinetic equation (2) can then beapproximately linearized. As clearly illustrated by the resultof the calibration test, Figure 3(a), the relation mass-changeover time and humidity-difference is also linear in the vicinityof moisture equilibrium such that
dmdRH
= c (RH − RHeq), (3)
where dm is the change in sample mass, dRH is the changein relative humidity, and c is an experimentally determinedconstant.
Below the deliquescence point, the salt–water mixtureis not in equilibrium with the ambient water vapor pressureand hence water evaporates from the solution to reachequilibrium moisture state (dm/dt < 0). Conversely, abovethe deliquescence point, the salt–water mixture accumulateswater to reach equilibrium moisture content (dm/dt > 0). Theequilibrium point is found when dm/dt = 0. In principle,
Reuse of AIP Publishing content is subject to the terms at: https://publishing.aip.org/authors/rights-and-permissions. Download to IP: 192.38.67.115 On: Wed, 20 Jul
2016 13:11:56

054101-3 I. Rörig-Dalgaard and S. Svensson Rev. Sci. Instrum. 87, 054101 (2016)
this could be found from the raw data, but the extremum ismore reliably identified by using Eq. (3), which is physicallyreasonable and serves to smooth the experimental data.
C. The influence of the salt state
The activity of water in a salt solution, at equilibrium,equals the relative humidity of the surrounding atmosphere.In an aqueous solution with ideal thermodynamic properties,the mole fraction of water (x1) is a direct measure of its activity(a1
id)
a1id = x1. (4)
In other words, the standard state, here pure water (l), is thestate for which the activity of the component is unity. In themixture x1 < 1 and hence the activity (a1)id is also less thanunity.12 Hence, the water activity of a supersaturated solutionis always smaller than that of the saturated solution.6
D. Released heat
When using salts for calibration of instruments, one hasto isolate the desired effect of the salt for the calibration(namely, the dissolution-crystallization equilibrium) whileminimizing all other effects (especially the heats of solutionand condensation). In general, a spontaneous phase transitionfrom the liquid to the crystalline state can only take placeif crystallization lowers the internal energy of the systemsufficiently to outweigh the loss in entropy; that is, thetransition is “energy driven.”13 The enthalpy of solution,∆Hsoln, is the heat generated or absorbed when a certainamount of solute dissolves in a certain amount of solvent14
∆Hsoln = Hsoln − Hcomponents. (5)
The enthalpy change in an exothermic process (resulting inheat release) is defined as negative. At the equilibrium RH ofthe saturated solution, three phases are in equilibrium (s, l, g).15
To reach equilibrium, the amount of heat exchanged requiredwill depend on the type of salt used. If a quantity of liquidcondenses into, or evaporates from, a supersaturated solution,the amount of heat exchanged at a constant temperature isgiven by
∆Hcondensation = Hliquid − Hvapor = −∆Hvap. (6)
The heat of condensation for a monolayer of water moleculesis a measure of the sum of the binding energy of one adatomto the solid.9 The heat required depends on the interactionbetween water and the absorbent.12 Since heat will affectthe temperature of the microclimate surrounding the salt andsince the equilibrium moisture state of salts is temperaturedependent, the contribution from heat release can affect theaccuracy of measurement of the equilibrium moisture content,and therefore, also the calibration of the DVS instrument.The influence of released heat is examined and discussed inSections V B and V C).
III. GENERAL DESCRIPTION OF THE DYNAMICVAPOR SORPTION INSTRUMENT
A dynamic vapor sorption (DVS) instrument is used formaking continuous mass measurements of a sample in achamber in which the environmental parameters, includingtemperature and vapor pressure, are monitored and controlledsimultaneously. The balance in the specific equipment usedin this study (DVS Advantage 1, Surface MeasurementSystems, Alperton London, United Kingdom) is, accordingto the manufacturer, able to measure the mass of a samplewith a sensitivity of ±0.1 µg (if calibrated monthly) for arecommended sample mass between 20 and 30 mg.16 Using adew point analyzer (DPA), the vapor pressure in the chambercan be measured within an accuracy of ±0.1% RH.
There is a continuous and constant flow of air (adjustablein the range 100–200 SCCM/min) through the test chamber.The air is a mixture of fully water vapor-saturated air andvery dry air with a dew point of at least −80 ◦C. The vaporpressure of the air mixture flowing through the test chamberis controlled by mass flow controllers on the air supplies.There are two ways to control the vapor pressure in the testchamber: by directly controlling the mass flow controllersplaced prior to the sample chamber (open-loop control mode)or by including the feedback signal from the DPA, placed justbefore it enters the sample chamber, to control the mass flowregulators (closed–loop control mode).
A. Open-loop control mode
The amount of moist air supplied is calculated knowingthe inner diameter of the air pipe and the air velocity, under theassumption that one of the two air sources is fully saturatedand the other is extremely dry. However, the target valuesdo not account for leakage and friction within the system. Tocompensate for this, salt calibration tests are carried out. Whenthe physical properties of the salts are known, corrections canbe made in the instrument’s software in a so-called “look-uptable”, which is then used to tune the control of the mass flowcontrollers. The open-loop control mode relies on the fact thatleakage and friction are fully accounted for by the look-uptable and that it is possible to interpolate between the specificvalues at which the calibration tests with salts are performed.The advantage of using the open-loop control mode is thatchanges are controlled to occur continuously. The precisionof controlling the vapor pressure when running an open loopis therefore dependent on tabulated values from calibrationof the valve controlling the supply of the dry and moist air.It is possible to simultaneously monitor the vapor pressureduring an open-loop test with the DPA and thereby obtain twoindependent values of the vapor pressure.
B. Closed-loop control mode
For a closed-loop calibration, the DPA measures therelative humidity just before it enters the sample chamber andcontrols the openings of the mass flow controllers througha feedback system. The difference between the measured RHand the target RH is adjusted by changing the mixture betweenthe dry and moist air that flows through the sample chamber.
Reuse of AIP Publishing content is subject to the terms at: https://publishing.aip.org/authors/rights-and-permissions. Download to IP: 192.38.67.115 On: Wed, 20 Jul
2016 13:11:56

054101-4 I. Rörig-Dalgaard and S. Svensson Rev. Sci. Instrum. 87, 054101 (2016)
When using the closed-loop control mode, there is higherfluctuation around the target value compared with that inthe open-loop control mode; however, the RH measurementscorrespond to the RH measured by the DPA at all times.
The precision of a closed-loop calibration is hencedependent on the precision of the DPA. The accuracy of theDPA is dependent on its calibration and adjustment of theoffset of the DPA when installed in the DVS. The instrumenttemperature is adjusted to fit the given dew point temperatureat which a liquid droplet film forms on a special optical mirrorby changing the offset of the DPA. This dew point temperatureis then converted into the solvent (water) partial pressure usingthe sample temperature and the standard vapor pressure tablesfor the solvent (water) in question. As a result of a nonlinearrelationship between the vapor saturation pressure and thetemperature, large deviations can occur with increasing RH.
IV. EXPERIMENTAL
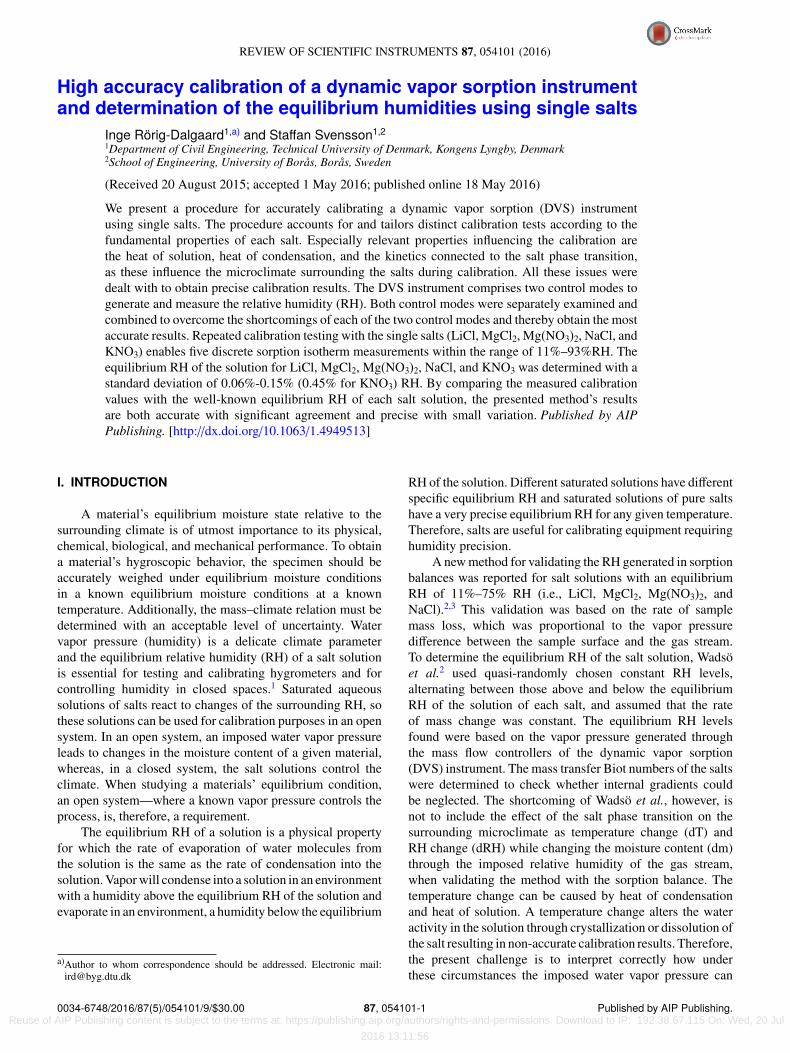
The key to accurate calibration is to add the optimalamount of water to the salt sample, as explained below. The drysalt (analytical grade) was stored in a dry climate desiccator(RH < 5%) until use. Just before use, water was added assmall droplets within a climate chamber at a temperatureof 20 ± 1 ◦C to minimize an additional effect from varyingtemperatures during the salt preparation for the calibrationtests with salts. The small water droplets were added untilthe salt changed from grain to flake consistency ultimatelybecoming a rounded lump of the salt–water mixture. At thecritical equilibrium moisture content (provided a thermody-namical approach for water vapor potential, according tothe water activity in the saturated salt solution and givenan insignificantly curved liquid-vapor interface), the lumpcontaining the undissolved salt and its surrounding saturatedaqueous electrolyte solution takes up or releases water until afree energy minimum is achieved. In particular, the volume ofsaturated aqueous electrolyte solution containing undissolvedgrains of salt adjusts to form a lump with a minimum ofinterfacial area at the liquid/vapor interface. A bigger androunder spherical shape indicates deliquescence.17 In thepresent study, it was observed that the sharp edges of thegrains become rounded as the salt grains take up water. This isconsistent with previously photographed changes of the stateof salts when reaching the equilibrium moisture content.17 Inthe present work, an amount of 25 mg dry salt was used foreach calibration, which is small enough to provide sufficientlyrapid equilibration, but large enough to yield high accuracy.
At the right proportion of salt and water, it is possible toform a salt–solution lump with a glazy but opaque surface.The presence of a lump indicates that there is an excess ofwater above the deliquescence point. Excess water can alsobe seen when the salt leaves a trace of water when movedon a surface. The minimal moisture content for reachingequilibrium was determined and this water content (mass %)was used in subsequent preparations of the same salt. Theprecision for which the equilibrium RH of the salt/water lumpcan be reached for the salts: LiCl, MgCl2, Mg(NO3)2, NaCl,and KNO3 is shown in Figure 1.
FIG. 1. Precision (x-marker) of reaching equilibrium RH of the solution ofthe salt/water lump for different salts (right ordinate) related to their heatof solution ordered by decreasing exothermal heat of solution shown on theleft ordinate. To prepare the salt–water mixture water was added to the drysalt and, the initially anhydrates MgCl2 and Mg(NO3)2 transformed into thehexahydrates MgCl2·6H2O and Mg(NO3)2·6H2O. The results are based on8–20 preparations for each salt.
The visual method used to determine the optimalsalt–water balance was relatively simple, as shown in Figure 2.After the dry salt was prepared to equilibrium RH of thesalt/water lump, we could validate the equilibrium RH byusing the standard graphs for salt calibration tests, as outlinedin Section V A.
V. RESULTS AND DISCUSSION
A. Determination of the equilibrium RH of the solution
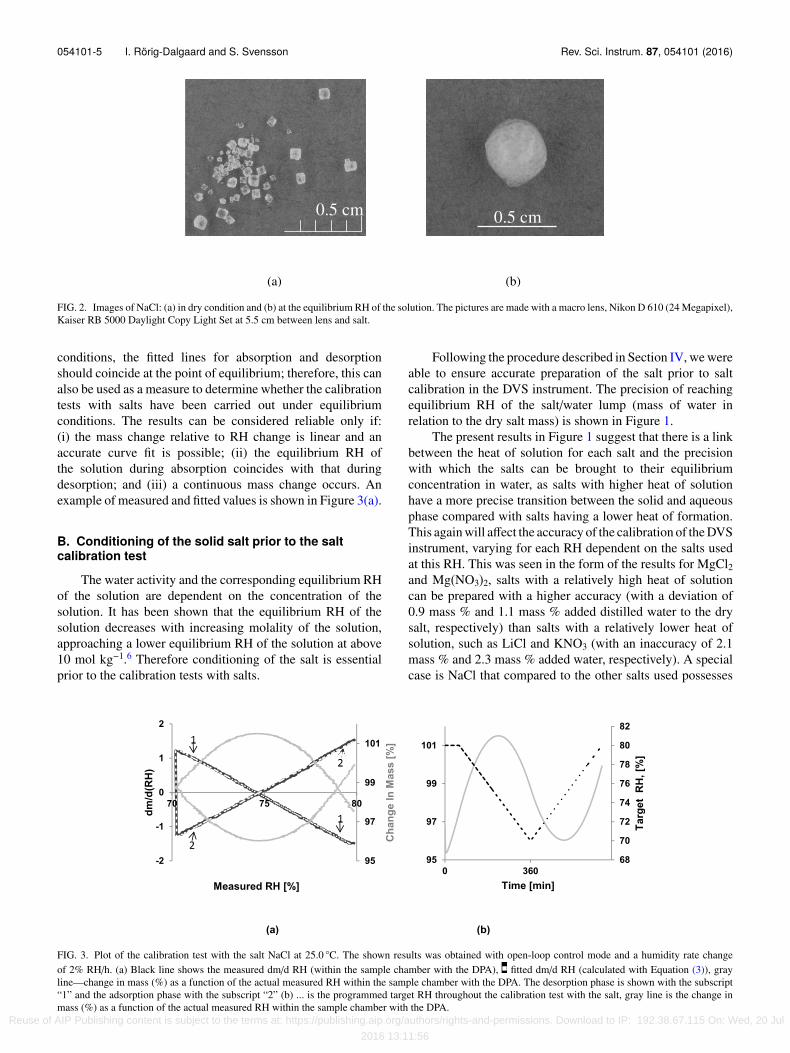
The measured masses of the salt solution at the presentRH within the sample chamber are accurately described byEq. (3), as shown in Figure 3. Very similar results wereobtained for both the desorption and absorption phases, asshown in Figure 3(a) (subscript 1 for desorption and subscript2 for adsorption). To ensure that the salt-water lump reachedRHeq, RH > RHeq was established for 1 h; during this time,the mass increase was a result of reaching RHeq throughoutthe salt-water lump, involving partial dissolution of the salt.
If the salt–water mixture was not in equilibrium (Sec-tion IV), the intersection of the two fitted lines (absorptionand desorption) would not occur at the point of zero masschange (where dm/dRH = 0 in Figure 3(a)). If the salt is toowet, the intersection between the two fitted lines would occurabove the y-axis in Figure 3(a); conversely, if the salt is toodry, the intersection would occur below the y-axis.
By ensuring a general linear relationship between themeasured mass change and RH change, it is indicated thatexperimental conditions are satisfactory, ensuring minimuminfluence from the experimentally induced circumstances(e.g., heat of solution and random deviation). The intersectionof the linear relation for dm/dRH at y = 0 is used to determinethe equilibrium RH of the salt solution, as described inSection II B. This is done to determine both equilibrium RHof the solution during desorption and during adsorption.
The RH within the sample chamber must be changedslowly enough to allow equilibrium between the salt and thesurrounding RH to be achieved (Section II B). Adjustmentsof dRH/dt may therefore be necessary to ensure that theexperimental conditions are satisfactory. Under equilibrium
Reuse of AIP Publishing content is subject to the terms at: https://publishing.aip.org/authors/rights-and-permissions. Download to IP: 192.38.67.115 On: Wed, 20 Jul
2016 13:11:56
054101-5 I. Rörig-Dalgaard and S. Svensson Rev. Sci. Instrum. 87, 054101 (2016)
FIG. 2. Images of NaCl: (a) in dry condition and (b) at the equilibrium RH of the solution. The pictures are made with a macro lens, Nikon D 610 (24 Megapixel),Kaiser RB 5000 Daylight Copy Light Set at 5.5 cm between lens and salt.
conditions, the fitted lines for absorption and desorptionshould coincide at the point of equilibrium; therefore, this canalso be used as a measure to determine whether the calibrationtests with salts have been carried out under equilibriumconditions. The results can be considered reliable only if:(i) the mass change relative to RH change is linear and anaccurate curve fit is possible; (ii) the equilibrium RH ofthe solution during absorption coincides with that duringdesorption; and (iii) a continuous mass change occurs. Anexample of measured and fitted values is shown in Figure 3(a).
B. Conditioning of the solid salt prior to the saltcalibration test
The water activity and the corresponding equilibrium RHof the solution are dependent on the concentration of thesolution. It has been shown that the equilibrium RH of thesolution decreases with increasing molality of the solution,approaching a lower equilibrium RH of the solution at above10 mol kg−1.6 Therefore conditioning of the salt is essentialprior to the calibration tests with salts.
Following the procedure described in Section IV, we wereable to ensure accurate preparation of the salt prior to saltcalibration in the DVS instrument. The precision of reachingequilibrium RH of the salt/water lump (mass of water inrelation to the dry salt mass) is shown in Figure 1.
The present results in Figure 1 suggest that there is a linkbetween the heat of solution for each salt and the precisionwith which the salts can be brought to their equilibriumconcentration in water, as salts with higher heat of solutionhave a more precise transition between the solid and aqueousphase compared with salts having a lower heat of formation.This again will affect the accuracy of the calibration of the DVSinstrument, varying for each RH dependent on the salts usedat this RH. This was seen in the form of the results for MgCl2and Mg(NO3)2, salts with a relatively high heat of solutioncan be prepared with a higher accuracy (with a deviation of0.9 mass % and 1.1 mass % added distilled water to the drysalt, respectively) than salts with a relatively lower heat ofsolution, such as LiCl and KNO3 (with an inaccuracy of 2.1mass % and 2.3 mass % added water, respectively). A specialcase is NaCl that compared to the other salts used possesses
FIG. 3. Plot of the calibration test with the salt NaCl at 25.0 ◦C. The shown results was obtained with open-loop control mode and a humidity rate changeof 2% RH/h. (a) Black line shows the measured dm/d RH (within the sample chamber with the DPA), fitted dm/d RH (calculated with Equation (3)), grayline—change in mass (%) as a function of the actual measured RH within the sample chamber with the DPA. The desorption phase is shown with the subscript“1” and the adsorption phase with the subscript “2” (b) ... is the programmed target RH throughout the calibration test with the salt, gray line is the change inmass (%) as a function of the actual measured RH within the sample chamber with the DPA.
Reuse of AIP Publishing content is subject to the terms at: https://publishing.aip.org/authors/rights-and-permissions. Download to IP: 192.38.67.115 On: Wed, 20 Jul
2016 13:11:56

054101-6 I. Rörig-Dalgaard and S. Svensson Rev. Sci. Instrum. 87, 054101 (2016)
a relatively low heat of solution and an extraordinarily highinaccuracy of 2.6 mass % added water. This is likely causedby the unclear phase transition due to the presence of ions inthe thin water film on NaCl prior to the deliquescence point(Section II A).4,5 A phase rule for the studied geometry waspresented that allows for the coexistence of liquid, solid, andvapor for the binary NaCl–H2O system across a range of vaporpressures.4 This phenomenon is explained by the significantrole of the sample–substrate interface as an energy term so thatthe aqueous and solid phases of NaCl coexist over a perceptiblerange in their experiments in comparison with observations offree-floating pure NaCl aerosol particles.4
C. Development of the most accurate methodfor determining the equilibrium RH of the solutionfor a specific salt
1. Specific methods for each salt
As described in Section II, salts have significantly varyingproperties, requiring individualized methods for each saltcalibration test. The calibration with salts is initiated withevaporation until the RH drops below the equilibrium RH ofthe solution followed by absorption to obtain the most accurateresults of the equilibrium RH of the solution.
The required water content to change the salt from a drysalt to its equilibrium RH of the solution is shown in Table Ifor the five salts studied. The measurements were conductedon a scale with an accuracy of 0.1 mg. The water added duringsalt–water mixture preparation influences the environment inthe sample chamber; each calibration with salts is initiated byevaporation from the salt–water mixture, which produces heatof condensation. In addition, upon reaching the equilibriumRH of the solution, a phase change occurs and results in acontribution from the heat of solution. Although the samplechamber within the DVS is at a constant temperature, suchcontributions could potentially influence the environment tosome degree. We therefore examined these contributions toensure highly accurate calibrations.
By calculating the moles of each salt (0.025 g dry salt)for the salt calibration and considering the added water andthe resulting solubility of each salt, the heat released duringpartial dissolution was determined to be −5.1 J, −2.6 J, −0.5 J,0.1 J, and 0.5 J for LiCl, MgCl2, Mg(NO3)2, NaCl, and KNO3,respectively (Equation (5)). Although different, they were allwithin the same order of magnitude. The heat of condensationwas calculated assuming that all the water added to each drysalt to obtain the equilibrium RH of the solution (see Table I)
had to condense during the calibration tests with the salts(Equation (6)). This added water was then converted to molesof H2O to calculate the potential heat of condensation. Theheat of condensation was calculated to be −17 J, −5 J, −10 J,−12 J, and −11 J for LiCl, MgCl2, Mg(NO3)2, NaCl, andKNO3, respectively. However, this is a slight overestimationof the contribution from the heat of condensation, since not allof the added water will evaporate during the calibration testswith salts. Depending on the extent of the contribution fromthe enthalpy of solution, other calibration methods with saltsare more suitable. The influence from the enthalpy of solutionon the measured result can be minimized by performingcalibration tests with salts over the widest possible RH intervalwithin which Equation (3) is valid. However, for salts whosecontribution from the enthalpy of solution is dominant inrelation to the heat of condensation, it will be more difficult toobtain equilibrium conditions throughout the calibration test.By increasing the duration of the calibration tests with salts, theinfluence of the enthalpy of solution on the microclimate insidethe sample chamber will decrease since there is a constant airflow inside the sample chamber. This will minimize the effectof heat of solution on the equilibrium RH of the solution.This ensures a more representative determination of the phasetransition. Narrowing of the RH interval was therefore relevantfor LiCl and MgCl2 to minimize the effect of the heat ofsolution on the calibration tests with these salts. With regardto KNO3, we also chose to use a reduced RH interval becausethe DVS could not perform a calibration starting 5% abovethe equilibrium RH of the solution, which is 98.58% RH. Bynarrowing the RH interval around the equilibrium RH of thesolution, the highest % RH of the method was 95.08% RH.
A relationship was found between the amount of wateradded and the duration of continuous absorption or desorptionduring which Equation (3) is valid (Table I). Such a rela-tionship was fixed in order to obtain reliable results. It wasdetermined that approximately 3% w/w (water mass/solid saltmass) additional water was required for each additional hourthe sequence was continued. Table I shows the rate of changein RH per hour and the interval around the equilibrium RH ofthe solution for the most reliable calibration tests of the DVSinstrument.
In a previous work,2 only one type of methods was usedfor all the calibration tests with salts, independent of thespecific salt used. In the equipment manual,16 the use of open-loop control mode is recommended, at an interval of ±5%around the equilibrium RH of the solution and a duration of10 h for all five salts (LiCl, MgCl2, Mg(NO3)2, NaCl, KNO3)
TABLE I. Overview of the methods that produced the most reliable results for the salts LiCl, MgCl2, Mg(NO3)2,NaCl, and KNO3 and water uptake during preparation for the calibration tests with salts.
SaltWater added during
preparation (%)Duration of
test (h)Adsorbed water per
hour of test (%)∆RH per
hourInterval around
the RHeq (% RH)
LiCl (16 samples) 27.8± 2.1 20 (21)a 2.8 0.3 ±1.5MgCl2 (20 samples) 8.0± 0.9 6 (7)a 2.7 1.0 ±1.5Mg(NO3)2 (8 samples) 15.8± 1.1 10 (11)a 3.2 2.0 ±5.0NaCl (15 samples) 18.7± 2.6 10 (11)a 3.7 2.0 ±5.0KNO3 (8 samples) 18.2± 2.3 20 (21)a 1.8 0.3 ±1.5
aAll the tests started with 1 h at the highest RH (1.5% or 5.0% RH above the reference equilibrium RH of the salt solution). Reuse of AIP Publishing content is subject to the terms at: https://publishing.aip.org/authors/rights-and-permissions. Download to IP: 192.38.67.115 On: Wed, 20 Jul
2016 13:11:56
054101-7 I. Rörig-Dalgaard and S. Svensson Rev. Sci. Instrum. 87, 054101 (2016)
for the calibration tests with salts. This should achieve anaccuracy of ±1.5%.16 Various RH rates (0.5%, 1%, and 2%RH/h) were tested to approach equilibrium conditions duringthe measurements.18
2. The influence of the control mode
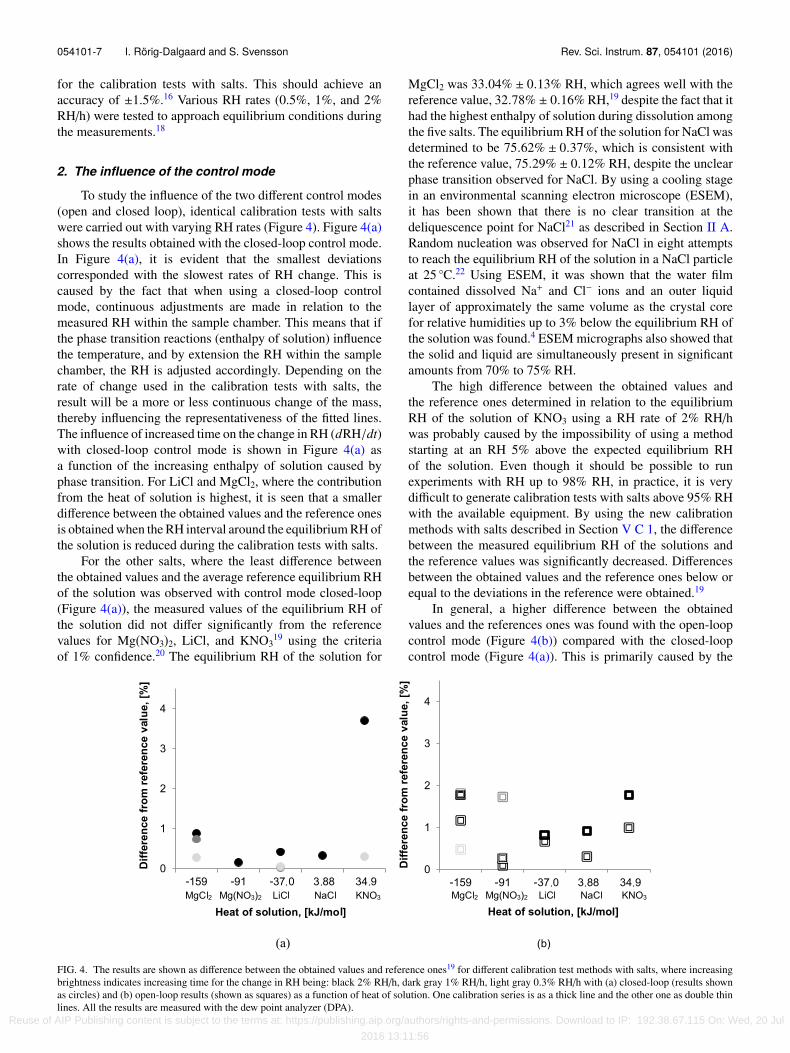
To study the influence of the two different control modes(open and closed loop), identical calibration tests with saltswere carried out with varying RH rates (Figure 4). Figure 4(a)shows the results obtained with the closed-loop control mode.In Figure 4(a), it is evident that the smallest deviationscorresponded with the slowest rates of RH change. This iscaused by the fact that when using a closed-loop controlmode, continuous adjustments are made in relation to themeasured RH within the sample chamber. This means that ifthe phase transition reactions (enthalpy of solution) influencethe temperature, and by extension the RH within the samplechamber, the RH is adjusted accordingly. Depending on therate of change used in the calibration tests with salts, theresult will be a more or less continuous change of the mass,thereby influencing the representativeness of the fitted lines.The influence of increased time on the change in RH (dRH/dt)with closed-loop control mode is shown in Figure 4(a) asa function of the increasing enthalpy of solution caused byphase transition. For LiCl and MgCl2, where the contributionfrom the heat of solution is highest, it is seen that a smallerdifference between the obtained values and the reference onesis obtained when the RH interval around the equilibrium RH ofthe solution is reduced during the calibration tests with salts.
For the other salts, where the least difference betweenthe obtained values and the average reference equilibrium RHof the solution was observed with control mode closed-loop(Figure 4(a)), the measured values of the equilibrium RH ofthe solution did not differ significantly from the referencevalues for Mg(NO3)2, LiCl, and KNO3
19 using the criteriaof 1% confidence.20 The equilibrium RH of the solution for
MgCl2 was 33.04% ± 0.13% RH, which agrees well with thereference value, 32.78% ± 0.16% RH,19 despite the fact that ithad the highest enthalpy of solution during dissolution amongthe five salts. The equilibrium RH of the solution for NaCl wasdetermined to be 75.62% ± 0.37%, which is consistent withthe reference value, 75.29% ± 0.12% RH, despite the unclearphase transition observed for NaCl. By using a cooling stagein an environmental scanning electron microscope (ESEM),it has been shown that there is no clear transition at thedeliquescence point for NaCl21 as described in Section II A.Random nucleation was observed for NaCl in eight attemptsto reach the equilibrium RH of the solution in a NaCl particleat 25 ◦C.22 Using ESEM, it was shown that the water filmcontained dissolved Na+ and Cl− ions and an outer liquidlayer of approximately the same volume as the crystal corefor relative humidities up to 3% below the equilibrium RH ofthe solution was found.4 ESEM micrographs also showed thatthe solid and liquid are simultaneously present in significantamounts from 70% to 75% RH.
The high difference between the obtained values andthe reference ones determined in relation to the equilibriumRH of the solution of KNO3 using a RH rate of 2% RH/hwas probably caused by the impossibility of using a methodstarting at an RH 5% above the expected equilibrium RHof the solution. Even though it should be possible to runexperiments with RH up to 98% RH, in practice, it is verydifficult to generate calibration tests with salts above 95% RHwith the available equipment. By using the new calibrationmethods with salts described in Section V C 1, the differencebetween the measured equilibrium RH of the solutions andthe reference values was significantly decreased. Differencesbetween the obtained values and the reference ones below orequal to the deviations in the reference were obtained.19
In general, a higher difference between the obtainedvalues and the references ones was found with the open-loopcontrol mode (Figure 4(b)) compared with the closed-loopcontrol mode (Figure 4(a)). This is primarily caused by the
FIG. 4. The results are shown as difference between the obtained values and reference ones19 for different calibration test methods with salts, where increasingbrightness indicates increasing time for the change in RH being: black 2% RH/h, dark gray 1% RH/h, light gray 0.3% RH/h with (a) closed-loop (results shownas circles) and (b) open-loop results (shown as squares) as a function of heat of solution. One calibration series is as a thick line and the other one as double thinlines. All the results are measured with the dew point analyzer (DPA).
Reuse of AIP Publishing content is subject to the terms at: https://publishing.aip.org/authors/rights-and-permissions. Download to IP: 192.38.67.115 On: Wed, 20 Jul
2016 13:11:56

054101-8 I. Rörig-Dalgaard and S. Svensson Rev. Sci. Instrum. 87, 054101 (2016)
dependence of the generated vapor pressure on the waterlook-up table and the software that controls the supply of dryand moist air according to predefined conditions. The waterlook-up table is adjusted through calibration tests usuallyperformed during a manufacturer service. These calibrationtests with salts are usually carried out within 48 h withrelated limitations. In Figure 4(b), differences between themeasured values and the reference ones with the open-loopcontrol mode are shown in relation to different calibrations andthereby also different water look-up tables. It is evident thatthe difference between the obtained values and the referenceones was significantly different for those two series apparentlyperformed at identical conditions though differing from theconditions reported in the water look-up tables. However, forall five salts, the difference between the obtained and thereference values was smaller when using the water look-uptable that provided the calibration curve with the double thinlines. This confirms the importance of an accurate water look-up table.
In relation to the state of the salt (solid or in solution), theheat of crystallization (Section II C) can potentially affect theactual RH in the sample chamber for a certain period. Thismeans that if the experiments are carried out without ensuringequilibrium conditions, the value obtained will not correspondto the equilibrium RH of the solution. As the generated vaporpressure throughout the sequence in the open-loop controlmode only depends on the prior determined sequence relatedto the mixture of dry and moist air given by the look-up table,this heat release will not be taken into account when using theopen-loop control mode. Therefore open loop mode must beused with care.
It is argued that even precise RH sensors cannot measureRH better than the mass flow controllers in the DVS cangenerate RH.2 In practice, these two ways of controlling RHgeneration are likely to be equally effective, and some manu-facturers have incorporated both options in their instruments.However, as shown above, the use of mass flow controllers hassome limitations regarding heat release and an accurate waterlook-up table is essential to generate an accurate pressurewithin the sample chamber.
Very accurate results were directly measured by the dewpoint analyzer (DPA) (see Figure 4(a)) during a 2-yr period.
Differences between the obtained values and the referenceones of 0.05%–0.33% RH were found when using the closed-loop mode. However, breakdown of the DPA occurred onceor twice a year and each new or repaired DPA had varyingaccuracy. In previous work, problems were observed withcontamination of mirrors in DPA and drift in capacity sensors.2
These problems were not observed within the 2-yr period of thepresent study; the mirror was cleaned before every sequenceand drift of the sensor was not observed as similar results weredetermined at different times, as seen in Section V D.
As the different DPAs had calibrations with varyingaccuracy, the two control modes (open and closed loop)could be combined to obtain the most accurate results. Thecombination of the two control modes is made by measuringthe RH within the sample chamber with the DPA andgenerating the vapor pressure with the air flow controllers(open-loop) to account for the accuracy of the DPA calibration(Section V D). This procedure is used in the following.
D. Accuracy and repeatabilityof the generated pressure
The most reliable calibration tests with salts are outlinedin Table I. The calibration tests with salts were carried out asquintuple measurements of the equilibrium RH of the solutionfor LiCl, MgCl2, Mg(NO3)2, NaCl, and KNO3 and comparedwith reference values (see Table II).19 The deviation in thedetermination of the equilibrium RH of the solutions of LiCl,MgCl2, Mg(NO3)2, NaCl, and KNO3 was between 0.06% and0.15% (0.45% RH for KNO3) RH. A standard deviation of thismagnitude indicates that the determination of the equilibriumRH of the solution was precise. When measuring the RH withthe DPA, it is possible to achieve a precision of 0.1% as quotedby the manufacturer. An even higher precision was found witha Dynamic DPA for RH between 50% and 100%, enablingdetermination of temperature differences with a precision ofapproximately 0.001 ◦C.23
With the present settings of the mass flow controllers (inthe water look-up table), the difference between the measuredequilibrium RH of the solution of the single salts LiCl, MgCl2,Mg(NO3)2, and NaCl was found to be between +0.17% and−0.77% RH of the reference values.19
TABLE II. Accuracy and repeatability of the salt calibration tests determined with a generated RH through the air flow controllers (open-loop control mode)and RH measured with the DPA.
SaltReference value from
the literature 1st run 2nd run 3rd run 4th run 5th run AverageDifference from the
reference value
LiCl 11.30± 0.27 11.39± 0.05a
(12.8.14)b11.50± 0.16
(13.8.14)11.42± 0.05
(14.8.14)11.45± 0.11
(10.9.14)11.60± 0.02
(12.9.14)11.47± 0.08 +0.17
MgCl2·6H2O 32.78± 0.16 32.25± 0.01(9.9.14)
32.30± 0.04(3.6.14)
32.25± 0.03(4.6.14)
32.22± 0.01(6.6.14)
32.15± 0.01(8.9.14)
32.23± 0.06 −0.55
Mg(NO3)2·6H2O 52.89± 0.22 52.21± 0.03(25.3.14)
52.20± 0.02(26.3.14)
52.25± 0.11(27.3.14)
51.90± 0.01(5.9.14)
52.02± 0.02(4.9.14)
52.11± 0.15 −0.77
NaCl 75.29± 0.12 74.65± 0.09 74.58± 0.09 74.51± 0.17 74.40± 0.07 74.69± 0.10 74.57± 0.12 −0.72KNO3 93.58± 0.55 90.93± 0.02
(3.7.14)90.84± 0.03
(2.7.14)90.48± 0.22
(9.8.14)91.55± 0.09
(11.9.14)91.48± 0.01
(15.9.14)91.06± 0.45 −2.52
aThe deviation for each determined equilibrium RH of the salt solution is the difference between the equilibrium RH of the salt solution determined during absorption and desorption.bThe date that the measurement was performed is shown in parentheses in the table.
Reuse of AIP Publishing content is subject to the terms at: https://publishing.aip.org/authors/rights-and-permissions. Download to IP: 192.38.67.115 On: Wed, 20 Jul
2016 13:11:56
054101-9 I. Rörig-Dalgaard and S. Svensson Rev. Sci. Instrum. 87, 054101 (2016)
The measured RH of the solution for KNO3 differs by 2.52from the equilibrium RH of the solution in the literature.19 Inaddition, in the case of KNO3, the maximum difference in thedetermined equilibrium RH of the solution among the resultsfor each of the five different calibration tests with salts was1% RH. Because the difference between the equilibrium RH ofthe solution obtained during desorption and absorption withinone calibration test with salts was at maximum 0.22% RH, thisrelatively high difference in the determined RH of the solutionis most likely caused by challenges in regards to generatingthe same RH for all the calibration tests with salts.
Based on the results from Section V C, it is clearthat the precision and accuracy obtained by using dm= 0 as the equilibrium criterion for the salt–water mixturedepends on: the accuracy of the DPA sensor, the step sizeof the change in RH, and the duration of the calibrationtests with salts. The single salts LiCl, MgCl2, Mg(NO3)2,NaCl, and KNO3 have well-defined equilibrium RH of thesolutions.19 The differences between the values measuredwith the DPA and the reference values should thereforebe adjusted. After calculating the differences between thereference values and the measured calibration values for thesesingle salts, the measured equilibrium RH of the solutionfor the NaCl–Na2SO4 and NaCl–NaNO3 mixtures couldbe adjusted accordingly and these recalculated equilibriumRHs for NaCl-Na2SO4 and NaCl-NaNO3 mixtures were notsignificantly different from values reported in the literature,24
suggesting that the computed adjustment was correct.The equilibrium RH of the solution of charged salt
particles individually suspended in an electrodynamic cellby the imposed RH was determined by measuring theabrupt change in the DC voltage caused by changing RH; areproducibility equal to, or greater than, ±2% was obtained.25
With the DVS instrument, differences of 0.38%–1.1% RHfrom the literature were found in previous work. The largestdifference between the mean of the equilibrium RH of the solu-tions obtained during absorption and desorption was 0.35%RH for Mg(NO3)2.2 For NaCl and Ca(NO3)2·4H2O, it wasdetermined to be 75.4% ± 0.5% RH and to 50.8% ± 0.7% RH,respectively, using temperature and humidity controlled X-raydiffraction (RH-XRD).10 Comparison with values obtainedfrom the literature makes it reasonable to characterize theresults found in the present study as accurate.
VI. CONCLUSIONS
To obtain the most reliable and accurate results for theequilibrium RH of the salt solutions, it is necessary to createindividual salt calibration tests based on the fundamentalproperties of each salt. Compared with previous works, themethod used in this study enables determination of equilibriumRH of the solution with a high accuracy, ensuring finercalibration of the experimental equipment.
For the salt calibration tests, the precision of reachingequilibrium RH of the salt/water lump was found to be essentialto obtain accurate results. The equilibrium RH of the solutiondetermined experimentally using the closed-loop control modein the present work did not differ significantly from the refer-ence values for LiCl, MgCl2, Mg(NO3)2, NaCl, and KNO3.
Because of the varying accuracy of the DPA, a morerobust calibration was obtained by RH using the mass flowcontrollers (control mode open-loop) and by measuring the RHwithin the sample chamber (with the DPA) and recalculatingthe determined equilibrium RH of the solutions relative to thereference values.
The precision of each determined equilibrium RH ofthe solutions of the salt by the imposed relative humidityof the gas stream was better than 0.5% RH in the presentwork. In previous works, a precision of 0.5%–0.7% RH wasfound by using RH-XRD, and salt calibration methods weredeveloped for DVS with differences between 0.38% and 1.1%RH compared with reference values.2,10,19 Compared withthese results, the present method may be considered moreaccurate.
ACKNOWLEDGMENTS
This project was financially supported by the A. P.Møller and Chastine Mc-Kinney Møller Foundation. We thankKurt Kielsgaard Hansen for both practical and technicalsupport with the DVS apparatus and George W. Scherer forconstructive comments on the manuscript.
1A. Apelblat and E. Korin, J. Chem. Thermodyn. 30, 59 (1998).2L. Wadsö, A. Anderberg, I. Åslund, and O. Söderman, Eur. J.Pharm. Bio-pharm. 72, 99 (2009).
3I. Rörig-Dalgaard, in The 3rd International Workshop on Crystallization inPorous Media, edited by T. Diaz (Portugal, 2012), freely available onlinethrough TUE’s http://www.phys.tue.nl/nfcmr/cryspom/2012-CryspomIII-abstracts.pdf and LNEC’s webites http://www-ext.lnec.pt/drymass/pdfs/workshop_abstracts.pdf.
4M. E. Wise, S. T. Martin, L. M. Russell, and P. R. Buseck, AerosolSci.Technol. 42, 281 (2008).
5G. E. Ewing, “H2O on NaCl: From single molecule, to clusters, tomonolayer,to thin film, to deliquescence,” in Structure and Bonding (Springer-Verlag,Berlin, Heidelberg, 2005), Vol. 116, pp. 1–15.
6M. Steiger, J. Cryst. Growth 282, 455 (2005).7H. P. Freiesleben, in The Science of Construction Materials, edited by O. M.Jensen (Springer-Verlag, Berlin, Heidelberg, 2009).
8R. M. Espinosa and L. Franke, Constr. Build. Mater. 22, 1758 (2008).9L. W. Bruch, M. W. Cole, and E. Zaremba, Physical Adsorption Forcesand Phenomena (Dover Publications, Inc., Mineola, New York, 1997),pp. 249–255.
10K. Linnow and M. Steiger, Anal. Chim. Acta 583, 197 (2007).11K. Linnow, H. Juling, and M. Steiger, Environ. Geol. 52, 317 (2007).12F. Toribio, J. P. Bellat, P. H. Nguyen, and M. Dupont, J. Colloid Interface
Sci. 280, 315 (2004).13D. Frenkel, J. Phys.: Condens. Matter 6, A71 (1994).14R. Chang, Chemistry, 8th ed. (McGraw Hill, 2005), pp. 243–245.15M. Steiger, Bauinstandsetzen und Baudenkmalpflege 11, 419 (2005).16Surface Measurement Systems, DVS Advantage Operation Manual, Revi-
sion1.3, n.y., Unit 5, Wharfside Rosemont Road, Alperton, London HA04PE, United Kingdom.
17M. E. Wise, G. Biskos, S. T. Martin, L. M. Russell, and P. R. Buseck, AerosolSci. Technol. 39, 849 (2005).
18Q. E. Li and S. J. Schmidt, J. Food Sci. 76, E149 (2011).19L. Greenspan, J. Res. Natl. Bur. Stand., Sect. A 81A, 89 (1977).20J. N. Miller and J. C. Miller, Statistics and Chemometrics for Analytical-
Chemistry, 5th ed. (Pearson Prentice Hall, 2005), pp. 39–73.21I. Rörig-Dalgaard, in Proceedings from The 4th International Workshop
on Crystallization in Porous Media, The Netherland’s 2014.22C. B. Richardson and T. D. Snyder, Langmuir 10, 2462 (1994).23O. M. Jensen, Sens. Actuators A 181, 13 (2012).24I. Rörig-Dalgaard, in Salt Weathering on Buildings and Stone Sculptures,
edited by H. De Clercq (Royal Institute for Cultural Heritage (KIK-IRPA),Belgium, 2014).
25I. N. Tang and H. R. Munkelwitz, J. Atmos. Environ. 27A, 467 (1993). Reuse of AIP Publishing content is subject to the terms at: https://publishing.aip.org/authors/rights-and-permissions. Download to IP: 192.38.67.115 On: Wed, 20 Jul
2016 13:11:56