
Hierarchical Models of the Visual System - Serre...
15
Hierarchical Models of the Visual System Thomas Serre Cognitive Linguistic & Psychological Sciences Department Brain Institute for Brain Sciences Brown University Synonyms Hierarchical architectures; Deep learning architectures; Simple-to-complex hier- archies; Hubel & Wiesel model; Large-scale models of the visual system. Definition Hierarchical models of the visual system are neural networks with a layered topology: In these networks, the receptive fields of units (i.e., the region of the visual space that units respond to) at one level of the hierarchy are constructed by combining inputs from units at a lower level. After a few processing stages, small receptive fields tuned to simple stimuli get combined to form larger re- ceptive fields tuned to more complex stimuli. Such anatomical and functional hierarchical architecture is a hallmark of the organization of the visual system. Since the pioneering work of Hubel and Wiesel (1962), a variety of hier- archical models have been described from relatively small-scale models of the primary visual cortex to very large-scale (system-level) models of object and action recognition, which account for processing in large portions of the vi- sual field and entire visual streams. The term ‘model of the visual system’ is generally reserved for architectures that are constrained in some way by the anatomy and the physiology of the visual system (with various degrees of real- ism). Convolutional networks are closely related connectionist networks with a similar architecture that have been used in multiple real-world machine learning problems including speech and music classification. Detailed description The processing of shape information in the ventral stream of the visual cor- tex follows a series of stages, starting from the retina, through the Lateral Geniculate Nucleus (LGN) of the thalamus to primary visual cortex (V1) and extrastriate visual areas, V2, V4 and the inferotemporal (IT) cortex. In turn IT provides a major source of input to prefrontal cortex (PFC) involved in linking 1
Transcript of Hierarchical Models of the Visual System - Serre...

Hierarchical Models of the Visual System
Thomas SerreCognitive Linguistic & Psychological Sciences Department
Brain Institute for Brain Sciences
Brown University
Synonyms
Hierarchical architectures; Deep learning architectures; Simple-to-complex hier-archies; Hubel & Wiesel model; Large-scale models of the visual system.
Definition
Hierarchical models of the visual system are neural networks with a layeredtopology: In these networks, the receptive fields of units (i.e., the region of thevisual space that units respond to) at one level of the hierarchy are constructedby combining inputs from units at a lower level. After a few processing stages,small receptive fields tuned to simple stimuli get combined to form larger re-ceptive fields tuned to more complex stimuli. Such anatomical and functionalhierarchical architecture is a hallmark of the organization of the visual system.
Since the pioneering work of Hubel and Wiesel (1962), a variety of hier-archical models have been described from relatively small-scale models of theprimary visual cortex to very large-scale (system-level) models of object andaction recognition, which account for processing in large portions of the vi-sual field and entire visual streams. The term ‘model of the visual system’ isgenerally reserved for architectures that are constrained in some way by theanatomy and the physiology of the visual system (with various degrees of real-ism). Convolutional networks are closely related connectionist networks with asimilar architecture that have been used in multiple real-world machine learningproblems including speech and music classification.
Detailed description
The processing of shape information in the ventral stream of the visual cor-tex follows a series of stages, starting from the retina, through the LateralGeniculate Nucleus (LGN) of the thalamus to primary visual cortex (V1) andextrastriate visual areas, V2, V4 and the inferotemporal (IT) cortex. In turn ITprovides a major source of input to prefrontal cortex (PFC) involved in linking
1
perception to memory and action (see DiCarlo et al., 2012, for a recent reviewbut also Limitations section below for further discussion). As one progressesalong the ventral stream visual hierarchy, neurons become selective for increas-ingly complex stimuli – from simple oriented bars and edges in early visual areaV1 to moderately complex features in intermediate areas (such as combinationof orientations) and complex objects and faces in higher visual areas such asIT. In parallel to this increase in the complexity of the preferred stimulus, theinvariance properties of neurons also increases with neurons gradually becom-ing more and more tolerant with respect to the exact position and scale of thestimulus within their receptive fields. As a result of this increase in invarianceproperties, the receptive field size of neurons increases, from about one degreeor less in V1 to several degrees in IT.
Hierarchical models of the visual system have a long history starting withMarko and Giebel (1970)’s homogeneous multi-layered architecture and laterFukushima (1980)’s Neocognitron. One of the key principles in the Neocogni-tron and other modern hierarchical models originates from the pioneering phys-iological studies and models of Hubel and Wiesel (1962). In these networks, thereceptive fields of units at one level of the hierarchy are constructed by com-bining inputs from units at a lower level. After a few processing stages, smallreceptive fields tuned to simple stimuli get combined to form larger receptivefields tuned to more complex stimuli.
Several hierarchical models of the ventral stream of the visual system havebeen described since the Neocognitron to account for the organization and theneurophysiology of the ventral stream of the visual cortex. These models canbe coarsely divided into conceptual proposals (Biederman, 1987; Perrett andOram, 1993; Hochstein and Ahissar, 2002) and neurobiological models (e.g.,?Mel, 1997; Riesenhuber and Poggio, 1999; Ullman et al., 2002; Thorpe, 2002;Amit and Mascaro, 2003; Wersing and Koerner, 2003; Serre et al., 2007; Masque-lier and Thorpe, 2007; Grossberg et al., 2011a,b; O’Reilly et al., 2013). Similarhierarchical models have also been proposed to explain motion processing in thedorsal stream of the visual cortex (e.g., Simoncelli and Heeger, 1998; Grossberget al., 1999; Perrone and Thiele, 2002; Giese and Poggio, 2003; Rust et al., 2006;Jhuang et al., 2007; Pack and Born, 2008; Mineault et al., 2012).
Somewhat independently, convolutional networks and other deep learningarchitectures have been developed in computer vision (LeCun et al., 1998).These neural networks do not mimic the organization of the visual cortex indetail, but biology is often cited as a source of inspiration. While these modelsare not, strictly speaking, models of the visual system, their impressive successin multiple visual recognition tasks (Krizhevsky et al., 2012), offer supportingevidence for hierarchical models of the visual system.
Hierarchical models of the primary visual cortex
Hubel and Wiesel (1962) first described two functional classes of cortical cells:Simple cells respond best to oriented stimuli (e.g, bars, edges, gratings) at oneparticular orientation, position and phase (i.e., white bar on a black background
2

A
B
Figure 1: Hubel & Wiesel model. (A) Receptive field (RF) of a simplecell obtained by selectively pooling over afferent (center-surround) cells alignedalong a preferred axis of orientation (horizontal shown here). (B) At the nextstage, a complex cell RF can be obtained by selectively pooling over afferentsimple cells with the same preferred orientation (horizontal). Shown here is acomplex cell RF obtained by pooling over position to build tolerance to trans-lation of the preferred stimulus but a more complete model of a complex cellwould also include pooling over simple cells tuned to slightly different spatialfrequency and phases (Rust et al., 2005; Chen et al., 2007). Modified from Hubeland Wiesel (1962).
or a dark bar on a white background) within their relatively small receptivefields. Complex cells, on the other hand, while also selective for bars, tend tohave larger receptive fields (about twice as large) and exhibit some tolerancewith respect to the exact position of the stimulus within their receptive fields.Complex cells are also invariant to contrast reversal, i.e., the same cell respondsto a white bar on a black background or the opposite.
Figure 1 illustrates a plausible neural circuit proposed by Hubel and Wiesel(1962) to explain the receptive field organization of these two functional classesof cells. Simple-cell-like receptive fields can be obtained by pooling the activityof a small set of cells tuned to spots of lights with a center-surround organization(as observed in ganglion cells in the LGN and layer IV of the striate cortex)aligned along a preferred axis of orientation (Figure 1A).
Similarly, at the next stage, position tolerance at the complex cell level,could be obtained by pooling over afferent simple cells (from the level below)with the same preferred (horizontal) orientation but slightly different positions(Figure 1B). While the precise circuits underlying the invariance of complexcells are still debated (Chance et al., 2000), the coarse circuitry and underly-
3
ing pooling mechanisms postulated by Hubel & Wiesel over fifty years ago arenow relatively well established (Rust et al., 2005; Chen et al., 2007). This hasrecently lead to the development of a number of computational models of theprimary visual cortex (Traub et al., 2005; Zhu et al., 2010; Antolık and Bednar,2011; Bednar, 2012), which account for the processing of one or a few corticalhypercolumns (see below) at the level of biophysically realistic circuits.
Hierarchical models of the visual system
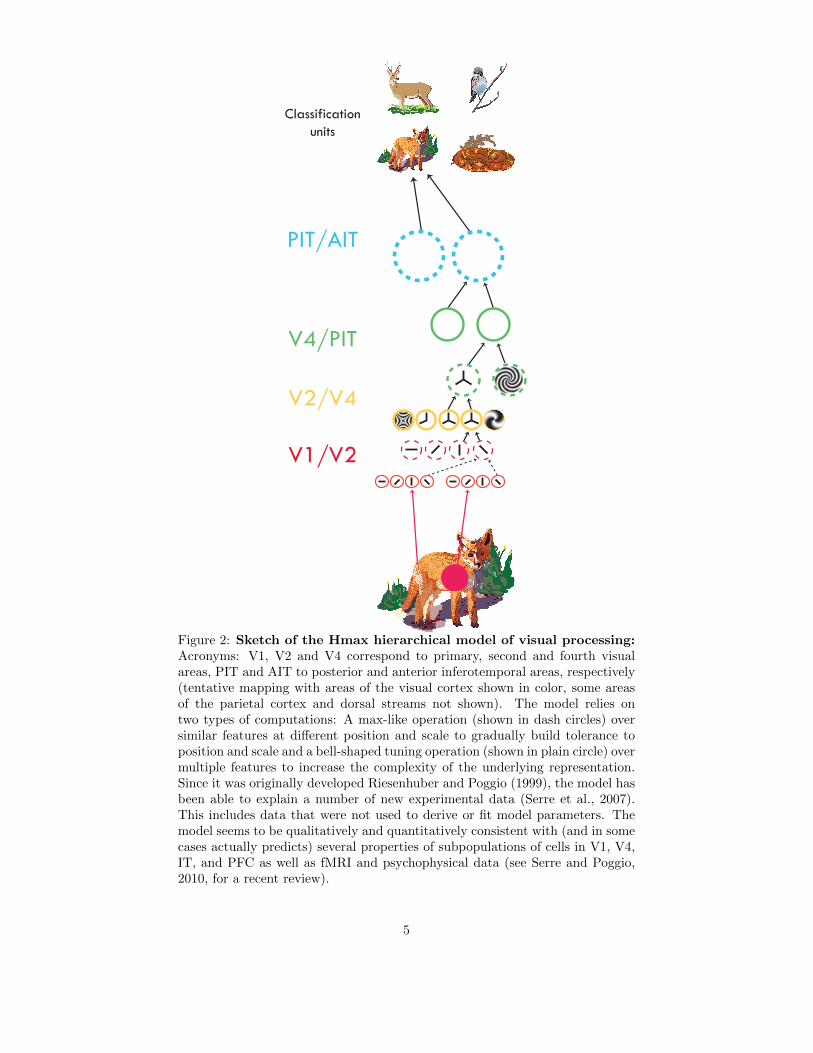
Hierarchical models of the visual system typically extend these two classes ofsimple and complex cells from striate to extrastriate areas and come in manydifferent forms: They differ in terms of their specific wiring and correspondingparameterizations as well as the mathematical operations that are implemented.However, common to all these models is an underlying basic architecture corre-sponding to multiple stages of processing as shown for the Hmax, a represen-tative hierarchical model of visual processing (Riesenhuber and Poggio, 1999;Serre et al., 2007), on Figure 2.
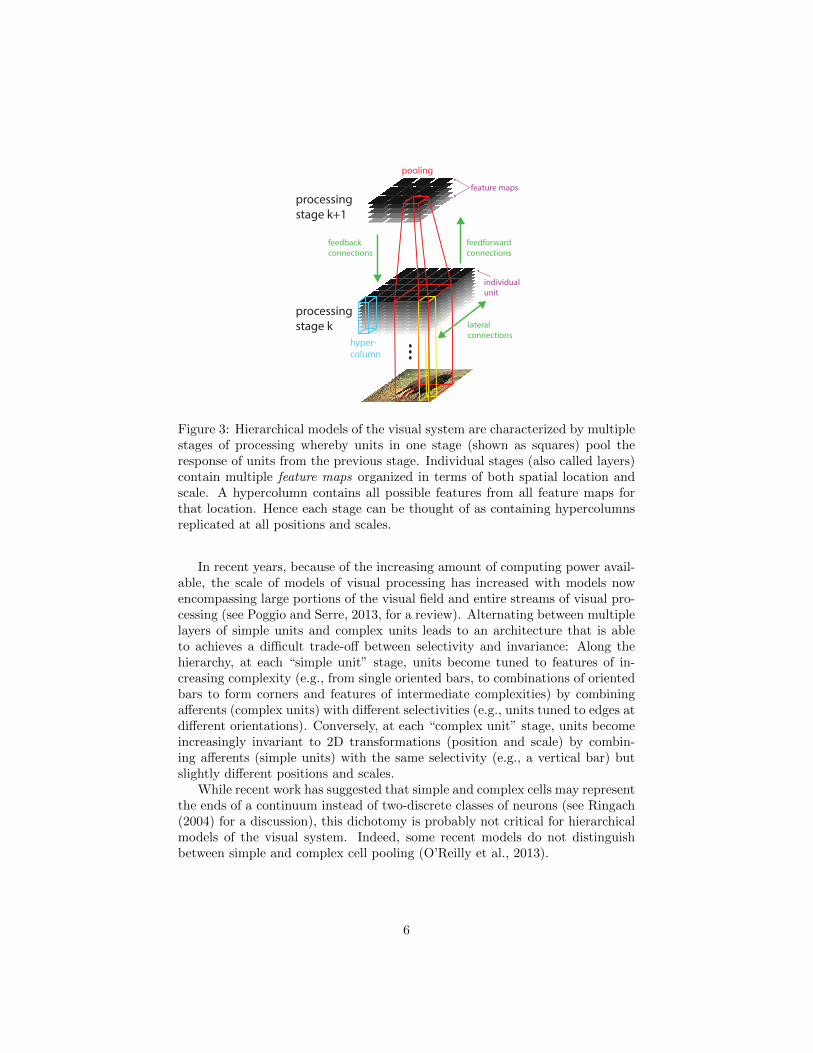
A general wiring diagram of the Hmax and other related hierarchical modelsof the visual cortex is shown on Figure 3. Units at stage k + 1 pool selectivelyover afferent units from the previous stage k within a local neighborhood (shownin red). In general, pooling may occur over multiple dimensions of the afferentunits (e.g., position, scale, orientation, etc). Pooling over multiple locations (asshown in stage k on Figure 3) leads to an increase in the receptive field size ofthe units at the next stage (compare the receptive field size of a unit at stage kshown in yellow with that of a unit at a higher stage k + 1 (shown in red).
For instance, a computational instantiation of the Hubel & Wiesel hierarchi-cal model of the primary visual cortex corresponds to two processing stages (amore detailed model would include an additional processing stage correspondingto center-surround cells – not shown here for simplicity). Simple cells in layerk = 1 receive their inputs directly from pixel intensities in the previous layerk = 0 (see yellow receptive field in Figure 3). Complex cells in layer k = 2pool over afferent simple cells at the same orientation over a local neighborhood(shown is a 3 × 3 neighborhood). These types of circuits have lead to severalmodels of the primary visual cortex that have focused on explaining in rea-sonably good biophysical details the tuning properties of individual cells suchas orientation, motion or stereo disparity, (see Landy and Movshon, 1991, forreview).
4
Classification units
PIT/AIT
V4/PIT
V2/V4
V1/V2
Figure 2: Sketch of the Hmax hierarchical model of visual processing:Acronyms: V1, V2 and V4 correspond to primary, second and fourth visualareas, PIT and AIT to posterior and anterior inferotemporal areas, respectively(tentative mapping with areas of the visual cortex shown in color, some areasof the parietal cortex and dorsal streams not shown). The model relies ontwo types of computations: A max-like operation (shown in dash circles) oversimilar features at different position and scale to gradually build tolerance toposition and scale and a bell-shaped tuning operation (shown in plain circle) overmultiple features to increase the complexity of the underlying representation.Since it was originally developed Riesenhuber and Poggio (1999), the model hasbeen able to explain a number of new experimental data (Serre et al., 2007).This includes data that were not used to derive or fit model parameters. Themodel seems to be qualitatively and quantitatively consistent with (and in somecases actually predicts) several properties of subpopulations of cells in V1, V4,IT, and PFC as well as fMRI and psychophysical data (see Serre and Poggio,2010, for a recent review).
5
...
processing
processing stage k
feedbackconnections
individual unit
hyper-column
feature maps
pooling
feedforward connections
stage k+1
lateralconnections
Figure 3: Hierarchical models of the visual system are characterized by multiplestages of processing whereby units in one stage (shown as squares) pool theresponse of units from the previous stage. Individual stages (also called layers)contain multiple feature maps organized in terms of both spatial location andscale. A hypercolumn contains all possible features from all feature maps forthat location. Hence each stage can be thought of as containing hypercolumnsreplicated at all positions and scales.
In recent years, because of the increasing amount of computing power avail-able, the scale of models of visual processing has increased with models nowencompassing large portions of the visual field and entire streams of visual pro-cessing (see Poggio and Serre, 2013, for a review). Alternating between multiplelayers of simple units and complex units leads to an architecture that is ableto achieves a difficult trade-off between selectivity and invariance: Along thehierarchy, at each “simple unit” stage, units become tuned to features of in-creasing complexity (e.g., from single oriented bars, to combinations of orientedbars to form corners and features of intermediate complexities) by combiningafferents (complex units) with different selectivities (e.g., units tuned to edges atdifferent orientations). Conversely, at each “complex unit” stage, units becomeincreasingly invariant to 2D transformations (position and scale) by combin-ing afferents (simple units) with the same selectivity (e.g., a vertical bar) butslightly different positions and scales.
While recent work has suggested that simple and complex cells may representthe ends of a continuum instead of two-discrete classes of neurons (see Ringach(2004) for a discussion), this dichotomy is probably not critical for hierarchicalmodels of the visual system. Indeed, some recent models do not distinguishbetween simple and complex cell pooling (O’Reilly et al., 2013).
6
wij
i
j-0.6
-0.0
1.0
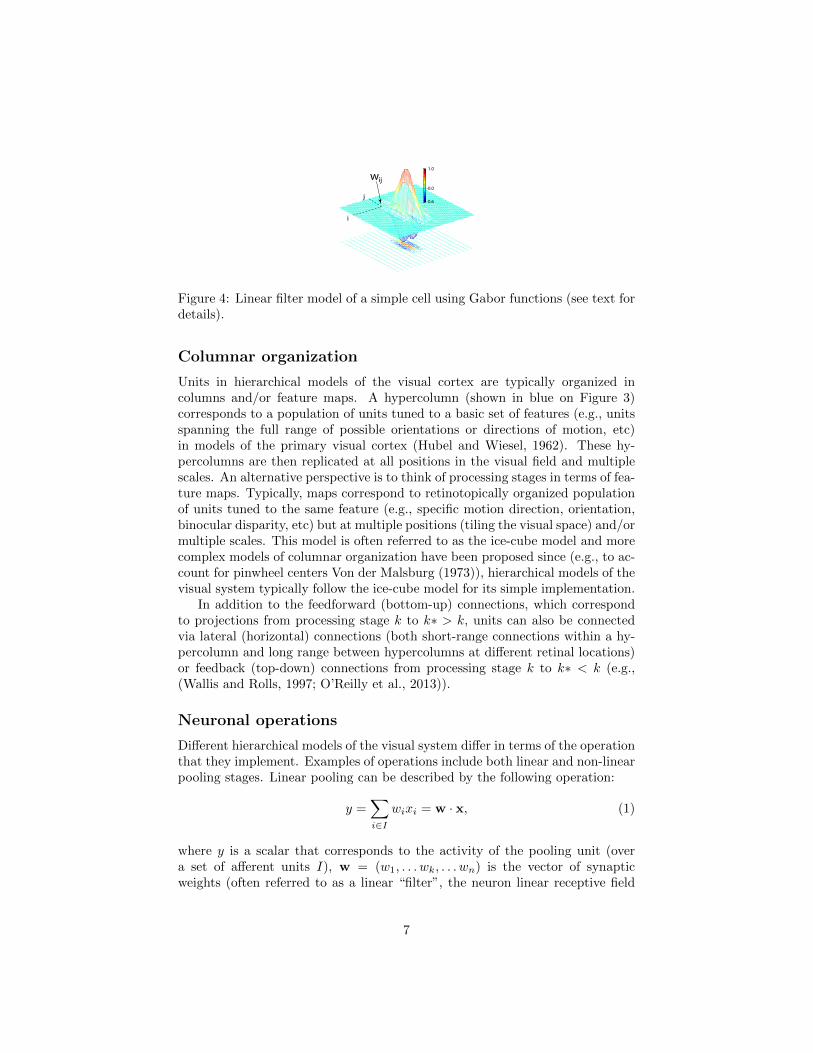
Figure 4: Linear filter model of a simple cell using Gabor functions (see text fordetails).
Columnar organization
Units in hierarchical models of the visual cortex are typically organized incolumns and/or feature maps. A hypercolumn (shown in blue on Figure 3)corresponds to a population of units tuned to a basic set of features (e.g., unitsspanning the full range of possible orientations or directions of motion, etc)in models of the primary visual cortex (Hubel and Wiesel, 1962). These hy-percolumns are then replicated at all positions in the visual field and multiplescales. An alternative perspective is to think of processing stages in terms of fea-ture maps. Typically, maps correspond to retinotopically organized populationof units tuned to the same feature (e.g., specific motion direction, orientation,binocular disparity, etc) but at multiple positions (tiling the visual space) and/ormultiple scales. This model is often referred to as the ice-cube model and morecomplex models of columnar organization have been proposed since (e.g., to ac-count for pinwheel centers Von der Malsburg (1973)), hierarchical models of thevisual system typically follow the ice-cube model for its simple implementation.
In addition to the feedforward (bottom-up) connections, which correspondto projections from processing stage k to k∗ > k, units can also be connectedvia lateral (horizontal) connections (both short-range connections within a hy-percolumn and long range between hypercolumns at different retinal locations)or feedback (top-down) connections from processing stage k to k∗ < k (e.g.,(Wallis and Rolls, 1997; O’Reilly et al., 2013)).
Neuronal operations
Different hierarchical models of the visual system differ in terms of the operationthat they implement. Examples of operations include both linear and non-linearpooling stages. Linear pooling can be described by the following operation:
y =∑i∈I
wixi = w · x, (1)
where y is a scalar that corresponds to the activity of the pooling unit (overa set of afferent units I), w = (w1, . . . wk, . . . wn) is the vector of synapticweights (often referred to as a linear “filter”, the neuron linear receptive field
7
or “projective field”) for the corresponding input vector x = (x1, . . . xk, . . . xn).The pool of units I is typically organized in terms of hypercolumns / featuremaps (see above). For instance, in models of the primary visual cortex, thesynaptic weights of a simple cell tuned to spatial orientation can be thought ofas a 2D filter parameterized by the weight matrix W = {wij}, wij correspondsto the weight of the unit at location (i, j) within the receptive field. Here weconsider two dimensional receptive fields for simplicity but in the general casereceptive fields can have many dimensions including time, feature types, eyedominance, etc.
A good 2D mathematical model of simple cells’ receptive fields is the Gaborfunction (Jones and Palmer, 1987), which is given by the following equation:
wij = exp
(− (i2 + γ2j2)
2σ2
)× cos
(2π
λi
)(2)
s.t. i = i cos θ + j sin θ and j = −i sin θ + j cos θ.
The five parameters, i.e., the orientation θ, the aspect ratio γ, the effectivewidth σ, the phase φ and the wavelength λ, determine the properties of thespatial receptive field of the corresponding model simple cell (see Figure 4 foran example of a 2D Gabor function). Also there exists a straightforward 3Dextension of this parameterization to include a temporal receptive field (seeDayan and Abbott, 2001).
A simple extension of the linear model is the linear-nonlinear (LN) cascademodel whereby the unit response y is passed to a non-linear scalar function fwith non-negative output (Rieke et al., 1997):
y = f(∑i∈I
wixi) ∼∑i∈I
w∗i g(xi), (3)
Popular choices for the function f include rectification functions, exponentialfunctions, or the logistic and the hyperbolic function). The LN model has beenshown to account for a host of experimental data (Rieke et al., 1997) and ithas been shown that in many cases, biophysically more realistic, spiking neuronmodels can be reduced to a simple LN cascade (Ostojic and Brunel, 2011). TheLN cascade (linear filter followed by the hyperbolic function) has also been themain pooling operation used in standard connectionist networks.
Extensions of the LN cascade include the addition of a normalization stage,in which the response y of the neuron is divided by a common factor thattypically includes the summed activity of a pool of neurons:
y =
∑i∈I
wif(xi)
k +∑j∈J
g(xi), (4)
where k � 1 is a constant to avoid zero-division. The pool of neurons J used fornormalization may correspond to the same pool of neurons I which shape the
8
(classical) receptive field or may extend beyond to account for extra-classicalreceptive field effects (Series et al., 2003). Normalization circuits were originallyproposed to explain the contrast response of cells in the primary visual cortexand are now thought to operate throughout the visual system, and in manyother sensory modalities and brain regions (see Carandini and Heeger, 2012, fora recent review).
For instance, in the Hmax model shown on Figure 2, two types of opera-tions have been assumed: A bell-shaped tuning functions for simple cells anda max-like operation at the level of complex cells (Riesenhuber and Poggio,1999). Interestingly both operations can be approximated via a specific form ofEquation 4. Mathematically, a bell-shaped tuning function and a softmax, takeessentially the same general form, that is:
y =
∑i∈I
wi xpi
k +
(∑i∈I
xqi
)r , (5)
where p, q and r represent the static nonlinearities in the underlying neuralcircuit. Such nonlinearity may correspond to different regimes on the f − Icurve of the presynaptic neurons such that different operating ranges providedifferent degrees of nonlinearities (from near-linearity to steep non-linearity).An extra sigmoid transfer function on the output g(y) = 1/(1 + expα(y−β))controls the sharpness of the unit response. By adjusting these non-linearities,Eq. 5 can approximate better a max or a tuning function (see Kouh and Poggio,2008, for details).
Why hierarchies?
The most studied visual function is probably object recognition, which reflectsour ability to assign a label or meaning to an image of an object irrespective ofthe precise size, position, illumination or context and clutter. The main compu-tational problem in object recognition is achieving invariance while preservingselectivity (Riesenhuber and Poggio, 1999); cells found in IT are typically tunedto views of complex objects such as faces (Tsao and Livingstone, 2008) – theydischarge strongly to a face but very little or not at all to other objects. A hall-mark of these cells is the robustness of their responses in the face of stimulustransformations such as scale and position changes. This finding presents aninteresting question: How could these cells respond differently to similar stim-uli (for instance, two different faces) that activate the retinal photoreceptorsin similar ways, but respond consistently to scaled and translated versions ofthe preferred stimulus, which produce very different activation patterns on theretina? It has been postulated that the goal of the ventral stream of the vi-sual cortex is to achieve an optimal tradeoff between selectivity and invariance
9
via a hierarchy of processing stages whereby neurons at higher and higher lev-els exhibit an increasing degree of invariance to image transformations such astranslations and scale changes (Riesenhuber and Poggio, 1999).
Now, why hierarchies? Several hypotheses have been described to explainthe hierarchical modularity of our visual system ranging from a stability argu-ment (i.e., faster adaptation or evolution of the system in response to changingenvironmental conditions) to minimization of wiring cost in addition to otherevolutionary arguments (see Meunier et al., 2010, for review). An alternativehypothesis – for models in the Hubel & Wiesel spirit – is that the hierarchy mayprovide a solution to the invariance-selectivity trade-off problem by decompos-ing a complex task such as invariant object recognition in a hierarchy of simplerones (at each stage of processing). Hierarchical organization in cortex is notlimited to the visual pathways, and thus a more general explanation may beneeded. Interestingly, from the point of view of classical learning theory (Pog-gio and Smale, 2003), there is no need for architectures with more than threelayers.
So, why hierarchies? There may be reasons of efficiency, such as the efficientuse of computational resources. For instance, the lowest levels of the hierarchymay represent a dictionary of features that can be shared across multiple clas-sification tasks (Geman, 1999). There may also be the more fundamental issueof sample complexity, the number of training examples required for good gen-eralization (see Serre and Poggio, 2010, for a discussion). An obvious differencebetween the best classifiers derived from learning theory and human learning isin fact the number of examples required in tasks such as object recognition. Sta-tistical learning theory shows that the complexity of the hypothesis space setsthe requirement for the number of samples needed for learning. If a task – like avisual recognition task – can be decomposed into low-complexity learning tasksfor each layer of a hierarchical learning machine, then each layer may requireonly a small number of training examples (Poggio and Smale, 2003). Neuro-science suggests that what humans can learn may be represented by hierarchiesthat are locally simple. Thus, our ability to learn from just a few examples, andits limitations, may be related to the hierarchical architecture of cortex.
Limitations
To-date most existing hierarchical models of visual processing both from theperspective of biological and machine vision are instances of feedforward mod-els (but see O’Reilly et al., 2013). These models have been useful to explore thepower of fixed hierarchical organization as originally suggested by Hubel andWiesel (1962). These models assume that our core object recognition capabilityproceeds through a cascade of hierarchically organized areas of the visual cortexwith computations at each successive stage being largely feedforward (Riesen-huber and Poggio, 1999; DiCarlo et al., 2012). They have led, for instance, toalgorithms competitive with the best computer vision systems (see Serre andPoggio, 2010, for a review). Their limitations, however, are becoming increas-ingly obvious. Not only top-down effects are key to normal, everyday vision,
10
but back-projections are also likely to be a key part of what cortex is comput-ing and how. Human observers can essentially answer an infinite number ofquestions about an image (one could in fact imagine a Turing test of vision).Thus, a major question for modeling visual cortex revolves around the role ofback-projections and the related fact that vision is more than object recogni-tion and requires interpreting and parsing visual scenes (as opposed to simplyfinding out whether a specific object is present in the visual scene or not).
In addition, while the overall hierarchical organization of the visual cortex isnow well established (Felleman and Van Essen, 1991), the parallel between theanatomical and functional hierarchy is, however, looser than one might expect.While the trend is, from lower to higher visual areas, for neurons’ receptive fieldsto become increasingly large and tuned to increasingly complex preferred stim-uli, there remains a very broad distribution of tuning and receptive field sizes inall areas of the visual hierarchy. For instance, IT, which is commonly assumedto have solved the problem of invariant recognition (DiCarlo et al., 2012), alsocontains neurons with relatively small receptive fields and tuned to relativelysimple visual features such as simple orientations (Desimone et al., 1984). Aclose comparison of shape representation between V1, V2 and V4 also demon-strated a complex pattern of shape selectivity with significant deviation fromstrict hierarchical organization with some cells in V1 exhibiting more complextuning than some cells in V4 (Hegde and Van Essen, 2007). Furthermore, besidethe visual cortical hierarchy, there exist additional subcortical pathways (includ-ing cortico-thalamo-cortical loops). Hence, the anatomical hierarchy should betaken as an idealization and cannot be taken as a strict flowchart of visualinformation (Hegde and Felleman, 2007).
Cross-References
Feedforward network, Recurrent network, Deep learning network
References
Amit, Y. and Mascaro, M. (2003). An integrated network for invariant visualdetection and recognition. Vision Research, 43(19):2073–2088.
Antolık, J. and Bednar, J. A. (2011). Development of maps of simple andcomplex cells in the primary visual cortex. Frontiers in computational neu-roscience, 5:17.
Bednar, J. A. (2012). Building a mechanistic model of the development andfunction of the primary visual cortex. Journal of physiology, Paris, 106(5-6):194–211.
Biederman, I. (1987). Recognition-by-components: A theory of human imageunderstanding. Psychological Review, 94(2):115–147.
11

Carandini, M. and Heeger, D. (2012). Normalization as a canonical neuralcomputation. Nature Reviews Neuroscience, 13:51–62.
Chance, F., Nelson, S., and Abbott, L. (2000). A recurrent network model forthe phase invariance of complex cell responses. Neurocomputing, 32-33:339–344.
Chen, X., Han, F., Poo, M.-m. M., and Dan, Y. (2007). Excitatory and sup-pressive receptive field subunits in awake monkey primary visual cortex (V1).Proceedings of the National Academy of Sciences of the United States of Amer-ica, 104(48):19120–5.
Dayan, P. and Abbott, L. F. (2001). Theoretical Neuroscience: Computationaland Mathematical Modeling of Neural Systems. MIT Press.
Desimone, R., Albright, T. D., Gross, C. G., and Bruce, C. (1984). Stimulus-selective properties of inferior temporal neurons in the macaque. The Journalof Neuroscience, 4(8):2051–2062.
DiCarlo, J. J., Zoccolan, D., and Rust, N. C. (2012). How does the brain solvevisual object recognition? Neuron, 73(3):415–434.
Felleman, D. J. and Van Essen, D. C. (1991). Distributed hierarchical processingin the primate cerebral cortex. Cerebral cortex, 1:1–47.
Fukushima, K. (1980). Neocognitron: A self-organizing neural network modelfor a mechanism of pattern recognition unaffected by shift in position. Bio-logical Cybernetics, 36:193–202.
Geman, S. (1999). Hierarchy in machine and natural vision. In Proceedings ofthe 11th Scandinavian Conference on Image Analysis.
Giese, M. A. and Poggio, T. (2003). Neural mechanisms for the recognition ofbiological movements. Nature Reviews Neuroscience, 4(3):179–192.
Grossberg, S., Markowitz, J., and Cao, Y. (2011a). On the road to invari-ant recognition: Explaining trade-off and morph properties of cells in infer-otemporal cortex using multiple-scale task-sensitive attentive learning. NeuralNetworks, 24(10):1036–49.
Grossberg, S., Mingolla, E., and Pack, C. (1999). A neural model of motionprocessing and visual navigation by cortical area MST. Cerebral Cortex,9(8):878–895.
Grossberg, S., Srinivasan, K., and Yazdanbakhsh, A. (2011b). On the roadto invariant object recognition: How cortical area V2 transforms absolute torelative disparity during 3D vision. Neural networks, 24(7):686–92.
Hegde, J. and Felleman, D. J. (2007). Reappraising the functional implicationsof the primate visual anatomical hierarchy. The Neuroscientist, 13(5):416–21.
12

Hegde, J. and Van Essen, D. (2007). A comparative study of shape representa-tion in macaque visual areas V2 and V4. Cerebral Cortex, 17(5):1100–1116.
Hochstein, S. and Ahissar, M. (2002). View from the top: Hierarchies andreverse hierarchies in the visual system. Neuron, 36(5):791–804.
Hubel, D. and Wiesel, T. (1962). Receptive fields, binocular interaction andfunctional architecture in the cat’s visual cortex. Journal of physiology,160:106–154.
Jhuang, H., Serre, T., and Wolf, L. (2007). A biologically inspired system foraction recognition. In Proc. IEEE International Conference on ComputerVision.
Jones, J. P. and Palmer, L. A. (1987). An evaluation of the two-dimensional Ga-bor filter model of simple receptive fields in cat striate cortex. J Neurophysiol,58(6):1233–1258.
Kouh, M. and Poggio, T. (2008). A canonical neural circuit for cortical nonlinearoperations. Neural Computation, 20(6):1427–1451.
Krizhevsky, A., Sutskever, I., and Hinton, G. (2012). ImageNet Classificationwith Deep Convolutional Neural Networks. In Neural Information ProcessingSystems, Lake Tahoe, Nevada.
Landy, M. and Movshon, J. (1991). Computational Models of Visual Processing.Bradford Books.
LeCun, Y., Bottou, L., Bengio, Y., and Haffner, P. (1998). Gradient-BasedLearning Applied to Document Recognition. Proc. of the IEEE, 86(11):2278–2324.
Marko, H. and Giebel, H. (1970). Recognition of handwritten characters witha system of homogeneous Layers. Nachrichtentechnische Zeitschrift, 23:455–459.
Masquelier, T. and Thorpe, S. J. (2007). Unsupervised learning of visual fea-tures through spike timing dependent plasticity. PLoS Computational Biology,3(2):e31.
Mel, B. W. (1997). SEEMORE: Combining color, shape, and texture histogram-ming in a neurally inspired approach to visual object recognition. NeuralComputation, 9:777–804.
Meunier, D., Lambiotte, R., and Bullmore, E. T. (2010). Modular and hierar-chically modular organization of brain networks. Frontiers in neuroscience,4:200.
Mineault, P., Khawaja, F., Butts, D., and Pack, C. (2012). Hierarchical process-ing of complex motion along the primate dorsal visual pathway. Proceedingsof the National Academy of Science, 109(16):E972–E980.
13
Ostojic, S. and Brunel, N. (2011). From spiking neuron models to linear-nonlinear models. PLoS computational biology, 7(1):e1001056.
O’Reilly, R. C., Wyatte, D., Herd, S., Mingus, B., and Jilk, D. J. (2013).Recurrent Processing during Object Recognition. Frontiers in Psychology,4(April):1–14.
Pack, C. C. and Born, R. T. (2008). Cortical mechanisms for the integration ofvisual motion. Oxford: Elsevier Ltd.
Perrett, D. and Oram, M. (1993). Neurophysiology of shape processing. Imageand Vision Computing, 11(6):317–333.
Perrone, J. a. and Thiele, A. (2002). A model of speed tuning in MT neurons.Vision research, 42(8):1035–51.
Poggio, T. and Serre, T. (2013). Models of the visual cortex. Scholarpedia,8(4):3516.
Poggio, T. and Smale, S. (2003). The mathematics of learning: Dealing withdata. Notices of the American Mathematical Society, 50(5).
Rieke, F., Warland, D., de Ruyter van Steveninck, R., and Bialek, W. (1997).Spikes: Exploring the Neural Code. MIT Press.
Riesenhuber, M. and Poggio, T. (1999). Hierarchical models of object recogni-tion in cortex. Nature Neuroscience, 2:1019–1025.
Ringach, D. L. (2004). Mapping receptive fields in primary visual cortex. Journalof physiology, 558(3):717–28.
Rust, N. C., Mante, V., Simoncelli, E. P., and Movshon, J. A. (2006). How MTcells analyze the motion of visual patterns. Nature Neuroscience, 9(11):1421–31.
Rust, N. C., Schwartz, O., Movshon, J. A., and Simoncelli, E. P. (2005). Spa-tiotemporal elements of macaque V1 receptive fields. Neuron, 46(6):945–56.
Series, P., Lorenceau, J., and Fregnac, Y. (2003). The silent surround of V1receptive fields: theory and experiments. Journal of physiology-Paris, 97:453–474.
Serre, T., Kreiman, G., Kouh, M., Cadieu, C., Knoblich, U., and Poggio, T.(2007). A quantitative theory of immediate visual recognition. Progress inBrain Research, 165:33–56.
Serre, T. and Poggio, T. (2010). A neuromorphic approach to computer vision.Communications of the Association for Computing Machinery, 53(10):54.
Simoncelli, E. P. and Heeger, D. J. (1998). A model of neuronal responses invisual area MT. Vision Research, 38(5):743–761.
14
Thorpe, S. J. (2002). Ultra-Rapid Scene Categorisation with a Wave of Spikes.Proc. Biologically Motivated Computer Vision, pages 1–15.
Traub, R. D., Contreras, D., Cunningham, M. O., Murray, H., LeBeau, F. E. N.,Roopun, A., Bibbig, A., Wilent, W. B., Higley, M. J., and Whittington, M. A.(2005). Single-column thalamocortical network model exhibiting gamma oscil-lations, sleep spindles, and epileptogenic bursts. Journal of neurophysiology,93(4):2194–232.
Tsao, D. Y. and Livingstone, M. S. (2008). Mechanisms of face perception.Annual review of Neuroscience, 31:411–437.
Ullman, S., Vidal-Naquet, M., and Sali, E. (2002). Visual features of inter-mdediate complexity and their use in classification. Nature Neuroscience,5(7):682–687.
Von der Malsburg, C. (1973). Self-organization of orientation sensitive cells inthe striate cortex. Kybernetik, 14(2):85–100.
Wallis, G. and Rolls, E. T. (1997). A model of invariant object recognition inthe visual system. Prog. Neurobiol., 51:167–194.
Wersing, H. and Koerner, E. (2003). Learning optimized features for hierarchicalmodels of invariant recognition. Neural Computation, 15(7):1559–1588.
Zhu, W., Xing, D., Shelley, M., and Shapley, R. (2010). Correlation betweenspatial frequency and orientation selectivity in V1 cortex: implications of anetwork model. Vision research, 50(22):2261–73.
Further Reading
Poggio, T. & Serre, T. (2013) Models of visual cortex, Scholarpedia, 8(4):3516.Kreiman, G. (2008) Biological object recognition, Scholarpedia, 3(6):2667.
15


