Hierarchical complexity and the limits of organism size
23
Hierarchical complexity and the limits of organism size Noel A. Heim Department of Geological Sciences, Stanford University Jonathan L. Payne, Meghan Balk, Seth Finnegan, Matthew L. Knope, Michał Kowalewski, S. Kathleen Lyons, Craig R. McClain, Daniel W. McShea, Philip M. Novack-Gottshall, Felisa A. Smith, Paula A. Spaeth and Steve C. Wang
Transcript of Hierarchical complexity and the limits of organism size

Hierarchical complexity and the limits of organism size
Noel A. HeimDepartment of Geological Sciences, Stanford University
Jonathan L. Payne, Meghan Balk, Seth Finnegan, Matthew L. Knope, Michał Kowalewski, S. Kathleen Lyons, Craig R. McClain, Daniel W. McShea, Philip M. Novack-Gottshall, Felisa A. Smith,
Paula A. Spaeth and Steve C. Wang
• Jennifer Saltzman & History of Life Interns
• Margaret Deng, Meghan Faerber, Linda Hambrick, Galen Griggs, Sam Sanghvi
Acknowledgements

have also been interpreted as macroalgae, although some may bepseudofossils (24, 25). Specimens of Grypania spiralis in the !1.6Gya Rohtas Formation of Vindhyan Supergroup in India exhibitclear annulations and represent the oldest uncontroversial eu-karyotic macrofossils (26). Thereafter, maximum size remainedapproximately constant for "1 billion years (Fig. 1). If theNegaunee specimens are composite microbial filaments ratherthan eukaryotic (or prokaryotic) individuals, as suggested bySamuelsson and Butterfield (21), they would be excluded fromour dataset because they would not be the remains of individualorganisms. In this case, the size jump would shift forward in timeto the first true eukaryotic macrofossil (the Vindhyan Grypaniain the most extreme case), but the magnitude of the size jumpand its association with the appearance of eukaryotic organismswould be essentially unchanged.
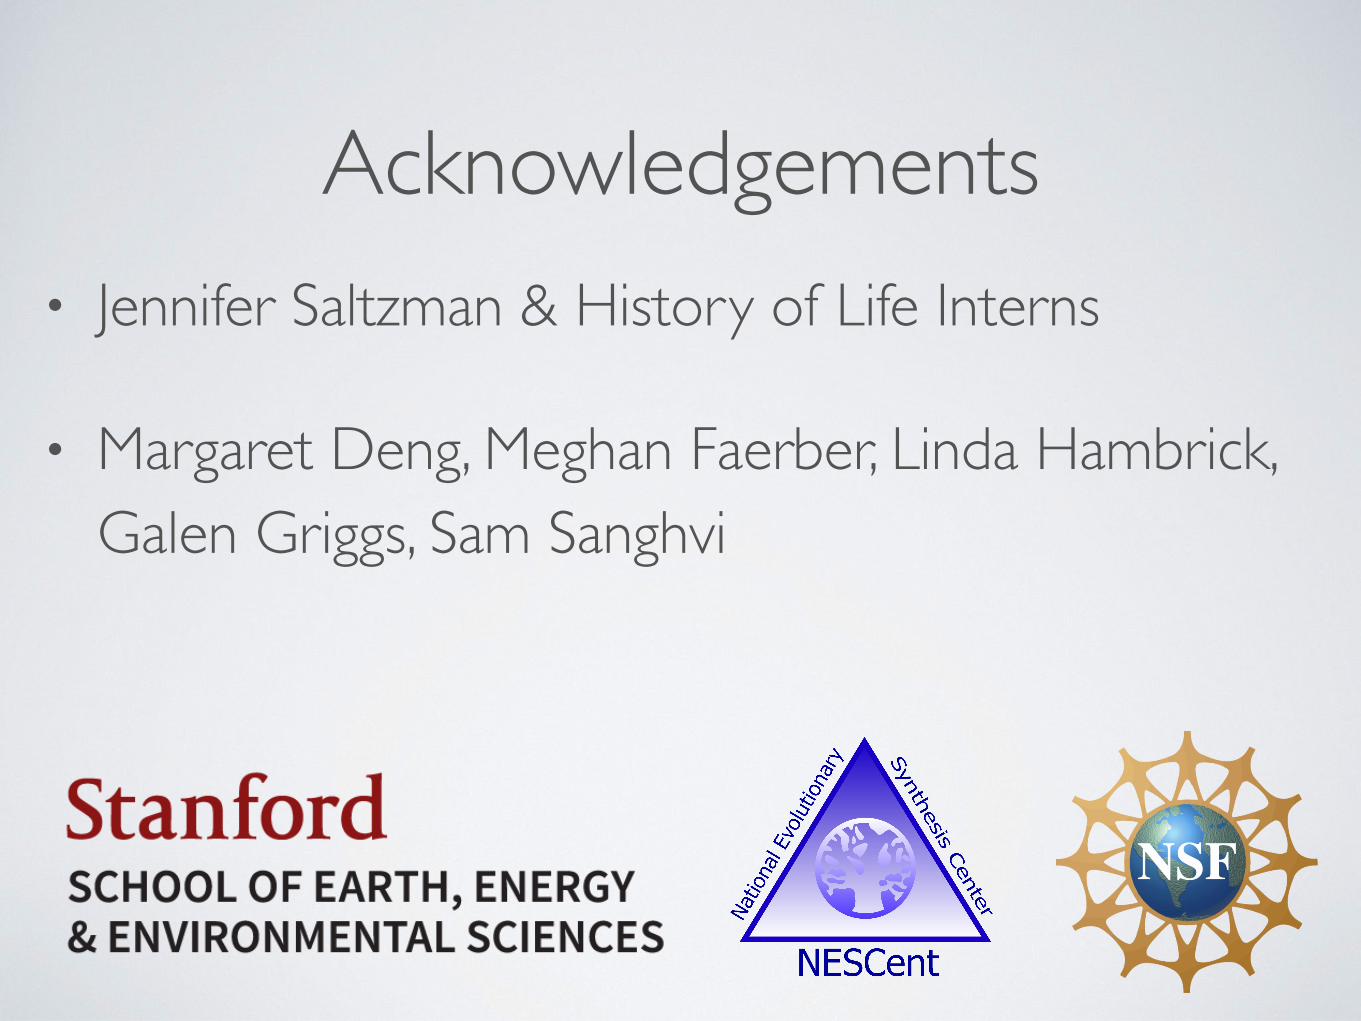
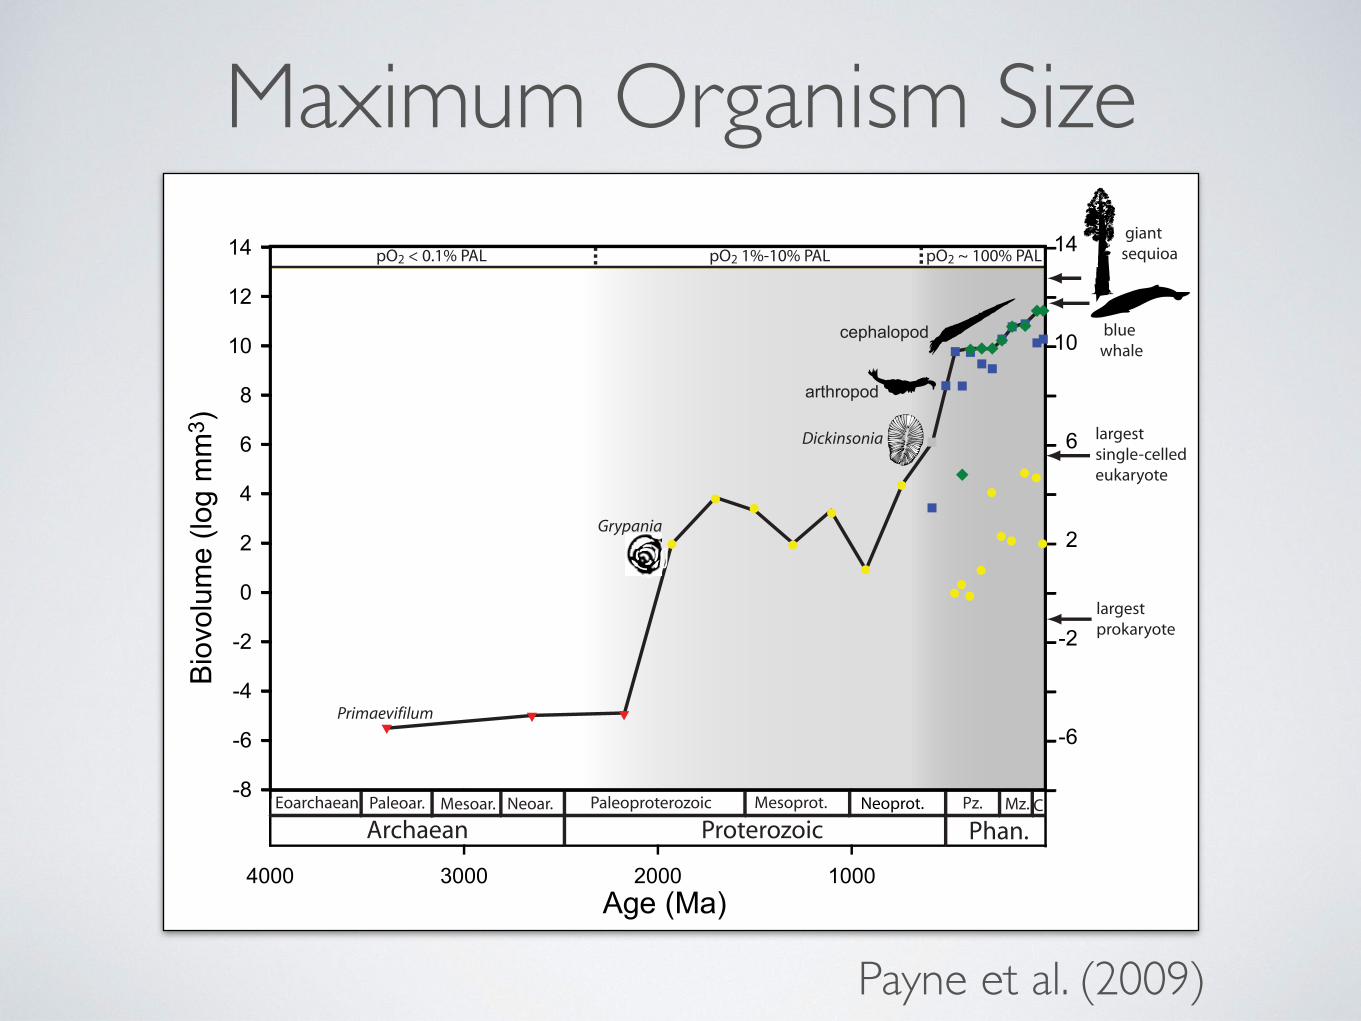
The second major increase in maximum size began with theappearance of the taxonomically problematic Vendobionts dur-ing the Ediacaran Period (635–542 Mya). These were followedin turn by larger Cambrian (542–488 Mya) anomalocariid ar-thropods and even larger Ordovician (488–443 Mya) nautiloidcephalopods. The largest Ordovician cephalopods were nearly 6orders of magnitude larger than the largest pre-Ediacaran fossils.
The continuing diversification of terrestrial and marine lifesince the Ordovician has resulted in comparatively minor in-crease in the sizes of the largest species. The maximum size ofanimals has increased by only 1.5 orders of magnitude since theOrdovician; the giant sauropods of the Mesozoic and even theextant blue whale add comparatively little to the size range ofanimals (Fig. 1). The largest living individual organism, the giantsequoia, is only 3 orders of magnitude bigger than the largestOrdovician cephalopod and one and a half orders of magnitudebigger than the blue whale (Fig. 1).
DiscussionSeveral lines of evidence indicate that our record of maximumsize accurately reflects both the fossil record and the actual
history of maximum size at the taxonomic and temporal scalesaddressed. Larger fossils and larger fossil species tend to beremarked upon in the paleontological literature; genus andspecies names with roots meaning ‘‘large’’ or ‘‘giant’’ are com-monly applied to particularly sizeable taxa, making them easy toidentify in the literature. Because we treat size data on alogarithmic scale, even moderate sampling biases are unlikely tocause observed maxima to vary by "1 or 2 orders of magnitude.In contrast, species in the maximum size dataset span "16 ordersof magnitude, and the sizes of all living organisms span "22orders of magnitude (27). Although the upper bound error barsfor the individual data points cannot be readily estimated, theseerrors are likely to be negligible given the size range addressedin our study. For example, it is unlikely that dinosaurs, whales,or cephalopods "10 times the size of the largest known speci-mens have ever existed. That the largest living plant and animalspecies are not much bigger than the largest known fossils (Fig.1) suggests fossils reliably sample not only trends but alsoabsolute values of maximum size at the temporal and taxonomicscales considered in this study. Trends in trace fossil sizes aregenerally concordant with the body fossil record (28), indicatingthat the apparent size increase from the Ediacaran throughOrdovician does not merely reflect an increase in preservationpotential of large animals. Moreover, large-bodied fossils occurin both well-fossilized clades (e.g., cephalopods) and taxa thatare preserved only under exceptional circumstances (e.g.,anomalocariids, Vendobionts).
The episodic pattern of size increase is not predicted under thesimplest null model of diffusion away from a small starting size,which has commonly been invoked to account for the tendencyof maximum size to increase through time within clades (18, 29,30). If size evolves in a manner analogous to diffusion, sizeincrease and decrease would be equally likely for any lineage inany time interval and, given constant diversity, the typicalmaximum size would be expected to increase with the squareroot of time elapsed. Based on the diffusive model alone, onewould predict initially rapid increase in maximum size early inthe history of life, followed by a gradual decrease in this rate. Anydivergence from this pattern would suggest other causes at work.In particular, the observed episodes of dramatic increase suggestthe origins of key evolutionary innovations, the removal ofenvironmental constraints, pulses of diversification, or morelikely, some combination of these. The relative stability inmaximum size between these episodes of increase suggests theencountering of new environmental or biological upper bounds.The existence of such boundaries is also consistent with theobservation that the historical maxima for numerous well-fossilized animal phyla and plant divisions differ by only 2 ordersof magnitude (Fig. 2). Ongoing diversity increase and improvedsampling likely contribute to the continuing, albeit slow, increaseobserved in the overall maximum size of plants and animalsthrough the Phanerozoic.
Increases in organismal complexity, first the eukaryotic celland later eukaryotic multicellularity, appear to have been pre-requisites for increase in maximum size. The Paleoproterozoicjump in maximum size reflects the first appearance of eukaryoticbody fossils rather than the evolution of larger prokaryotes. Theapparent abruptness of the size increase from prokaryotic cellsto Grypania may reflect, at least in part, the limited preservationand sampling of fossils of this age. However, even the largestknown prokaryote—the extant giant sulfur bacterium Thiomar-garita namibiensis (27)—does not approach the size of the oldesteukaryotic macrofossils, perhaps in part because simple diffu-sion of nutrients into or within the cell becomes inefficient atlarger sizes (27). Moreover, Thiomargarita and other giantbacteria consist of thin films of cytoplasm surrounding a hollowinterior; the metabolically active portion of their volume isrelatively small (27). Similarly, the Ediacaran–Ordovician jump
Age (Ma)1000200030004000
Bio
volu
me
(log
mm
3 )
-8
-6
-4
-2
0
2
4
6
8
10
12
14
-6
-2
2
6
10
14
Archaean Proterozoic Phan.
giant sequioa
largest prokaryote
blue whale
pO2 < 0.1% PAL pO2 1%-10% PAL pO2 ~ 100% PAL
Paleoar. Mesoar. Neoar.Eoarchaean Paleoproterozoic Mesoprot. Neoprot. Pz. Mz. C
largest single-celledeukaryote
Grypania
Dickinsonia
cephalopod
arthropod
Primaevifilum
Fig. 1. Sizes of the largest fossils through Earth history. Size maxima areillustrated separately for single-celled eukaryotes, animals, and vascularplants for the Ediacaran and Phanerozoic. The solid line denotes the trend inthe overall maximum for all of life. Increases in the overall maximum occurredin discrete steps approximately corresponding to increases in atmosphericoxygen levels in the mid-Paleoproterozoic and Ediacaran–Cambrian–earlyOrdovician. Sizes of the largest fossil prokaryotes were not compiled past 1.9Gya. Estimates of oxygen levels from Canfield (38) and Holland (37) areexpressed in percentage of PAL. Phan., Phanerozoic; Pz., Paleozoic; Mz.,Mesozoic; C, Cenozoic. Red triangles, prokaryotes; yellow circles, protists; bluesquares, animals; green diamonds, vascular plants; gray square, Vendobiont(probable multicellular eukaryote).
Payne et al. PNAS ! January 6, 2009 ! vol. 106 ! no. 1 ! 25
EVO
LUTI
ON
GEO
LOG
Y
Maximum Organism Size
Payne et al. (2009)

Evolutionary Trends
Gould (1996)

Evolutionary Trends
McShea (1994)

stanley figure
$1�(;3/$1$7,21� )25� &23(6� 58/(� ��
����
����
����
����!�� ,16(&76��� ���� Q ����
'���� S�
D� ����
����� %,5'6�
,� "�W� �UO� Q�����_� A�����R�
�� �� �� �� �� �� �� �� �� �� �� �� ��� ��� ��� ��� �� �� ��� ��� ��� ��� ���
>:(,*+7� �*5$06��@�
),*�� ��� +LVWRJUDPV�RI�FXEH�URRWV�RI�ERG\�ZHLJKWV�IRU�5HFHQW�IO\LQJ�ELUGV�DQG�LQVHFWV���&XEH�URRW�RI�ZHLJKW�LV�XVHG�VR�WKDW�KLVWRJUDPV�ZLOO�EH�FRPSDUDEOH�WR�WKRVH�IRU�ZKLFK�OLQHDU�PHDVXUHPHQWV�DUH�SORWWHG���2QO\�WKUHH�LQVHFWV��/XFDQXV�FHUYXV������J���&RVVXV�FRVVXV�������J���DQG�2U\FWHV�QDVLFRUQLV�����J���DUH�ODUJHU�WKDQ�WKH�VPDOOHVW�ELUG��WKH�KXPPLQJELUG�$UFKLORFKXV�DOH[DQGUL������J��� %LUG�GDWD�IURP�0DJQDQ��������DQG�3RROH��������,QVHFW�GDWD�IURP�6RWDYDOWD�������DQG�������0DJQDQ��������DQG�0DJQDQ� DQG� 3HUULOOLDW�%RWRQHW�������� ,QVHFW�GDWD� PD\�EH� VOLJKWO\�ELDVHG�EHFDXVH�PRVW�ZHLJKWV�ZHUH�UHFRUGHG�WR� DFFRPSDQ\�ZLQJ�EHDW�PHDVXUHPHQWV��
WKDW��DV�PRUH�H[WUHPH�QLFKHV�DUH�RFFXSLHG�WKH�DPRXQW�RI�HYROXWLRQDU\�GLVSODFHPHQW�QHHGHG�LV�DERXW�DV�HDV\�WR�DFKLHYH��ZLWK�D�JLYHQ�RUJDQL]DWLRQ��E\�D�FKDQJH�LQ�VL]H�RI�D� JLYHQ�IDFWRU�LQ�HLWKHU�GLUHFWLRQ���)RU�H[DPSOH��LI�ZH�FRQVLGHU�VL]H�DORQH��RQFH�VXFK�D�GLVWULEXWLRQ�LV�IRUPHG�WKHUH�ZLOO�EH�DQ�HTXDO�FKDQFH�RI�D� VSHFLHV�DULVLQJ�DW�RQH�WHQWK�RU�WHQ�WLPHV�WKH�VL]H�RI�WKH�PHDQ��2WKHU�FRQVLGHUDWLRQV�ZLOO�OHDG�LQ�WKH�IRO��ORZLQJ�GLVFXVVLRQ�WR�D� TXLWH�GLIIHUHQW�LQ��WHUSUHWDWLRQ�RI� WKH� IXQGDPHQWDO�ULJKW��VNHZHG�GLVWULEXWLRQ��7KH� SRLQW�WR� EH�VWUHVVHG�KHUH�LV�WKDW�LQWULQVLF�VWUXFWXUDO�DQG�SK\VLRORJLFDO�OLPLWDWLRQV�RI�KLJKHU�WD[D�VHHP�WR�EH�RI�SULPDU\�LPSRUWDQFH�LQ�GH��WHUPLQLQJ�WKH�UDQJHV�DQG�PRGHV�RI�WKHLU�VL]H�IUHTXHQF\�GLVWULEXWLRQV��3XUHO\�HFR��ORJLFDO�FRQVLGHUDWLRQV��VXFK�DV�WKH�PRVDLF�RI�SRWHQWLDO�QLFKHV�RIIHUHG�E\�SK\VLFDO�IHD��WXUHV�RI�WKH�HQYLURQPHQW�RU�WKH�GLVWULEXWLRQ�RI�SRWHQWLDO�QLFKHV�DFFRUGLQJ�WR�WKH�(O��WRQLDQ�S\UDPLG�RI�DQLPDO�QXPEHUV�DQG�VL]HV�PXVW�DOVR�DIIHFW�WKH�VKDSHV�RI�GLV��WULEXWLRQV��EXW�DUH�QRW�WKH�RQO\�FRQWUROOLQJ�IDFWRUV��$V�DQ�H[DPSOH�RI�WKH�ZD\�LQ�ZKLFK�EDVLF�
DGDSWLYH�OLPLWV�FRQWURO�VL]H�IUHTXHQF\�GLV��
WULEXWLRQV�RI�PDMRU�WD[D��FRQVLGHU�WKH�GRPLQDQW�JURXSV�RI�IO\LQJ�DQLPDOV��,I�WKH�XSSHU�VL]H�OLPLW�IRU�LQVHFWV�RU�WKH�ORZHU�VL]H�OLPLW�IRU�ELUGV�ZHUH�GHWHUPLQHG�E\�FRPSHWLWLYH�LQWHUDFWLRQ��ZH�ZRXOG�SUHGLFW�WKH�SUHVHQFH�RI�D�VXEVWDQWLDO�FRQFHQWUDWLRQ�RI�VSHFLHV�LQ�WKH�UHJLRQ�RI�VL]H�RYHUODS��,QVWHDG�WKH�RYHUODS�RFFXUV�LQ�WKH�ULJKW��VNHZHG�WDLO�RI�WKH�LQVHFW�SORW�DQG�LQ�WKH�OHIW�KDQG�WDLO�RI�WKH�ELUG�SORW��)LJ�� ����8SSHU�VL]H�OLPLWV�IRU�LQVHFWV�DUH�DOPRVW�FHUWDLQO\�LPSRVHG�E\�WKH�WUDFKHDO�V\VWHP�RI�UHVSLUDWLRQ��,QVHFW�IOLJKW�PXVFOHV�PHWDE��ROL]H�DW�UDWHV�XQSDUDOOHOHG�E\�RWKHU�OLYLQJ�WLVVXHV��:HLV�)RJK��������� :KHUHDV�IRU�LQVHFWV�ZHLJKLQJ�OHVV�WKDQ�DERXW�RQH�JUDP�GLIIXVLRQ�DORQH� VXIILFHV�IRU�UHVSLUDWLRQ��ODUJH�IO\LQJ�LQVHFWV�HPSOR\�YHQWLODWLRQ�WR�PDLQWDLQ�DGHTXDWH�R[\JHQ�VXSSOLHV��JUDVV��KRSSHUV��GUDJRQIOLHV��PRWKV��DQG�EHHWOHV�XVH�WKRUDFLF�SXPSLQJ��ZKLOH�K\PHQRSWHUDQV�DQG� ODUJH�GLSWHUDQV�HPSOR\�DEGRPLQDO�SXPSLQJ��:HLV�)RJK��������� ,Q� VRPH�LQVHFW�JURXSV�UHVSLUDWLRQ�UDWH�LQFUHDVHV�ZLWK�WKH�WZR�WKLUGV�SRZHU�RI�ERG\�ZHLJKW��LQ�RWKHUV�LW�LQFUHDVHV�LQ�GLUHFW�SURSRUWLRQ�WR�ERG\�ZHLJKW��.DHVWHU�DQG�%XFN���������
This content downloaded on Wed, 6 Feb 2013 12:59:09 PMAll use subject to JSTOR Terms and Conditions
Stanley (1973)
Evolutionary Trends
have also been interpreted as macroalgae, although some may bepseudofossils (24, 25). Specimens of Grypania spiralis in the !1.6Gya Rohtas Formation of Vindhyan Supergroup in India exhibitclear annulations and represent the oldest uncontroversial eu-karyotic macrofossils (26). Thereafter, maximum size remainedapproximately constant for "1 billion years (Fig. 1). If theNegaunee specimens are composite microbial filaments ratherthan eukaryotic (or prokaryotic) individuals, as suggested bySamuelsson and Butterfield (21), they would be excluded fromour dataset because they would not be the remains of individualorganisms. In this case, the size jump would shift forward in timeto the first true eukaryotic macrofossil (the Vindhyan Grypaniain the most extreme case), but the magnitude of the size jumpand its association with the appearance of eukaryotic organismswould be essentially unchanged.
The second major increase in maximum size began with theappearance of the taxonomically problematic Vendobionts dur-ing the Ediacaran Period (635–542 Mya). These were followedin turn by larger Cambrian (542–488 Mya) anomalocariid ar-thropods and even larger Ordovician (488–443 Mya) nautiloidcephalopods. The largest Ordovician cephalopods were nearly 6orders of magnitude larger than the largest pre-Ediacaran fossils.
The continuing diversification of terrestrial and marine lifesince the Ordovician has resulted in comparatively minor in-crease in the sizes of the largest species. The maximum size ofanimals has increased by only 1.5 orders of magnitude since theOrdovician; the giant sauropods of the Mesozoic and even theextant blue whale add comparatively little to the size range ofanimals (Fig. 1). The largest living individual organism, the giantsequoia, is only 3 orders of magnitude bigger than the largestOrdovician cephalopod and one and a half orders of magnitudebigger than the blue whale (Fig. 1).
DiscussionSeveral lines of evidence indicate that our record of maximumsize accurately reflects both the fossil record and the actual
history of maximum size at the taxonomic and temporal scalesaddressed. Larger fossils and larger fossil species tend to beremarked upon in the paleontological literature; genus andspecies names with roots meaning ‘‘large’’ or ‘‘giant’’ are com-monly applied to particularly sizeable taxa, making them easy toidentify in the literature. Because we treat size data on alogarithmic scale, even moderate sampling biases are unlikely tocause observed maxima to vary by "1 or 2 orders of magnitude.In contrast, species in the maximum size dataset span "16 ordersof magnitude, and the sizes of all living organisms span "22orders of magnitude (27). Although the upper bound error barsfor the individual data points cannot be readily estimated, theseerrors are likely to be negligible given the size range addressedin our study. For example, it is unlikely that dinosaurs, whales,or cephalopods "10 times the size of the largest known speci-mens have ever existed. That the largest living plant and animalspecies are not much bigger than the largest known fossils (Fig.1) suggests fossils reliably sample not only trends but alsoabsolute values of maximum size at the temporal and taxonomicscales considered in this study. Trends in trace fossil sizes aregenerally concordant with the body fossil record (28), indicatingthat the apparent size increase from the Ediacaran throughOrdovician does not merely reflect an increase in preservationpotential of large animals. Moreover, large-bodied fossils occurin both well-fossilized clades (e.g., cephalopods) and taxa thatare preserved only under exceptional circumstances (e.g.,anomalocariids, Vendobionts).
The episodic pattern of size increase is not predicted under thesimplest null model of diffusion away from a small starting size,which has commonly been invoked to account for the tendencyof maximum size to increase through time within clades (18, 29,30). If size evolves in a manner analogous to diffusion, sizeincrease and decrease would be equally likely for any lineage inany time interval and, given constant diversity, the typicalmaximum size would be expected to increase with the squareroot of time elapsed. Based on the diffusive model alone, onewould predict initially rapid increase in maximum size early inthe history of life, followed by a gradual decrease in this rate. Anydivergence from this pattern would suggest other causes at work.In particular, the observed episodes of dramatic increase suggestthe origins of key evolutionary innovations, the removal ofenvironmental constraints, pulses of diversification, or morelikely, some combination of these. The relative stability inmaximum size between these episodes of increase suggests theencountering of new environmental or biological upper bounds.The existence of such boundaries is also consistent with theobservation that the historical maxima for numerous well-fossilized animal phyla and plant divisions differ by only 2 ordersof magnitude (Fig. 2). Ongoing diversity increase and improvedsampling likely contribute to the continuing, albeit slow, increaseobserved in the overall maximum size of plants and animalsthrough the Phanerozoic.
Increases in organismal complexity, first the eukaryotic celland later eukaryotic multicellularity, appear to have been pre-requisites for increase in maximum size. The Paleoproterozoicjump in maximum size reflects the first appearance of eukaryoticbody fossils rather than the evolution of larger prokaryotes. Theapparent abruptness of the size increase from prokaryotic cellsto Grypania may reflect, at least in part, the limited preservationand sampling of fossils of this age. However, even the largestknown prokaryote—the extant giant sulfur bacterium Thiomar-garita namibiensis (27)—does not approach the size of the oldesteukaryotic macrofossils, perhaps in part because simple diffu-sion of nutrients into or within the cell becomes inefficient atlarger sizes (27). Moreover, Thiomargarita and other giantbacteria consist of thin films of cytoplasm surrounding a hollowinterior; the metabolically active portion of their volume isrelatively small (27). Similarly, the Ediacaran–Ordovician jump
Age (Ma)1000200030004000
Bio
volu
me
(log
mm
3 )
-8
-6
-4
-2
0
2
4
6
8
10
12
14
-6
-2
2
6
10
14
Archaean Proterozoic Phan.
giant sequioa
largest prokaryote
blue whale
pO2 < 0.1% PAL pO2 1%-10% PAL pO2 ~ 100% PAL
Paleoar. Mesoar. Neoar.Eoarchaean Paleoproterozoic Mesoprot. Neoprot. Pz. Mz. C
largest single-celledeukaryote
Grypania
Dickinsonia
cephalopod
arthropod
Primaevifilum
Fig. 1. Sizes of the largest fossils through Earth history. Size maxima areillustrated separately for single-celled eukaryotes, animals, and vascularplants for the Ediacaran and Phanerozoic. The solid line denotes the trend inthe overall maximum for all of life. Increases in the overall maximum occurredin discrete steps approximately corresponding to increases in atmosphericoxygen levels in the mid-Paleoproterozoic and Ediacaran–Cambrian–earlyOrdovician. Sizes of the largest fossil prokaryotes were not compiled past 1.9Gya. Estimates of oxygen levels from Canfield (38) and Holland (37) areexpressed in percentage of PAL. Phan., Phanerozoic; Pz., Paleozoic; Mz.,Mesozoic; C, Cenozoic. Red triangles, prokaryotes; yellow circles, protists; bluesquares, animals; green diamonds, vascular plants; gray square, Vendobiont(probable multicellular eukaryote).
Payne et al. PNAS ! January 6, 2009 ! vol. 106 ! no. 1 ! 25
EVO
LUTI
ON
GEO
LOG
Y
Maximum Organism Size
Payne et al. (2009)

DIRECTIONALITY IN THE HISTORY OF LIFE
- Ability to preserve ideas and communicate them through time permits building on past experience Intelligence - Application of technology results in ability for conscious and intentional control of environment,
reversing the traditional relationship between organism and environment
Invasion - Biomass of producers becomes a major component of environmental systems : of the - Coevolutionary exploitation of interdependence of producers and consumers Land - Evolution of ability to maintain function under widely varying ambient conditions
- Open-ended size scale for life Aquatic - Significant 'packaging" of biomass
Multicellularity - Establishment of complex food chains - Lfe and life activies impact or become part of physical environment
Unicellular - Functional variety Eukaryote - Increased sizes
Diversification - nitia secondary (consumer) ecosystem ? --- etabol cvariety
Z Prokaryote - Life processes alter ernironment Diversification - Pmary
estruyurem T s .--Increase in
know it proce ,., ,,, :,
Time FIGURE 1. Diagram showing the increase in utilization of ecospace that accrued as each megatrajectory was added to the evolving biosphere. For each megatrajectory there is a "right wall" that limits the ecospace that can be realized by evolutionary expansion within that megatrajectory. The first organisms reaching each megatrajectory level re- alize only a small portion of the new potential ecospace made available to that megatrajectory. Over time both directional and diffusive evolution operate to expand the range of ecospace utilized by each megatrajectory, but eventually the bounding limits are reached. Note also that the increase in utilized ecospace is not uniform but fluctuates in rate and direction. Bounding walls are overcome only by evolutionary breakthroughs that make new dimensions or levels of ecospace available. The styles of the dimensions of ecospace new to each level are noted on the figure adjacent to the title of each megatrajectory.
a. 0
UJ j: LL
Stebbins 1969). However, whereas Maynard Smith and Szathmary stressed genomic com- plexity, we focus on ecosystem complexity and the multidimensional hypervolume of Hutchinsonian niche space (Hutchinson 1965), which we term ecospace. Relevant metrics in- clude the number of interactions in food webs, the pervasiveness of mutualisms, and the number of organisms through which biologi- cally important elements (carbon, nitrogen, phosphorus, and sulfur) pass before being re- turned to an inorganic state.
In the view offered here, each megatrajec- tory adds new and qualitatively distinct di- mensions to the way life utilizes ecospace (Fig. 1). This complicates the evaluation of com- plexity in phenotypic evolution (McShea 1996), but underscores the importance of eco- logical complexity in the history of life. The megatrajectories, themselves, are directional
insofar as the descendants of organisms that break through to the next level do not re- evolve the salient features of a previous state. (No eukaryote has produced prokaryotic de- scendants, and with the possible exception of myxozoans, no multicellular organism has spawned a unicellular lineage.) In this sense, these additive megatrajectories pass McShea's (1999) test of "increase vs. decrease" for di- rectionality.
Megatrajectory 1: From the Origin of Life to the Last Common Ancestor of Extant Life.-The last common ancestor (LCA) of all extant life was a sophisticated microorganism characterized (among other attributes) by DNA, RNA, ri- bosomes, multiple enzymes to direct tran- scription and translation as well as metabo- lism, membranes with embedded proteins to control ionic and molecular transport, and ATP. We remain in substantial ignorance
0
S a c
0
cr
0
a
ml-
3
Geozoic Megatrajectories
Knoll & Bambach (2000)

Viruses
SolitaryProkaryotes
SolitaryEukaryotes
Solitary MulticellularEukaryotes
Geozoic Megatrajectories

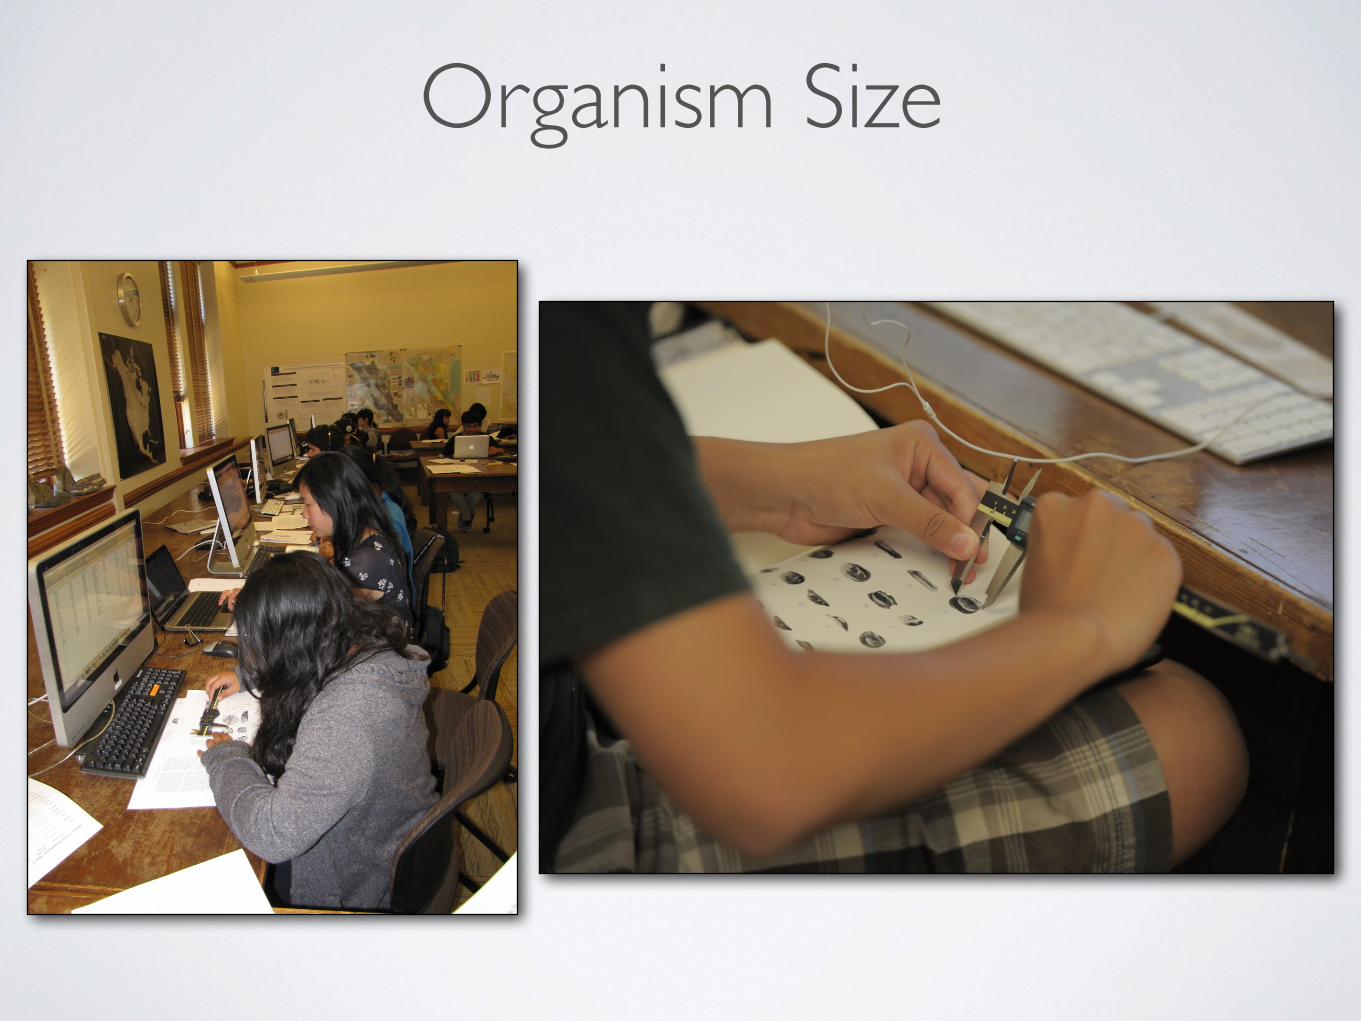
Organism Size

Organism Size
34,906 Genera

Organism Size
34,906 Genera 24,788 Extinct

Organism Size
34,906 Genera 24,788 Extinct 10,118 Extant

Organism Size
Organism Size

Geologic time (Ma)4000 3000 2000 1000 0
Archaean Proterozoic Phanerozoic
Biov
olum
e (lo
g 10 m
m3 )
−10
−6−2
26
10Geozoic Organism Size

040
080
0N
umbe
r of g
ener
a0
400
800
010
020
0N
umbe
r of g
ener
a0
100
200
020
050
0N
umbe
r of g
ener
a0
200
500
040
80
Biovolume (log10 mm3)
Num
ber o
f gen
era
040
80
−15 −10 −5 0 5 10 15
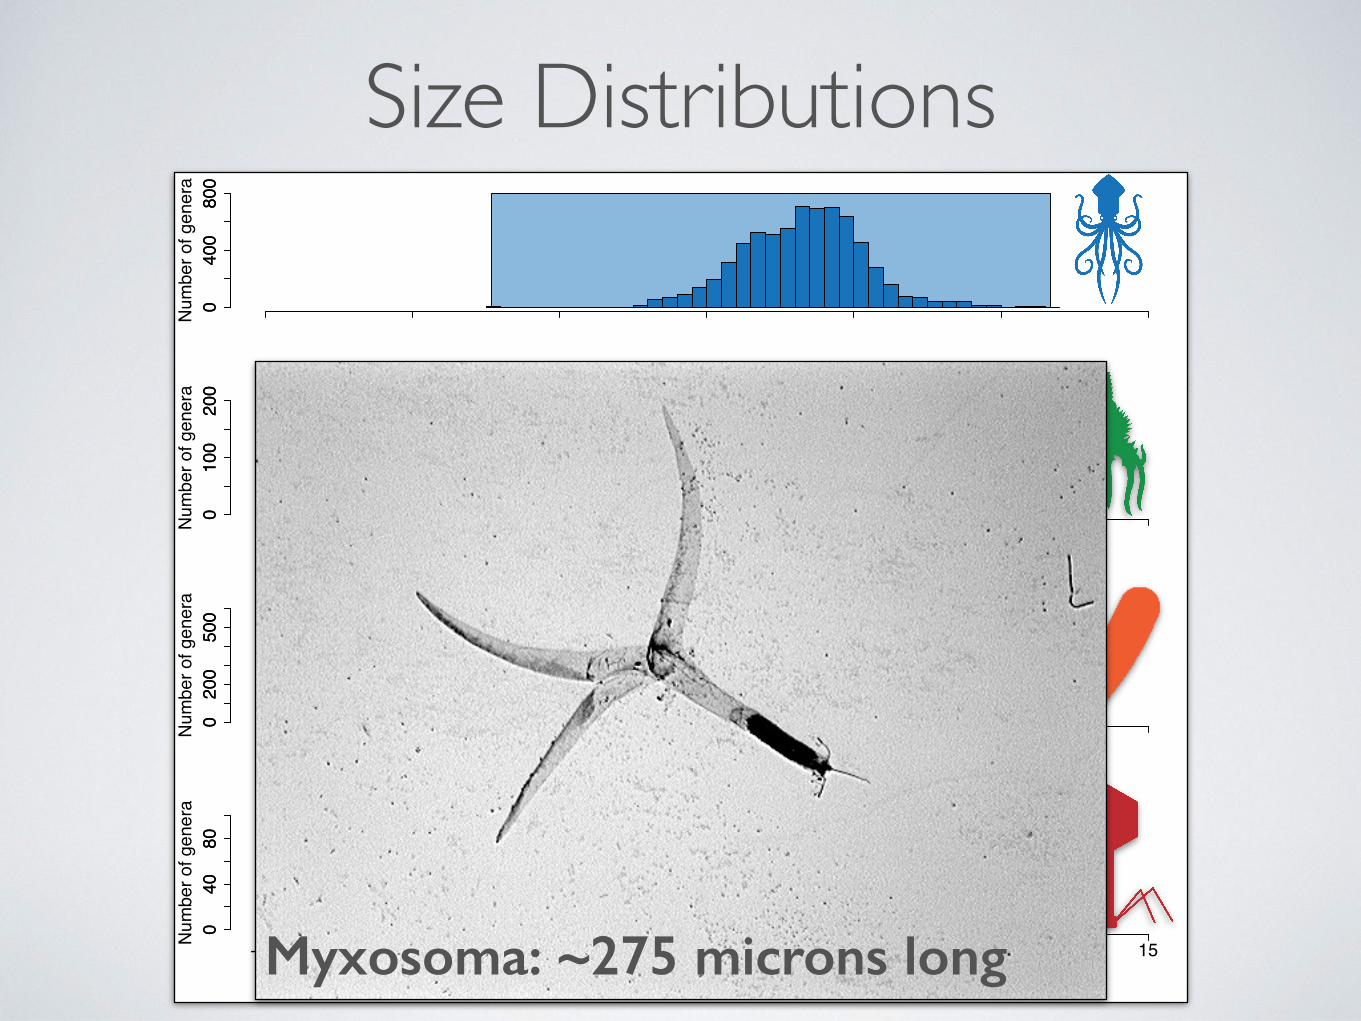
Size Distributions
040
080
0N
umbe
r of g
ener
a0
400
800
010
020
0N
umbe
r of g
ener
a0
100
200
020
050
0N
umbe
r of g
ener
a0
200
500
040
80
Biovolume (log10 mm3)
Num
ber o
f gen
era
040
80
−15 −10 −5 0 5 10 15Myxosoma: ~275 microns long
Size Distributions
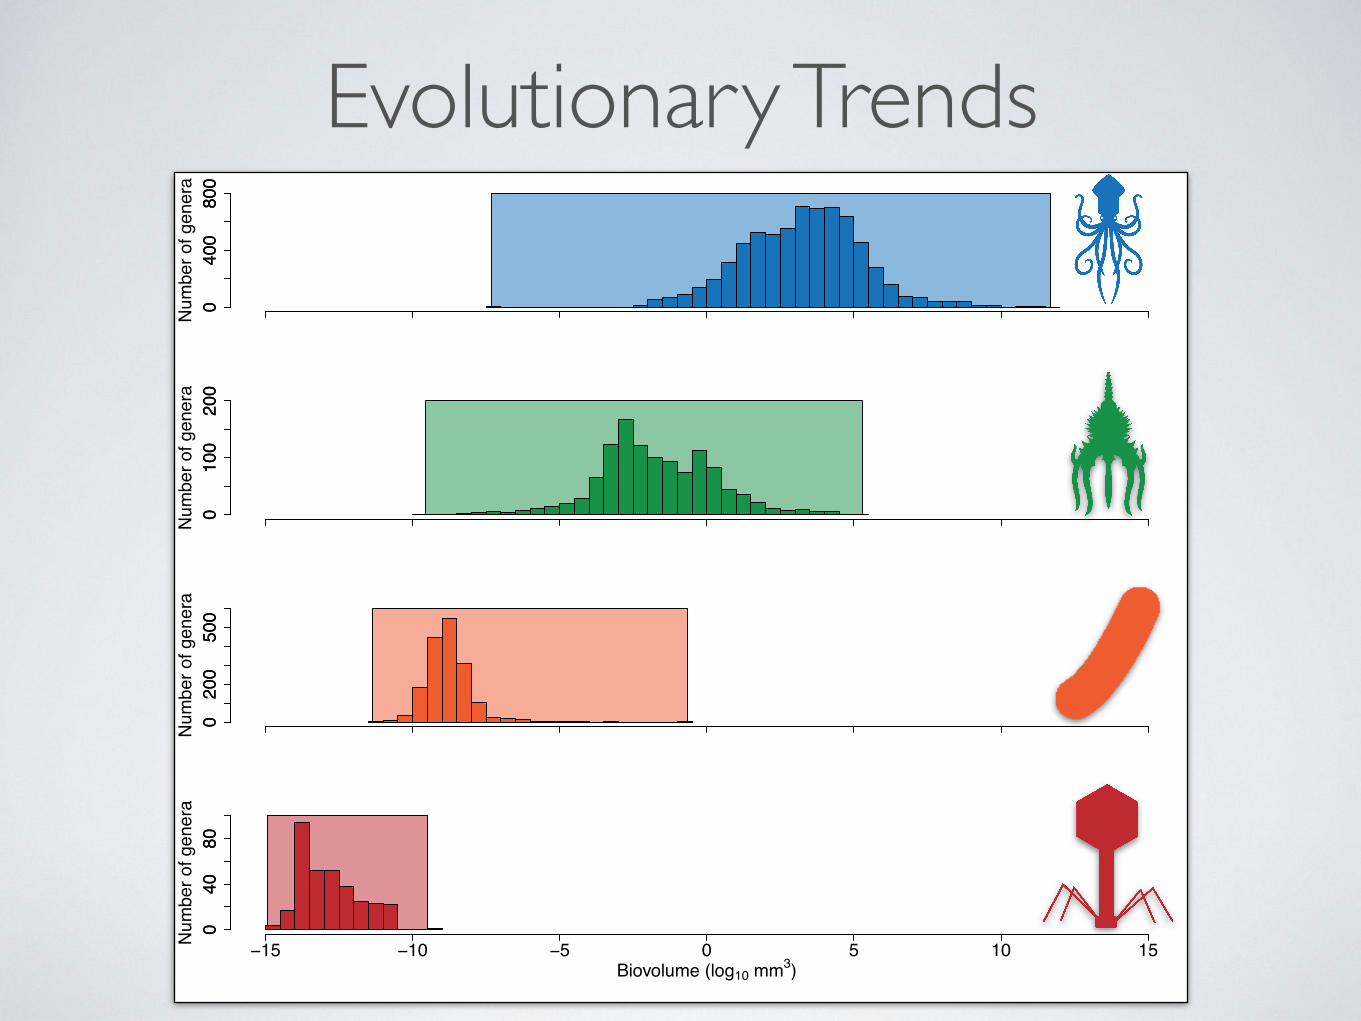
Evolutionary Trends0
400
800
Num
ber o
f gen
era
040
080
00
100
200
Num
ber o
f gen
era
010
020
00
200
500
Num
ber o
f gen
era
020
050
00
4080
Biovolume (log10 mm3)
Num
ber o
f gen
era
040
80
−15 −10 −5 0 5 10 15

Size Distributions
−15
−10
−50
510
log 1
0 bio
volu
me
(mm
3 )
virus prokaryote eukaryote animal
rangemidpointmean

Evolutionary Trends
McShea (1994)

Evolutionary Trends0
400
800
Num
ber o
f gen
era
040
080
00
100
200
Num
ber o
f gen
era
010
020
00
200
500
Num
ber o
f gen
era
020
050
00
4080
Biovolume (log10 mm3)
Num
ber o
f gen
era
040
80
−15 −10 −5 0 5 10 15

Take Home Points• The central tendency in size increases as structural
complexity increases
• The range of size increases with structural complexity, with the maximum size increasing more than minimum size
• Complexity limits maximum and mimumum size, but there may be a variety of evolutionary tempos and modes of size evolution within each level of structural complexity