HIE: clinical changes over time
14
HIE: clinical changes over time Daphna Yasova Barbeau, MD Neonatology Fellow, University of Florida
Transcript of HIE: clinical changes over time

HIE: clinical changes over time
Daphna Yasova Barbeau, MDNeonatology Fellow, University of Florida
1. Identify normal trends in laboratory values in neonates with HIE.
2. Define neonates who may need further evaluation for end-organ injury.
3. Associate blood gas findings with glucose values to determine etiology of hypoglycemia and hypocarbia.
Objectives:

0-6
7-12
13-1
8
19-2
4
25-4
8
49-7
272
+
0
1
2
3
4
Sarnat Scores over time
Time (hours)
responders
nonresponders
Score
0-6
7-12
13-1
8
19-2
4
25-4
8
49-7
272
+
0
1
2
3
4
Sarnat Scores over time
Time (hours)
responders
nonresponders
Score
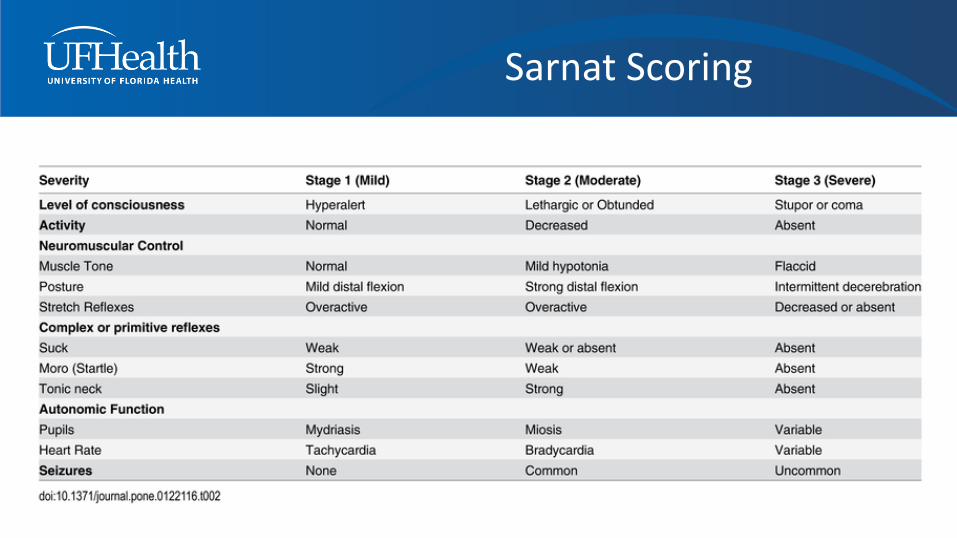
Sarnat Scoring
Sarnat Scoring

Markers of Cardiac Ischemia
resp
onders
nonresp
onders
0
2000
4000
6000
8000
10000
12000
Creatinine Kinase total
responders
nonresponders
CK (U/L)
resp
onders
nonresp
onders
0
100
200
300
CK-MB
responders
nonresponders
CK-MB (U/L)
resp
onders
nonresp
onders
0.0
0.5
1.0
1.5
2.0
Troponin I
responders
nonresponders
Troponin (ng/mL) (p= 0.008)

0-6
7-12
13-1
8
19-2
4
25-4
8
49-7
272
+
6.6
6.8
7.0
7.2
7.4
pH over time
Time (hours)
responders
nonresponders
pH
Acid Base Balance
0-6
7-12
13-1
8
19-2
4
25-4
8
49-7
272
+
0
20
40
60
80
100
CO2 over time
Time (hours)
responders
nonresponders
CO2 (mmHg)

Acid Base Balance
0-6
7-12
13-1
8
19-2
4
25-4
8
49-7
272
+
-5
0
5
10
15
20
25
lactate over time
Time (hours)
responders
nonresponders
Mmol/L
0-6
7-12
13-1
8
19-2
4
25-4
8
49-7
272
+
-30
-20
-10
0
10
Base deficit over time
Time (hours)
responders
nonresponders
BD mmol/L

CO2 and Glucose
0 50 1000
100
200
300
CO2 and glucose
CO2
responders
nonresponders
Glucose (mg/dl)

Renal function
0-6
7-12
19-2
4
25-4
8
49-7
272
+
0.0
0.5
1.0
1.5
CreatinineResponders vs Non Responders
Time (hours)
responders
nonresponders
Creatinine (mg/dL )
0.4

Renal Function
0-24
25-4
8
49-7
272
+
0
Fluid intakeResponders vs. Non Responders
Time (hours)
responders
nonresponders
40-60
60-80
80-100
>100
Fluid intake
(ml/kg/hr)
120
0-24
25-4
8
49-7
272
+
0
Urine outputResponders vs Non Responders
Time (hours)
responders
nonresponders
Urine output (ml/kg/hr)
<1 ml/kg/hr
1-4 ml/kg/hr
4-6 ml/kg/hr
>6 ml/kg/hr
(ml/kg/day)
Urine output (ml/kg/hr)

Aspartate Aminotransferase (AST)

Alanine Aminotransferase (ALT)
0-6
7-12
19-2
4
25-4
8
49-7
272
+
0
50
100
150
200
250
Alanine aminotransferase (ALT)
responders vs non responders
Time (hours)
responders
nonresponders
ALT (U/L)
• Currently no reliable marker of response.
• Infants that don’t follow the trend require further evaluation.
• Electrolyte derangements worsen outcomes.
Summary:

Thank you!Any questions?