Hickman et al 2010.pdf
12
A comparison of canopy evapotranspiration for maize and two perennial grasses identified as potential bioenergy crops GEORGE C. HICKMAN *, ANDY VANLOOCKE w , FRANK G. DOHLEMAN * and CARL J. BERNACCHI *z *Department of Plant Biology, University of Illinois, Urbana, IL, USA, wDepartment of Atmospheric Sciences, University of Illinois, Urbana, IL, USA, zGlobal Change and Photosynthesis Research Unit, Agricultural Research Service, USDA, Urbana, IL, USA Abstract In the Midwestern US, perennial rhizomatous grasses (PRGs) are considered one of the most promising vegetation types to be used as a cellulosic feedstock for renewable energy production. The potential widespread use of biomass crops for renewable energy production has sparked numerous environmental concerns, including the impacts of land-use change on the hydrologic cycle. We predicted that total seasonal evapotran- spiration (ET) would be higher for PRGs relative to maize resulting from higher leaf area and a prolonged growing season. We further predicted that, compared with maize, higher aboveground biomass associated with PRGs would offset the higher ET and increase water-use efficiency (WUE) in the context of biomass harvests for liquid biofuel production. To test these predictions, ET was estimated during the 2007 growing season for replicated plots of Miscanthus giganteus (miscanthus), Panicum virgatum (switch- grass), and Zea mays (maize) using a residual energy balance approach. The combination of a 25% higher mean latent heat flux (kET) and a longer growing season resulted in miscanthus having ca. 55% higher cumulative ET over the growing season compared with maize. Cumulative ET for switchgrass was also higher than maize despite similar seasonal-mean kET. Based on total harvested aboveground biomass, WUE was ca. 50% higher for maize relative to miscanthus; however, when WUE calculated from only maize grain biomass was compared with WUE calculated from miscanthus harvested above- ground biomass, this difference disappeared. Although WUE between maize and miscanthus differed postsenescence, there were no differences in incremental WUE throughout the growing season. Despite initial predictions, aboveground biomass for switchgrass was less than maize; thus WUE was substantially lower for switchgrass than for either maize scenario. These results indicate that changes in ET due to large-scale implementation of PRGs in the Midwestern US would likely influence local and regional hydrologic cycles differently than traditional row crops. Keywords: agriculture, biofuels, evapotranspiration, perennial rhizomatous grasses, water-use efficiency Received 12 March 2010 and accepted 1 May 2010 Introduction Growing population, rising fuel demand, and the link between fossil fuel emissions and global change have spurred interest in expanding bioenergy production to reduce fossil fuel demand and mitigate climate change (Sims et al., 2006; Tan et al., 2008). In the United States, corn ethanol has served as a first step towards reducing dependence on fossil fuels and meeting environmental goals. However, agricultural input demands (e.g. ferti- lizer, pesticides), relatively low production efficiency (Hamelinck et al., 2005), a perceived link between ethanol production and increased food prices (Msangi et al., 2006), and greenhouse gas emissions caused by indirect land-use change (Searchinger et al., 2008) have Correspondence: C. J. Bernacchi, 193 ERML, 1201 W. Gregory Drive, Urbana, IL 61801, USA, tel. 1 1 217 333 8048, e-mail: [email protected] GCB Bioenergy (2010), doi: 10.1111/j.1757-1707.2010.01050.x Published 2010 This article is a US Government work and is in the public domain in the USA 1
-
Upload
periclesufpb -
Category
Documents
-
view
28 -
download
1
Transcript of Hickman et al 2010.pdf

A comparison of canopy evapotranspiration for maizeand two perennial grasses identified as potentialbioenergy crops
G E O R G E C . H I C K M A N *, A N D Y VA N L O O C K E w , F R A N K G . D O H L E M A N * and
C A R L J . B E R N A C C H I *z*Department of Plant Biology, University of Illinois, Urbana, IL, USA, wDepartment of Atmospheric Sciences, University of Illinois,
Urbana, IL, USA, zGlobal Change and Photosynthesis Research Unit, Agricultural Research Service, USDA, Urbana, IL, USA
Abstract
In the Midwestern US, perennial rhizomatous grasses (PRGs) are considered one of the
most promising vegetation types to be used as a cellulosic feedstock for renewable
energy production. The potential widespread use of biomass crops for renewable energy
production has sparked numerous environmental concerns, including the impacts of
land-use change on the hydrologic cycle. We predicted that total seasonal evapotran-
spiration (ET) would be higher for PRGs relative to maize resulting from higher leaf area
and a prolonged growing season. We further predicted that, compared with maize, higher
aboveground biomass associated with PRGs would offset the higher ET and increase
water-use efficiency (WUE) in the context of biomass harvests for liquid biofuel
production. To test these predictions, ET was estimated during the 2007 growing season
for replicated plots of Miscanthus � giganteus (miscanthus), Panicum virgatum (switch-
grass), and Zea mays (maize) using a residual energy balance approach. The combination
of a 25% higher mean latent heat flux (kET) and a longer growing season resulted in
miscanthus having ca. 55% higher cumulative ETover the growing season compared with
maize. Cumulative ET for switchgrass was also higher than maize despite similar
seasonal-mean kET. Based on total harvested aboveground biomass, WUE was ca. 50%
higher for maize relative to miscanthus; however, when WUE calculated from only maize
grain biomass was compared with WUE calculated from miscanthus harvested above-
ground biomass, this difference disappeared. Although WUE between maize and
miscanthus differed postsenescence, there were no differences in incremental WUE
throughout the growing season. Despite initial predictions, aboveground biomass for
switchgrass was less than maize; thus WUE was substantially lower for switchgrass than
for either maize scenario. These results indicate that changes in ET due to large-scale
implementation of PRGs in the Midwestern US would likely influence local and regional
hydrologic cycles differently than traditional row crops.
Keywords: agriculture, biofuels, evapotranspiration, perennial rhizomatous grasses, water-use
efficiency
Received 12 March 2010 and accepted 1 May 2010
Introduction
Growing population, rising fuel demand, and the link
between fossil fuel emissions and global change have
spurred interest in expanding bioenergy production to
reduce fossil fuel demand and mitigate climate change
(Sims et al., 2006; Tan et al., 2008). In the United States,
corn ethanol has served as a first step towards reducing
dependence on fossil fuels and meeting environmental
goals. However, agricultural input demands (e.g. ferti-
lizer, pesticides), relatively low production efficiency
(Hamelinck et al., 2005), a perceived link between
ethanol production and increased food prices (Msangi
et al., 2006), and greenhouse gas emissions caused by
indirect land-use change (Searchinger et al., 2008) have
Correspondence: C. J. Bernacchi, 193 ERML, 1201 W. Gregory
Drive, Urbana, IL 61801, USA, tel. 1 1 217 333 8048, e-mail:
GCB Bioenergy (2010), doi: 10.1111/j.1757-1707.2010.01050.x
Published 2010This article is a US Government work and is in the public domain in the USA 1

imposed limits on the benefits of producing ethanol
from grain. Thus, development of a meaningful modern
bioenergy industry will necessitate a transition from
grain fermentation and the development of advanced
technology for the conversion of cellulose to fuel.
Advanced cellulosic fuel production technologies
are predicted to yield more fuel per unit land area
with fewer inputs and fewer environmental impacts
compared with grain-based ethanol production (Heaton
et al., 2004; Hamelinck et al., 2005; Farrell et al., 2006;
Sims et al., 2006). The perennial rhizomatous grasses
(PRGs) Panicum virgatum L. (switchgrass) and
Miscanthus X. giganteus (miscanthus) are two candidate
feedstocks currently being developed for use in bioe-
nergy production (Heaton et al., 2008; Sanderson &
Adler, 2008). These feedstocks have emerged as promis-
ing second generation bioenergy crops because they
possess many of the traits necessary for sustainable
biomass production (Lewandowski et al., 2003; Heaton
et al., 2004; Sanderson & Adler, 2008). Despite advan-
tages over traditional grain-based methods of produ-
cing liquid fuels, the development of a cellulosic fuels
industry would generate a large demand for biomass
that would in turn result in land-use changes
(McLaughlin & Walsh, 1999; Gurgel et al., 2007; De
Fraiture et al., 2008; Searchinger et al., 2008).
While large-scale planting of PRGs has the capacity
for increased fuel production, it also suggests that there
will be changes to these managed ecosystems, particu-
larly with regard to the hydrologic cycle (Stephens et al.,
2001; Hall, 2003; De Fraiture et al., 2008). The root
systems of perennials penetrate deep into the soil and
generally have access to deeper soil moisture than
annual crops (Neukirchen et al., 1999; Stephens et al.,
2001; Hall, 2003). Leaf area index (LAI) is higher for
PRGs relative to corn (Dohleman & Long, 2009), pro-
viding greater area for photosynthesis and transpira-
tion. These physiologically based differences between
PRGs and Zea mays (maize) are further accentuated by a
much longer growing season, differences in canopy
architecture, and increased residue accumulation in
the PRGs (Heaton et al., 2004; Dohleman & Long,
2009). Thus, it is critical to assess changes in evapotran-
spiration (ET), the combination of both ecosystem eva-
poration and transpiration, to assess the impacts of
bioenergy crop growth on local and regional hydrology.
Our primary research objective was to estimate dif-
ferences in water use among maize, miscanthus, and
switchgrass. We predicted that the physiological, mor-
phological, and phenological characteristics of PRGs
will result in more water used during the growing
season compared with maize. However, given the an-
ticipated higher productivity of the PRGs, we also
predicted that water-use efficiency (WUE) will be greater
for PRGs relative to maize. These predictions were
tested using micrometeorological measurements over
established stands of switchgrass, miscanthus, and
maize over one growing season in 2007. This experi-
ment provides the first ever side-by-side comparison of
ET among these three species over a complete growing
season.
Materials and methods
Site description
Three replicate plots each of miscanthus and P. virgatum
L. cv. Cave-in-Rock (switchgrass) were established in
the South Farms at the University of Illinois in 2004 and
2005 as described previously (Heaton et al., 2008; Dohle-
man & Long, 2009). Maize cv. 34H35 (Pioneer Hi-Bred
International, Johnston, Iowa, USA) was planted at
0.76 m row spacing on May 8, 2007 and emerged on
May 11, 2007. The same area had been planted with
soybean in 2006 and 168 kg [N] ha�1 was applied before
the planting of the maize crop, following typical agro-
nomic practices in this region of the Midwestern USA.
No fertilizer was applied to either maize or switchgrass
in 2006 or 2007. The plots measured ca. 30 m� 60 m
(0.2 ha) and consisted of mature homogenous plantings
of each species planted on a Flanagan–Drummer silty
clay loam (fine-silty, mixed, mesic Typic Endoaquolls).
The plots were planted in a randomized complete block
design (n53) and were surrounded on all sides by
production-scale plantings of maize.
Micrometeorology
Given the relatively small plot sizes, ET was best
estimated as the residual in the energy balance equation
(Huband & Monteith, 1986; Jackson et al., 1987; Triggs
et al., 2004):
lET ¼ Rn � G0 �H; ð1Þ
where l is the latent heat of vaporization (J kg�1), ET is
evapotranspiration (kg m�2 s�1), Rn is net radiation (W
m�2; positive downward), G0 is soil surface heat flux
(W m�2; positive downward), and H is sensible heat
flux (W m�2; positive upward).
The residual energy approach allows for estimation of
lET by assuming that the net of energy fluxes due to
photosynthesis, respiration, and heat storage within the
canopy are negligible (o1% of incoming radiation;
Meyers & Hollinger, 2004). Within each plot, observa-
tions were obtained via micrometeorological instru-
mentation wired to a datalogger (models CR10X or
CR3000, Campbell Scientific Inc., Logan, UT, USA).
The measurements of Rn, G0 and H, as described below,
2 G . C . H I C K M A N et al.
Published 2010This article is a US Government work and is in the public domain in the USA, GCB Bioenergy, doi: 10.1111/j.1757-1707.2010.01050.x

were made in 10-s intervals and averaged over 10-min
intervals throughout the growing season. Measure-
ments for analysis began before canopy closure, day
of year (DOY) 137 for PRGs and DOY 168 for maize and
collected continuously until senescence. Data loss from
instrument failure occurred but represented o15% of
total data points and, with only one exception, at least
one plot was operational for all species at any given
time period.
Net radiation (Rn)
Net radiation was measured using single-channel net
radiometers (model Q*6 or Q*7; Radiation and Energy
Balance Systems, Seattle, WA, USA) in each plot. Cor-
rections were made for wind speed using a mechanical
cup anemometer (model 12102D; R.M. Young Com-
pany, Traverse City, MI, USA) according to the manu-
facturer’s protocol. Net radiometers were positioned
4 m above the ground in the maize and miscanthus
plots and 2.5 m above the ground in the switchgrass
plots and remained at this height for the growing
season. Before the growing season, all net radiometers
were crosscalibrated against a factory calibrated model
Q*7 net radiometer that was not deployed into the field.
Conditions where dew or precipitation interfered with
data were excluded from the analysis. All net radio-
meters in the miscanthus plots were damaged during
the last week of measurements. Values for Rn from
switchgrass, which did not differ throughout the season
from miscanthus, were substituted for this 1-week time
period.
Soil heat flux (G0)
Soil heat flux (G0), is calculated as:
G0 ¼ G10 þ CDzDT
Dt
� �; ð2Þ
where G10 is the soil heat flux at 10 mm soil depth, C is
the volumetric heat capacity (MJ m�31C�1), and DT is
the change in temperature in time increment Dt over
soil depth Dz. One soil heat flux plate (model HFT-3;
Radiation and Energy Balance Systems) was located in
each plot, buried at a depth of 10 mm. Heat storage in
the 10 mm of soil above each heat flux plate was
obtained by placing a fine-wire thermocouple below
the soil surface and above each heat flux plate. Since
measurements of G0 were limited to one replicate per
plot and given the small size of the heat flux plates
(ca. 9 cm2) the measurement of this flux was less robust
than Rn and H. However, G0 has been shown to have
limited sensitivity on surface energy balance calcula-
tions (Kimball et al., 1994) particularly after canopy
closure; therefore better characterization of G0 through
larger numbers of subsamples would have minimal
impacts on calculated lET (Fig. 2).
Sensible heat flux (H)
Sensible heat flux (H) was determined using a modified
gradient flux method as:
H ¼ pacpTs � Ta
ra; ð3Þ
where pa is air density (kg m�3), cp the heat capacity of
air (J kg�11C�1), Ts and Ta the surface and air tem-
peratures ( 1C), and ra the aerodynamic resistance
(s m�1). Atmospheric resistance was modeled using
different equations based on the wind speed, atmo-
spheric stability, and canopy height (Jackson et al.,
1987; Kimball et al., 1994, 1999; Triggs et al., 2004).
Relative humidity was measured using a temperature
and humidity probe (Model HMP-45C, Campbell
Scientific Inc.) enclosed in an aspirated radiation
shield (Model 076B Motor Aspirated Shield, Met-
One Instruments Inc., Grants Pass, OR, USA) in a
single location in a miscanthus plot at a height of
4.25 m. Wind speed was measured using a mechanical
anemometer (Model 12102D 3-cup anemometer with
photochopper, R.M. Young Company) and air tem-
perature was measured using a thermistor (Model
107, Campbell Scientific Inc) with a custom aspirated
heat shield using PVC pipe, an axial fan, and alumi-
num tape. These sensors were situated at a fixed
height aboveground to ensure that heights were no
o1 m above the plant canopy at maximum height.
This corresponded to a measured height, which varied
among the plots, of between 2.25 and 2.35 m for
switchgrass, 4.25 and 4.75 m for miscanthus, and
4.25 m for corn. A temperature probe malfunction in
one of the miscanthus plots occurred around DOY 180,
thus the air temperature reading for this plot was set
equal to the closest miscanthus plots for the remainder
of the growing season. Surface temperatures were
measured using infrared radiometers (model IRR-P,
Apogee Instruments, Logan, UT, USA). These sensors
were mounted 4 m aboveground and positioned at 451
angles from horizontal facing south for all plots.
When wind speed (u) was o0.1 m s�1 during neutral
conditions, defined as |Ts�Ta|o0.1 1C, ra was set to a
value of 1720 s m�1 (Triggs et al., 2004). When u was
o0.1 m s�1 under nonneutral conditions, defined
as |Ts�Ta|40.1 1C, ra was calculated as (ASHRAE,
1972):
ra ¼pacp
1:52jTs � Taj1=3: ð4Þ
C O M PA R I S O N O F C A N O P Y E VA P O T R A N S P I R A T I O N 3
Published 2010This article is a US Government work and is in the public domain in the USA, GCB Bioenergy, doi: 10.1111/j.1757-1707.2010.01050.x
When u was higher than 0.1 m s�1 the following
equation was used:
ra ¼1
u
1
kln
z� dþ zo
zo
� �� �2
f; ð5Þ
where k is Von Karman’s constant (0.4), z is wind
measurement height (m), zo and d are the roughness
length (m; 0.1� canopy height) and zero plane displa-
cement (0.65� canopy height), respectively (Campbell
& Norman, 1998), and f is a stability correction. Height
data, measured in weekly intervals for each plot, were
fitted to an equation that best described the measured
heights throughout the growing season as in Bernacchi
et al. (2007). While zo and d are likely to differ among
species and growth stages, the values used in this paper
are based on those suggested for ‘uniform plant cano-
pies’ (Campbell & Norman, 1998) and are assumed
similar for all three species in this study as they are
planted uniformly and are all considered tall grasses.
A sensitivity analysis in which the values for zo and d
were changed to 0.08� canopy height and 0.8� canopy
height, respectively, resulted in less than a 1.5% change
in either H or ET (data not shown). For stable conditions
when the crop surface was cooler than air temperature,
defined as TsoTa, f was calculated as (Mahrt & Ek,
1984):
f ¼ ð1þ 15RiÞð1þ 5RiÞ0:5 ð6Þ
and for unstable conditions, Ts4Ta, as:
f ¼ 1� 15Ri
1þ Kð�RiÞ0:5
( )�1
; ð7Þ
where Ri is the Richardson number and is solved as
Ri ¼ gðTa � TsÞðz� dÞðTa þ 273:15Þu2
; ð8Þ
and K is solved as
K ¼ 75k2 ½ðz� dþ zoÞ=zo�0:5
fln½ðz� dþ zoÞ=zo�g2: ð9Þ
Under certain conditions, unreasonably high values
for H were calculated at night. Thus, conditions when
Rn was o10 W m�2 and ra was calculated as o10 s m�1,
the data were excluded from analysis.
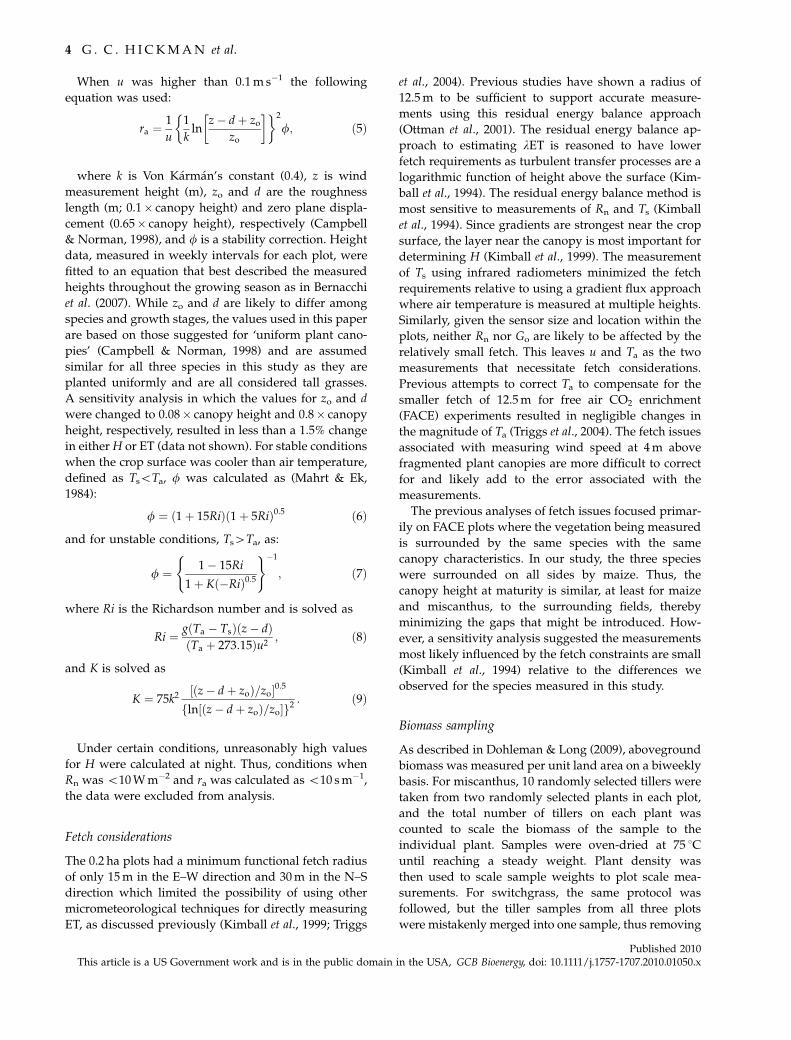
Fetch considerations
The 0.2 ha plots had a minimum functional fetch radius
of only 15 m in the E–W direction and 30 m in the N–S
direction which limited the possibility of using other
micrometeorological techniques for directly measuring
ET, as discussed previously (Kimball et al., 1999; Triggs
et al., 2004). Previous studies have shown a radius of
12.5 m to be sufficient to support accurate measure-
ments using this residual energy balance approach
(Ottman et al., 2001). The residual energy balance ap-
proach to estimating lET is reasoned to have lower
fetch requirements as turbulent transfer processes are a
logarithmic function of height above the surface (Kim-
ball et al., 1994). The residual energy balance method is
most sensitive to measurements of Rn and Ts (Kimball
et al., 1994). Since gradients are strongest near the crop
surface, the layer near the canopy is most important for
determining H (Kimball et al., 1999). The measurement
of Ts using infrared radiometers minimized the fetch
requirements relative to using a gradient flux approach
where air temperature is measured at multiple heights.
Similarly, given the sensor size and location within the
plots, neither Rn nor Go are likely to be affected by the
relatively small fetch. This leaves u and Ta as the two
measurements that necessitate fetch considerations.
Previous attempts to correct Ta to compensate for the
smaller fetch of 12.5 m for free air CO2 enrichment
(FACE) experiments resulted in negligible changes in
the magnitude of Ta (Triggs et al., 2004). The fetch issues
associated with measuring wind speed at 4 m above
fragmented plant canopies are more difficult to correct
for and likely add to the error associated with the
measurements.
The previous analyses of fetch issues focused primar-
ily on FACE plots where the vegetation being measured
is surrounded by the same species with the same
canopy characteristics. In our study, the three species
were surrounded on all sides by maize. Thus, the
canopy height at maturity is similar, at least for maize
and miscanthus, to the surrounding fields, thereby
minimizing the gaps that might be introduced. How-
ever, a sensitivity analysis suggested the measurements
most likely influenced by the fetch constraints are small
(Kimball et al., 1994) relative to the differences we
observed for the species measured in this study.
Biomass sampling
As described in Dohleman & Long (2009), aboveground
biomass was measured per unit land area on a biweekly
basis. For miscanthus, 10 randomly selected tillers were
taken from two randomly selected plants in each plot,
and the total number of tillers on each plant was
counted to scale the biomass of the sample to the
individual plant. Samples were oven-dried at 75 1C
until reaching a steady weight. Plant density was
then used to scale sample weights to plot scale mea-
surements. For switchgrass, the same protocol was
followed, but the tiller samples from all three plots
were mistakenly merged into one sample, thus removing
4 G . C . H I C K M A N et al.
Published 2010This article is a US Government work and is in the public domain in the USA, GCB Bioenergy, doi: 10.1111/j.1757-1707.2010.01050.x

the possibility to determine plot error. For maize, two
subsamples per plot were removed and dried as before
to determine dry sample mass. No samples of any
species were taken within 3 m of the edge of a plot to
avoid any border effects (Roberts et al., 1993). The last
subsamples used in our analysis corresponded to the
final day of micrometeorological measurements after
the canopies were completely senesced.
WUE
WUE was calculated from the total ET over the growing
season and the biomass harvest that corresponded to
the final day of micrometeorological measurements
which differed among the crops. The biomass compo-
nents that were used for the WUE calculations are based
on the biomass that was removed at harvest for the
purpose of energy production. Biomass that would not
be taken, including all belowground components, fallen
residue, and portions of the tillers that were left stand-
ing after harvest, were not included. For corn, WUE is
divided into two metrics; one similar to the PRGs where
all aboveground biomass is considered and a second in
which only the grain biomass is considered. The latter
scenario is used as the ‘current’ US ethanol production
scenario where all ethanol production is based on grain
fermentation.
Meteorology
For the purpose of describing the site meteorology, air
temperature, relative humidity, and precipitation were
collected from a weather station located in the center of
the research field. The Palmer Crop Moisture Index
(PCMI), calculated from temperature, precipitation,
and modeled soil water content, was used to estimate
short-term moisture conditions (Palmer, 1968). PCMI
values between �1 and 1 are indicative of normal
moisture conditions, with values o�1 suggesting more
droughted conditions, and 41 suggesting overly moist
conditions. The 30-year mean PCMI value for the region
containing this site is ca. 0.4 (e.g., Bernacchi et al., 2007).
Data analysis
Micrometeorological data were collected in 10-s inter-
vals and averaged over 10-min intervals throughout the
growing season. Data points associated with instrument
error or unfavorable meteorological conditions were
removed from the dataset. These conditions were de-
fined as periods when sensor accuracy was visibly
diminished and were mostly associated with periods
of heavy precipitation and occasionally with heavy dew
formation. The removal of these data points has little
effect on the estimation of ET, as evaporation rarely
occurs during precipitation, never occurs during dew,
and because these conditions influenced all three spe-
cies in unison. Means of the lET were calculated for
each species for the entire growing season to represent
the total growing season water demand. All three
species experienced a closed canopy from DOY 190–
235, and this time period was analyzed separately to
reflect the influences of physiological differences among
the species. Mean values of latent heat flux (lET) for the
respective time periods were summed and converted to
ET (mm) using the latent heat of vaporization and the
density of water. The difference in ET among species
was statistically tested using a randomized complete
block analysis of variance (PROC MIXED, GLM3 SAS
9.1, SAS Institute, Cary, NC, USA). Assumptions of
normal distribution were verified using Levene’s test
of equality of variance and a proc univariate analysis for
normality of data. Given the variability and low repli-
cate number inherent within large field experiments,
a5 0.10 was used in all cases to reduce the probability
of Type II error. A Tukey’s corrected a priori means
separation was used to determine significant differ-
ences between species.
A comparison of regressions technique was used to
test differences in accumulated biomass vs. accumu-
lated ET (Mead & Curnow, 1983). This technique re-
quires a polynomial that accurately reflects the
relationship between accumulated biomass vs. water
use. A second-order polynomial was shown to fit this
criteria and was fitted first to all three species together
and then to each species separately. The goodness-of-fit
for each separate curve was compared with the good-
ness-of-fit for one line representing all data. The type 3
sum of squares (i.e., error variances around each model)
and associated degrees of freedom for lumped vs.
separate fits were used to compute F-ratios associated
with tests of homogeneity of the fitted polynomials
(Mead & Curnow, 1983; Potvin et al., 1990). Significant
values for this test were set a priori at Po0.05.
Results
Meteorology/climatology
The 2007 growing season was slightly drier and warmer
than the 30-year average as calculated by the Midwest
Regional Climate Center (http://mrcc.sws.uiuc.edu/).
Temperatures were ca. 1 1C warmer than the 30-year
average for the year, and ca. 1.4 1C warmer during the
growing season (DOY 140–300). Annual and growing
season precipitation were ca. 21% and ca. 22% less than
the 30-year average, respectively. However, the PCMI
for Illinois Climate Division 5, which includes the fields
C O M PA R I S O N O F C A N O P Y E VA P O T R A N S P I R A T I O N 5
Published 2010This article is a US Government work and is in the public domain in the USA, GCB Bioenergy, doi: 10.1111/j.1757-1707.2010.01050.x
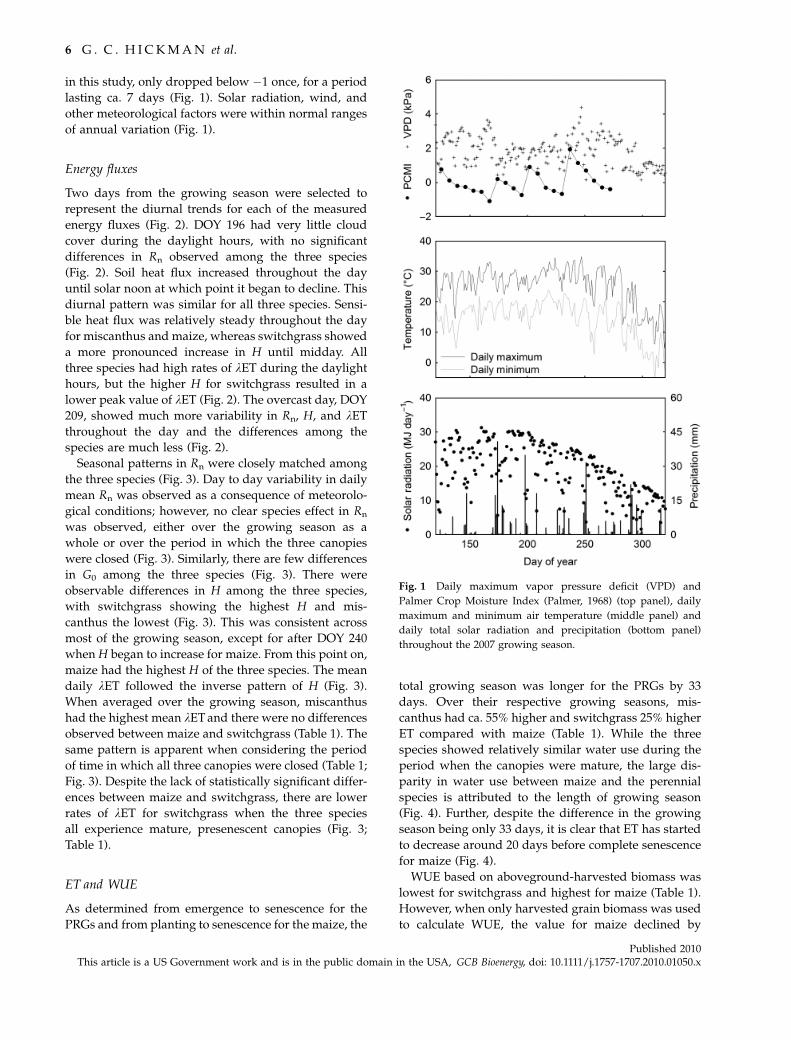
in this study, only dropped below �1 once, for a period
lasting ca. 7 days (Fig. 1). Solar radiation, wind, and
other meteorological factors were within normal ranges
of annual variation (Fig. 1).
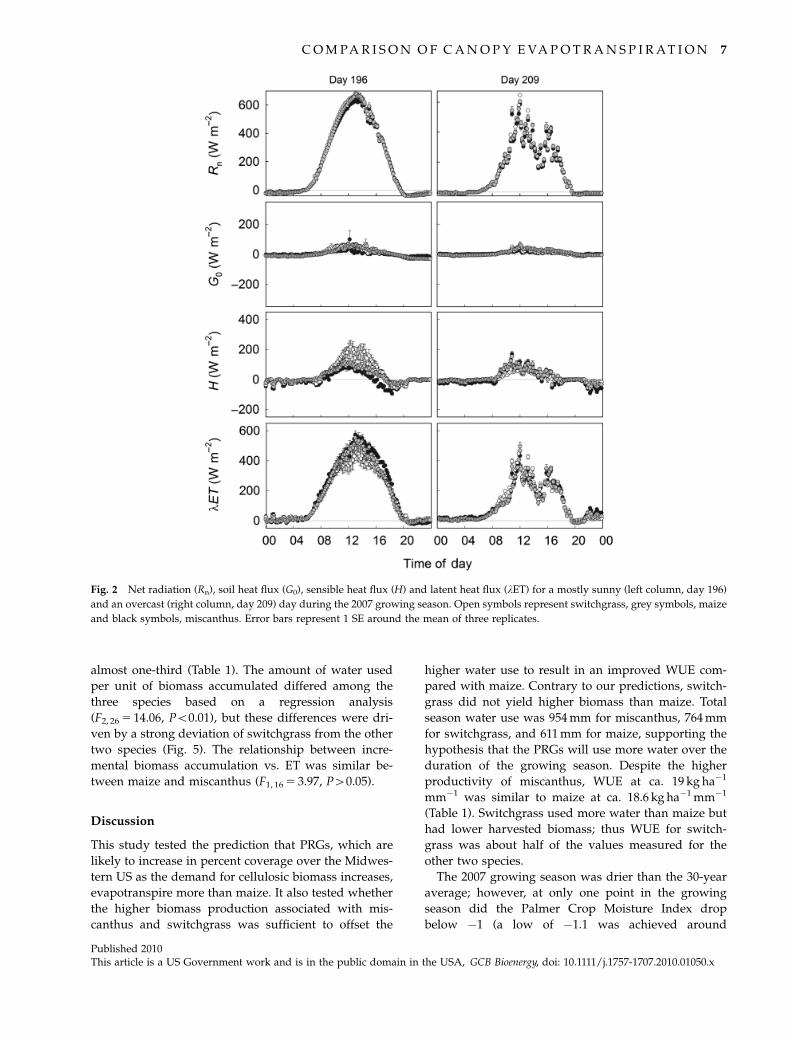
Energy fluxes
Two days from the growing season were selected to
represent the diurnal trends for each of the measured
energy fluxes (Fig. 2). DOY 196 had very little cloud
cover during the daylight hours, with no significant
differences in Rn observed among the three species
(Fig. 2). Soil heat flux increased throughout the day
until solar noon at which point it began to decline. This
diurnal pattern was similar for all three species. Sensi-
ble heat flux was relatively steady throughout the day
for miscanthus and maize, whereas switchgrass showed
a more pronounced increase in H until midday. All
three species had high rates of lET during the daylight
hours, but the higher H for switchgrass resulted in a
lower peak value of lET (Fig. 2). The overcast day, DOY
209, showed much more variability in Rn, H, and lET
throughout the day and the differences among the
species are much less (Fig. 2).
Seasonal patterns in Rn were closely matched among
the three species (Fig. 3). Day to day variability in daily
mean Rn was observed as a consequence of meteorolo-
gical conditions; however, no clear species effect in Rn
was observed, either over the growing season as a
whole or over the period in which the three canopies
were closed (Fig. 3). Similarly, there are few differences
in G0 among the three species (Fig. 3). There were
observable differences in H among the three species,
with switchgrass showing the highest H and mis-
canthus the lowest (Fig. 3). This was consistent across
most of the growing season, except for after DOY 240
when H began to increase for maize. From this point on,
maize had the highest H of the three species. The mean
daily lET followed the inverse pattern of H (Fig. 3).
When averaged over the growing season, miscanthus
had the highest mean lET and there were no differences
observed between maize and switchgrass (Table 1). The
same pattern is apparent when considering the period
of time in which all three canopies were closed (Table 1;
Fig. 3). Despite the lack of statistically significant differ-
ences between maize and switchgrass, there are lower
rates of lET for switchgrass when the three species
all experience mature, presenescent canopies (Fig. 3;
Table 1).
ET and WUE
As determined from emergence to senescence for the
PRGs and from planting to senescence for the maize, the
total growing season was longer for the PRGs by 33
days. Over their respective growing seasons, mis-
canthus had ca. 55% higher and switchgrass 25% higher
ET compared with maize (Table 1). While the three
species showed relatively similar water use during the
period when the canopies were mature, the large dis-
parity in water use between maize and the perennial
species is attributed to the length of growing season
(Fig. 4). Further, despite the difference in the growing
season being only 33 days, it is clear that ET has started
to decrease around 20 days before complete senescence
for maize (Fig. 4).
WUE based on aboveground-harvested biomass was
lowest for switchgrass and highest for maize (Table 1).
However, when only harvested grain biomass was used
to calculate WUE, the value for maize declined by
Fig. 1 Daily maximum vapor pressure deficit (VPD) and
Palmer Crop Moisture Index (Palmer, 1968) (top panel), daily
maximum and minimum air temperature (middle panel) and
daily total solar radiation and precipitation (bottom panel)
throughout the 2007 growing season.
6 G . C . H I C K M A N et al.
Published 2010This article is a US Government work and is in the public domain in the USA, GCB Bioenergy, doi: 10.1111/j.1757-1707.2010.01050.x
almost one-third (Table 1). The amount of water used
per unit of biomass accumulated differed among the
three species based on a regression analysis
(F2, 26 5 14.06, Po0.01), but these differences were dri-
ven by a strong deviation of switchgrass from the other
two species (Fig. 5). The relationship between incre-
mental biomass accumulation vs. ET was similar be-
tween maize and miscanthus (F1, 16 5 3.97, P40.05).
Discussion
This study tested the prediction that PRGs, which are
likely to increase in percent coverage over the Midwes-
tern US as the demand for cellulosic biomass increases,
evapotranspire more than maize. It also tested whether
the higher biomass production associated with mis-
canthus and switchgrass was sufficient to offset the
higher water use to result in an improved WUE com-
pared with maize. Contrary to our predictions, switch-
grass did not yield higher biomass than maize. Total
season water use was 954 mm for miscanthus, 764 mm
for switchgrass, and 611 mm for maize, supporting the
hypothesis that the PRGs will use more water over the
duration of the growing season. Despite the higher
productivity of miscanthus, WUE at ca. 19 kg ha�1
mm�1 was similar to maize at ca. 18.6 kg ha�1 mm�1
(Table 1). Switchgrass used more water than maize but
had lower harvested biomass; thus WUE for switch-
grass was about half of the values measured for the
other two species.
The 2007 growing season was drier than the 30-year
average; however, at only one point in the growing
season did the Palmer Crop Moisture Index drop
below �1 (a low of �1.1 was achieved around
Fig. 2 Net radiation (Rn), soil heat flux (G0), sensible heat flux (H) and latent heat flux (lET) for a mostly sunny (left column, day 196)
and an overcast (right column, day 209) day during the 2007 growing season. Open symbols represent switchgrass, grey symbols, maize
and black symbols, miscanthus. Error bars represent 1 SE around the mean of three replicates.
C O M PA R I S O N O F C A N O P Y E VA P O T R A N S P I R A T I O N 7
Published 2010This article is a US Government work and is in the public domain in the USA, GCB Bioenergy, doi: 10.1111/j.1757-1707.2010.01050.x
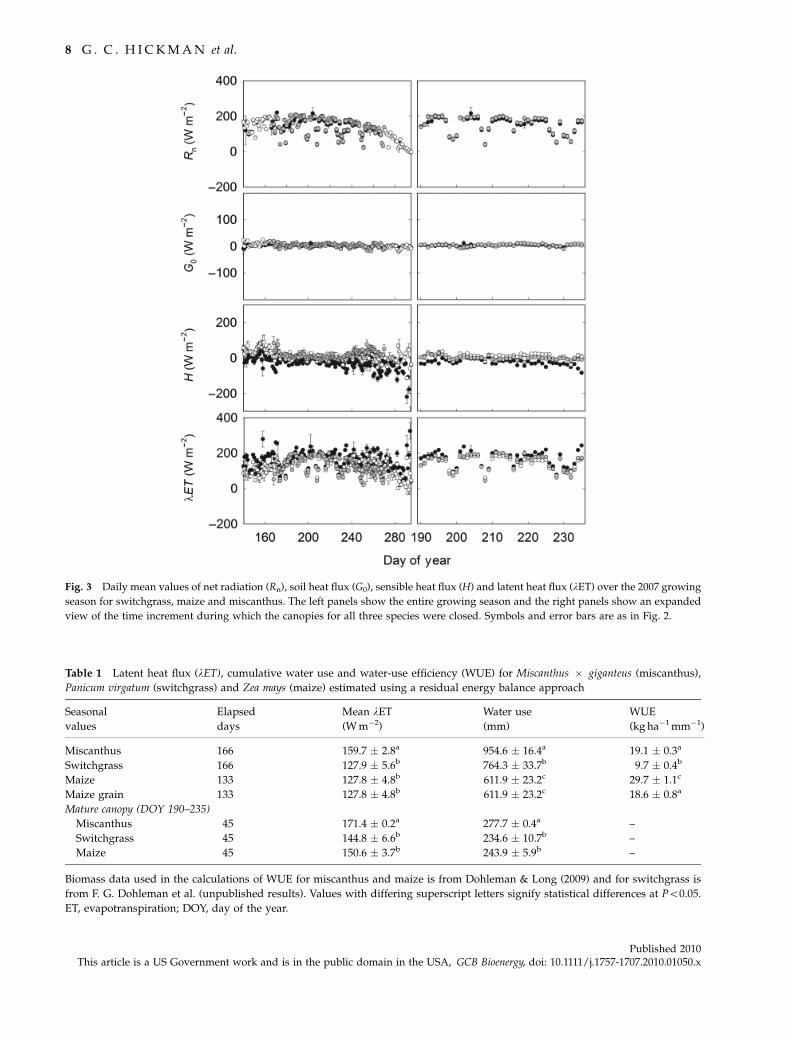
Fig. 3 Daily mean values of net radiation (Rn), soil heat flux (G0), sensible heat flux (H) and latent heat flux (lET) over the 2007 growing
season for switchgrass, maize and miscanthus. The left panels show the entire growing season and the right panels show an expanded
view of the time increment during which the canopies for all three species were closed. Symbols and error bars are as in Fig. 2.
Table 1 Latent heat flux (lET), cumulative water use and water-use efficiency (WUE) for Miscanthus � giganteus (miscanthus),
Panicum virgatum (switchgrass) and Zea mays (maize) estimated using a residual energy balance approach
Seasonal
values
Elapsed
days
Mean lET
(W m�2)
Water use
(mm)
WUE
(kg ha�1 mm�1)
Miscanthus 166 159.7 � 2.8a 954.6 � 16.4a 19.1 � 0.3a
Switchgrass 166 127.9 � 5.6b 764.3 � 33.7b 9.7 � 0.4b
Maize 133 127.8 � 4.8b 611.9 � 23.2c 29.7 � 1.1c
Maize grain 133 127.8 � 4.8b 611.9 � 23.2c 18.6 � 0.8a
Mature canopy (DOY 190–235)
Miscanthus 45 171.4 � 0.2a 277.7 � 0.4a –
Switchgrass 45 144.8 � 6.6b 234.6 � 10.7b –
Maize 45 150.6 � 3.7b 243.9 � 5.9b –
Biomass data used in the calculations of WUE for miscanthus and maize is from Dohleman & Long (2009) and for switchgrass is
from F. G. Dohleman et al. (unpublished results). Values with differing superscript letters signify statistical differences at Po0.05.
ET, evapotranspiration; DOY, day of the year.
8 G . C . H I C K M A N et al.
Published 2010This article is a US Government work and is in the public domain in the USA, GCB Bioenergy, doi: 10.1111/j.1757-1707.2010.01050.x
mid-June) signifying ‘abnormally dry’ conditions (Fig. 1).
Throughout the rest of the growing season PCMI values
fell within the ‘Slightly Dry/Favorably Moist’ category.
Thus, although this season was slightly drier than
normal, there is no indication of drought conditions or
plant stress e.g., low yields or low harvest percentages
(Dohleman & Long, 2009).
The perennial nature of miscanthus and switchgrass
results in a longer growing season and more opportu-
nity to evapotranspire relative to maize. Mean lET was
25% higher for miscanthus relative to maize and
dropped to only about 18% higher than maize when
considering the time period when both canopies were
closed (Table 1). Thus, for miscanthus, there is not only
the effect of a longer growing season, but also physio-
logical or morphological factors that drive increased ET.
In contrast, switchgrass mean seasonal and mean ‘ma-
ture canopy’ lET was not statistically different from
maize (Table 1). Given the small difference in mean lET,
the higher ET for switchgrass relative to maize is likely
dominated by the longer growing season (Fig. 4). These
results suggest that a combination of physiological and
morphological factors, in addition to growing season
length, drive the observed differences among the spe-
cies. Potential morphological differences include mean
root mass and distribution (Neukirchen et al., 1999), LAI
and aboveground biomass (Heaton et al., 2008; Dohle-
man & Long, 2009). Differences among the species in
stomatal conductance, which is shown to be closely
coupled to canopy water use (e.g., Bernacchi et al.,
2007), could also drive the differences in lET.
During the times when the PRGs are evapotranspir-
ing and the maize field is fallow some evaporation in
maize will occur. While this component of ET was not
considered here, rates of evaporation outside of the
growing season are shown to be quite small relative to
what occurs during the growing season. For example, a
recent study shows that ca. 80% of the annual ET in a
maize/soybean ecosystem occurs during the three to
four month growing season (Suyker & Verma, 2009).
The remaining 20% is evapotranspired during the re-
maining months, which, when considering the differ-
ence in growing season lengths between the PRGs and
maize, amounts to a very small percentage. Measure-
ments of lET over the fallow maize field were not
measured in this study. However, when the growing
season for maize was extrapolated to the same length as
the perennial grasses, the total amount of ET for maize
increased to 763 mm, similar to the amount of water
evapotranspired from switchgrass. It is unlikely, how-
ever, that the evaporation from a fallow maize field
could account for the large differences observed be-
tween maize and miscanthus.
When assessed over the entire growing season and
using total aboveground biomass, WUE was lowest for
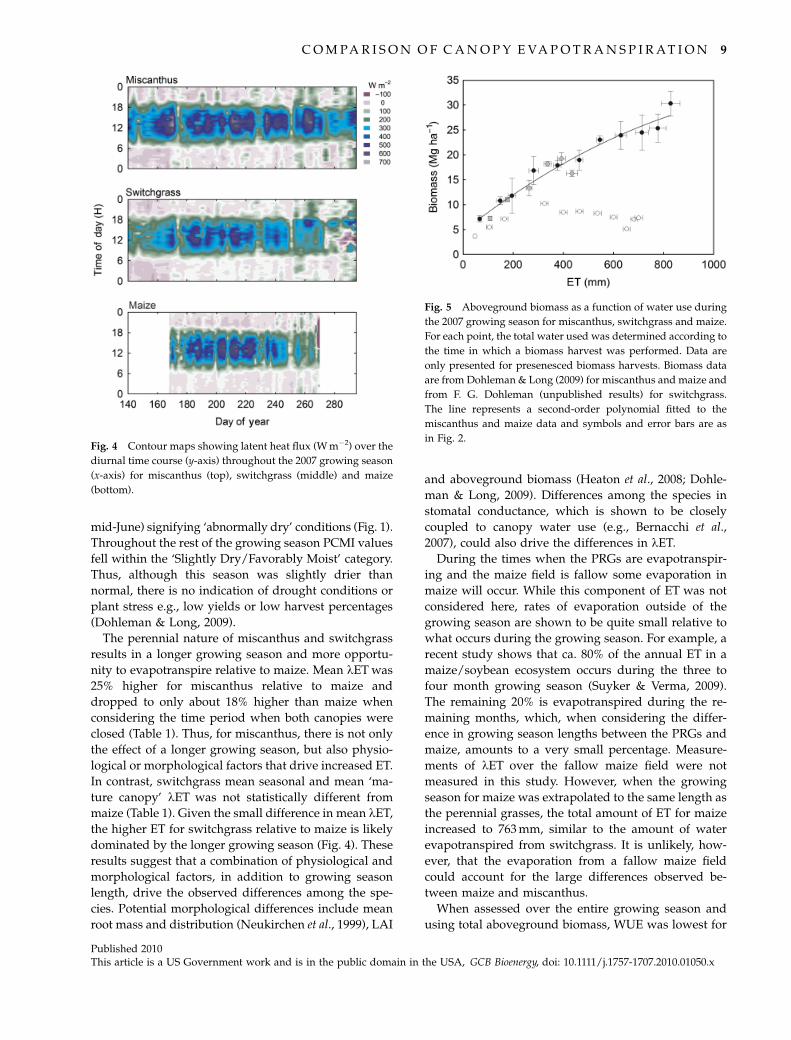
Fig. 4 Contour maps showing latent heat flux (W m�2) over the
diurnal time course (y-axis) throughout the 2007 growing season
(x-axis) for miscanthus (top), switchgrass (middle) and maize
(bottom).
Fig. 5 Aboveground biomass as a function of water use during
the 2007 growing season for miscanthus, switchgrass and maize.
For each point, the total water used was determined according to
the time in which a biomass harvest was performed. Data are
only presented for presenesced biomass harvests. Biomass data
are from Dohleman & Long (2009) for miscanthus and maize and
from F. G. Dohleman (unpublished results) for switchgrass.
The line represents a second-order polynomial fitted to the
miscanthus and maize data and symbols and error bars are as
in Fig. 2.
C O M PA R I S O N O F C A N O P Y E VA P O T R A N S P I R A T I O N 9
Published 2010This article is a US Government work and is in the public domain in the USA, GCB Bioenergy, doi: 10.1111/j.1757-1707.2010.01050.x

switchgrass and highest for maize. The difference in
WUE between maize and miscanthus is minimized
when, instead of using the total aboveground biomass,
only the grain component of maize is used in calculat-
ing WUE (Table 1). Since residue removal is known to
have negative implications for sustainability of maize
(Mann et al., 2002; Andrews, 2006; Blanco-Canqui & Lal,
2009), there exists a trade-off between maximizing
biomass harvest to increase WUE and agricultural
sustainability. Since the purpose of these ecosystems
are for the sustainable production of feedstock for
renewable energy production, the corn-grain WUE sce-
narios is a more relevant comparison with the perennial
species. The relationship between biomass accumula-
tion and ET was similar between miscanthus and maize
(Fig. 5), but why does the end of season WUE between
these species differ (Table 1)? This disparity can be
partially explained through losses in aboveground bio-
mass for both species after senescence, but to a greater
extent for miscanthus (Dohleman & Long, 2009). The
loss in standing biomass immediately following senes-
cence for miscanthus appears to be exceptional in this
measurement season (Clifton-Brown et al., 2001; Heaton
et al., 2008; Dohleman & Long, 2009). Similarly, the loss
in aboveground biomass for maize suggested a harvest
index of 0.66, which is much higher than typically
measured (e.g., Tollenaar et al., 2006). Therefore, these
results may underestimate the total seasonal WUE for
both miscanthus and maize.
The values for WUE calculated from total season ET
and corn grain biomass correspond well with the range
of values reported by a number of previous studies
conducted within several management practices and
climate regimes (Hatfield et al., 2001; Zwart & Bastiaans-
sen, 2004; Suyker & Verma, 2009). Mean WUE averaged
over the globe was estimated at 18 � 6.9 kg ha�1 mm�1
(Zwart & Bastiaanssen, 2004) which is remarkably
similar to the value obtained in this study (18.6 kg ha�1
mm�1). Similarly, a study conducted in Nebraska, USA
calculated WUE as 20 kg ha�1 mm�1 (Suyker & Verma,
2009).
The differences among these three species’ water use
revealed valuable insights to the potential environmen-
tal impacts of second-generation bioenergy crop
growth. Given the demonstrated increases in ET asso-
ciated with the growth of second-generation bioenergy
crops both temporally and quantitatively, we can expect
changes in the environmental services tied to the hydro-
logical cycle (Stohlgren et al., 1998; Brown et al., 2005; Li
et al., 2007). Our study demonstrated increased seasonal
ET associated with the growth of second-generation
bioenergy crops driven by a combination of physiolo-
gical, morphological, and phenological differences
among these three species. Therefore, potential large-
scale plantings of bioenergy crops could increase ET,
thereby decreasing surface temperatures (Georgescu
et al., 2009), increasing humidity, increasing precipita-
tion and cloud cover, and decreasing solar radiation
(Sellers et al., 1997; Bounoua et al., 2002; Findell et al.,
2007). Increased ET associated with PRGs could also
impact runoff and groundwater quality/quantity, soil
moisture, and river flow (Stohlgren et al., 1998; Brown
et al., 2005; Li et al., 2007). The primary impacts of
altered ET (e.g. soil moisture) would also affect second-
ary changes, such as rates of carbon sequestration or
soil respiration (Pastor & Post, 1986; Ma et al., 2000), and
soil nitrogen budgets (Pastor & Post, 1986). Depending
on the fraction coverage of PRGs grown in a region, the
important link between vegetation and hydrology
should be a major consideration in sustainable biomass
production.
Acknowledgements
The authors wish to thank Don Ort, David Drag, Marcelo Zeri,Ursula Melissa Ruiz Vera, Christina Burke, Sarah Campbell, andGreg McIsaac for helpful comments on the manuscript. We alsowish to acknowledge Devin Quarles for assisting with the fieldmeasurements. This research was supported by the EnergyBiosciences Institute.
References
American Society of Heating, Refrigerating, and Air-Condition-
ing Engineers (ASHRAE) (1972) ASHRAE Handbook of Funda-
mentals. ASHRAE, New York, NY, USA.
Andrews SS (2006) Crop Residue Removal for Biomass Energy
Production: Effects on Soils and Recommendations pp. 1–15.
USDA-Natural Resource Conservation Service, Washington,
DC, USA.
Bernacchi CJ, Kimball BA, Quarles DR, Long SP, Ort DR (2007)
Decreases in stomatal conductance of soybean under open-air
elevation of CO2 are closely coupled with decreases in ecosys-
tem evapotranspiration. Plant Physiology, 143, 134–144.
Blanco-Canqui H, Lal R (2009) Crop residue removal impacts on
soil productivity and environmental quality. Critical Reviews in
Plant Sciences, 28, 139–163.
Bounoua L, Defries R, Collatz GJ, Sellers P, Khan H (2002) Effects
of land cover conversion on surface climate. Climatic Change,
52, 29–64.
Brown AE, Zhang L, McMahon TA, Western AW, Vertessy RA
(2005) A review of paired catchment studies for determining
changes in water yield resulting from alterations in vegetation.
Journal of Hydrology, 310, 28–61.
Campbell GS, Norman JM (1998) An Introduction to Environmental
Biophysics, 2nd edn. Springer-Verlag, New York.
Clifton-Brown JC, Lewandowski I, Andersson V et al. (2001)
Performance of 15 Miscanthus genotypes at five sites in
Europe. Agronomy Journal, 93, 1013–1019.
10 G . C . H I C K M A N et al.
Published 2010This article is a US Government work and is in the public domain in the USA, GCB Bioenergy, doi: 10.1111/j.1757-1707.2010.01050.x

De Fraiture C, Giordano M, Liao Y (2008) Biofuels and implica-
tions for agricultural water use: blue impacts of green energy.
Water Policy, 10, 67–81.
Dohleman FG, Long SP (2009) More productive than maize in
the Midwest: how does miscanthus do it? Plant Physiology, 150,
2104–2115.
Farrell AE, Plevin RJ, Turner BT, Jones AD, O’Hare M, Kammen
DM (2006) Ethanol can contribute to energy and environmen-
tal goals. Science, 311, 506–508.
Findell KL, Shevliakova E, Milly PCD, Stouffer RJ (2007) Mod-
eled impact of anthropogenic land cover change on climate.
American Meteorological Society, 20, 3621–3634.
Georgescu M, Lobell DB, Field CB (2009) Potential impact of U.S.
biofuels on regional climate. Geophysical Research Letters, 36
L21806.
Gurgel A, Reilly JM, Paltsev S (2007) Potential land use implica-
tions of a global biofuels industry. Journal of Agricultural and
Food Industrial Organization, 5, 1–34.
Hall RL (2003) Grasses for Energy Production. Hydrological Guide-
lines, pp. 1–15. Department of Trade and Industry, New and
Renewable Energy Programme – Centre for Ecology and
Hydrology, London, UK.
Hamelinck CN, Hooijdonk Gv, Faaij AP (2005) Ethanol from ligno-
cellulosic biomass: techno-economic performance in short-,
middle- and long-term. Biomass and Bioenergy, 28, 384–410.
Hatfield JL, Sauer TJ, Prueger J (2001) Managing soils to achieve
greater water use efficiency: a review. Agronomy Journal, 93,
271–280.
Heaton EA, Dohleman FG, Long SP (2008) Meeting US biofuel
goals with less land: the potential of Miscanthus. Global Change
Biology, 14, 2000–2014.
Heaton EA, Long SP, Voigt TB, Jones MB, Clifton-Brown J (2004)
Miscanthus for renewable energy generation: European Union
experience and projections for Illinois. Mitigation and Adapta-
tion Strategies for Global Change, 9, 433–451.
Huband NDS, Monteith JL (1986) Radiative surface temperature
and energy balance of a wheat canopy. Boundary-Layer Meteor-
ology, 36, 1–17.Jackson RD, Moran MS, Gay LW, Raymond LH (1987) Evaluating
evaporation from field crops using airborne radiometry
and ground-based meteorological data. Irrigation Science, 8,
81–90.Kimball BA, LaMorte RL, Pinter PJ Jr et al. (1999) Free-air CO2
enrichment and soil nitrogen effects on energy balance and
evapotranspiration of wheat. Water Resources Research, 124,
1179–1190.
Kimball BA, LaMorte RL, Seay RS et al. (1994) Effects of free-air
CO2 enrichment on energy balance and evapotranspiration of
cotton. Agricultural and Forest Meteorology, 70, 259–278.Lewandowski I, Scurlock JMO, Lindvall E, Christou M (2003)
The development and current status of perennial rhizomatous
grasses as energy crops in the US and Europe. Biomass and
Bioenergy, 25, 335–361.
Li KY, Coe MT, Ramankutty N, Jong RD (2007) Modeling the
hydrological impact of land-use change in West Africa. Journal
of Hydrology, 337, 258–268.
Ma Z, Wood CW, Bransby DI (2000) Soil management impacts
on soil carbon sequestration by switchgrass. Biomass and
Bioenergy, 18, 469–477.
Mahrt L, Ek M (1984) The influence of atmospheric stability on
potential evaporation. Journal of Climate and Applied Meteorol-
ogy, 23, 222–234.
Mann L, Tolbert V, Cushman J (2002) Potential environmental
effects of corn (Zea mays L.) stover removal with emphasis on
soil organic matter and erosion. Agriculture, Ecosystems and
Environment, 89, 149–166.
McLaughlin SB, Walsh ME (1999) Evaluating environmental
consequences of producing herbaceous crops for bioenergy.
Biomass and Bioenergy, 14, 317–324.
Mead R, Curnow RN (1983) Statistical Methods in Agriculture and
Experimental Biology. Chapman & Hall, London.
Meyers TP, Hollinger SE (2004) An assessment of storage terms
in the surface energy balance of maize and soybean. Agricul-
tural and Forest Meteorology, 125, 105–115.
Midwest Regional Climate Center (MRCC) (2009) Climate of the
Midwest. Available at: http://mrcc.isws.illinois.edu (accessed
12 October 2008).
Msangi S, Sulser T, Rosegrant M, ValmonteSantos R, Ringleri C
(2006) Global Scenarios for Biofuels: Impacts and Implications, pp.
1–16. International Food Policy Research Institute (IFPRI)
Washington, DC, USA.
Neukirchen D, Himken M, Lammel J, Czypionka-Krause U, Olfs
H-W (1999) Spatial and temporal distribution of the root
system and root nutrient content of an established Miscanthus
crop. European Journal of Agronomy, 11, 301–309.
Ottman MJ, Kimball BA, Pinter PJ et al. (2001) Elevated CO2
increases sorghum biomass under drought conditions. New
Phytologist, 150, 261–273.
Palmer WC (1968) Keeping track of crop moisture conditions,
nationwide: the new Crop Moisture Index. Weatherwise, 21,
156–161.Pastor J, Post WM (1986) Influence of climate, soil moisture, and
succession on forest carbon and nitrogen cycles. Biogeochem-
istry, 2, 3–27.
Potvin C, Lechowicz MJ, Tardif S (1990) The statistical analysis of
ecophysiological response curves obtained from experiments
involving repeated measures. Ecology, 71, 1389–1400.
Roberts MJ, Long SP, Tieszen LL, Beadle CL (1993) Measurement
of plant biomass and net primary production of herbaceous
vegetation. In: Photosynthesis and Production in a Changing
Environment: A Field and Laboratory Manual (eds Hall DO,
Scurlock JMO, Bolhar-Nordenkampf HR, Leegood RC, Long
SP), pp. 1–21. Chapman & Hall, London.
Sanderson MA, Adler PR (2008) Perennial forages as second
generation bioenergy crops. International Journal of Molecular
Sciences, 9, 768–788.
Searchinger T, Heimlich R, Houghton RA et al. (2008) Use of US
croplands for biofuels increases greenhouse gases through
emissions from land-use change. Science, 319, 1238–1240.Sellers PJ, Dickinson RE, Randall DA et al. (1997) Modeling the
exchanges of energy, water, and carbon between continents
and the atmosphere. Science, 275, 502–509.
Sims RE, Hastings A, Schlamadinger B (2006) Energy crops:
current status and future prospects. Global Change Biology, 12,
2054–2056.Stephens W, Hess T, Knox JW (2001) Review of the Effects of Energy
Crops on Hydrology. Institute of Water and Environment, Cran-
field University, Silsoe.
C O M PA R I S O N O F C A N O P Y E VA P O T R A N S P I R AT I O N 11
Published 2010This article is a US Government work and is in the public domain in the USA, GCB Bioenergy, doi: 10.1111/j.1757-1707.2010.01050.x

Stohlgren TJ, Chase TN, Pielke RAS, Kittel TGF, Baron JS (1998)
Evidence that local land use practices influence regional
climate, vegetation, and stream flow patterns in adjacent
natural areas. Global Change Biology, 4, 495–504.
Suyker AE, Verma SB (2009) Evapotranspiration of irrigated and
rain-fed maize-soybean cropping systems. Agricultural and
Forest Meteorology, 149, 443–452.
Tan KT, Lee KT, Mohamed AR (2008) Role of energy policy in
renewable energy accomplishment: the case of second-genera-
tion bioethanol. Energy Policy, 36, 3360–3365.
Tollenaar M, Deen W, Echarte L, Liu W (2006) Effect of crowding
stress on dry matter accumulation and harvest index in maize.
Agronomy Journal, 98, 930–937.
Triggs JM, Kimball BA, Pinter PJ Jr et al. (2004) Free-air CO2
enrichment effects on the energy balance and evapotrans-
piration of sorghum. Agricultural and Forest Meteorology, 124,
63–79.
Zwart SJ, Bastiaanssen WGM (2004) Review of measured crop
water productivity values for irrigated wheat, rice, cotton and
maize. Agricultural Water Management, 69, 115–133.
12 G . C . H I C K M A N et al.
Published 2010This article is a US Government work and is in the public domain in the USA, GCB Bioenergy, doi: 10.1111/j.1757-1707.2010.01050.x