HHE Report No. HETA-2016-0012-3302, Evaluation of ...Health Hazard Evaluation Report 2016-0012-3302...
69
Page 1 Health Hazard Evaluation Report 2016-0012-3302 Evaluation of exposures and respiratory health at a coffee roasting and packaging facility. Report No. 2016-0012-3302 January 2018 Marcia L. Stanton, BS Stephen B. Martin, Jr., PhD, PE Randall J. Nett, MD, MPH U.S. Department of Health and Human Services Centers for Disease Control and Prevention National Institute for Occupational Safety and Health
Transcript of HHE Report No. HETA-2016-0012-3302, Evaluation of ...Health Hazard Evaluation Report 2016-0012-3302...

Page 1Health Hazard Evaluation Report 2016-0012-3302
Evaluation of exposures and respiratory health at a coffee roasting and packaging facility.
Report No. 2016-0012-3302January 2018
Marcia L. Stanton, BSStephen B. Martin, Jr., PhD, PE
Randall J. Nett, MD, MPH
U.S. Department of Health and Human ServicesCenters for Disease Control and PreventionNational Institute for Occupational Safety and Health

Page 2 Health Hazard Evaluation Report 2016-0012-3302
ContentsHighlights ...............................................i
Abbreviations .......................................v
Summary .............................................. 1
Introduction ......................................... 2
Background .......................................... 2
Process Description ............................. 6
Methods ............................................... 9
Results ................................................ 16
Discussion .......................................... 25
Conclusions ........................................ 32
Recommendations............................. 32
Appendix A: Tables ............................ 37
References .......................................... 50
Acknowledgements ........................... 60
The employer is required to post a copy of this report for 30 days at or near the workplace(s) of affected employees. The employer must take steps to ensure that the posted report is not altered, defaced, or covered by other material.
The cover photo is a close-up image of sorbent tubes, which are used by the HHEProgram to measure airborne exposures. This photo is an artistic representation that maynot be related to this Health Hazard Evaluation.
Page iHealth Hazard Evaluation Report 2016-0012-3302
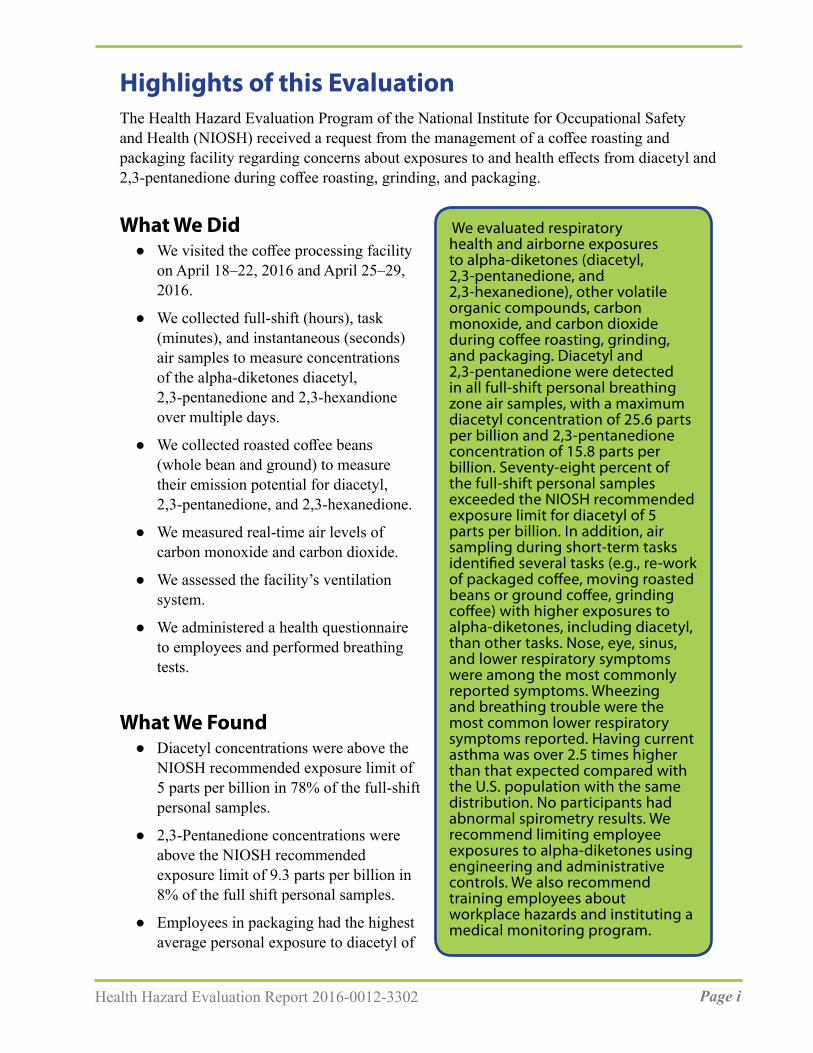
We evaluated respiratory health and airborne exposures to alpha-diketones (diacetyl, 2,3-pentanedione, and 2,3-hexanedione), other volatile organic compounds, carbon monoxide, and carbon dioxide during coffee roasting, grinding, and packaging. Diacetyl and 2,3-pentanedione were detected in all full-shift personal breathing zone air samples, with a maximum diacetyl concentration of 25.6 parts per billion and 2,3-pentanedione concentration of 15.8 parts per billion. Seventy-eight percent of the full-shift personal samples exceeded the NIOSH recommended exposure limit for diacetyl of 5 parts per billion. In addition, air sampling during short-term tasks identified several tasks (e.g., re-work of packaged coffee, moving roasted beans or ground coffee, grinding coffee) with higher exposures to alpha-diketones, including diacetyl, than other tasks. Nose, eye, sinus, and lower respiratory symptoms were among the most commonly reported symptoms. Wheezing and breathing trouble were the most common lower respiratory symptoms reported. Having current asthma was over 2.5 times higher than that expected compared with the U.S. population with the same distribution. No participants had abnormal spirometry results. We recommend limiting employee exposures to alpha-diketones using engineering and administrative controls. We also recommend training employees about workplace hazards and instituting a medical monitoring program.
Highlights of this EvaluationThe Health Hazard Evaluation Program of the National Institute for Occupational Safety and Health (NIOSH) received a request from the management of a coffee roasting and packaging facility regarding concerns about exposures to and health effects from diacetyl and 2,3-pentanedione during coffee roasting, grinding, and packaging.
What We Did ● We visited the coffee processing facility
on April 18–22, 2016 and April 25–29, 2016.
● We collected full-shift (hours), task (minutes), and instantaneous (seconds) air samples to measure concentrations of the alpha-diketones diacetyl, 2,3-pentanedione and 2,3-hexandione over multiple days.
● We collected roasted coffee beans (whole bean and ground) to measure their emission potential for diacetyl, 2,3-pentanedione, and 2,3-hexanedione.
● We measured real-time air levels of carbon monoxide and carbon dioxide.
● We assessed the facility’s ventilation system.
● We administered a health questionnaire to employees and performed breathing tests.
What We Found ● Diacetyl concentrations were above the
NIOSH recommended exposure limit of 5 parts per billion in 78% of the full-shift personal samples.
● 2,3-Pentanedione concentrations were above the NIOSH recommended exposure limit of 9.3 parts per billion in 8% of the full shift personal samples.
● Employees in packaging had the highest average personal exposure to diacetyl of
Page ii Health Hazard Evaluation Report 2016-0012-3302
13.2 parts per billion, with a maximum concentration of 25.6 parts per billion.
● The highest full-shift area samples were collected in grinding (diacetyl of 68.9 parts per billion and 2,3-pentanedione of 31.4 parts per billion). The roasting area had the second highest levels of diacetyl (37.8 parts per billion) and 2,3-pentanedione (23.0 parts per billion).
● Levels of diacetyl and 2,3-pentanedione in the air during short-term sampling were higher for tasks involving re-work of packaged coffee, moving roasted whole bean or ground coffee, and grinding coffee.
● There were opportunities for air from the production room to enter the office areas.
● Nose and eye symptoms were the most commonly reported symptoms.
● Wheezing and breathing trouble were the most commonly reported lower respiratory symptoms; nearly two times as many employees reported wheezing as expected.
● Approximately 2.5 times as many employees reported having current asthma as expected.
● None of the 75 participants tested had abnormal spirometry results.
● Six of 78 participants had elevated exhaled nitric oxide, a marker of allergic airways inflammation.
What the Employer Can Do ● Ensure employees understand potential hazards (e.g., diacetyl, 2,3-pentanedione,
carbon monoxide, carbon dioxide, green and roasted coffee dust) in the workplace and how to protect themselves.
● Limit the amount of time non-production employees spend in the production area.
● Keep all doors between the production and non-production areas closed at all times.
● Work with a ventilation engineer to ensure the production area is maintained under negative pressure compared with non-production spaces.
● Isolate or relocate the main grinder.
● Install local exhaust ventilation at the point sources with the highest concentrations of alpha-diketones.
● Conduct follow-up air sampling to verify the modifications have been effective in reducing exposures to below the recommended exposure limits. If modifications have not been effective, continue to work with a ventilation engineer to improve local exhaust and general ventilation to reduce exposures below recommended exposure limits. Also, until exposures are controlled, provide respiratory protection to be used during tasks with elevated exposures.
● Make N95 disposable filtering facepiece respirators available for voluntary use for protection against dust exposure such as when emptying burlap bags of green beans into the storage silos feed hopper, cleaning the exhaust system of chaff, emptying the
Page iiiHealth Hazard Evaluation Report 2016-0012-3302
chaff containers, or cleaning the green bean storage area.
● Encourage employees to report new or ongoing respiratory symptoms to their personal healthcare providers and to a designated individual at the workplace.
● Institute a medical monitoring program for employees who work in the production area and in quality control.
What Employees Can Do ● Once local exhaust ventilation is installed, use it as instructed by your employer.
● As much as possible, avoid placing your head directly near sources of roasted or ground coffee beans, such as supersacks.
● Some employees might wish to use N95 disposable filtering facepiece respirators for some tasks, such as when emptying burlap bags of green beans into the storage silos feed hopper, cleaning the chaff out of the roaster exhaust system, emptying the chaff containers, or cleaning the green bean storage area.
● Participate in any personal air sampling offered by your employer.
● Report new or ongoing respiratory symptoms to your personal healthcare provider and a designated individual at your workplace.
● Participate in your employer’s medical monitoring program as instructed by your employer.

Page iv Health Hazard Evaluation Report 2016-0012-3302
This page left intentionally blank
Page vHealth Hazard Evaluation Report 2016-0012-3302
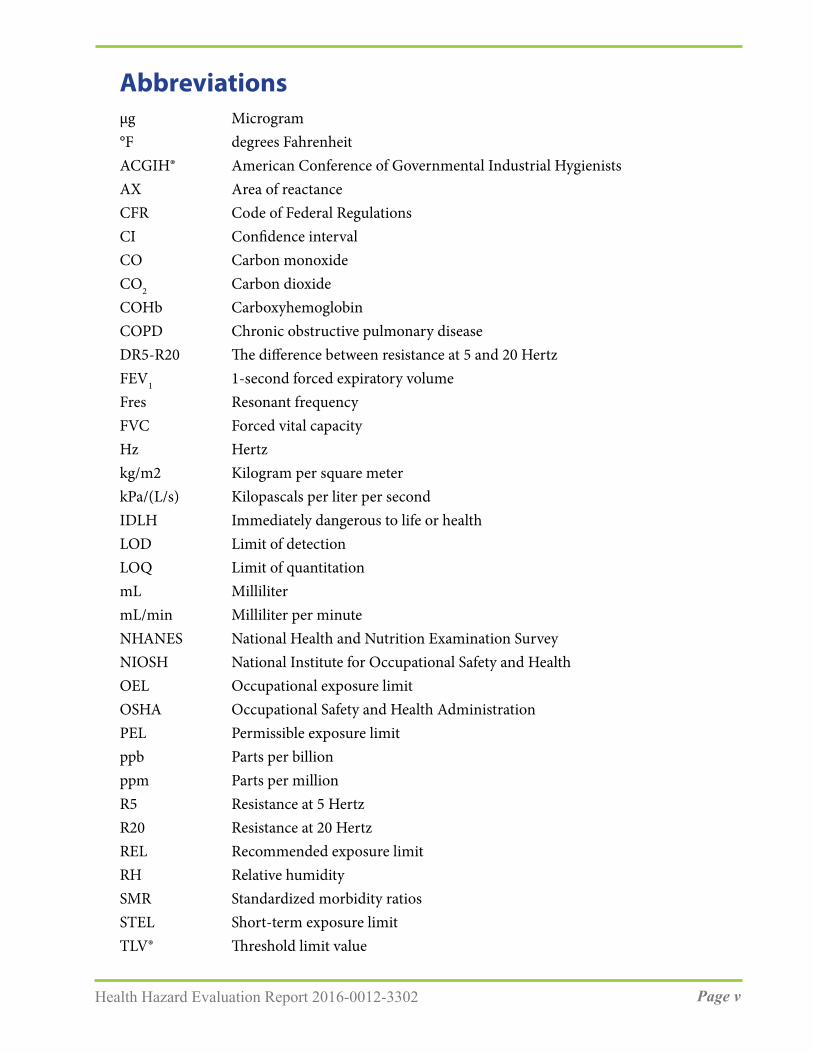
Abbreviationsµg Microgram°F degrees FahrenheitACGIH® American Conference of Governmental Industrial HygienistsAX Area of reactanceCFR Code of Federal RegulationsCI Confidence intervalCO Carbon monoxideCO2 Carbon dioxideCOHb CarboxyhemoglobinCOPD Chronic obstructive pulmonary diseaseDR5-R20 The difference between resistance at 5 and 20 HertzFEV1 1-second forced expiratory volumeFres Resonant frequencyFVC Forced vital capacityHz Hertzkg/m2 Kilogram per square meterkPa/(L/s) Kilopascals per liter per secondIDLH Immediately dangerous to life or healthLOD Limit of detectionLOQ Limit of quantitationmL MillilitermL/min Milliliter per minuteNHANES National Health and Nutrition Examination SurveyNIOSH National Institute for Occupational Safety and HealthOEL Occupational exposure limitOSHA Occupational Safety and Health AdministrationPEL Permissible exposure limitppb Parts per billionppm Parts per millionR5 Resistance at 5 HertzR20 Resistance at 20 HertzREL Recommended exposure limitRH Relative humiditySMR Standardized morbidity ratios STEL Short-term exposure limitTLV® Threshold limit value
Page vi Health Hazard Evaluation Report 2016-0012-3302
TVOC Total volatile organic compoundTWA Time-weighted averageUS United StatesVOC Volatile organic compoundX5 Reactance at 5 Hertz

Page 1Health Hazard Evaluation Report 2016-0012-3302
SummaryIn October 2015, the National Institute for Occupational Safety and Health’s Health Hazard Evaluation Program received a request from the management of a coffee roasting and packaging facility with 94 employees. The request stated concerns about exposures to and health effects from diacetyl and 2,3-pentanedione during coffee roasting, grinding, and packaging. In April 2016, we conducted a ventilation assessment of the production and office areas, industrial hygiene survey, and medical survey at the facility. The industrial hygiene survey consisted of collecting personal breathing zone and area air samples for alpha-diketones (i.e., diacetyl, 2,3-pentanedione, and 2,3-hexanedione). We used continuous monitoring instruments to measure total volatile organic compounds, carbon monoxide, carbon dioxide, temperature, and relative humidity in specific areas and during tasks. We also measured levels of carbon monoxide in employees’ exhaled breath. The medical survey consisted of a health questionnaire and breathing tests.
Sixty-nine of the 88 full-shift personal samples collected exceeded the NIOSH recommended exposure limit for diacetyl of 5 parts per billion, with a maximum concentration of 25.6 parts per billion. We identified jobs where some work tasks resulted in relatively higher air concentrations of diacetyl than other tasks. Specifically, rework of packaged coffee, moving roasted beans or ground coffee, grinding coffee beans, and packaging coffee were associated with higher diacetyl levels.
Overall, the most commonly reported symptoms were nose and eye symptoms. Some production employees reported their nose and sinus symptoms were caused or aggravated by green coffee dust or chaff, roasted coffee dust, or ground coffee dust. Wheezing or whistling in the chest was the most commonly reported lower respiratory symptom, and was nearly two times higher than that expected compared with the U.S. population of the same age, race/ethnicity, sex, and cigarette smoking distribution. No participants had abnormal spirometry tests. We recommend installing local exhaust ventilation at the point sources with the highest concentrations of alpha-diketones. In addition to local exhaust ventilation, we recommend isolating or re-locating the main grinder. We also recommend a medical monitoring program to identify any employees who might be developing work-related lung disease (e.g., asthma, obliterative bronchiolitis) and to help management prioritize interventions to prevent occupational lung disease.

Page 2 Health Hazard Evaluation Report 2016-0012-3302
IntroductionIn October 2015, the National Institute for Occupational Safety and Health (NIOSH) received a management request for a health hazard evaluation at a coffee roasting and packaging facility regarding potential worker exposure to diacetyl and 2,3-pentanedione during coffee processing. In April 2016, we conducted an industrial hygiene survey, ventilation assessment, and medical survey. We collected area and personal breathing zone air samples for volatile organic compounds (VOCs), including diacetyl, 2,3-pentanedione, and 2,3-hexanedione. We also monitored carbon monoxide (CO), carbon dioxide (CO2), and total VOCs.
BackgroundDiacetyl and 2,3-Pentanedione Diacetyl (2,3-butanedione) and 2,3-pentanedione (acetyl propionyl) are VOCs known as alpha-diketones that are added as ingredients in food flavorings used in some food products such as microwave popcorn, bakery mixes, and flavored coffee [Day et al. 2011; Kanwal et al. 2006; Bailey et al. 2015]. Diacetyl, 2,3-pentanedione, other VOCs, and gases such as CO and CO2 are naturally produced and released during the coffee roasting process [Duling et al. 2016; Raffel and Thompson 2013; Daglia et al. 2007; Nishimura et al. 2003; Newton 2002]. Grinding roasted coffee beans produces a greater surface area for off-gassing (sometimes called degassing) of these compounds [Akiyama et al. 2003]. Often, coffee roasting facilities package newly roasted coffee in permeable bags or in bags fitted with one-way valves to allow the coffee to off-gas after it is packaged. Sometimes, newly roasted coffee is placed in bins or containers and allowed to off-gas before packaging.
NIOSH has recommended exposure limits (RELs) for diacetyl and 2,3-pentanedione in workplace air (Table 1) [NIOSH 2016]. The NIOSH objective in establishing RELs for diacetyl and 2,3-pentanedione was to reduce the risk of respiratory impairment (decreased lung function) and the severe irreversible lung disease obliterative bronchiolitis associated with occupational exposure to these chemicals. The NIOSH RELs are intended to protect workers exposed to diacetyl or 2,3-pentanedione for a 45-year working lifetime. The REL for diacetyl is based on a quantitative risk assessment which necessarily contains assumptions and some uncertainty. Analytical limitations current at the time were taken into consideration in setting the REL for 2,3-pentanedione. The RELs should be used as a guideline to indicate when steps should be taken to reduce exposures in the workplace.
These exposure limits and the accompanying recommendations for control of exposures were derived from a risk assessment of flavoring-exposed workers. At an exposure equal to the diacetyl REL, the risk of adverse health effects is low. NIOSH estimated that less than 1 in 1,000 workers exposed to diacetyl levels of 5 parts per billion (ppb) as a time-weighted average (TWA) for 8 hours a day, 40 hours a week for a 45-year working lifetime would develop reduced lung function (defined as forced expiratory volume in one second [FEV1] below the 5th percentile) as a result of that exposure. NIOSH predicted that around 1 in 10,000 workers exposed to diacetyl at 5 ppb for a 45-year working lifetime would
Page 3Health Hazard Evaluation Report 2016-0012-3302
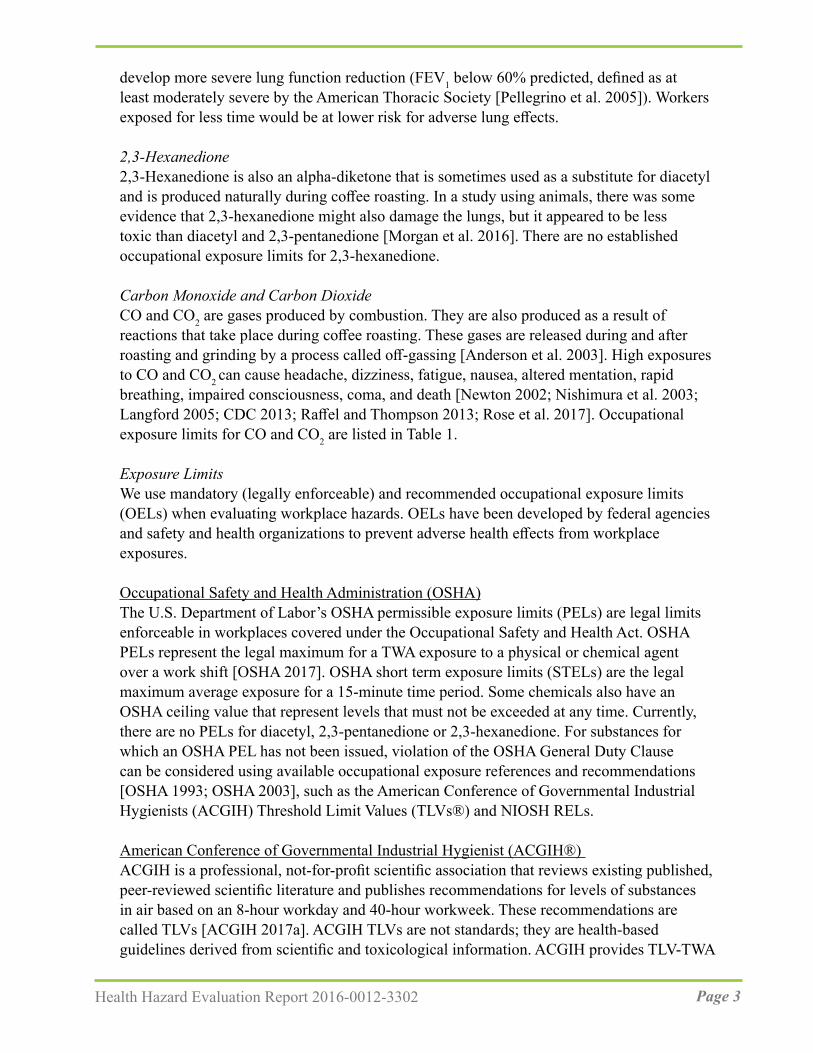
develop more severe lung function reduction (FEV1 below 60% predicted, defined as at least moderately severe by the American Thoracic Society [Pellegrino et al. 2005]). Workers exposed for less time would be at lower risk for adverse lung effects.
2,3-Hexanedione2,3-Hexanedione is also an alpha-diketone that is sometimes used as a substitute for diacetyl and is produced naturally during coffee roasting. In a study using animals, there was some evidence that 2,3-hexanedione might also damage the lungs, but it appeared to be less toxic than diacetyl and 2,3-pentanedione [Morgan et al. 2016]. There are no established occupational exposure limits for 2,3-hexanedione.
Carbon Monoxide and Carbon DioxideCO and CO2 are gases produced by combustion. They are also produced as a result of reactions that take place during coffee roasting. These gases are released during and after roasting and grinding by a process called off-gassing [Anderson et al. 2003]. High exposures to CO and CO2 can cause headache, dizziness, fatigue, nausea, altered mentation, rapid breathing, impaired consciousness, coma, and death [Newton 2002; Nishimura et al. 2003; Langford 2005; CDC 2013; Raffel and Thompson 2013; Rose et al. 2017]. Occupational exposure limits for CO and CO2 are listed in Table 1.
Exposure LimitsWe use mandatory (legally enforceable) and recommended occupational exposure limits (OELs) when evaluating workplace hazards. OELs have been developed by federal agencies and safety and health organizations to prevent adverse health effects from workplace exposures.
Occupational Safety and Health Administration (OSHA)The U.S. Department of Labor’s OSHA permissible exposure limits (PELs) are legal limits enforceable in workplaces covered under the Occupational Safety and Health Act. OSHA PELs represent the legal maximum for a TWA exposure to a physical or chemical agent over a work shift [OSHA 2017]. OSHA short term exposure limits (STELs) are the legal maximum average exposure for a 15-minute time period. Some chemicals also have an OSHA ceiling value that represent levels that must not be exceeded at any time. Currently, there are no PELs for diacetyl, 2,3-pentanedione or 2,3-hexanedione. For substances for which an OSHA PEL has not been issued, violation of the OSHA General Duty Clause can be considered using available occupational exposure references and recommendations [OSHA 1993; OSHA 2003], such as the American Conference of Governmental Industrial Hygienists (ACGIH) Threshold Limit Values (TLVs®) and NIOSH RELs.
American Conference of Governmental Industrial Hygienist (ACGIH®) ACGIH is a professional, not-for-profit scientific association that reviews existing published, peer-reviewed scientific literature and publishes recommendations for levels of substances in air based on an 8-hour workday and 40-hour workweek. These recommendations are called TLVs [ACGIH 2017a]. ACGIH TLVs are not standards; they are health-based guidelines derived from scientific and toxicological information. ACGIH provides TLV-TWA

Page 4 Health Hazard Evaluation Report 2016-0012-3302
guidelines that are levels that should not be exceeded during any 8-hour workday of a 40-hour workweek. ACGIH also provides TLV-STEL guidelines which are 15-minute exposure levels that should not be exceeded during a workday. Exposures above the TLV-TWA but less than the TLV-STEL should be (1) less than 15 minutes, (2) occur no more than four times a day, and (3) be at least 60 minutes between exposures [ACGIH 2017a]. Additionally, ACGIH provides TLV-Ceiling values which are levels that should not be exceeded at any time during a work shift. The ACGIH TLV-TWA for diacetyl is 10 ppb. The TLV-STEL for diacetyl is 20 ppb. Currently, there is no TLV-TWA or TLV-STEL for 2,3-pentanedione. ACGIH has placed 2,3-pentanedione on the 2017 list of Chemical Substances and Other Issues Under Study [ACGIH 2017b].
National Institute for Occupational Safety and Health (NIOSH)NIOSH provides RELs as TWA concentrations that should not be exceeded over an 8 or 10-hour work shift, during a 40-hour workweek [NIOSH 2010]. RELs are intended to be protective over a 45-year working lifetime. NIOSH also provides STELs which are 15-minute TWA exposures that should not be exceeded at any time during a workday [NIOSH 2010]. Some chemicals have ceiling values which are concentrations that should not be exceeded at any time [NIOSH 2010]. For some chemicals, NIOSH has Immediately Dangerous to Life or Health (IDLH) values. An IDLH value is a concentration of an air contaminant that can cause death or immediate or delayed permanent adverse health effects, or prevent escape from such an environment. Currently, NIOSH has RELs and STELs for diacetyl and 2,3-pentanedione. NIOSH does not have a REL or a STEL for 2,3-hexanedione. NIOSH does not have ceiling limits or IDLH values for diacetyl, 2,3-pentanedione, or 2,3-hexanedione.
For diacetyl and 2,3-pentanedione, the NIOSH RELs are 5.0 ppb and 9.3 ppb, respectively, as a TWA for up to an 8-hour workday during a 40-hour workweek (Table 1). The NIOSH STELs are 25 ppb for diacetyl and 31 ppb for 2,3-pentanedione [NIOSH 2016]. The NIOSH exposure standards do not differentiate between natural and synthetic chemical origin of diacetyl or 2,3-pentanedione. Although the NIOSH exposure limit for 2,3-pentanedione is above that of diacetyl, 2,3-pentanedione has been shown to be as hazardous as diacetyl [Hubbs et al. 2012; Morgan et al. 2012]. The hazard potential probably increases when these chemicals occur in combination with each other; having exposure to chemicals with the same functional alpha-diketone group and effect on the same system or organ (e.g., lungs) can result in additive effects [ACGIH 2017a]. The NIOSH REL is higher for 2,3-pentanedione than for diacetyl largely because analytic measures were not available in a validated OSHA method to detect 2,3-pentanedione at lower levels. In addition to the REL, NIOSH also recommends an action level for diacetyl of 2.6 ppb to be used with exposure monitoring in an effort to ensure employee exposures are routinely below the diacetyl REL. When exposures exceed the action level, employers should take corrective action (i.e., determine the source of exposure, identify methods for controlling exposure) to ensure that exposures are maintained below the NIOSH REL for diacetyl [NIOSH 2016].
Page 5Health Hazard Evaluation Report 2016-0012-3302
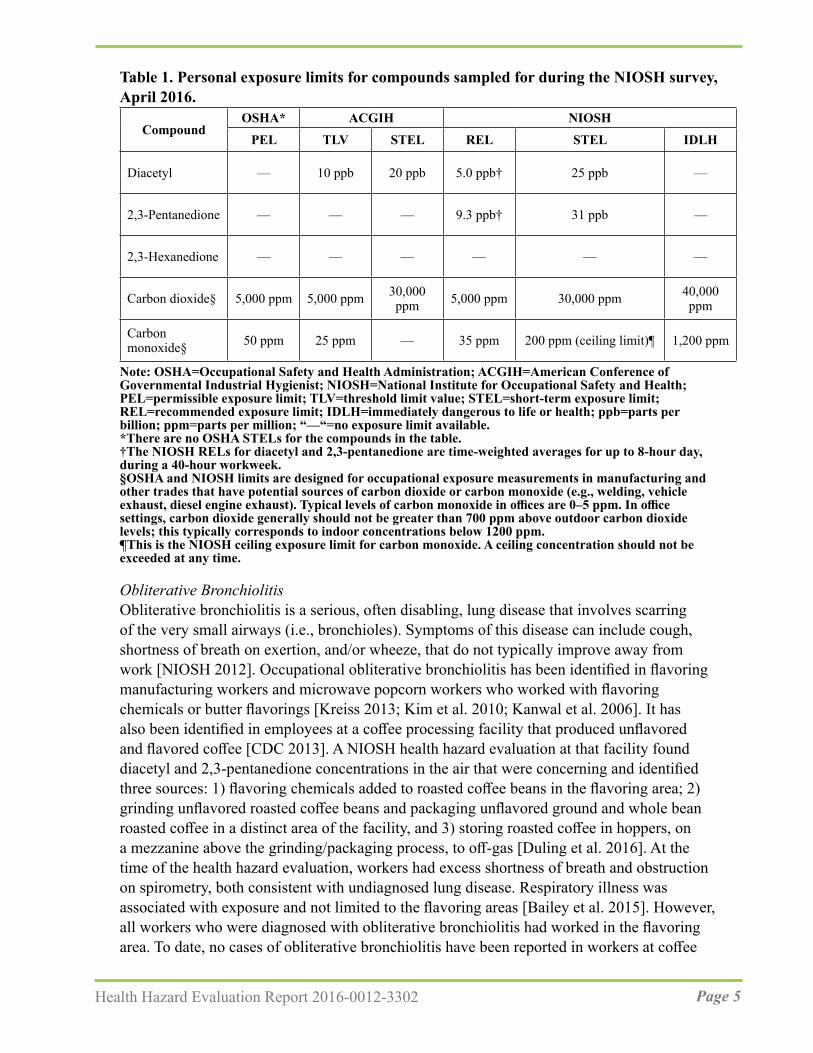
Table 1. Personal exposure limits for compounds sampled for during the NIOSH survey, April 2016.
OSHA* ACGIH NIOSHCompound
PEL TLV STEL REL STEL IDLH
Diacetyl — 10 ppb 20 ppb 5.0 ppb† 25 ppb —
2,3-Pentanedione — — — 9.3 ppb† 31 ppb —
2,3-Hexanedione — — — — — —
Carbon dioxide§ 5,000 ppm 5,000 ppm 30,000 ppm 5,000 ppm 30,000 ppm 40,000
ppm
Carbon monoxide§ 50 ppm 25 ppm — 35 ppm 200 ppm (ceiling limit)¶ 1,200 ppm
Note: OSHA=Occupational Safety and Health Administration; ACGIH=American Conference of Governmental Industrial Hygienist; NIOSH=National Institute for Occupational Safety and Health; PEL=permissible exposure limit; TLV=threshold limit value; STEL=short-term exposure limit; REL=recommended exposure limit; IDLH=immediately dangerous to life or health; ppb=parts per billion; ppm=parts per million; “—“=no exposure limit available. *There are no OSHA STELs for the compounds in the table.†The NIOSH RELs for diacetyl and 2,3-pentanedione are time-weighted averages for up to 8-hour day, during a 40-hour workweek.§OSHA and NIOSH limits are designed for occupational exposure measurements in manufacturing and other trades that have potential sources of carbon dioxide or carbon monoxide (e.g., welding, vehicle exhaust, diesel engine exhaust). Typical levels of carbon monoxide in offices are 0–5 ppm. In office settings, carbon dioxide generally should not be greater than 700 ppm above outdoor carbon dioxide levels; this typically corresponds to indoor concentrations below 1200 ppm. ¶This is the NIOSH ceiling exposure limit for carbon monoxide. A ceiling concentration should not be exceeded at any time.
Obliterative BronchiolitisObliterative bronchiolitis is a serious, often disabling, lung disease that involves scarring of the very small airways (i.e., bronchioles). Symptoms of this disease can include cough, shortness of breath on exertion, and/or wheeze, that do not typically improve away from work [NIOSH 2012]. Occupational obliterative bronchiolitis has been identified in flavoring manufacturing workers and microwave popcorn workers who worked with flavoring chemicals or butter flavorings [Kreiss 2013; Kim et al. 2010; Kanwal et al. 2006]. It has also been identified in employees at a coffee processing facility that produced unflavored and flavored coffee [CDC 2013]. A NIOSH health hazard evaluation at that facility found diacetyl and 2,3-pentanedione concentrations in the air that were concerning and identified three sources: 1) flavoring chemicals added to roasted coffee beans in the flavoring area; 2) grinding unflavored roasted coffee beans and packaging unflavored ground and whole bean roasted coffee in a distinct area of the facility, and 3) storing roasted coffee in hoppers, on a mezzanine above the grinding/packaging process, to off-gas [Duling et al. 2016]. At the time of the health hazard evaluation, workers had excess shortness of breath and obstruction on spirometry, both consistent with undiagnosed lung disease. Respiratory illness was associated with exposure and not limited to the flavoring areas [Bailey et al. 2015]. However, all workers who were diagnosed with obliterative bronchiolitis had worked in the flavoring area. To date, no cases of obliterative bronchiolitis have been reported in workers at coffee
Page 6 Health Hazard Evaluation Report 2016-0012-3302
roasting and packaging facilities that produce only unflavored coffee.
Work-related AsthmaWork-related asthma refers to asthma brought on by (“occupational asthma”) or made worse by (“work-exacerbated asthma” or “work-aggravated asthma”) workplace exposures [Tarlo 2016; Tarlo and Lemiere 2014; OSHA 2014; Henneberger et al. 2011]. It includes asthma due to sensitizers, which cause disease through immune (allergic) mechanisms, and asthma due to irritants, which cause disease through non-immune mechanisms. Symptoms of work-related asthma include episodic shortness of breath, cough, wheeze, and chest tightness. The symptoms may begin early in a work shift, towards the end of a shift, or hours after a shift. They generally improve or remit during periods away from work, such as on weekends or holidays.
Green and roasted coffee dust and castor beans (from cross-contamination of bags used to transport coffee) are known risk factors for occupational asthma [Figley and Rawling 1950; Karr et al. 1978; Zuskin et al. 1979, 1985; Thomas 1991]. Persons who become sensitized (develop an immune reaction) to coffee dust can subsequently react to relatively low concentrations in the air. Others can experience irritant-type symptoms from exposure to coffee dust [Oldenburg et al. 2009].
Previous Industrial Hygiene Sampling at This Coffee Processing FacilityOn September 23, 2015, an industrial hygiene contractor collected area and TWA personal air samples in the roasting and grinding areas. Personal full-shift samples were collected from two employees who roasted coffee (roasters) and one employee who ground and packaged coffee. In addition to the TWA sampling, short-term (15 minute) personal samples were collected during specific tasks. According to the industrial hygiene report dated October 21, 2015, all sample results were above the NIOSH REL of 5 ppb [NIOSH 2016] and the ACGIH TLV of 10 ppb [ACGIH 2016] for diacetyl. TWA exposures for the three personal samples ranged from 48 ppb–94 ppb. The NIOSH STEL is 25 ppb for diacetyl [NIOSH 2016] and the ACGIH TLV-STEL is 20 ppb [ACGIH 2016]. The STEL is a 15-minute TWA exposure that should not be exceeded at any time during a workday. Two short-term (15 minute) samples were collected during roasting and grinding activities. The STEL result collected on a roaster was 98 ppb and the grinder result was 46 ppb, both above the NIOSH and ACGIH STELs.
Based on these air sampling results, the coffee roasting and packaging company wanted to be proactive and more fully characterize concentrations of alpha-diketones in the air and assess the efficiency of the existing ventilation systems. In October 2015, the management submitted a health hazard evaluation request to NIOSH.
Process DescriptionThe facility was approximately 70,000 square feet with 45,000 square feet dedicated to production activities. At the time of the NIOSH visit in April 2016, approximately 60 employees were located at the main location. The production activities were performed by

Page 7Health Hazard Evaluation Report 2016-0012-3302
approximately 20 employees and supported by three quality control laboratory employees. Production activities occurred over two shifts in a 5-day workweek with most employees working 8-hour shifts. The remaining employees were involved in administrative tasks including accounts receivable, customer service, inventory control, graphic design, sales, community outreach, and farmer relations. In addition to the main location, an additional 30 employees had relocated to an offsite facility in the spring of 2015. At this site, distribution activities for finished goods including coffee and chocolate products were performed by approximately 12 warehouse employees while the remaining employees performed administrative tasks in office settings.
Green coffee beans were received in burlap or jute bags from 13 countries. After arrival in the facility’s receiving area, pallets of bagged beans were stored by origin and lot in the green coffee bean storage area until needed in the roasting area. In preparation for roasting, burlap bags were cut open and green beans emptied into a feed hopper. From the feed hopper, the beans were conveyed into a shaker and magnetic separator where they underwent cleaning before being pneumatically transferred into one of eight storage silos; total silo capacity was approximately 32,000 pounds of beans.
To prepare a batch for roasting, green coffee beans were pneumatically fed into a roaster feed hopper and automatically inducted into the roaster barrel on either one of two natural gas fired (convection) roasters. The Probat R-1000 roaster is capable of roasting 440 pounds of green beans while the Probat G-120 roaster can accommodate 230 pounds. Batches were automatically pulled from a single silo or more than one silo if a blend of beans was to be roasted. The beans were heated at a specific temperature and for a precise time to achieve the desired roast profile. Types of roasts offered included medium, Full City, Vienna, or French roasts. At the end of each roast cycle, the roasted beans were automatically water quenched inside the roaster barrel to initiate the cooling process before being automatically transferred into the enclosed cooling bin for mechanical mixing by an agitator to accelerate cooling. The enclosed cooling bin used an up-draft exhaust system that pushed air up from the bottom of the bin, over the roasted beans, and out the roof-top exhaust. Exhaust from each roasting barrel and cooling tray/bin flowed through a particulate cyclone and thermal oxidizer. Once the roasted beans were cooled, the roaster operator collected a sample for quality control checks. Quality control checks involved grinding a small amount of roasted beans and testing the roast color profile using a color analyzer. The beans were then transferred through a pneumatic destoner into either a rolling tote or supersack (large industrial sized bag). A roaster operator monitored the roasting equipment carefully throughout the roasting and cooling process. Containers with roasted beans were then moved to the off-gassing, blending, grinding, or packaging areas.
Routine cleaning activities were employed at both roasters. Chaff from the destoner trays was emptied daily. The roaster operator used a shovel to clean out the chaff barrel from the roaster cyclone and transferred chaff from the barrel into large plastic bags that were donated to local farmers. For the R1000 roaster, a thermal clean-out was initiated every 80 hours. This 1.5-hour automated process involved running the roaster at high temperatures to remove buildup of organic material from the inside of the emission pipes. All emissions were routed
Page 8 Health Hazard Evaluation Report 2016-0012-3302
through the thermal oxidizer as in normal roasting. For the G120 roaster, a manual cleaning process was initiated every 500 hours. This process involved removing emission piping from the machine and cleaning any organic buildup inside the emission pipes.
Unlined supersacks were staged in the off-gassing area for a period of 24 hours–48 hours. Roasted whole coffee beans were fed into hoppers and transferred through a conveyance blender to feed the 5 pound packaging line. In the grinding area, a production employee used a hoist to raise roasted whole bean supersacks to the top of the grinder hopper. The supersack was then manually untied, and the roasted beans were gravity-fed into the grinder. Typical batch sizes were approximately 400 pounds. The grinder could be adjusted for type of grind (coarse, medium, or fine). Ground coffee was collected in another supersack attached to the discharge chute. At times during grinding, the employee manually collected a sample of the ground coffee at the discharge chute. Once grinding was completed, a production employee moved the supersack to its applicable packaging line.
In addition to the large capacity production grinder, two small table-top grinders accessible to all employees were located just inside the production area. These grinders were used at various times throughout the day for personal use.
Roasted whole bean and ground coffee were packaged on one of four automated packaging lines. All packages were flushed with nitrogen before filling to ensure freshness. On the can line, whole bean and ground coffee were packaged in 14 ounce fully-recyclable cans. These cans featured a foil lid fitted with a one-way valve. This line was staffed by four production assistants and an employee to palletize finished product. Ground coffee was processed on the can line approximately twice a month. Whole bean coffee was packaged in 5 pound bags that were fitted with one-way valves and heat-sealed. Two 5 pound bags were packed into each cardboard box by a production assistant. Whole bean and ground coffee were packaged into both 10 ounce and 12 ounce bags fitted with one-way valves and heat-sealed. Once packaged, bags were packed into cardboard boxes. Ground coffee previously off-gassed for a minimum of 48 hours was packaged into 1.5, 2.25, 2.5, 7.0, or 8 ounce packages on the pillow pack line for use in commercial 12 cup or 1.5 gallon brewers. After filling, these packs were heat-sealed and packaged into cases. In addition to the automated packaging lines, a hand packaging station was used to package whole bean and ground coffee in smaller quantities via a weigh-fill machine.
Each packaging line was monitored by production assistants to assure quality of packaging. In the event of packaging defects, some re-work of product was required. Re-work involved manually cutting open defective packaging, emptying coffee into a plastic container, and then returning coffee to the supply hopper on the appropriate packaging line. After individual packages were filled, they were heat sealed, packaged and palletized, and moved via forklift to a staging area for transfer to the offsite warehouse.
There was a small maintenance area with one designated employee responsible for maintenance of production equipment.
Page 9Health Hazard Evaluation Report 2016-0012-3302
The primary purpose of the quality control laboratory, located across from the loading docks and the staging area, was to ensure the quality of the coffee produced at the facility. Coffee quality was evaluated daily by a process called cupping, where quality control staff, purchasers, and production roasters smelled, tasted, and assigned scores to coffee brewed from samples of roasted beans. The roasted beans used for cupping came from three sources: coffee bean samples from farmers (pre-ship), purchased coffee beans shipped to the facility (arrival), and beans roasted at the facility (production). The quality control laboratory completed three to four cuppings per day. Cuppings were prepared by roasting coffee beans, grinding roasted beans, and brewing. The cupping process takes approximately one hour depending on the types of beans being evaluated (i.e., pre-ship, arrival, or production). In addition to cupping, the quality control staff also graded green coffee beans, roasted coffee bean samples, conducted triangulations used to certify and grade tasters, analyzed brewed coffee, and tested packaging. All procedures in the quality control laboratory were performed in accordance with standards and protocols set by the Specialty Coffee Association of America.
Various cleaning techniques were used throughout production areas. Cleaning methods used for the production area and equipment included sweeping (dry and wet), wiping (dry and wet cloths), and using compressed air. Employees used brooms to routinely sweep the production floor and once a week used a floor scrubber. They used wet or dry wipes on table tops and equipment surfaces and compressed air to remove coffee bean dust from surfaces and equipment.
Employees were not required to wear a company uniform or protective clothing. Upon entry into the production area employees were required to wear a hair net or hat. Hearing protection was recommended for the roasting and grinding areas. Some employees were observed using hearing protection. Voluntary use of N95 filtering facepiece respirators was reported.
MethodsWe visited the coffee processing facility in April 2016. We performed the industrial hygiene survey during April 18–22, 2016. On the first day, we held an opening meeting with management and employee representatives from all work areas to explain the health hazard evaluation process and to describe the sampling procedures. For part of the first day, we were joined by representatives from the Massachusetts Department of Public Health. During the remainder of the week, we performed a ventilation assessment in the production area, collected air samples, and collected bulk samples of roasted coffee. We also toured the warehouse location where finished product was stored before being shipped. At the conclusion of the industrial hygiene survey, we held a brief closing meeting with management and employee representatives. The medical survey was performed during April 25–29, 2016. We provided a letter detailing our evaluations and preliminary recommendations to management on May 10, 2016.

Page 10 Health Hazard Evaluation Report 2016-0012-3302
We had the following objectives for the health hazard evaluation:
1. Measure employees’ exposure to diacetyl, 2,3-pentanedione, and 2,3-hexanedione during coffee processing;
2. Identify process areas or work tasks associated with elevated levels of diacetyl, 2,3-pentanedione, and 2,3-hexanedione;
3. Measure levels of CO and CO2 in areas of the facility;
4. Measure CO levels in employees’ exhaled breath;
5. Assess ventilation systems and their effect on exposure levels;
6. Determine if employees had mucous membrane, respiratory, or systemic symptoms, and the proportion of those symptoms that were work-related or aggravated by work;
7. Determine if employees had abnormal lung function tests;
8. Compare employees’ prevalence of lower respiratory symptoms and healthcare provider-diagnosed asthma with expected levels based on general population values.
Industrial Hygiene SurveySampling Times for Alpha-Diketones We designed the sampling strategy to assess full-shift exposures and identify tasks and processes that were the greatest contributors to worker exposure to alpha-diketones. For diacetyl, 2,3-pentanedione, and 2,3-hexanedione, air samples were collected over seconds, minutes, and hours. Samples collected over hours can help determine average concentrations that can be compared with the NIOSH RELs for diacetyl and 2,3-pentanedione. These average concentrations might not tell us about short-term peak exposures that could be relevant to respiratory health, particularly when tasks are repeated multiple times per day. Therefore, during particular tasks, we collected air samples over several minutes. When the samples were equal to 15 minutes, we also conducted instantaneous sampling over seconds to help identify point sources of alpha-diketones
Employees who participated in air sampling were given the opportunity to request their individual air sampling results
Air Sampling and Analysis Using Occupational Safety and Health Administration (OSHA) Methods 1013/1016We collected personal and area air samples for diacetyl, 2,3-pentanedione, and 2,3-hexanedione on silica gel sorbent tubes. The samples were collected and analyzed according to the modified OSHA sampling and analytical Methods 1013/1016 [OSHA 2008; OSHA 2010; LeBouf and Simmons 2017]. In accordance with the two methods, two glass silica gel sorbent tubes were connected by a piece of tubing and inserted into a protective, light-blocking cover. The tubes were connected in series to a sampling pump pulling air through the tubes at a flow rate of 50 milliliters per minute (mL/min). The sampling setup was attached to an employee’s breathing zone or placed in an area basket in various places
Page 11Health Hazard Evaluation Report 2016-0012-3302
throughout the facility. For full-shift personal sampling, we collected two consecutive 3-hour samples and calculated the TWA concentration from the two samples, assuming the total 6-hour monitoring results reflected a full work shift (8-hour) TWA exposure. Although this might introduce some error, it is a conservative approach more protective of employees than the alternative assumption of no exposure during the last two hours of the shift. We refer to these samples as “full-shift samples” throughout this report. Area samples on the first three days of sampling were collected using three consecutive 3-hour samples and on the fourth day of sampling two consecutive 3-hour samples were collected. We also collected short-term, task-based samples during specific work tasks (e.g., roasting, grinding, packaging) with a sampling pump flow rate of 200 mL/min as detailed in OSHA Methods 1013 and 1016 [OSHA 2008; 2010]. Sampling times were dependent on the duration of the task being performed.
Analyses of the samples were performed in the NIOSH Respiratory Health Division’s Organics Laboratory. The samples were extracted for one hour in 95% ethanol:5% water containing 3-pentanone as an internal standard. Samples were analyzed using an Agilent 7890/7001 gas chromatograph/mass spectrometer system operated in selected ion monitoring mode for increased sensitivity compared to the traditional flame ionization detector used in OSHA Methods 1013 and 1016 [LeBouf and Simmons 2017].
A limit of detection (LOD) is the lowest mass an instrument can detect above background and is a criteria used to determine whether to report a result from a sample. The limit of quantitation (LOQ) is the lowest mass that can be reported with precision; we have a greater confidence in the reported result if above the LOQ. The samples were analyzed using two instruments. The LODs were 0.005 micrograms per sample (µg/sample) for diacetyl, 2,3-pentanedione, and 2,3-hexanedione on instrument A. For a typical full-shift air sample, these equate to 0.32 ppb for diacetyl, 2,3-pentanedione, and 2,3-hexanedione. The LODs for the instrument B were 0.005 µg/sample for diacetyl, 0.006 µg/sample for 2,3-pentanedione, and 0.01 µg/sample for 2,3-hexanedione. For a typical full-shift air sample, these equate to 0.32 ppb for diacetyl, 0.33 ppb for 2,3-pentanedione, and 0.48 for 2,3-hexanedione. The LODs for task samples vary because of differing air volumes collected while sampling specific tasks and are higher than typical LOD values for full-shift samples. When the values presented in the report are from samples below the LOD they are denoted by a “<” symbol. The LOQs for instrument A equate to 1.1 ppb for diacetyl, 2,3pentanedione, and 2,3-hexanedione. The LOQs for instrument B equate to 1.05 ppb for diacetyl, 1.08 for 2,3-pentanedione, and 1.59 for 2,3-hexanedione instrument B for a typical full-shift air sample.
Air Sampling and Analysis Using Evacuated CanistersIn addition to OSHA’s sampling methods for diacetyl and 2,3-pentanedione, NIOSH has also been using evacuated canisters [LeBouf et al. 2012] with flow controllers to collect air samples for diacetyl, 2,3-pentanedione, and 2,3-hexanedione in workplaces.
We collected instantaneous task-based and source air samples for VOCs including diacetyl, 2,3-pentanedione, and 2,3-hexanedione using evacuated canisters. We also collected
Page 12 Health Hazard Evaluation Report 2016-0012-3302
instantaneous air samples before and after the work shift to determine if air concentrations of alpha-diketones varied over a work shift. The evacuated canister sampling setup consisted of a 450-mL evacuated canister equipped with an instantaneous flow controller designed for a short sampling duration (less than 30 seconds). Instantaneous samples were taken by opening the evacuated canister to grab a sample of air. For task-based air samples, a NIOSH employee placed the inlet of the flow controller by the employee’s personal breathing zone as they performed their work task to replicate exposure. For source air samples, a NIOSH employee placed the inlet of the flow controller directly at the source of interest.
The canister air samples were analyzed using a pre-concentrator/gas chromatograph/mass spectrometer system pursuant to a published method validation study [LeBouf et al. 2012], with the following modifications: the pre-concentrator was a Model 7200 (Entech Instruments, Inc., Simi Valley, CA), and six additional compounds (diacetyl, 2,3-pentanedione, and 2,3-hexanedione, acetaldehyde, acetonitrile, and styrene) were included. At present, this canister method is partially validated [LeBouf et al. 2012] and not considered the standard method. The LODs were 0.39 ppb for diacetyl, 0.54 ppb for 2,3-pentanedione, and 0.96 ppb for 2,3-hexanedione. However, LODs are dependent on the pressure inside each canister after samples have been collected and they might be higher or lower than typical LOD values.
Bulk Sampling and Headspace AnalysisWe used 50-mL sterile polypropylene centrifuge tubes to collect approximately 40-mL bulk samples of roasted coffees (whole bean and ground). For headspace analysis of alpha-diketones, we transferred 1 gram of solid bulk material bulk material into a sealed 40-mL amber volatile organic analysis vial and let it rest for 24 hours at room temperature (70°F) in the laboratory. Then 2 mL of headspace air was transferred to a 450-mL canister and pressurized to approximately 1.5 times atmospheric pressure. Using the canister analysis system, the concentrations were calculated in ppb of analytes in the headspace as an indicator of emission potential.
Real-time Air SamplingWe used RAE Systems (San Jose, CA) ppbRAE 3000 (Model #PGM-7340) monitors to measure levels of total volatile organic compounds (TVOCs) in the air. The ppbRAE has a non-specific photoionization detector that responds to chemicals with ionization potentials below the energy of the lamp. This sampling was conducted to identify areas where coffee could be releasing VOCs. Areas with higher release of VOCs can be targets for sampling for alpha-diketones and for exposure controls. We also collected real-time measurements of CO2, CO, temperature, and relative humidity (RH) in various locations using TSI Incorporated (Shoreview, MN) VelociCalc Model 9555-X Multi-Function Ventilation Meters equipped with Model 982 IAQ probes.
Exhaled CO MeasurementsWe asked employees to perform a carboxyhemoglobin (COHb) test one or more times throughout their shift to measure CO levels in their exhaled breath. This test helps determine if employees are exposed to elevated levels of CO. Employees were asked to hold their

Page 13Health Hazard Evaluation Report 2016-0012-3302
breath for 15 seconds and then exhale through a mouthpiece into a CO monitor. The device then calculated an estimate of COHb in blood. We asked participants when they last smoked cigarettes or used tobacco products. Tobacco smoke from cigarettes, cigars, and pipe tobacco contains CO and can cause an increase in exhaled CO. Employees who participated in COHb testing were mailed their individual test results.
Ventilation AssessmentWe completed visual and physical assessments of all ventilation components at the facility. Physical measurements were taken with a Model DISTO E7100i laser-tape measure (Leica Geosystems AG, Heerbrugg, Switzerland). Because of the height, configuration, and large airflow rate of the two makeup air units used to supply fresh air in the production area space, we did not have equipment that allowed for ventilation measurements. However, we collected information on existing ventilation equipment, including make, model, and specified performance levels. Differential pressure measurements between adjacent spaces were taken under various ventilation scenarios using an Energy Conservatory (Minneapolis, MN) DG-500 Pressure Gauge.
NIOSH Medical SurveyParticipants We invited all current employees to participate in the medical survey at the workplace during April 25–29, 2016. Participation was voluntary; written informed consent was obtained from each participant before testing. An interpreter was used during the medical survey for non-English speaking employees. The survey included, in the order performed, a medical and work history questionnaire, quantification of exhaled nitric oxide, impulse oscillometry, spirometry, and if indicated the administration of a bronchodilator with repeat impulse oscillometry and spirometry. We mailed participants their individual reports explaining their breathing test results and recommended each participant provide the information to their personal physician.
Questionnaire We used an interviewer-administered computerized questionnaire to ascertain symptoms and diagnoses, work history at this coffee roasting and packaging facility and other coffee or flavoring companies, and cigarette smoking history. Questions on respiratory health were derived from five standardized questionnaires, the European Community Respiratory Health Survey [Burney et al. 1994; ECRHS 2014], the American Thoracic Society adult respiratory questionnaire (ATS-DLD-78) [Ferris 1978], the International Union Against Tuberculosis and Lung Disease [Burney et al. 1987, 1989], and the Third National Health and Nutrition Examination Survey (NHANES III) [CDC 1996] and NHANES 2007–2012 questionnaires [CDC 2018]. Some of the questions appeared on more than one of the standardized questionnaires. We also supplemented our questionnaire with additional respiratory and systemic symptom questions.
Spirometry The purpose of the spirometry test was to determine a person’s ability to move air out of their lungs. Test results were compared with expected normal values. The test included the three
Page 14 Health Hazard Evaluation Report 2016-0012-3302
measurements or calculations: 1) forced vital capacity (FVC) (the total amount of air the participant can forcefully blow out after taking a deep breath), 2) 1-second forced expiratory volume (FEV1) (the amount of air that the participant can blow out in the first second of exhaling), and 4) the calculation of the ratio of FEV1 to FVC. We used American Thoracic Society criteria for acceptability and repeatability [Miller et al. 2005].
We used a volume spirometer (dry rolling seal spirometer) to measure exhaled air volume and flow rates. We used equations for predicted values and lower limits of normal derived from NHANES III data to define abnormal spirometry [Hankinson et al. 1999]. We defined obstruction as an FEV1/ FVC ratio less than the lower limit of normal with FEV1 less than the lower limit of normal; restriction as a normal FEV1/FVC ratio with FVC less than the lower limit of normal; and mixed obstruction and restriction as having FEV1, FVC, and FEV1/FVC ratio all less than the lower limit of normal. We used the FEV1 percent predicted to categorize such abnormalities as mild, moderate, moderately severe, severe, or very severe [Pellegrino et al. 2005].
Impulse OscillometryMany occupational lung diseases (e.g., chronic obstructive pulmonary disease (COPD), asthma) involve the small airways; however, this part of the lung is difficult to evaluate non-invasively. Oscillometry is a helpful technology to understand the effects of occupational exposures on the small airways. There are no contraindications to the test as this test is conducted using regular breathing and does not require a forceful exhalation [Smith et al. 2005]. Spirometry can be normal despite respiratory symptoms or evidence of small airways disease on lung biopsy [King et al. 2011; Oppenheimer et al. 2007]; therefore, oscillometry results complement spirometry and can be used when spirometry is not possible because of a contraindication.
We used an impulse oscillometry machine (CareFusion Corp., San Diego, CA) to measure resistance (R), the energy required to propagate the pressure wave through the airways, and reactance (X), which reflects the viscoelastic properties of the respiratory system. The impulse oscillometry testing machine sends sound waves called pressure oscillations at different frequencies (e.g., 5 Hertz and 20 Hertz) into the airways to measure how airways respond to these small pressures. The test calculates 1) the airway resistance at different frequencies including 5 Hertz (R5) and 20 Hertz (R20), and the difference between R5 and R20 (DR5-R20); 2) the reactance at different frequencies including 5 Hertz (X5); 3) resonance frequency (Fres) which is the frequency where there is no airway reactance; and 4) the total reactance (AX) at all frequencies between 5 Hertz and the Fres. The predicted values for R and X were based on sex and age according to references values recommended by the manufacturer [Vogel and Smidt 1994]. R5 was considered abnormal (elevated) if the measured value was equal to or greater than 140 percent of the predicted R5. X5 was considered abnormal (decreased) if the value of the predicted X5 minus measured X5 was equal to or greater than 0.15 kilopascals per liter per second (kPa/(L/s)) DR5-R20 values greater than 30% were considered abnormal and evidence of frequency dependence [Smith 2015]. We interpreted the test as normal if both the R5 and X5 were normal [Smith 2015]. We defined possible large (central) airways abnormality as a normal X5 and elevated R5

Page 15Health Hazard Evaluation Report 2016-0012-3302
with no evidence of frequency dependence. We defined a possible small airways abnormality if there was evidence of frequency dependence and/or a decreased X5 with or without an elevated R5. We defined possible combined small (peripheral) and large (central airways) abnormality as a decreased X5 and elevated R5 with no evidence of frequency dependence.
Bronchodilator Reversibility Testing for Impulse Oscillometry and SpirometryIf a participant had abnormal impulse oscillometry or spirometry, we repeated both tests after the participant received a bronchodilator inhaler medication (i.e., albuterol), which can open the airways in some individuals (e.g., asthmatics). For oscillometry, we defined reversibility (improvement) after bronchodilator administration as a decrease of at least 20% of either Fres or R5 or a decrease of 40% for AX. For spirometry, we defined reversibility (improvement) as increases of at least 12% and 200 mL for either FEV1 or FVC after bronchodilator administration. Fractional Exhaled Nitric Oxide (FeNO) We used the NIOX MINO® device (Aerocrine Inc., Morrisville, NC) to measure the amount of nitric oxide in the air the participant breathed out. Nitric oxide is a gas that is produced by the airways, and elevated levels can be a sign of eosinophilic airway inflammation in asthma [Dweik et al. 2011]. In adults, fractional nitric oxide concentration in exhaled breath levels above 50 ppb are considered elevated. In adults with asthma, elevated levels may indicate that their asthma is uncontrolled [Dweik et al. 2011].
Statistical Analysis Industrial Hygiene Survey and Ventilation AssessmentWe performed analyses using Excel (Microsoft®, Redmond, WA) and SAS version 9.3 (SAS Institute, Cary, NC). When the values presented in the report are from samples below the LOD they are denoted by a “<” symbol. Medical SurveyWe calculated frequencies and standardized morbidity ratios (SMRs) and their associated 95% confidence intervals (CIs) using SAS version 9.3 (Cary, NC). The SMRs compare prevalences of symptoms and spirometric abnormalities among participants with expected prevalences of a sample of the general population reflected in the NHANES III (1988–1994, symptom data) and NHANES 2007–2012 (symptom data) adjusting for sex, race/ethnicity, age (less than 40 years old or 40 years or greater), and cigarette smoking categories (ever/never). For comparisons with the U.S. population, we used the most recent NHANES survey available for the specific comparisons.
ResultsAll results tables are located in Appendix A.
Industrial Hygiene SurveyPersonal and Area Full-shift Air Sampling Results
Page 16 Health Hazard Evaluation Report 2016-0012-3302
OSHA Methods 1013/1016Table A1 presents the personal and area full-shift air sampling results. Twenty-seven employees participated in the personal sampling. We collected 88 personal and 96 area full-shift samples. Four of the area samples were collected outside the facility. Sixty-nine (78%) of 88 personal air samples exceeded the NIOSH REL for diacetyl of 5.0 ppb. Workers performing duties in grinding, packaging, roasting, and in the general production area had full-shift samples that exceeded the NIOSH REL for diacetyl the majority of the time. Seven of 88 personal air samples (8%) exceeded the NIOSH REL for 2,3-pentanedione of 9.3 ppb. Eighty-four of 88 personal air samples (95%) had 2,3-hexanedione concentrations below the analytical method LOD. The maximum concentration of 2,3-hexanedione measured was 0.3 ppb.
Overall, employees in packaging had the highest average personal exposure to diacetyl of 13.2 ppb (range for 38 samples: 1.6 ppb–25.6 ppb). Thirty-seven (97%) of the 38 full-shift personal samples on packaging employees exceeded the NIOSH REL for diacetyl by as much as five times. The only full-shift personal sample below the NIOSH REL for diacetyl was 1.6 ppb on an employee working the can line. There was no obvious reason for this result to differ from the other samples. Employees in roasting had the second highest average personal exposure to diacetyl of 13.1 ppb. Ten of the 11 roaster employee measurements (91%) exceeded the NIOSH REL for diacetyl (range: 4.4 ppb–19.2 ppb). All of the full-shift personal samples on an employee in grinding (range for 4 samples: 10.3 ppb–13.8 ppb) exceeded the NIOSH REL for diacetyl. Full-shift samples for diacetyl for employees performing duties in the production area including maintenance and forklift/receiving (4 samples) ranged from 5.0 ppb–10.4 ppb; quality control laboratory (12 samples) ranged from 1.9 ppb–16.8 ppb; and production offices including production supervisor (9 samples) ranged from 1.4 ppb–8.1 ppb. Personal full-shift measurements were lowest on employees at the front desk (2 samples) and in 2nd floor offices (5 samples) ranging from 0.5 ppb–4.04 ppb; all were below the NIOSH REL for diacetyl.
Seven of the 88 full-shift personal samples (8%) exceeded the NIOSH REL of 9.3 ppb for 2,3-pentanedione. Samples exceeding the REL included four collected on employees in packaging, two in roasting, and one in the quality control laboratory. Almost all (85/88) of the full-shift personal samples results for 2,3-hexanedione were below the method LOD.
Area samples were collected in 20 locations throughout the facility. The highest full-shift area samples were collected in grinding (ranges for eight samples: 12.0 ppb–68.9 ppb for diacetyl and 5.2 ppb–31.4 ppb for 2,3-pentanedione). The roasting area had the second highest levels of diacetyl and 2,3-pentanedione (ranges for 12 samples: 7.5 ppb–37.8 ppb for diacetyl and 3.7 ppb–23.0 ppb for 2,3-pentanedione). The packaging area had the third highest levels of diacetyl ranging from 5.9 ppb–21.6 ppb and 2,3-pentanedione ranging from 2.3 ppb–17.1 ppb. Within packaging, the pillow line sample had the highest concentrations of diacetyl (21.6 ppb) and 2,3-pentanedione (17.1 ppb). The quality control laboratory area samples ranged from 7.7 ppb–11.7 ppb for diacetyl. Samples within the general production area ranged from 1.3 ppb–13.5 ppb for diacetyl. The general production area sample collected in the finished product shelving had the highest concentrations of diacetyl (range:
Page 17Health Hazard Evaluation Report 2016-0012-3302
9.1 ppb–13.5 ppb) while the general production area sample collected at the loading dock had the lowest concentration of diacetyl (range: 1.3 ppb–7.1 ppb). The area samples collected in the kitchen, 2nd floor sales offices, and 2nd floor library had the lowest concentrations of diacetyl (range: 0.5 ppb–3.2 ppb) and 2,3-pentanedione (range: <0.2 ppb–1.5 ppb). We note NIOSH RELs are intended to be directly compared with personal full-shift measurements; therefore, an area air sample exceeding a NIOSH REL is only an indication of potential personal exposures.
Task-based Air Sampling ResultsOSHA Method 1013/1016Table A2 presents the personal task-based air concentrations by individual task. Importantly, tasks associated with coffee processing are varied and as such the duration also varies. We collected 108 personal task-based air samples using OSHA Methods 1013/1016, and the sample duration ranged from three minutes–24 minutes. Sixty-two of the tasks sampled lasted for 15 minutes, allowing for their results to be compared directly with the NIOSH STELs for diacetyl (25 ppb) and 2,3-pentanedione (31 ppb).
Employees who performed re-work of packaged coffee had the highest exposure to diacetyl (range for four samples: 11.9 ppb–69.9 ppb) and 2,3-pentanedione (range: 8.7 ppb–39.2 ppb). Each of the four rework task samples lasted 15 minutes, allowing for comparison with the NIOSH STELs. Three of the 15-minute samples exceeded the NIOSH STEL for diacetyl, and one of the samples exceeded the NIOSH STEL for 2,3-pentandione. Employees who moved roasted beans or ground coffee had the second highest exposure to diacetyl (range for four samples: 4.5 ppb–56.9 ppb) and 2,3-pentanedione (range: 2.0 ppb–24.4 ppb). Employees that ground coffee had the third highest exposure to diacetyl (range for 10 samples: 15.5 ppb–52.6 ppb). Six of the grinding task samples lasted 15 minutes, and three of these exceeded the NIOSH STEL for diacetyl of 25 ppb. Two grinding task samples were collected for 16 minutes, and their diacetyl concentrations were 31 ppb and 46.8 ppb, both of which are over the NIOSH STEL of 25 ppb for diacetyl. No grinding task samples exceeded the STEL for 2,3-pentanedione.
There were 39 samples taken during packaging tasks where diacetyl concentrations ranged from <0.9 ppb to 42.2 ppb for diacetyl. Five 15-minute samples exceeded the NIOSH STEL for diacetyl of 25 ppb. No packaging task samples exceeded the STEL for 2,3-pentanedione. One packaging task sample lasted for 14 minutes. When we assume zero exposure for the remaining minute of the sample, the calculated concentration exceeds the NIOSH STEL of 25 ppb for diacetyl. Employees roasting coffee had measured exposures to diacetyl (range for 19 samples: 1.7 ppb–32.8 ppb); one 15-minute sample exceeded the NIOSH STEL for diacetyl.
Evacuated CanistersInstantaneous Canister Task-based sampling ResultsTable A3 presents the personal task-based air concentrations from the evacuated canister sampling. We collected 36 personal task-based canister air samples. Because of the very short duration of the samples, results should not be compared with the 15-minute STELs.
Page 18 Health Hazard Evaluation Report 2016-0012-3302
The instantaneous task sample collected in the breathing zone of a packaging employee while loading ground coffee into a hopper on the pillow pack line had the highest level of diacetyl (3,765 ppb) and 2,3-pentanedione (3,377 ppb), and the second highest level of 2,3-hexandione (96 ppb). The second highest levels of diacetyl (2,692 ppb) and 2,3-pentandione (949 ppb) were measured in an instantaneous task sample collected in the breathing zone of an employee during the removal of a supersack full of ground coffee from the grinder. Other instantaneous task samples collected during tasks associated with grinding also had relatively high levels of diacetyl (369–1,279 ppb) and 2,3-pentanedione (163–408 ppb). The third highest levels of diacetyl (2,146 ppb) and 2,3-pentanedione (743 ppb) were observed when an employee dumped French Roast whole beans into a hopper on the blending line. The 2,3-hexanedione level of 106 ppb in this sample was the highest of all samples.
We collected 17 instantaneous canister samples during a variety of tasks in the quality control laboratory including grinding and cupping. Concentrations of diacetyl ranged from 9 ppb–74 ppb, and 2,3-pentanedione ranged from 7 ppb–44 ppb. 2,3-Hexanedione concentrations were lower, ranging from <0.9 ppb–6 ppb. The highest diacetyl and 2,3-pentanedione levels were associated with grinding coffee beans.
Thirteen samples were taken during tasks in the roasting area including grinding samples of roasted coffee for quality control and checking the roast profile. Diacetyl levels (range: 18 ppb–98 ppb) and 2,3-pentanedione levels (range: 10 ppb–101 ppb) were higher in tasks where an employee ground samples of roasted coffee for quality control checks. 2,3-Hexanedione levels were less than the analytical method LOD for most samples.
Source Canister Sampling ResultsTable A4 presents instantaneous source air sampling results using evacuated canisters. We collected 43 source canister air samples. The three samples with the highest concentrations of diacetyl, 2,3-pentanedione, and 2,3-hexanedione were all associated with ground coffee. The sample with the highest concentrations was collected at a supersack of ground coffee on the ICA packaging line 10 minutes after the coffee had been ground (diacetyl 26,406 ppb, 2,3-pentanedione 13,139 ppb, and 2,3-hexandione 378 ppb). The second highest sample concentrations were measured in a sample collected during grinding of a supersack of Breakfast Blend (diacetyl 11,160 ppb, 2,3-hexanedione 2739 ppb, and 2,3-hexanedione 272 ppb). The third highest concentrations were from a sample taken at the opening of a supersack in the off-gassing area approximately two hours after the coffee was ground (diacetyl 10,541 ppb, 2,3-pentanedione 4,123 ppb, and 2,3-hexanedione 205 ppb). The instantaneous source samples collected at the main grinder and at the grinders (sample and espresso) in the quality control laboratory tended to have higher concentrations of diacetyl, 2,3-pentanedione, and 2,3-hexanedione. A sample taken at the espresso grinder had 809 ppb diacetyl, 679 ppb 2,3-pentanedione, and 27 ppb 2,3-hexanedione while a sample taken pulling espresso shots had 467 ppb diacetyl, 430 ppb 2,3-pentanedione, and 17 ppb 2,3-hexanedione. A sample taken on the can packaging line where the beans enter the can had 2,086 ppb diacetyl, 823 ppb 2,3-pentanedione, and 83 ppb 2,3-hexanedione. All
Page 19Health Hazard Evaluation Report 2016-0012-3302
14 instantaneous source samples collected at the roasters and roaster sample grinders had diacetyl and 2,3-pentanedione levels below 100 ppb.
Background Pre- and Post-Shift Diacetyl and 2,3-Pentanedione Canister ResultsTable A5 presents the instantaneous evacuated canister pre- and post-shift background air sampling results on Tuesday, April 20, 2016, and Thursday, April 22, 2016. Samples were collected in the middle of the production area and between the staging and green bean storage areas on both days. Air concentrations of diacetyl and 2,3-pentanedione increased over the course of the day on both dates. Both pre- and post-shift concentrations for diacetyl and 2,3-pentanedione were higher on April 20 than on April 22 at both sampling locations. The pre-shift diacetyl concentration on April 20 in the middle of the production area was 11.8 ppb, and the post-shift concentration was 25.5 ppb. The pre-shift 2,3-pentanedione concentration was 4.2 ppb, and the post-shift concentration was 8.4 ppb. On April 22, the pre-shift diacetyl concentration in the middle of the production area was 5.9 ppb, and the post-shift concentration was 20.3 ppb. The pre-shift 2,3-pentanedione concentration was 2.0 ppb, and the post-shift concentration was 7.3 ppb.
The post-shift concentrations of diacetyl and 2,3-pentanedione in the samples collected between the staging and green bean storage area were also higher on April 20 than on April 22. The pre-shift diacetyl concentration on April 20 was 9.9 ppb, and the post-shift concentration was 38.2 ppb. The pre-shift 2,3-pentanedione concentration was 3.5 ppb, and the post-shift concentration was 20.1 ppb. On April 22, the pre-shift diacetyl concentration between the staging and green bean storage area was 5.6 ppb, and the post-shift concentration was 19.3 ppb. The pre-shift 2,3-pentanedione concentration was 2.6 ppb, and the post shift concentration was 8.6 ppb. The 2,3-hexanedione concentrations in all samples were always less than 2.0 ppb.
Bulk Samples and Headspace ResultsTable A6 presents the results from 11 bulk samples of whole bean and ground coffee using headspace analysis. There was one sample of ground coffee collected from a supersack on a packaging line on April 21, 2016. Each of the five whole bean samples with a corresponding ground bean sample were collected on April 22, 2016. Both diacetyl and 2,3-pentanedione concentrations were always higher in the whole bean sample than in the ground sample. 2,3-Pentanedione concentrations were higher than the diacetyl concentrations in both the whole bean and ground samples of the dark medium Honduran, medium Mexican, and Full City Peru Decaf. 2,3-Hexanedione results were below the method LOD in eight of the 11 samples. The 2,3-hexanedione concentration (300.8 ppb) in one of three samples with results above the LOD was greater than 2,3-pentanedione concentration and similar to the diacetyl concentration.
Real-time Monitoring: Temperature, Relative Humidity (RH), Carbon Dioxide (CO2), Carbon Monoxide (CO), and Total Volatile Organic Compounds (TVOCs)During sampling April 19–22, 2016, the outdoor temperatures ranged from 46°F–81°F, and the outdoor RH ranged from 25%–87%. Overall temperature and RH ranges in the main production area were 63°F–80°F and 18%–48%, respectively. Temperatures in the quality

Page 20 Health Hazard Evaluation Report 2016-0012-3302
control laboratory were slightly warmer ranging from 74°F–82°F, with RH ranging from 22%–42%. Temperature and RH in the second floor sales and library area ranged from 69°F–76°F and 22%–39%, respectively.
Table A7 presents results from real-time monitoring of CO2, CO, TVOCs, temperature and relative humidity. Throughout the week of collection, outdoor CO2 levels ranged from 358 ppm–380 ppm, and outdoor CO levels ranged from 0 ppm–0.3 ppm. Average CO2 levels were highest at the roaster sample grinders (794 ppm) and behind the main grinder (770 ppm). Average CO (25.7 ppm) was highest to the left of the discharge chute (25.7 ppm) at the main grinder and ranged from 1.4 ppm–7.7 ppm in the other locations. Average levels of TVOCs were highest to the left of the discharge chute at the main grinder (3,270 ppb) and lowest in the off gassing area (735 ppm).
Our real-time monitoring demonstrated the highest peak measurements of CO and CO2 occurred at the main grinder on the second day of sampling (4/20/2016). On the first day of sampling (4/19/2016), the area basket with the monitors at the grinder was located to the right of the ground coffee discharge chute next to the grinder control panel. An estimated 3,850 pounds of coffee was ground, and the average CO concentration was 7.7 ppm, and the average CO2 concentration was 596 ppm. We noticed the air was moving across the monitor to the left. On the second day of sampling (4/20/2016), we moved the area sampling basket to the other side of the grinder so it was positioned to the left of the discharge chute. An estimated 3,150 pounds of coffee was ground. The average CO concentration was 25.7 ppm, and the average CO2 concentration was 749 ppm. On the third day of sampling (4/21/2016), we placed the area sampling basket behind the grinder next to the grinder operator desk. An estimated 2,450 pounds of coffee was ground. The average CO concentration was 6.6 ppm,
and the average CO2 concentration was 770 ppm.
Figure 1. Carbon monoxide (CO) and carbon dioxide (CO2) concentrations during sampling on April 20, 2016, to the left of the discharge chute at the main grinder.
Page 21Health Hazard Evaluation Report 2016-0012-3302
On April 20, 2016, NIOSH staff recorded activities taking place at the main grinder while continuous monitoring devices were recording CO2, CO, and TVOC levels. The area basket with the samplers was positioned to the left of the grinder at breathing zone height. Figure 1 shows the CO2 and CO levels during the sampling period. Each of the peaks correspondswith times when batches of coffee were being ground. The first peak was generated during grinding of approximately 100 pounds. The remaining peaks were associated with grinding larger batches. CO2 concentrations ranged from 433 ppm to >5,000 ppm (average 749 ppm), and the CO concentrations ranged from 0.8 ppm to >500 ppm (average 25.7). The instrument was only capable of recording CO2 up to 5,000 ppm and CO up to 500 ppm. CO2 levels exceeded 5,000 ppm twice while CO levels exceeded 500 ppm 36 times.
The TVOC peaks overlapped with the CO peaks. The average TVOC concentration was 3,270 ppb with a maximum reading of 71,819 ppb. The maximum reading occurred when a supersack of ground coffee was removed from the discharge chute of the grinder, tied closed, and moved to the packaging line.
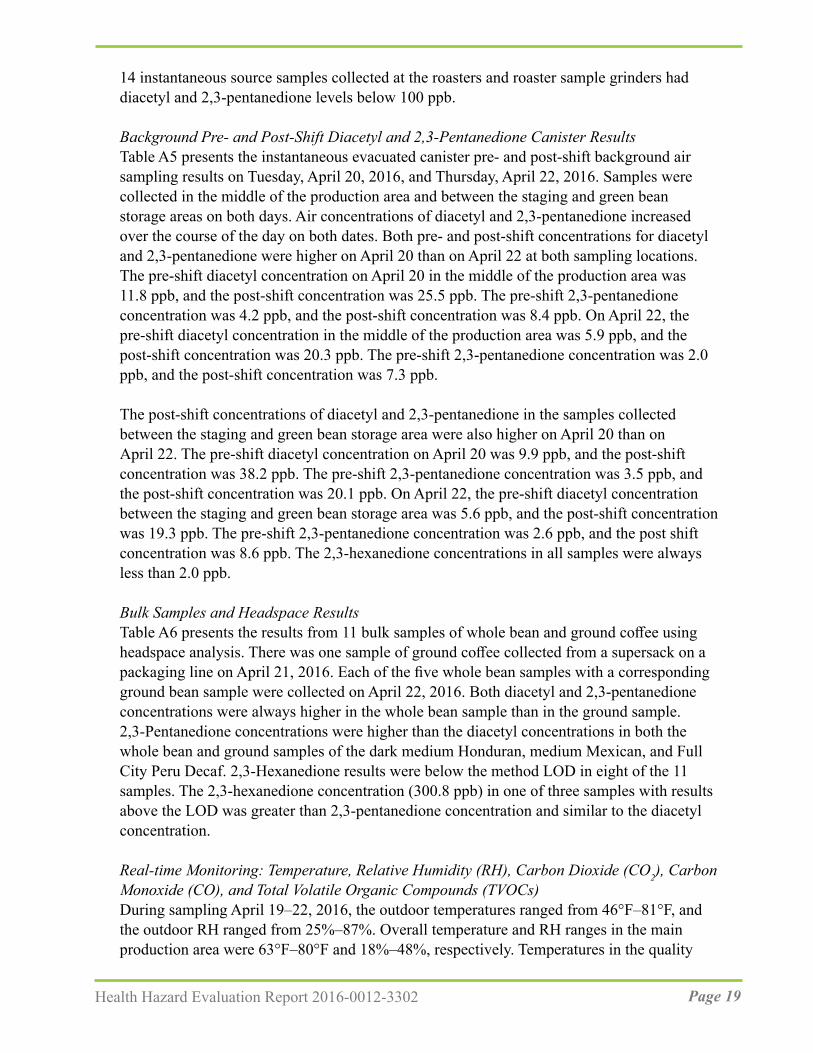
On April 20, 2016, an area sampler was positioned at the red roaster (Probat G-120). CO concentrations ranged from 0 ppm–44 ppm (average 3.9 ppm), and CO2 ranged from 446 ppm–1,045 ppm (average 666 ppm).
Figure 2 shows the CO and TVOC concentrations at the red roaster. The average TVOC concentration at the red roaster was 1,008 ppb with a maximum reading of 3,066 ppb.
Figure 2. Carbon monoxide (CO) and total volatile organic compound (VOC) concentrations at the red roaster on April 20, 2016.
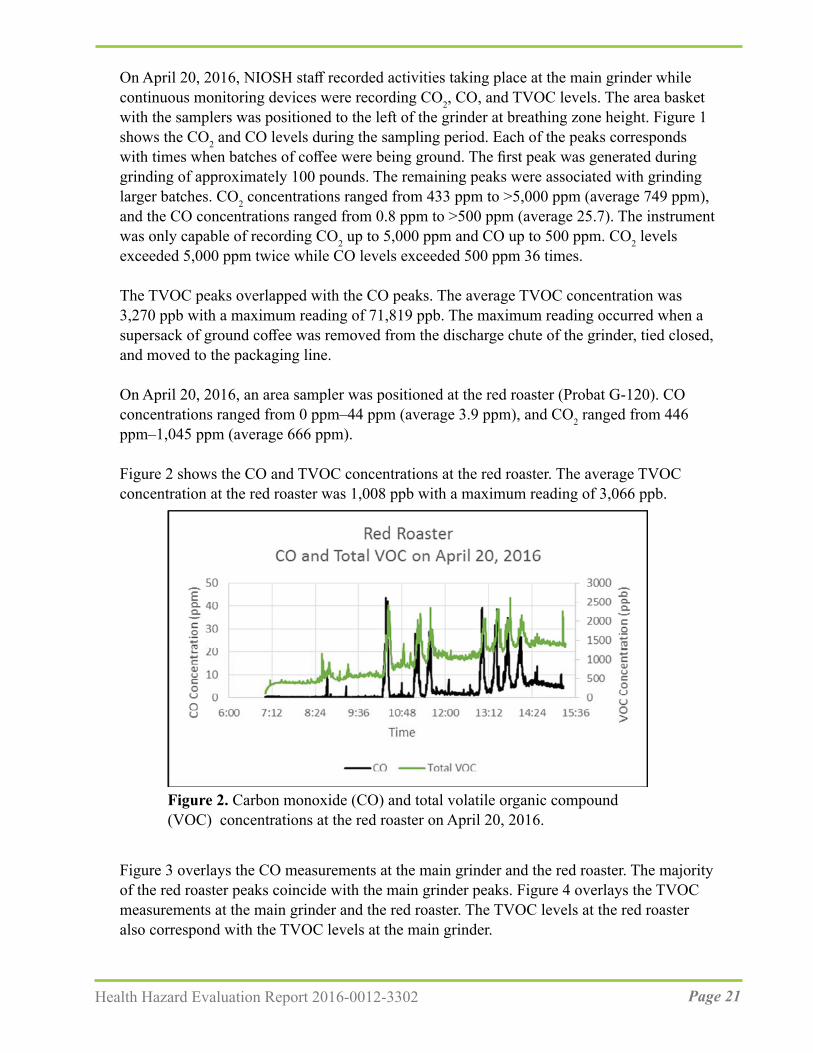
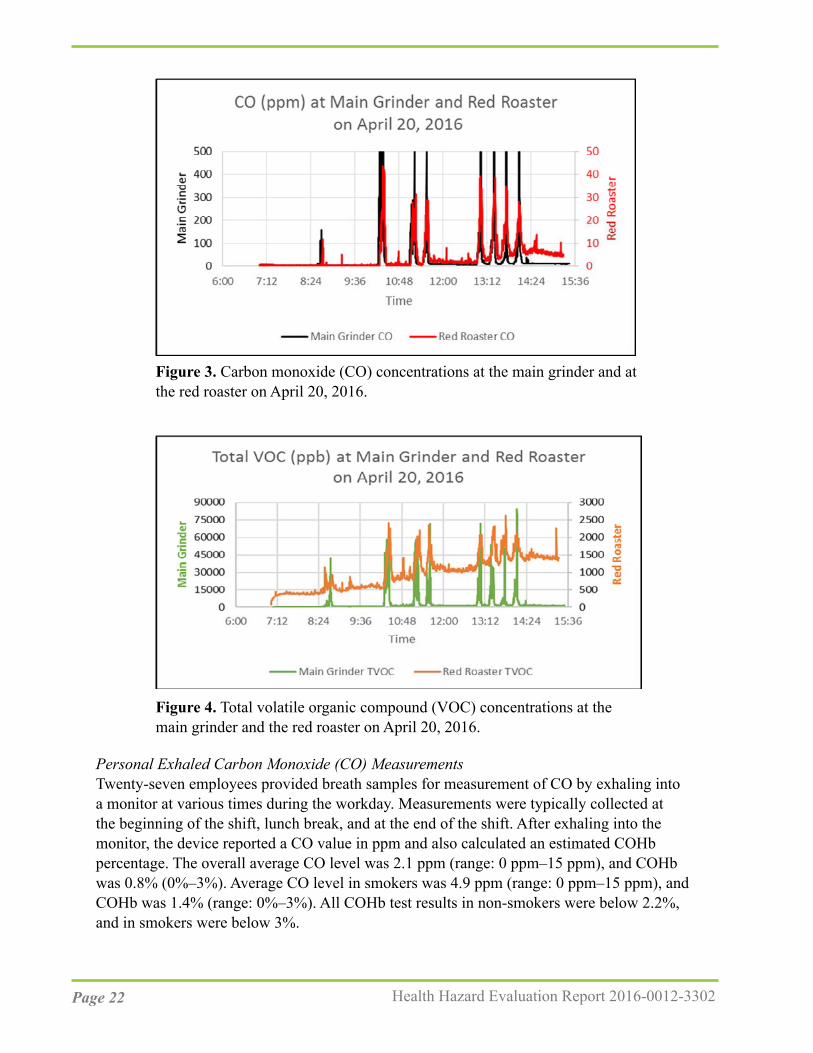
Figure 3 overlays the CO measurements at the main grinder and the red roaster. The majority of the red roaster peaks coincide with the main grinder peaks. Figure 4 overlays the TVOC measurements at the main grinder and the red roaster. The TVOC levels at the red roaster also correspond with the TVOC levels at the main grinder.
Page 22 Health Hazard Evaluation Report 2016-0012-3302
Figure 3. Carbon monoxide (CO) concentrations at the main grinder and at the red roaster on April 20, 2016.
Figure 4. Total volatile organic compound (VOC) concentrations at the main grinder and the red roaster on April 20, 2016.
Personal Exhaled Carbon Monoxide (CO) MeasurementsTwenty-seven employees provided breath samples for measurement of CO by exhaling into a monitor at various times during the workday. Measurements were typically collected at the beginning of the shift, lunch break, and at the end of the shift. After exhaling into the monitor, the device reported a CO value in ppm and also calculated an estimated COHb percentage. The overall average CO level was 2.1 ppm (range: 0 ppm–15 ppm), and COHb was 0.8% (0%–3%). Average CO level in smokers was 4.9 ppm (range: 0 ppm–15 ppm), and COHb was 1.4% (range: 0%–3%). All COHb test results in non-smokers were below 2.2%, and in smokers were below 3%.

Page 23Health Hazard Evaluation Report 2016-0012-3302
Ventilation AssessmentTwo large makeup air units on the roof of the production space were used periodically to bring fresh air into the facility. The units were generally turned on during the early mornings of our visit, but were turned off for the majority of the days we were onsite. These units were reportedly used more in the winter to provide some heat to the facility, and almost never during the summer months. Ceiling fans were in use in the production area during our sampling.
Differential pressure measurements taken with the rooftop makeup air units off indicated the majority of adjacent spaces were generally neutral to the production space. The two exceptions were the receiving office and the procurement office, which were both slightly positive to production. However, when the makeup air units were on, the majority of adjacent spaces were under slightly negative pressure to production (the receiving office and the procurement office both remained positive). This means air from the production space can be pushed into the negative-pressure adjacent spaces when the makeup air units are operating, at least under the conditions when our pressure measurements were taken. The non-production spaces of the facility are served by six rooftop air-handling units. Different combinations of operating states of those units (i.e., which ones are on and off simultaneously) on the non-production side of the plant could make the pressure differentials better or worse.
Other ObservationsWe observed some employees having difficulty untying the closures on the supersacks. Although we did not collect task samples during this activity, during these periods, the employees had the potential to be exposed to peaks of diacetyl and 2,3-pentanedione while in position near the opening of the supersack containing roasted coffee.
We observed some employees in the roaster and grinder areas wearing hearing protection while employees working in close proximity in the packaging areas were not wearing hearing protection. Although we did not conduct noise exposure monitoring during our visit, it is possible sound levels might exceed the OSHA PELs, the OSHA action level, or the NIOSH REL for noise [29 CFR 1910.95; NIOSH 1998]. Noise seemed to be especially loud when the grinder, green bean induction hoppers, and roaster destoners were operating simultaneously. In our initial interim letter dated May 10, 2016, we recommended an evaluation of noise levels to determine if a more formal hearing protection program was necessary.
Medical Survey ResultsDemographicsSeventy-nine of 94 onsite employees (84%) participated in the medical survey. Of these, 26 employees worked at the offsite location. The majority of participants were male (54%) and white (67%), with a mean age of 41 years (range 19 years–72 years) and average tenure at the company (including previous locations) of eight years (range: 2 months–30 years). Thirty-one (39%) participants were current or former smokers.
Forty-seven (59%) participants reported ever spending time in the production area. Of these; 18 (38%) spent more than 32 hours per week in the production area. The mean time reported
Page 24 Health Hazard Evaluation Report 2016-0012-3302
being spent in the production area per week was 16.7 hours (range: 0.1 hours–50 hours). Employees reported being within an arm’s length of the following exposures: an operating production coffee roaster (n=19, 24%); cooling bins that contain roasted beans while they are cooling (n=20, 25%), an operating production grinder (n=19, 24%); and packaging of coffee (n=30, 38%).
Symptoms and Self-Reported DiagnosesThe prevalences of symptoms over the last year and last four weeks at the time of the survey are listed in Table A8. Nose symptoms (n=57, 72%) were the most commonly reported, followed by eye symptoms (n=43, 54%). Wheeze (n=18, 23%) and breathing trouble (n=18, 23%) were the most commonly reported lower respiratory symptoms. The prevalence of symptoms between participants who reported working at the main facility and the offsite location was similar (data not shown). Sixteen (20%) and 11 (14%) participants reported their nose and eye symptoms were aggravated by work, respectively. Of the 18 participants who reported wheezing, 12 reported their wheezing was the same away from the workplace, two reported their wheezing was worse away from the workplace, and four reported their wheezing was better away from the workplace. Two of the four participants who reported their breathing was better away from the workplace worked in production. Three participants reported their breathing trouble was better away from the workplace; one of the three participants worked in production. Some production employees noted their nose and sinus symptoms were caused or aggravated by green coffee bean dust, chaff, and ground coffee.
Twenty-two participants reported a diagnosis of hay fever or nasal allergies; among these, seven reported the diagnosis was made post-hire. Thirteen participants reported ever having received a diagnosis of asthma; two received the diagnosis post-hire.
The prevalences of symptoms over the last year at the time of the survey for employees who reported spending any time in production areas (n=47) and for employees who reported not spending any time in production areas (n=32) are listed in Table A9. Overall, the prevalence of nose, eye, lower respiratory, and systemic symptoms were comparable between employees who reported spending time in production areas and employees who did not spend time in production areas.
Medical TestsTwenty participants had at least one breathing test interpreted as abnormal. Among these, four (20%) were current smokers, six (30%) were former smokers, and 11 (55%) reported ever working in the production area. No spirometry tests were interpreted as abnormal. Ten impulse oscillometry tests were interpreted as consistent with a small airway abnormality, two with a large airway abnormality, and three with small and large airway abnormalities. Fourteen of the 15 participants with impulse oscillometry tests interpreted as abnormal were given bronchodilator, and five had significant improvement in impulse oscillometry. Six exhaled nitric oxide tests were interpreted as elevated. Three of the six participants with elevated nitric oxide tests reported ever working in production. Two participants with abnormal exhaled nitric oxide tests had current asthma.

Page 25Health Hazard Evaluation Report 2016-0012-3302
NHANES Comparison of Symptoms, Diagnoses, and SpirometryThe SMRs for stuffy, itchy, or runny nose (SMR=1.3); phlegm production for three consecutive months (2.3); wheezing (1.7); ever having received a physician diagnosis of asthma (2.2); and currently having a physician diagnosis of asthma (2.6) were elevated (Table A10). SMRs for eye symptoms, sinus problems, shortness of breath on exertion, and cough were not elevated.
DiscussionDiacetyl, 2,3-pentanedione, 2,3-hexanedione, other VOCs, and other chemicals such as CO and CO2 are naturally produced when coffee beans are roasted, and grinding the roasted coffee beans produces greater surface area for the off-gassing of these chemicals [Anderson et al. 2003; Akiyama et al. 2003; Daglia et al. 2007; Newton 2002; Nishimura et al. 2003; Raffel and Thompson 2013]. Occupational exposure to diacetyl and 2,3-pentanedione can cause loss of lung function and the lung disease obliterative bronchiolitis [NIOSH 2016].
Alpha-Diketones
Personal Air SamplingAverage air concentrations of diacetyl and 2,3-pentanedione in this facility were compared with their respective NIOSH RELs of 5.0 ppb and 9.3 ppb. The majority (78%) of personal full-shift diacetyl exposures were above the NIOSH REL of 5.0 ppb, and 88% were above the NIOSH AL for diacetyl of 2.6 ppb. The highest average personal exposures to diacetyl were in packaging employees (13.2 ppb), roasting employees (13.1 ppb), and an employee performing grinding (11.8 ppb). Eighteen of 28 (64%) full-shift samples on employees performing duties in the general production area, production office, and quality control laboratory also had results that exceeded the REL for diacetyl. Eight percent of the personal full-shift samples were above the NIOSH REL of 9.3 ppb for 2,3-pentanedione. These seven personal full-shift samples were collected on employees in roasting (two samples), the quality control laboratory (one sample), and on the packaging lines (four samples). Personal full-shift samples from employees in the second floor offices and at the front desk did not exceed either REL.
As noted earlier, the REL should be used as a guideline to indicate when steps should be taken to reduce exposures in the workplace. The risks associated with the measured levels are higher than NIOSH recommends. As described in the quantitative risk assessment from the NIOSH Criteria Document (Table 5-27) [NIOSH 2016], after a 45-year working lifetime exposure to 20 ppb (a concentration lower than the highest concentration (26 ppb) measured at this facility), NIOSH estimated that 3 in 1,000 workers would develop reduced lung function (FEV1 below the 5th percentile). NIOSH predicted that around 5 in 10,000 workers exposed to diacetyl at 20 ppb would develop more severe lung function reduction (FEV1 below 60% predicted, defined as at least moderately severe by the American Thoracic Society [Pellegrino et al. 2005]). After a 45-year working lifetime exposure to 50 ppb (a concentration higher than the highest concentration measured at this facility), NIOSH
Page 26 Health Hazard Evaluation Report 2016-0012-3302
estimated that 8 in 1,000 workers would develop reduced lung function (FEV1 below the 5th percentile). NIOSH predicted that 12 in 10,000 workers exposed to diacetyl at 50 ppb would develop more severe lung function reduction. The effects of a working lifetime exposure at 26 ppb would be between those for 20 ppb and 50 ppb. NIOSH recommends keeping diacetyl concentrations below 5 ppb because at this level, the risk of reduced lung function after a working lifetime of exposure is below 1 in 1000 workers. NIOSH recommends taking steps to reduce diacetyl exposures to below the REL of 5 ppb whenever possible.
Area Air SamplingThe highest area samples for diacetyl and 2,3-pentanedione were in the grinding, roasting, and packaging areas. Although lower, diacetyl and 2,3-pentandione concentrations in eight other locations within the production area and in the quality control laboratory were also elevated. The area samples collected in the kitchen area and second floor offices and library space had the lowest concentrations. Of the 96 full-shift area samples, 76 (79%) were above the NIOSH REL for diacetyl and 12 (13%) above the REL for 2,3-pentanedione. We note NIOSH RELs are intended for personal full-shift measurements; however full-shift area air samples exceeding the RELs can be an indicator for areas with potential personal exposures. Overall, 2,3-hexanedione concentrations were low with only four personal and three area samples results above the LOD.
Task-Based ExposuresCoffee processing involves multiple tasks that can cause intermittent exposure to diacetyl and 2,3-pentanedione. Traditional full-shift sampling will not characterize these intermittent peak exposures. Evaluating intermittent and task-based exposures to diacetyl and 2,3-pentanedione is difficult with current validated sampling methods (OSHA Methods 1013/1016). Because tasks are sporadic in coffee processing, with some only lasting a few seconds or minutes, we used instantaneous evacuated canisters to sample tasks that lasted only a few seconds to minutes and OSHA Methods 1013/1016 for longer duration tasks. We sampled by task, with varying durations, to understand which tasks might have contributed to higher exposures to diacetyl and 2,3-pentanedione.
Sixty-two samples with a duration of 15-minutes were compared with the NIOSH STELs for diacetyl (25 ppb) and 2,3-pentanedione (31 ppb) (Table A2). Rework of packaged coffee had the highest exposure with three of the four samples exceeding the diacetyl STEL and one exceeding the 2,3-pentanedione STEL. Three task samples taken during grinding, five samples during coffee packaging, and one sample during roasting, exceeded the diacetyl STEL.
We also used instantaneous evacuated canisters to sample tasks with short duration. These samples were collected by placing the inlet of the canister near the breathing zone of an employee while they performed a task. Four of the highest instantaneous sample results for both diacetyl and 2,3-pentanedione were associated with ground coffee (Table A3). Loading ground coffee into a hopper on the pillow pack line in packaging had the highest concentration of diacetyl (3,765 ppb) and 2,3-pentandione (3,377 ppb). Removing supersacks of ground coffee from the grinder and sealing the supersack resulted in diacetyl

Page 27Health Hazard Evaluation Report 2016-0012-3302
concentrations of 369 ppb to 2,692 ppb and 2,3-pentanedione of 163ppb to 949 ppb. The greater surface area created from grinding might have contributed to these concentrations [Akiyama et al. 2003]. Concentrations of diacetyl (2,146 pbb) and 2,3-pentanedione (743 ppb) were measured while dumping whole bean roasted coffee into a hopper along the blending line. This sample also had the highest measured concentration of 2,3-hexanedione of 106 ppb. In addition to tasks, we used evacuated canisters to collect samples at specific point-sources (Table A4). For these samples, the inlet of the flow controller was placed directly at the source of interest. As with the task-based samples, the diacetyl and 2,3-pentanedione concentrations were highest at sources where ground coffee was present. The highest sample for diacetyl (26,406 ppb) and 2,3-pentanedione (13,139 ppb) was measured at a supersack of freshly ground coffee on the ICA packaging line. Seven samples collected at the grinder had diacetyl concentrations ranging from 15.4 ppb–11,160 ppb and 2,3-pentanedione concentrations from 7.8 ppb–2,739 ppb. In the QC laboratory, the highest concentrations were also measured at the espresso grinder while pulling shots of espresso.
Instantaneous samples collected at the beginning of production and at the end of production in the same two locations on April 20, 2016, and April 22, 2016, demonstrated the concentrations of diacetyl, 2,3-pentanedione and 2,3-hexanedione increased throughout the day (Table A5). This indicates that the generation rate of these compounds exceeded the rate at which existing ventilation systems removed them under the conditions when samples were taken.
Bulk SamplesDiacetyl isn’t found in green beans and forms later in the coffee roasting process [Daglia et al. 2007]. We observed higher levels of diacetyl and 2,3-pentanedione in the whole bean samples than in the ground samples. Normally, we would expect ground coffee to provide higher levels of alpha-diketones than whole bean coffee. Thus, our observation may be the result of the bulk samples sitting in sealed tubes for several weeks prior to opening the tubes and manipulating the samples for analysis.
Real-time Monitoring: Carbon Dioxide (CO2), Carbon Monoxide (CO), and Total Volatile Organic Compounds (TVOCs)The real-time monitoring demonstrated that the highest peak measurements of CO, CO2, and TVOCs occurred to the left of the main grinder discharge chute while grinding was taking place. One employee had primary responsibility for all activities associated with grinding. We noted no employees spent long periods of time standing near the grinder discharge chute during the sampling period. No employees had elevated COHb test results. The location of the main grinder may allow for contaminants to be shared with other areas including roasting and packaging.
The roaster barrel burner intakes and the afterburner intakes for the roasters might be pulling contaminants from grinding toward the roasting area as illustrated by examining the real-time monitoring results for CO and total VOC concentrations (Figures 5 & 6) at the main
Page 28 Health Hazard Evaluation Report 2016-0012-3302
grinder and red roaster on April 20, 2016. The peaks at the red roaster trend with the peaks at the main grinder. The same trends were evident on the following day when we examined the real-time monitoring results from the main grinder and from the sample grinder in roasting.
VentilationAs shown in Table A5, concentrations of alpha-diketones increased in the production area throughout the course of the day indicating these compounds were being generated faster than they could be removed by existing ventilation systems. We also determined air from the production areas could potentially enter non-production areas under the conditions of testing, particularly when the make-up air units were on. The operational state of various air-handling units and make-up air units throughout the facility could make pressure differentials better or worse. Loading dock doors being opened or closed will also effect pressure differentials. Constant negative pressure in the production area relative to non-production areas is needed to keep contaminants from the production space from migrating to non-production areas. To maintain consistent negative pressure in the production area, additional exhaust systems are needed. These systems could consist of local exhaust at contaminant sources, general exhaust fans through the walls or ceiling, or a combination of both.
Local exhaust ventilationLocal exhaust ventilation systems capture contaminants when generated and exhausts them before inhalation by employees occurs. Local exhaust ventilation systems generally consist of hoods or enclosures, duct work, or fans. Depending on the contaminant and whether air is recirculated, filters or other air cleaning technologies can be incorporated. When properly designed local exhaust ventilation systems are installed, overall workplace exposure levels can be reduced by removing contaminants at the source. High concentrations of alpha-diketones were measured at the main grinder, at the opening of supersacks, on the can line in packaging, and at the espresso machine in the quality control laboratory. Work with a ventilation engineer to reduce alpha-diketone exposures in these locations. If exposure levels are still elevated after modifications have been made, it may be necessary to perform further sampling to identify additional point sources.
General exhaust or dilution ventilationIn an ideal environment, good general ventilation provides fresh air into the space and removes contaminated air. General exhaust ventilation allows contaminants to be emitted into the workplace and then dilutes the concentration of the contaminant to acceptable levels. This is generally done by providing fresh outdoor air (or recirculated, filtered air) to the space to provide dilution. Simultaneously, air is exhausted from the space to remove the contaminants. The relationship between supply air and exhaust air flow rates can be used to help maintain appropriate pressure relationships. If more air is supplied than exhausted, the space will generally be under positive pressure, which allows contaminants to migrate from the space to adjacent areas. Conversely, exhausting more air than is supplied, maintains the space under negative pressure which helps contain the contaminants in the area where they are generated.
During the April 2016 survey, two make-up air units capable of supplying fresh air to the production space were present. The systems were reportedly operated intermittently
Page 29Health Hazard Evaluation Report 2016-0012-3302
and seasonally, and used more in winter to provide heat. Operating the makeup air units consistently would help to dilute airborne concentrations of alpha-diketones, but most likely would not maintain concentrations below the NIOSH RELs for diacetyl and 2,3-pentanedione. Air was only being exhausted from the production area via the roasters, and the quantity of air exhausted was variable depending on the operating condition of each roaster. If more air was exhausted, through new wall or ceiling-mounted exhaust fans, it would help reduce concentrations of diacetyl and 2,3-pentanedione in the production space. It would also aid in keeping the production area under negative pressure compared with the non-production areas, which is desirable. Relocation or enclosure of specific processesWhile engineering controls are undoubtedly needed to reduce exposures, relocating processes or specific pieces of equipment to make control implementation easier might also reduce worker exposures. On April 20, 2016, we measured total VOCs at both the main grinder and the red roaster (Figure 6). It was clear any contaminant generation at the grinder was simultaneously detected at the red roaster. This demonstrates the roasters’ exhaust pulls contaminants generated during grinding toward that corner of the production area. Thus, roaster operators are likely exposed to alpha-diketone concentrations from processes other than roasting. Isolating the grinder in conjunction with local exhaust ventilation would likely reduce overall alpha-diketone exposures to employees in the production area. While it would be difficult to enclose the grinder in its current location, moving the grinder closer to an exterior wall could make it easier to enclose the grinding process and reduce costs associated with ventilating the process separately. Other process areas such as blending and off-gassing might be candidates for enclosure with separate ventilation to further reduce concentrations of alpha-diketones in the production area.
In general, the current ventilation configuration in the production area should be evaluated. An evaluation by a qualified ventilation engineer can determine if modifications to existing ventilation components could be made to lower airborne concentrations and/or whether the installation of new equipment may be necessary. In addition to dilution ventilation, the installation and use of local exhaust ventilation systems to decrease concentrations of diacetyl and 2,3-pentanedione can be explored, and an overall, cost-effective solution can be developed. After making changes to production ventilation, processes, controls, or work practices additional air sampling should be conducted to determine the effect on exposure conditions within the workplace.
Medical Survey Overall, nose and eye symptoms were the most commonly reported symptoms. Some employees reported their nose and sinus symptoms were caused or aggravated by green coffee dust, chaff, or roasted coffee dust. Coffee dust is an organic dust and, as noted earlier, exposure to coffee dust is known to cause respiratory symptoms and a known risk factor for occupational asthma [Karr et al. 1978; Zuskin et al. 1979, 1985, 1993; Thomas et al. 1991; Sakwari et al. 2013].
Upper respiratory diseases such as allergic rhinitis (hay fever, nasal allergies) and sinusitis
Page 30 Health Hazard Evaluation Report 2016-0012-3302
are sometimes associated with lower respiratory symptoms and asthma, and can precede the diagnosis of asthma [Shaaban et al. 2008; EAACI Task Force on Occupational Rhinitis et al. 2008; Rondón et al. 2012, 2017; Sahay et al. 2016]. Upper respiratory involvement (e.g., rhinitis, sinusitis) can result in suboptimal control of asthma. Thirty-two (84%) of the 38 participants who reported lower respiratory symptoms also reported nasal or sinus problems or physician-diagnosed hay fever or nasal allergies.
Green coffee dust is thought to be a more potent allergen than roasted coffee dust because roasting destroys some of the allergenic activity [Lehrer et al. 1978]. As discussed in the recommendation section, to prevent symptoms related to green coffee dust, make N95 disposable filtering facepiece respirators available for voluntary use for protection against dust exposure such as when emptying burlap bags of green beans into the storage silos feed hopper, cleaning the exhaust system of chaff, emptying the chaff containers, or cleaning the green bean storage area.
The number of participants with current physician-diagnosed asthma was approximately 2.5 times higher than that observed in the U.S. population. Asthma symptoms often improve when away from exposures that trigger symptoms while other lung diseases such as obliterative bronchiolitis or chronic obstructive pulmonary disease (COPD) generally do not improve. Spirometry can be used to help detect and follow individuals with asthma and other lung diseases such as obliterative bronchiolitis or COPD. Spirometry can show if air is exhaled from the lungs more slowly than normal (i.e., obstructive abnormality) or if the amount of air exhaled is smaller than normal (i.e., restrictive abnormality). In asthma, there is intermittent airways obstruction that is reversible after treatment with bronchodilator medications (e.g., albuterol). In obliterative bronchiolitis, scar tissue prevents the small airways (bronchioles) from opening up when albuterol is given. In other words, the airways obstruction is fixed and not responsive (reversible) to bronchodilator medicine. The obstructed airways prevent rapid emptying of the lung air sacs (alveoli) during exhalation. This explains why the respiratory symptoms of those with occupational obliterative bronchiolitis do not tend to improve when away from work-related exposures; however, avoidance of further exposure can stop progression of the disease [Akpinar-Elci et al 2004].
Spirometry and impulse oscillometry measure different things. Spirometry assesses airflow while impulse oscillometry accesses the airways response to a sound or pressure wave. In general, during the impulse oscillometry test, a small pressure impulse (sound wave) is imposed upon the inspiratory and expiratory airflow during normal tidal breathing. This pressure wave causes a disturbance in the airflow and pressure, and the response of the airways (i.e., change in pressure to change in flow) is a measure of the resistance to airflow in the airways [Desiraju and Agrawal 2016]. Impulse oscillometry can be useful as an indirect measure of airflow obstruction and helpful in individuals not able to perform forced breathing maneuvers required during the spirometry test. The impulse oscillometry test has been used for many years to measure changes in the airways of children with lung problems such as asthma and cystic fibrosis [Song et al. 2008; Komarow et al. 2011; Shi et al. 2012; Schulze et al. 2016]. More recently, impulse oscillometry has been used to investigate lung problems in adults exposed to dust or chemicals, such as World Trade Center emergency responders and
Page 31Health Hazard Evaluation Report 2016-0012-3302
soldiers returning from deployment overseas [Oppenheimer et al. 2007; Berger et al. 2013; Weinstein et al. 2016]. Over the years, researchers have developed reference (predictive) equations for different populations of children for oscillometry [Malmberg et al. 2002; Park et al. 2011; Lee et al. 2012; de Assumpcão et al. 2016]. For adults, fewer reference equations are available for oscillometry [Vogel and Smidt 1994; Newbury et al. 2008; Schulz et al. 2013]. The predicted values we used for oscillometry measures were based on gender and age according to references values recommended by the manufacturer. Unlike predictive equations used for spirometry, the impulse oscillometry reference equations we used did not take into account height, race, or smoking status [Vogel and Smidt 1994].
Our findings of upper and lower respiratory symptoms with a work-related pattern in some employees, an approximately two-fold excess of wheeze and phlegm production, and abnormalities on breathing tests in about 20% of participants suggest a burden of respiratory problems in this workforce. Work-related symptoms, which are symptoms that tend to improve away from the workplace, might reflect effects of workplace exposures that are reversible. However, some participants with lower respiratory symptoms such as wheeze did not have a work-related pattern. However, even symptoms that do not improve away from the workplace can be related to workplace exposures. In such cases, effects of workplace exposures might not be readily reversible, so the pattern of improvement away from the workplace is not seen and the recognition of an occupational cause can be delayed. The lower respiratory symptoms and the lung function abnormalities we found are not specific to a particular respiratory problem or disease. They could be related to workplace exposures or to other factors. Indeed, some employees had respiratory diagnoses that preceded employment at this facility. We mailed each participant their individual lung function test results with an explanation of the results and recommended each participant provide the information to their personal physician.
We recommend starting a medical monitoring program because air sampling in the main facility detected concentrations of diacetyl and 2,3-pentanedione above the NIOSH RELs, and participants were nearly two times as likely to have wheeze and over 2.5 times as likely to have current physician-diagnosed asthma compared with the general population. All production and quality control laboratory employees and any employees that assist with production tasks (e.g., roasting, interacting with open storage bins/containers of roasted coffee, grinding, weighing, or packaging coffee) should participate in the workplace medical monitoring program. A medical monitoring program is a means of early identification of employees who might be developing lung disease (e.g., asthma, obliterative bronchiolitis) and can help prioritize interventions to prevent occupational lung disease. The NIOSH medical survey results can serve as a baseline for employees who participated. In a workplace with risk of occupational lung disease, prevention of smoking-related lung disease is important and makes the detection of work-related adverse effects easier. The Centers for Disease Control and Prevention offers tools and resources for setting up a smoking cessation program [CDC 2017].
Page 32 Health Hazard Evaluation Report 2016-0012-3302
ConclusionsFull-shift personal and area air concentrations of diacetyl exceeded the NIOSH RELs in many areas of the facility, particularly in the packaging, grinding, and roasting. Some personal samples in the production office and quality control laboratory also exceeded the REL for diacetyl. Although fewer in number, some of the sample results also exceeded the REL for 2,3-pentanedione. We identified specific work tasks that resulted in air concentrations of diacetyl and 2,3-pentanedione that exceeded the NIOSH REL and STEL including re-work of packaged coffee, moving roasted whole bean or ground coffee, and grinding coffee. The use of real-time instruments demonstrated that the roasters may be pulling air from the grinder area which contains higher levels of diacetyl and 2,3-pentanedione. Over the course of the work day, air concentrations increased within the general production area indicating that the current ventilation isn’t sufficient to remove the compounds being generated. Some recommendations are being provided to aid in reducing exposures and protecting respiratory health.
Overall, mucous membrane symptoms, specifically eye, nose, and sinus symptoms, were the most commonly reported symptoms. Some production employees reported their mucous membrane symptoms were caused or aggravated by green coffee dust or chaff, roasted coffee, or ground coffee dust. Wheezing or whistling in the chest and breathing trouble were the most commonly reported lower respiratory symptoms. A statistically significant two-fold excess of phlegm production, wheezing, having ever received a physician diagnosis of asthma, and current physician diagnosis of asthma existed in the participants compared with the U.S. noninstitutionalized population of the same age, race/ethnicity, sex, and cigarette smoking distribution. No employees had abnormal spirometry results. We recommend a medical monitoring program to identify any employees who might be developing lung disease (e.g., asthma, obliterative bronchiolitis) and to help management prioritize interventions to prevent occupational lung disease. All production workers and employees that assist with production and quality control tasks (e.g., roasting, interacting with open storage bins/containers of roasted coffee, grinding, weighing, or packaging coffee) should participate in the workplace medical monitoring program.
Recommendations On the basis of our findings, we recommend the actions listed below. We encourage this coffee processing facility to use a labor-management health and safety committee or working group to discuss our recommendations and develop an action plan. Our recommendations are based on an approach known as the hierarchy of controls. This approach groups actions by their likely effectiveness in reducing or removing hazards. In most cases, the preferred approach is to eliminate hazardous materials or processes and install engineering controls to reduce exposure or shield employees.
Engineering ControlsEngineering controls reduce employees’ exposures by removing the hazard from the process

Page 33Health Hazard Evaluation Report 2016-0012-3302
or by placing a barrier between the hazard and the employee. Engineering controls protect employees effectively without placing primary responsibility of implementation on the employee.
1. Work with a ventilation engineer to ensure the production area is maintained under negative pressure compared with non-production spaces.
a. Keep all doors between the production and non-production areas closed at all times. The air-handling units serving the non-production areas might need to be re-balanced to maintain the non-production areas under positive pressure. This will prevent contaminant migration from the production area.
b. Ideally, the quality control laboratory should be maintained under negative pressure compared with the non-production areas but under positive pressure compared with the production area. This is applicable when the existing exhaust fan over the sample roasters is on or off.
2. Consider options for isolating the grinder to reduce overall alpha-diketone exposures in the production area. Moving the grinder closer to an exterior wall could make it easier to enclose the grinding process and reduce costs associated with ventilating the process separately. Other process areas such as blending and off-gassing might be candidates for enclosure with separate ventilation to further reduce concentrations of alpha-diketones in the production area.
3. Install local exhaust ventilation at point sources releasing the highest concentrations of alpha-diketones. Areas for consideration include at the main grinder, at the opening of supersacks, on the can line in packaging, and at the espresso machine in the quality control laboratory. In some cases, moving processes or equipment can make using local exhaust ventilation easier and more cost effective. A ventilation engineer can help with these decisions and verify the effectiveness of controls after implementation.
Administrative ControlsAdministrative controls are employer-dictated work practices and policies implemented to reduce or prevent hazardous exposures. Their effectiveness depends on employer commitment and employee acceptance. Regular monitoring and reinforcement are necessary to ensure policies and procedures are followed consistently.
1. Limit the amount of time non-production employees spend in the production area to the extent possible.
2. To reduce exposures to VOCs (including alpha-diketones), CO and CO2, minimize production tasks that require employees to place their heads near sources of roasted or ground coffee beans. Tying and untying supersacks presents the opportunity for short-term exposure to high concentrations of diacetyl and 2,3-pentanedione. Train employees on the proper technique for closure and opening of the supersacks.
3. After engineering controls have been installed, conduct personal air monitoring for diacetyl and 2,3-pentanedione on employees with primary duties in the production

Page 34 Health Hazard Evaluation Report 2016-0012-3302
area. Because air levels of VOCs like diacetyl and 2,3-pentanedione can fluctuate from day to day based on production schedules, we recommend personal air sampling for diacetyl and 2,3-pentanedione over multiple days.
4. Consider conducting air sampling at the off-site warehouse where finished product is stored to determine if there are exposures above the NIOSH RELs.
5. Ensure employees understand potential hazards (e.g., diacetyl, 2,3-pentanedione, CO, CO2, green bean and roasted coffee dust) in the workplace and how to protect themselves. OSHA’s Hazard Communication Standard, also known as the “Right to Know Law” [29 CFR 1910.1200] requires that employees are informed and trained on potential work hazards and associated safe practices, procedures, and protective measures. Written information should be provided in the languages spoken by employees to ensure comprehension of the information.
6. Avoid the use of compressed air as much as possible during cleaning. Instead, use a vacuum system with a high-efficiency particle air filter and wet methods whenever possible.
7. Ensure employees are educated to consider the risks of further exposure if they develop lower respiratory symptoms (e.g., cough, shortness of breath, wheezing) that are progressive and severe. Employees should report new, persistent, or worsening symptoms to their personal healthcare providers and to a designated individual at this workplace. Employees with new, persistent, or worsening symptoms should share this report with their healthcare providers.
Personal Protective EquipmentPersonal protective equipment in the form of respiratory protection is considered the least effective means for controlling hazardous respiratory exposures because breakdowns in implementation can result in insufficient protection. Proper use of respiratory protection (respirators) requires a comprehensive respiratory protection program and a high level of employee and management involvement and commitment to assure that the right type of respirator is chosen for each hazard, respirators fit users and are maintained in good working order, and respirators are worn when they are needed. Supporting programs such as training, change-out schedules, and medical assessment might be necessary. Respirators should not be the sole method for controlling hazardous inhalation exposures. Rather, respirators should be used until effective engineering and administrative controls are in place.
1. In addition to engineering and administrative controls, respiratory protection is a potential option to further reduce exposures to alpha-diketones (e.g., diacetyl and 2,3-pentanedione). If follow-up air sampling after engineering controls have been installed indicates levels of diacetyl and 2,3-pentanedione above their respective NIOSH RELs and STELs, we recommend that respiratory protection be used during tasks with elevated exposures. Respirators used to reduce exposures to diacetyl and 2,3-pentanedione should be NIOSH-certified and equipped with organic vapor cartridges. The choice of respirator should be guided by personal exposure sampling for diacetyl and 2,3-pentanedione (NIOSH 2004). For reference, air-purifying half-

Page 35Health Hazard Evaluation Report 2016-0012-3302
face respirators have an assigned protection factor (APF) of 10, and air-purifying full-face respirators have an APF of 50. Also, there are powered-air purifying respirators that have APFs of 25, 50, or 1000. A respirator’s APF refers to the maximal level of protectiveness a specific respirator design can achieve under laboratory conditions. The OSHA APFs can be found in Table 1 of OSHA Respiratory Protection Standard at https://www.osha.gov/pls/oshaweb/owadisp.show_document?p_table=STANDARDS&p_id=12716.
If respiratory protection is used, a written respiratory protection program should be implemented as required by the OSHA Respiratory Protection Standard (29 CFR 1910.134), including training, fit testing, maintenance and use requirements.
2. Offer employees the voluntary use of N95 disposable filtering facepiece respirators when working with green coffee beans and chaff such as emptying burlap bags of green beans into the storage silos feed hopper, when cleaning the exhaust system of chaff, when emptying the chaff containers, or cleaning the green bean storage area. A written respiratory protection program is not required for voluntary use of N95 disposable filtering facepiece respirators. However, N95 respirators should be available in various sizes, and each potential N95 user should receive a copy of Appendix D of the OSHA Respiratory Protection Standard (http://www.osha.gov/pls/oshaweb/owadisp.show_document?p_table=standards&p_id=9784). Information about Appendix D and voluntary use of respirators can be found on the OSHA website at https://www.osha.gov/video/respiratory_protection/voluntaryuse_transcript.html.
Please be aware that N95s are not protective against alpha-diketones (diacetyl, 2,3-pentanedione, or 2,3-hexanedione). In cases of dual exposure to dust and alpha-diketones, NIOSH-certified organic vapor cartridges (for the alpha-diketones) and particulate cartridges/filters (for the dust) would be warranted.
3. We did not formally assess noise during our visit. A noise survey would be necessary to determine the need for hearing protection and inclusion in a hearing conversation program. In the interim, continue to offer hearing protection for voluntary use.
Medical MonitoringThe purpose of a medical monitoring program is to help assure the health of employees who have workplace exposures (e.g., diacetyl, 2,3-pentanedione, green coffee beans/dust) known to pose risk for potentially serious health conditions such as asthma or obliterative bronchiolitis.
1. Institute a medical monitoring program for employees who work or assist in the production area and in the quality control laboratory. The medical monitoring should consist of evaluation with a questionnaire (to obtain health and work task information) and spirometry (to assess lung function) at baseline and at one year to monitor for

Page 36 Health Hazard Evaluation Report 2016-0012-3302
respiratory symptoms and to establish employees’ baseline in lung function and any abnormal decline in lung function in the first year. Subsequently, an annual questionnaire evaluation should occur to monitor for respiratory symptoms. New or worsening respiratory symptoms should prompt additional evaluation including spirometry. Details about spirometry and a medical monitoring program can be found in chapter 9 of the NIOSH Criteria Document [NIOSH 2016].
2. If an employee is identified as likely having lung disease from exposure to diacetyl or 2,3-pentanedione, it should be viewed as a sentinel event indicating that there was a breakdown in exposure controls and that there is potential risk for co-workers. Should this occur, the unanticipated source of exposure must be identified and brought under control. In addition, increased intensity of medical surveillance would be required for all employees performing similar job tasks or having similar or greater potential for exposure. The NIOSH Criteria Document provides detailed guidance on responses to such sentinel events [NIOSH 2016].
Smoking Cessation ProgramIn a workplace with risk of occupational lung disease, prevention of smoking-related lung disease is important and makes the detection of work-related adverse effects easier. We recommend implementing a smoking cessation program to assist employees to stop smoking. The Centers for Disease Control and Prevention offers tools and resources for setting up a smoking cessation program [CDC 2017].
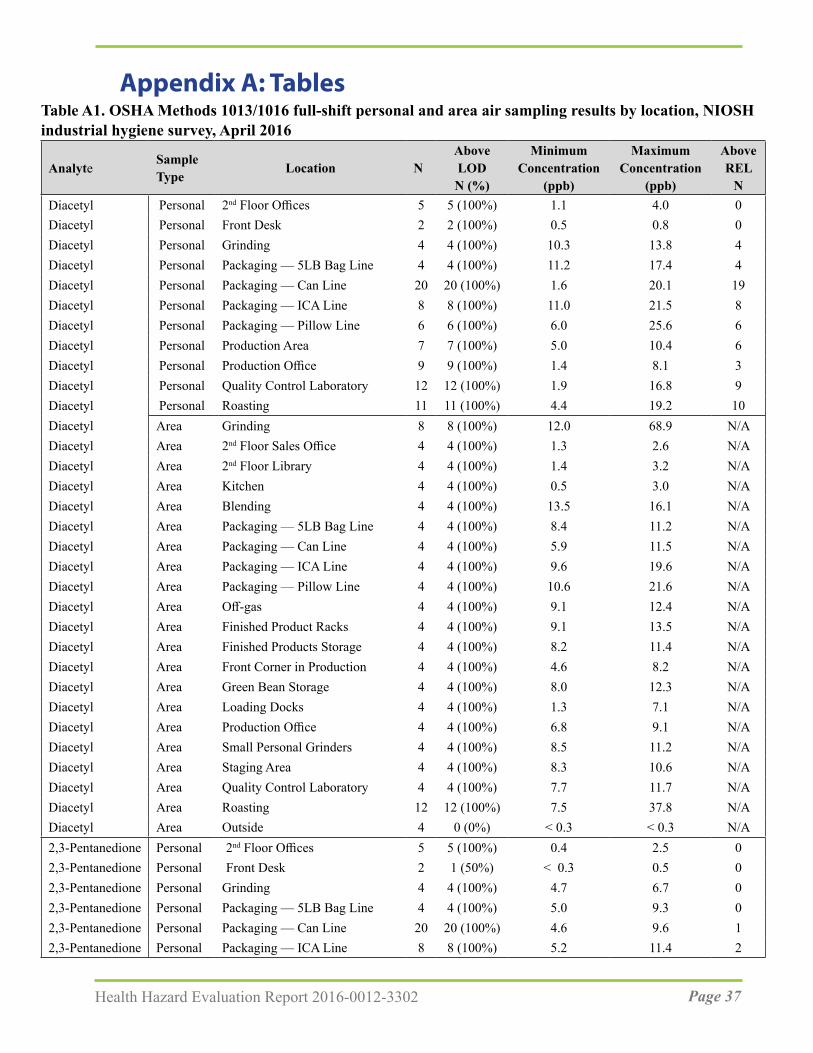
Page 37Health Hazard Evaluation Report 2016-0012-3302
Table A1. OSHA Methods 1013/1016 full-shift personal and area air sampling results by location, NIOSH industrial hygiene survey, April 2016
AnalyteSample Type Location N
AboveLODN (%)
MinimumConcentration
(ppb)
MaximumConcentration
(ppb)
AboveREL
NDiacetyl Personal 2nd Floor Offices 5 5 (100%) 1.1 4.0 0Diacetyl Personal Front Desk 2 2 (100%) 0.5 0.8 0Diacetyl Personal Grinding 4 4 (100%) 10.3 13.8 4Diacetyl Personal Packaging — 5LB Bag Line 4 4 (100%) 11.2 17.4 4Diacetyl Personal Packaging — Can Line 20 20 (100%) 1.6 20.1 19Diacetyl Personal Packaging — ICA Line 8 8 (100%) 11.0 21.5 8Diacetyl Personal Packaging — Pillow Line 6 6 (100%) 6.0 25.6 6Diacetyl Personal Production Area 7 7 (100%) 5.0 10.4 6Diacetyl Personal Production Office 9 9 (100%) 1.4 8.1 3Diacetyl Personal Quality Control Laboratory 12 12 (100%) 1.9 16.8 9Diacetyl Personal Roasting 11 11 (100%) 4.4 19.2 10Diacetyl Area Grinding 8 8 (100%) 12.0 68.9 N/ADiacetyl Area 2nd Floor Sales Office 4 4 (100%) 1.3 2.6 N/ADiacetyl Area 2nd Floor Library 4 4 (100%) 1.4 3.2 N/ADiacetyl Area Kitchen 4 4 (100%) 0.5 3.0 N/ADiacetyl Area Blending 4 4 (100%) 13.5 16.1 N/ADiacetyl Area Packaging — 5LB Bag Line 4 4 (100%) 8.4 11.2 N/ADiacetyl Area Packaging — Can Line 4 4 (100%) 5.9 11.5 N/ADiacetyl Area Packaging — ICA Line 4 4 (100%) 9.6 19.6 N/ADiacetyl Area Packaging — Pillow Line 4 4 (100%) 10.6 21.6 N/ADiacetyl Area Off-gas 4 4 (100%) 9.1 12.4 N/ADiacetyl Area Finished Product Racks 4 4 (100%) 9.1 13.5 N/ADiacetyl Area Finished Products Storage 4 4 (100%) 8.2 11.4 N/ADiacetyl Area Front Corner in Production 4 4 (100%) 4.6 8.2 N/ADiacetyl Area Green Bean Storage 4 4 (100%) 8.0 12.3 N/ADiacetyl Area Loading Docks 4 4 (100%) 1.3 7.1 N/ADiacetyl Area Production Office 4 4 (100%) 6.8 9.1 N/ADiacetyl Area Small Personal Grinders 4 4 (100%) 8.5 11.2 N/ADiacetyl Area Staging Area 4 4 (100%) 8.3 10.6 N/ADiacetyl Area Quality Control Laboratory 4 4 (100%) 7.7 11.7 N/ADiacetyl Area Roasting 12 12 (100%) 7.5 37.8 N/ADiacetyl Area Outside 4 0 (0%) < 0.3 < 0.3 N/A2,3-Pentanedione Personal 2nd Floor Offices 5 5 (100%) 0.4 2.5 02,3-Pentanedione Personal Front Desk 2 1 (50%) < 0.3 0.5 02,3-Pentanedione Personal Grinding 4 4 (100%) 4.7 6.7 02,3-Pentanedione Personal Packaging — 5LB Bag Line 4 4 (100%) 5.0 9.3 02,3-Pentanedione Personal Packaging — Can Line 20 20 (100%) 4.6 9.6 12,3-Pentanedione Personal Packaging — ICA Line 8 8 (100%) 5.2 11.4 2
Appendix A: Tables

Page 38 Health Hazard Evaluation Report 2016-0012-3302
AnalyteSample Type Location N
AboveLODN (%)
MinimumConcentration
(ppb)
MaximumConcentration
(ppb)
AboveREL
N2,3-Pentanedione Personal Packaging — Pillow Line 6 6 (100%) 3.4 15.8 12,3-Pentanedione Personal Production Area 7 7 (100%) 2.1 5.1 02,3-Pentanedione Personal Production Office 9 9 (100%) 0.6 5.1 02,3-Pentanedione Personal Quality Control Laboratory 12 12 (100%) 0.9 10.8 12,3-Pentanedione Personal Roasting 11 11 (100%) 2.7 10.2 22,3-Pentanedione Area Grinding 8 8 (100%) 5.2 31.4 N/A2,3-Pentanedione Area 2nd Floor Sales Office 4 4 (100%) 0.7 1.3 N/A2,3-Pentanedione Area 2nd Floor Library 4 3 (75%) < 0.2 1.5 N/A2,3-Pentanedione Area Kitchen 4 4 (100%) 0.3 1.5 N/A2,3-Pentanedione Area Blending 4 4 (100%) 6.3 8.3 N/A2,3-Pentanedione Area Packaging — 5LB Line 4 4 (100%) 4.3 6.4 N/A2,3-Pentanedione Area Packaging — Can Line 4 4 (100%) 2.3 6.3 N/A2,3-Pentanedione Area Packaging — ICA Line 4 4 (100%) 4.8 10.2 N/A2,3-Pentanedione Area Packaging — Pillow Line 4 4 (100%) 5.3 17.1 N/A2,3-Pentanedione Area Off-gas 4 4 (100%) 4.6 7.3 N/A2,3-Pentanedione Area Finished Product Racks 4 4 (100%) 4.4 7.7 N/A2,3-Pentanedione Area Finished Products Storage 4 4 (100%) 4.3 6.9 N/A2,3-Pentanedione Area Front Corner in Production 4 4 (100%) 2.4 3.7 N/A2,3-Pentanedione Area Green Bean Storage 4 4 (100%) 4.2 7.1 N/A2,3-Pentanedione Area Loading Docks 4 4 (100%) 1.1 2.7 N/A2,3-Pentanedione Area Production Office 4 4 (100%) 3.3 5.1 N/A2,3-Pentanedione Area Small Personal Grinders 4 4 (100%) 4.5 5.9 N/A2,3-Pentanedione Area Staging Area 4 4 (100%) 3.9 4.5 N/A2,3-Pentanedione Area Quality Control Laboratory 4 4 (100%) 3.6 7.6 N/A2,3-Pentanedione Area Roasting 12 12 (100%) 3.7 23.0 N/A2,3-Pentanedione Area Outside 4 0 (0%) <0.3 <0.3 N/A2,3-Hexanedione Personal 2nd Floor Offices 5 0 (0%) < 0.2 < 0.5 —2,3-Hexanedione Personal Front Desk 2 0 (0%) < 0.2 < 0.5 —2,3-Hexanedione Personal Grinding 4 0 (0%) < 0.2 < 0.5 —2,3-Hexanedione Personal Packaging — 5LB Bag Line 4 0 (0%) < 0.2 < 0.5 —2,3-Hexanedione Personal Packaging — Can Line 20 1 (5%) < 0.1 0.4 —2,3-Hexanedione Personal Packaging — ICA Line 8 0 (0%) < 0.2 < 0.5 —2,3-Hexanedione Personal Packaging — Pillow Line 6 0 (0%) < 0.1 < 0.6 —2,3-Hexanedione Personal Production Area 7 1 (14%) < 0.2 0.3 —2,3-Hexanedione Personal Production Office 9 0 (0%) < 0.2 < 0.5 —2,3-Hexanedione Personal Quality Control Laboratory 12 0 (0%) < 0.2 < 0.6 —2,3-Hexanedione Personal Roasting 11 1 (9%) < 0.2 0.4 —2,3-Hexanedione Area Grinding 8 2 (25%) < 0.2 1.4 —2,3-Hexanedione Area 2nd Floor Sales Office 4 0 (0%) < 0.2 < 0.5 —2,3-Hexanedione Area 2nd Floor Library 4 0 (0%) < 0.2 < 0.5 —
Table A1 (cont). OSHA Methods 1013/1016 full-shift personal and area air sampling results by location, NIOSH industrial hygiene survey, April 2016
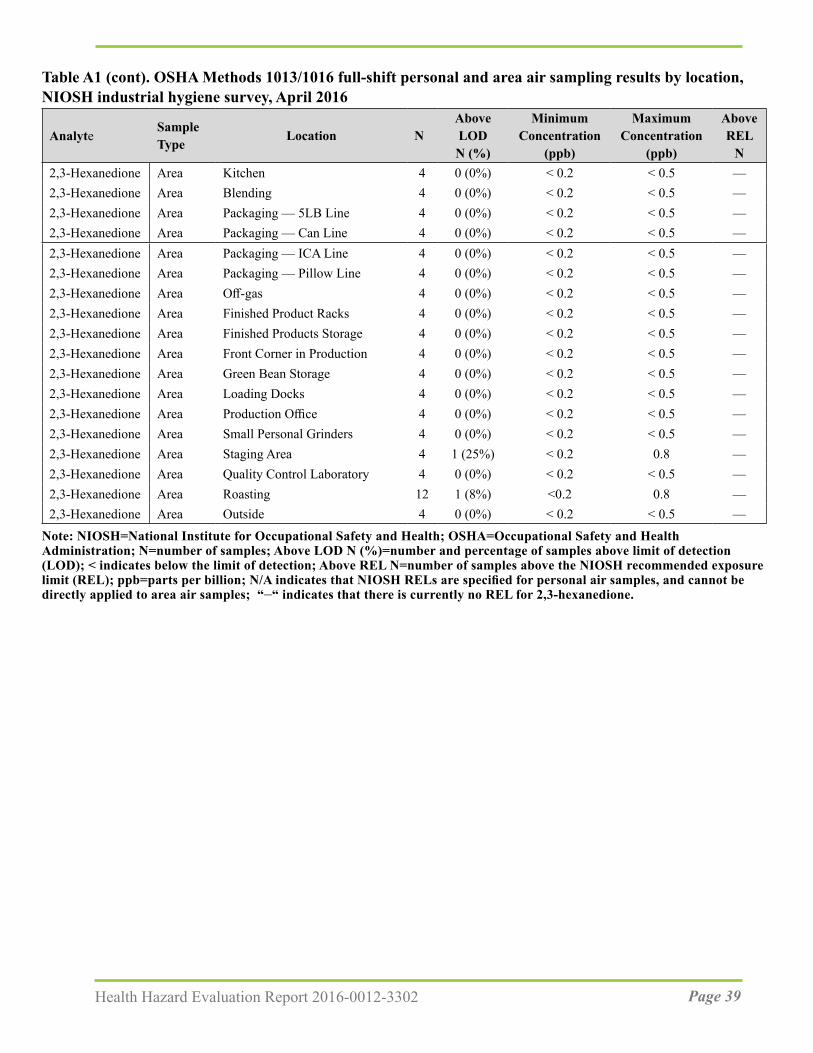
Page 39Health Hazard Evaluation Report 2016-0012-3302
AnalyteSample Type Location N
AboveLODN (%)
MinimumConcentration
(ppb)
MaximumConcentration
(ppb)
AboveREL
N2,3-Hexanedione Area Kitchen 4 0 (0%) < 0.2 < 0.5 —2,3-Hexanedione Area Blending 4 0 (0%) < 0.2 < 0.5 —2,3-Hexanedione Area Packaging — 5LB Line 4 0 (0%) < 0.2 < 0.5 —2,3-Hexanedione Area Packaging — Can Line 4 0 (0%) < 0.2 < 0.5 —2,3-Hexanedione Area Packaging — ICA Line 4 0 (0%) < 0.2 < 0.5 —2,3-Hexanedione Area Packaging — Pillow Line 4 0 (0%) < 0.2 < 0.5 —2,3-Hexanedione Area Off-gas 4 0 (0%) < 0.2 < 0.5 —2,3-Hexanedione Area Finished Product Racks 4 0 (0%) < 0.2 < 0.5 —2,3-Hexanedione Area Finished Products Storage 4 0 (0%) < 0.2 < 0.5 —2,3-Hexanedione Area Front Corner in Production 4 0 (0%) < 0.2 < 0.5 —2,3-Hexanedione Area Green Bean Storage 4 0 (0%) < 0.2 < 0.5 —2,3-Hexanedione Area Loading Docks 4 0 (0%) < 0.2 < 0.5 —2,3-Hexanedione Area Production Office 4 0 (0%) < 0.2 < 0.5 —2,3-Hexanedione Area Small Personal Grinders 4 0 (0%) < 0.2 < 0.5 —2,3-Hexanedione Area Staging Area 4 1 (25%) < 0.2 0.8 —2,3-Hexanedione Area Quality Control Laboratory 4 0 (0%) < 0.2 < 0.5 —2,3-Hexanedione Area Roasting 12 1 (8%) <0.2 0.8 —2,3-Hexanedione Area Outside 4 0 (0%) < 0.2 < 0.5 —
Note: NIOSH=National Institute for Occupational Safety and Health; OSHA=Occupational Safety and Health Administration; N=number of samples; Above LOD N (%)=number and percentage of samples above limit of detection (LOD); < indicates below the limit of detection; Above REL N=number of samples above the NIOSH recommended exposure limit (REL); ppb=parts per billion; N/A indicates that NIOSH RELs are specified for personal air samples, and cannot be directly applied to area air samples; “–“ indicates that there is currently no REL for 2,3-hexanedione.
Table A1 (cont). OSHA Methods 1013/1016 full-shift personal and area air sampling results by location, NIOSH industrial hygiene survey, April 2016
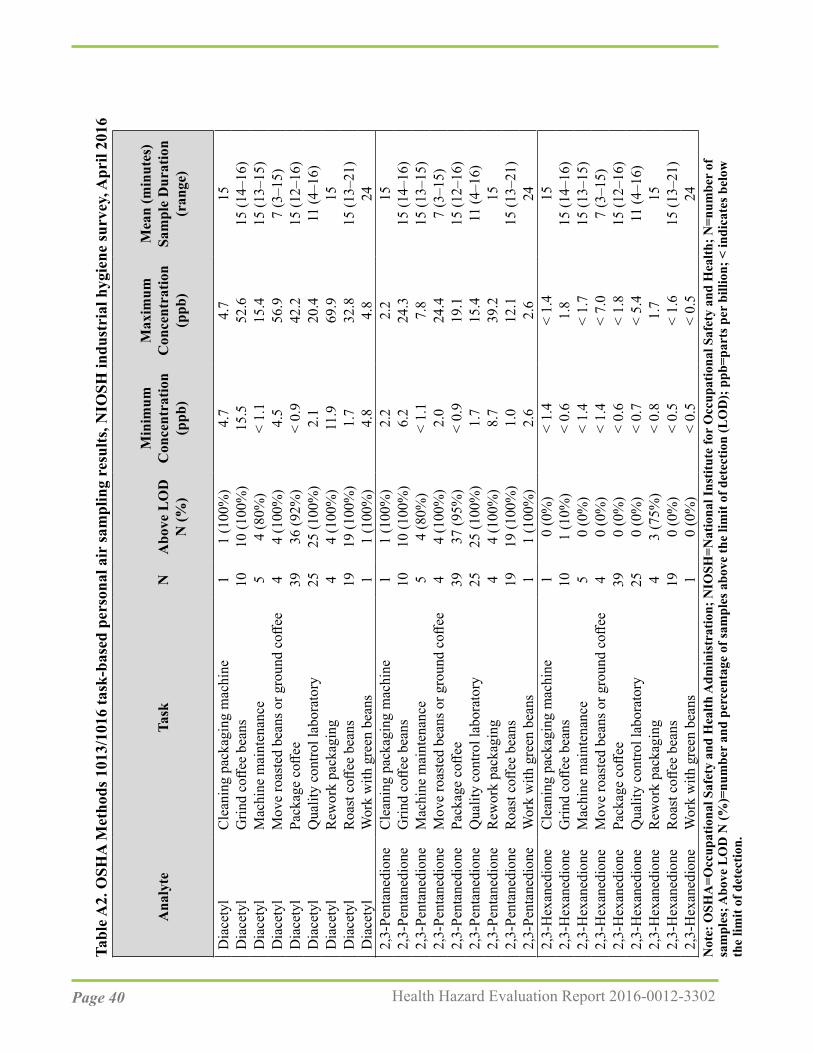
Page 40 Health Hazard Evaluation Report 2016-0012-3302
Tabl
e A2.
OSH
A M
etho
ds 1
013/
1016
task
-bas
ed p
erso
nal a
ir sa
mpl
ing
resu
lts, N
IOSH
indu
stri
al h
ygie
ne su
rvey
, Apr
il 20
16
Mea
n (m
inut
es)
Sam
ple
Dur
atio
n (r
ange
)
Max
imum
C
once
ntra
tion
(ppb
)
Min
imum
C
once
ntra
tion
(ppb
)A
bove
LO
D
N (%
)N
ask
TA
naly
te
Dia
cety
lC
lean
ing
pack
agin
g m
achi
ne1
1 (1
00%
)4.
74.
715
Dia
cety
lG
rind
coffe
e be
ans
1010
(100
%)
15.5
52.6
15 (1
4–16
)D
iace
tyl
Mac
hine
mai
nten
ance
54
(80%
)<
1.1
15.4
15 (1
3–15
)D
iace
tyl
Mov
e ro
aste
d be
ans o
r gro
und
coffe
e4
4 (1
00%
)4.
556
.97
(3–1
5)D
iace
tyl
Pack
age
coffe
e39
36 (9
2%)
< 0.
942
.215
(12–
16)
Dia
cety
lQ
ualit
y co
ntro
l lab
orat
ory
2525
(100
%)
2.1
20.4
11 (4
–16)
Dia
cety
lR
ewor
k pa
ckag
ing
44
(100
%)
11.9
69.9
15D
iace
tyl
Roa
st c
offee
bea
ns19
19 (1
00%
)1.
732
.815
(13–
21)
Dia
cety
lW
ork
with
gre
en b
eans
11
(100
%)
4.8
4.8
242,
3-Pe
ntan
edio
neC
lean
ing
pack
agin
g m
achi
ne1
1 (1
00%
)2.
22.
215
2,3-
Pent
aned
ione
Grin
d co
ffee
bean
s10
10 (1
00%
)6.
224
.315
(14–
16)
2,3-
Pent
aned
ione
Mac
hine
mai
nten
ance
54
(80%
)<
1.1
7.8
15 (1
3–15
)2,
3-Pe
ntan
edio
neM
ove
roas
ted
bean
s or g
roun
d co
ffee
44
(100
%)
2.0
24.4
7 (3
–15)
2,3-
Pent
aned
ione
Pack
age
coffe
e39
37 (9
5%)
< 0.
919
.115
(12–
16)
2,3-
Pent
aned
ione
Qua
lity
cont
rol l
abor
ator
y25
25 (1
00%
)1.
715
.411
(4–1
6)2,
3-Pe
ntan
edio
neR
ewor
k pa
ckag
ing
44
(100
%)
8.7
39.2
152,
3-Pe
ntan
edio
neR
oast
coff
ee b
eans
1919
(100
%)
1.0
12.1
15 (1
3–21
)2,
3-Pe
ntan
edio
neW
ork
with
gre
en b
eans
11
(100
%)
2.6
2.6
242,
3-H
exan
edio
neC
lean
ing
pack
agin
g m
achi
ne1
0 (0
%)
< 1.
4<
1.4
152,
3-H
exan
edio
neG
rind
coffe
e be
ans
101
(10%
)<
0.6
1.8
15 (1
4–16
)2,
3-H
exan
edio
neM
achi
ne m
aint
enan
ce5
0 (0
%)
< 1.
4<
1.7
15 (1
3–15
)2,
3-H
exan
edio
neM
ove
roas
ted
bean
s or g
roun
d co
ffee
40
(0%
)<
1.4
< 7.
07
(3–1
5)2,
3-H
exan
edio
nePa
ckag
e co
ffee
390
(0%
)<
0.6
< 1.
815
(12–
16)
2,3-
Hex
aned
ione
Qua
lity
cont
rol l
abor
ator
y25
0 (0
%)
< 0.
7<
5.4
11 (4
–16)
2,3-
Hex
aned
ione
Rew
ork
pack
agin
g4
3 (7
5%)
< 0.
81.
715
2,3-
Hex
aned
ione
Roa
st c
offee
bea
ns19
0 (0
%)
< 0.
5<
1.6
15 (1
3–21
)2,
3-H
exan
edio
neW
ork
with
gre
en b
eans
10
(0%
)<
0.5
< 0.
524
Not
e: O
SHA
=Occ
upat
iona
l Saf
ety
and
Hea
lth A
dmin
istr
atio
n; N
IOSH
=Nat
iona
l Ins
titut
e fo
r O
ccup
atio
nal S
afet
y an
d H
ealth
; N=n
umbe
r of
sa
mpl
es; A
bove
LO
D N
(%)=
num
ber
and
perc
enta
ge o
f sam
ples
abo
ve th
e lim
it of
det
ectio
n (L
OD
); p
pb=p
arts
per
bill
ion;
< in
dica
tes b
elow
th
e lim
it of
det
ectio
n.
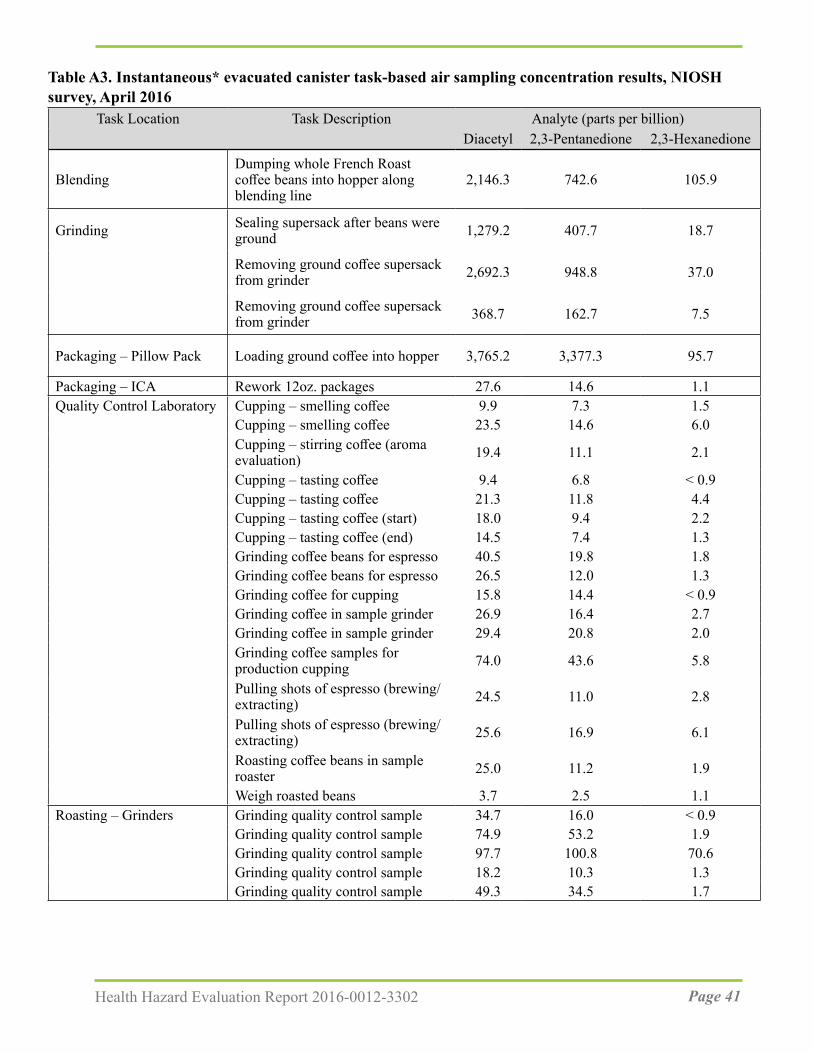
Page 41Health Hazard Evaluation Report 2016-0012-3302
Table A3. Instantaneous* evacuated canister task-based air sampling concentration results, NIOSH survey, April 2016
Task Location Task Description Analyte (parts per billion)Diacetyl 2,3-Pentanedione 2,3-Hexanedione
BlendingDumping whole French Roast coffee beans into hopper along blending line
2,146.3 742.6 105.9
Grinding Sealing supersack after beans were ground 1,279.2 407.7 18.7
Removing ground coffee supersack from grinder 2,692.3 948.8 37.0
Removing ground coffee supersack from grinder 368.7 162.7 7.5
Packaging – Pillow Pack Loading ground coffee into hopper 3,765.2 3,377.3 95.7
Packaging – ICA Rework 12oz. packages 27.6 14.6 1.1Quality Control Laboratory Cupping – smelling coffee 9.9 7.3 1.5
Cupping – smelling coffee 23.5 14.6 6.0Cupping – stirring coffee (aroma evaluation) 19.4 11.1 2.1
Cupping – tasting coffee 9.4 6.8 < 0.9Cupping – tasting coffee 21.3 11.8 4.4Cupping – tasting coffee (start) 18.0 9.4 2.2Cupping – tasting coffee (end) 14.5 7.4 1.3Grinding coffee beans for espresso 40.5 19.8 1.8Grinding coffee beans for espresso 26.5 12.0 1.3Grinding coffee for cupping 15.8 14.4 < 0.9Grinding coffee in sample grinder 26.9 16.4 2.7Grinding coffee in sample grinder 29.4 20.8 2.0Grinding coffee samples for production cupping 74.0 43.6 5.8
Pulling shots of espresso (brewing/extracting) 24.5 11.0 2.8
Pulling shots of espresso (brewing/extracting) 25.6 16.9 6.1
Roasting coffee beans in sample roaster 25.0 11.2 1.9
Weigh roasted beans 3.7 2.5 1.1Roasting – Grinders Grinding quality control sample 34.7 16.0 < 0.9
Grinding quality control sample 74.9 53.2 1.9Grinding quality control sample 97.7 100.8 70.6Grinding quality control sample 18.2 10.3 1.3Grinding quality control sample 49.3 34.5 1.7
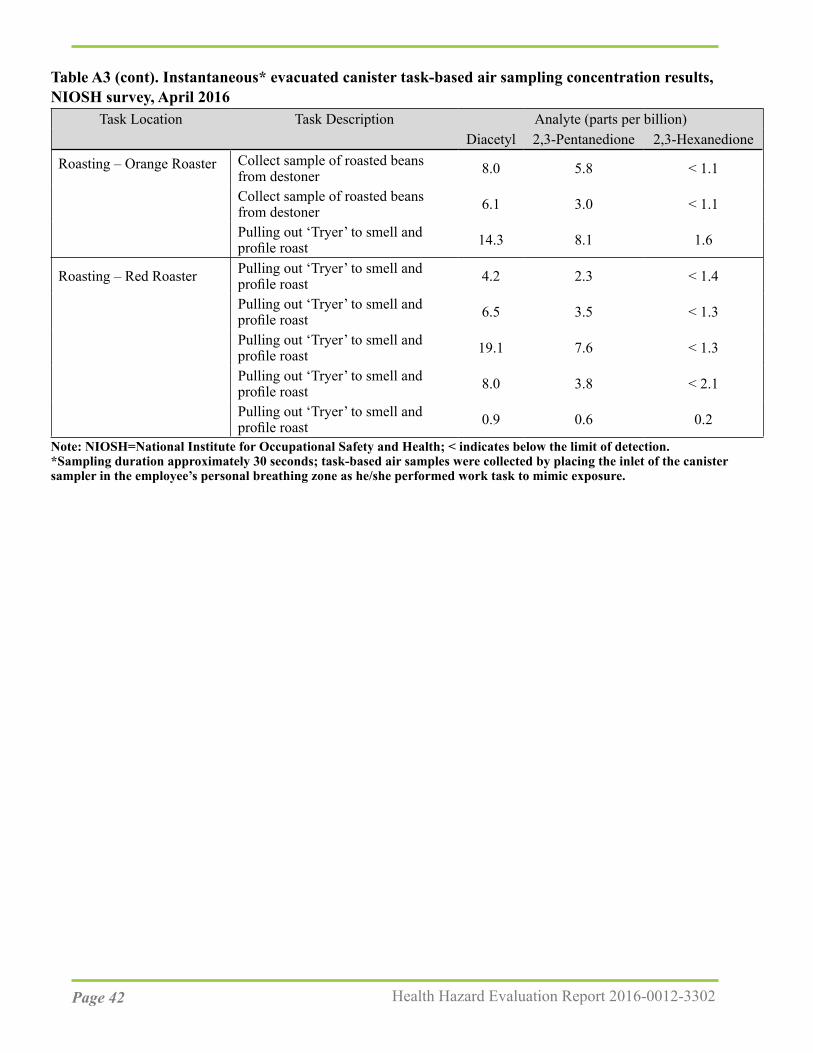
Page 42 Health Hazard Evaluation Report 2016-0012-3302
Task Location Task Description Analyte (parts per billion)Diacetyl 2,3-Pentanedione 2,3-Hexanedione
Roasting – Orange Roaster Collect sample of roasted beans from destoner 8.0 5.8 < 1.1
Collect sample of roasted beans from destoner 6.1 3.0 < 1.1
Pulling out ‘Tryer’ to smell and profile roast 14.3 8.1 1.6
Roasting – Red Roaster Pulling out ‘Tryer’ to smell and profile roast 4.2 2.3 < 1.4
Pulling out ‘Tryer’ to smell and profile roast 6.5 3.5 < 1.3
Pulling out ‘Tryer’ to smell and profile roast 19.1 7.6 < 1.3
Pulling out ‘Tryer’ to smell and profile roast 8.0 3.8 < 2.1
Pulling out ‘Tryer’ to smell and profile roast 0.9 0.6 0.2
Note: NIOSH=National Institute for Occupational Safety and Health; < indicates below the limit of detection.*Sampling duration approximately 30 seconds; task-based air samples were collected by placing the inlet of the canister sampler in the employee’s personal breathing zone as he/she performed work task to mimic exposure.
Table A3 (cont). Instantaneous* evacuated canister task-based air sampling concentration results, NIOSH survey, April 2016
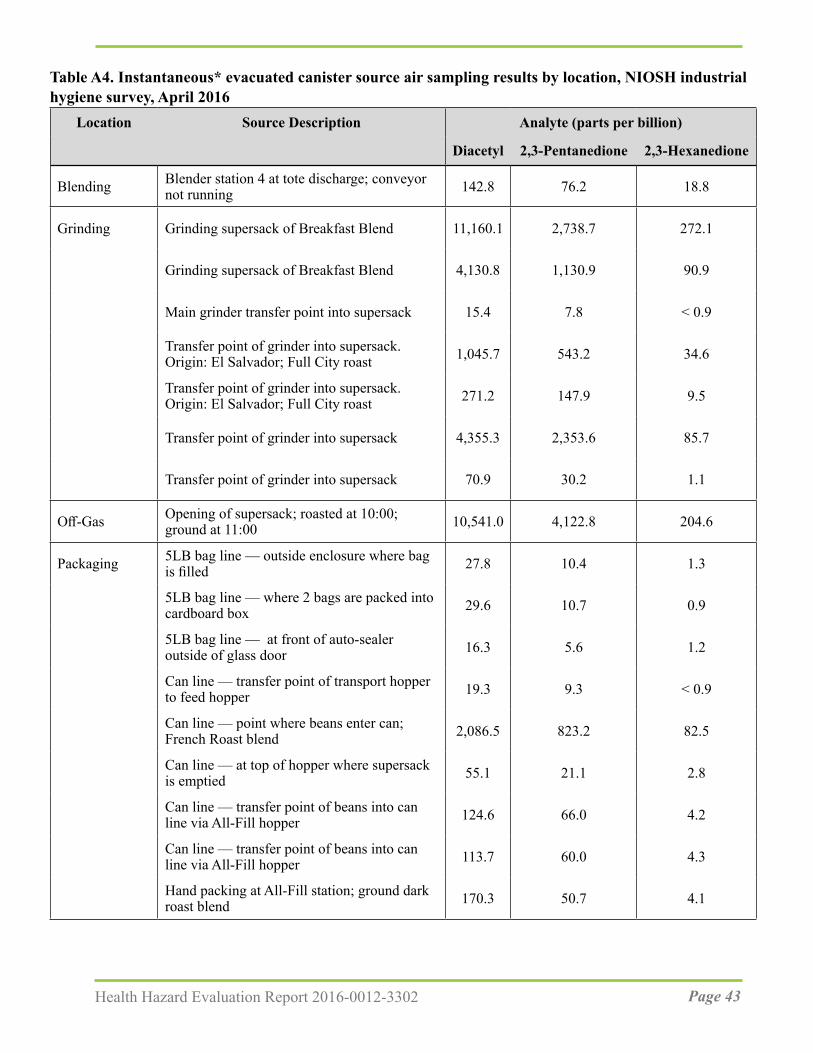
Page 43Health Hazard Evaluation Report 2016-0012-3302
Table A4. Instantaneous* evacuated canister source air sampling results by location, NIOSH industrial hygiene survey, April 2016
Location Source Description Analyte (parts per billion)
Diacetyl 2,3-Pentanedione 2,3-Hexanedione
Blending Blender station 4 at tote discharge; conveyor not running 142.8 76.2 18.8
Grinding Grinding supersack of Breakfast Blend 11,160.1 2,738.7 272.1
Grinding supersack of Breakfast Blend 4,130.8 1,130.9 90.9
Main grinder transfer point into supersack 15.4 7.8 < 0.9
Transfer point of grinder into supersack. Origin: El Salvador; Full City roast 1,045.7 543.2 34.6
Transfer point of grinder into supersack. Origin: El Salvador; Full City roast 271.2 147.9 9.5
Transfer point of grinder into supersack 4,355.3 2,353.6 85.7
Transfer point of grinder into supersack 70.9 30.2 1.1
Off-Gas Opening of supersack; roasted at 10:00; ground at 11:00 10,541.0 4,122.8 204.6
Packaging 5LB bag line — outside enclosure where bag is filled 27.8 10.4 1.3
5LB bag line — where 2 bags are packed into cardboard box 29.6 10.7 0.9
5LB bag line — at front of auto-sealer outside of glass door 16.3 5.6 1.2
Can line — transfer point of transport hopper to feed hopper 19.3 9.3 < 0.9
Can line — point where beans enter can; French Roast blend 2,086.5 823.2 82.5
Can line — at top of hopper where supersack is emptied 55.1 21.1 2.8
Can line — transfer point of beans into can line via All-Fill hopper 124.6 66.0 4.2
Can line — transfer point of beans into can line via All-Fill hopper 113.7 60.0 4.3
Hand packing at All-Fill station; ground dark roast blend 170.3 50.7 4.1
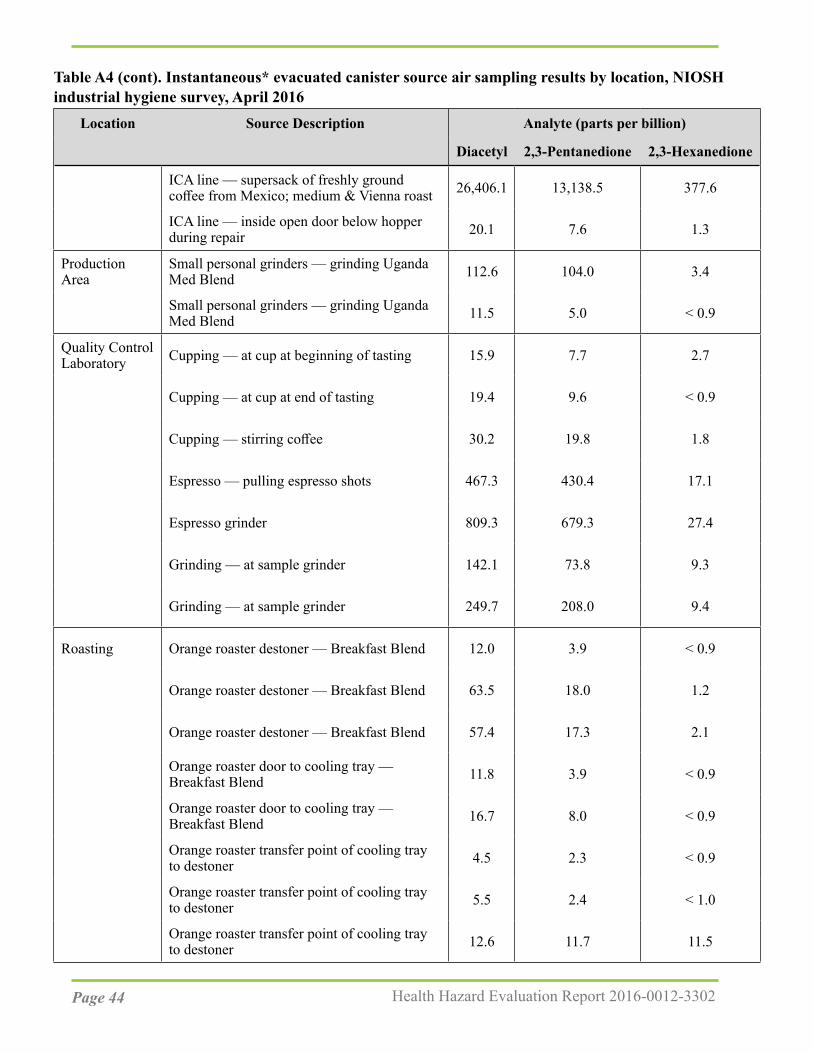
Page 44 Health Hazard Evaluation Report 2016-0012-3302
Location Source Description Analyte (parts per billion)
Diacetyl 2,3-Pentanedione 2,3-Hexanedione
ICA line — supersack of freshly ground coffee from Mexico; medium & Vienna roast 26,406.1 13,138.5 377.6
ICA line — inside open door below hopper during repair 20.1 7.6 1.3
Production Area
Small personal grinders — grinding Uganda Med Blend 112.6 104.0 3.4
Small personal grinders — grinding Uganda Med Blend 11.5 5.0 < 0.9
Quality Control Laboratory Cupping — at cup at beginning of tasting 15.9 7.7 2.7
Cupping — at cup at end of tasting 19.4 9.6 < 0.9
Cupping — stirring coffee 30.2 19.8 1.8
Espresso — pulling espresso shots 467.3 430.4 17.1
Espresso grinder 809.3 679.3 27.4
Grinding — at sample grinder 142.1 73.8 9.3
Grinding — at sample grinder 249.7 208.0 9.4
Roasting Orange roaster destoner — Breakfast Blend 12.0 3.9 < 0.9
Orange roaster destoner — Breakfast Blend 63.5 18.0 1.2
Orange roaster destoner — Breakfast Blend 57.4 17.3 2.1
Orange roaster door to cooling tray — Breakfast Blend 11.8 3.9 < 0.9
Orange roaster door to cooling tray — Breakfast Blend 16.7 8.0 < 0.9
Orange roaster transfer point of cooling tray to destoner 4.5 2.3 < 0.9
Orange roaster transfer point of cooling tray to destoner 5.5 2.4 < 1.0
Orange roaster transfer point of cooling tray to destoner 12.6 11.7 11.5
Table A4 (cont). Instantaneous* evacuated canister source air sampling results by location, NIOSH industrial hygiene survey, April 2016
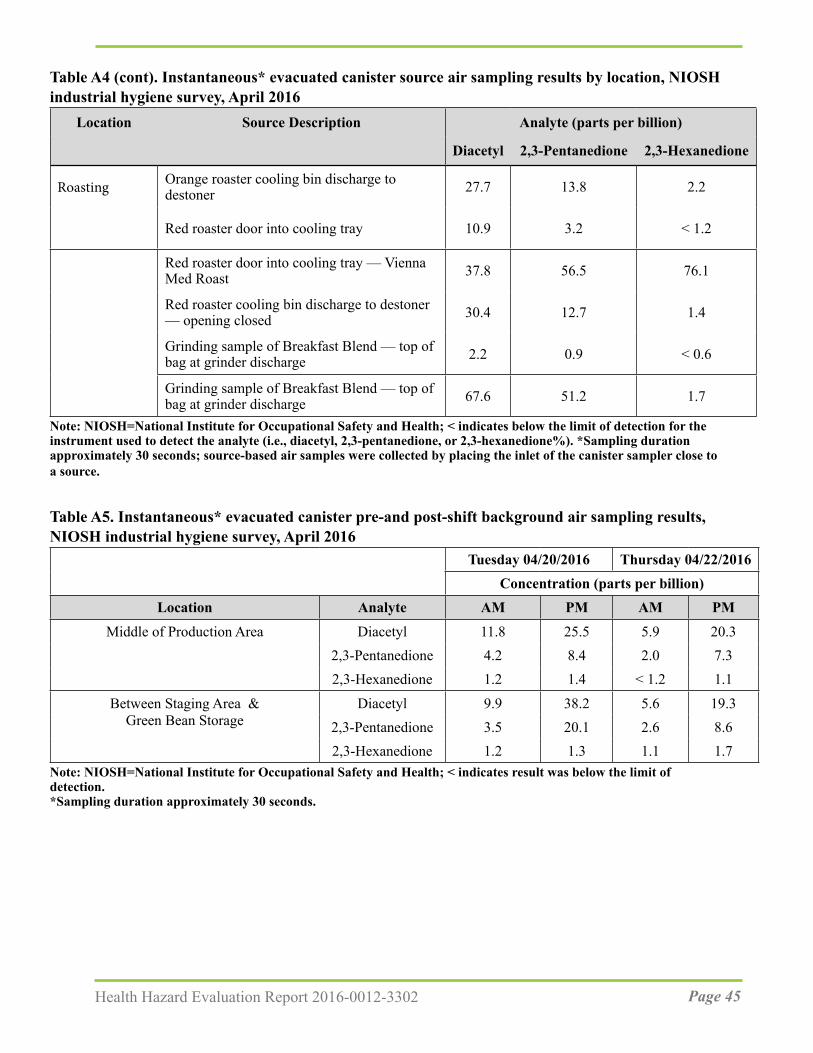
Page 45Health Hazard Evaluation Report 2016-0012-3302
Location Source Description Analyte (parts per billion)
Diacetyl 2,3-Pentanedione 2,3-Hexanedione
Roasting Orange roaster cooling bin discharge to destoner 27.7 13.8 2.2
Red roaster door into cooling tray 10.9 3.2 < 1.2
Red roaster door into cooling tray — Vienna Med Roast 37.8 56.5 76.1
Red roaster cooling bin discharge to destoner — opening closed 30.4 12.7 1.4
Grinding sample of Breakfast Blend — top of bag at grinder discharge 2.2 0.9 < 0.6
Grinding sample of Breakfast Blend — top of bag at grinder discharge 67.6 51.2 1.7
Note: NIOSH=National Institute for Occupational Safety and Health; < indicates below the limit of detection for the instrument used to detect the analyte (i.e., diacetyl, 2,3-pentanedione, or 2,3-hexanedione%). *Sampling duration approximately 30 seconds; source-based air samples were collected by placing the inlet of the canister sampler close to a source.
Table A5. Instantaneous* evacuated canister pre-and post-shift background air sampling results, NIOSH industrial hygiene survey, April 2016
Tuesday 04/20/2016 Thursday 04/22/2016Concentration (parts per billion)
Location Analyte AM PM AM PM
Middle of Production Area Diacetyl 11.8 25.5 5.9 20.32,3-Pentanedione 4.2 8.4 2.0 7.32,3-Hexanedione 1.2 1.4 < 1.2 1.1
Between Staging Area & Diacetyl 9.9 38.2 5.6 19.3Green Bean Storage 2,3-Pentanedione 3.5 20.1 2.6 8.6
2,3-Hexanedione 1.2 1.3 1.1 1.7Note: NIOSH=National Institute for Occupational Safety and Health; < indicates result was below the limit of detection.*Sampling duration approximately 30 seconds.
Table A4 (cont). Instantaneous* evacuated canister source air sampling results by location, NIOSH industrial hygiene survey, April 2016

Page 46 Health Hazard Evaluation Report 2016-0012-3302
Table A6. Bulk coffee sample results using headspace analysis, NIOSH industrial hygiene survey, April 2016
Bulk Sample Description Analyte (parts per billion)Bean Type Origin Roast Diacetyl 2,3-Pentanedione 2,3-Hexanedione
Whole Peru Decaf Vienna 2124.7 1638.1 <Ground Peru Decaf Vienna 402.4 389.3 <Whole Honduran Dark Medium 1171.3 1462.8 <Ground Honduran Dark Medium 871.4 1004.4 <Whole Mexican Medium 865.6 927 271.7Ground Mexican Medium 450.1 805 <Whole Peru Decaf Full City 1806.4 2005.1 <Ground Peru Decaf Full City 934.1 1096.9 <Whole Honduran/Peru French 974.7 421.5 <Ground Honduran/Peru French 314.0 105.8 300.8Ground Mexican Medium & Vienna 704.4 681.5 222.8
Note: NIOSH=National Institute for Occupational Safety and Health; < indicates result was below the limit of detection.
Table A7. Real-time air monitoring for carbon dioxide, carbon monoxide, total volatile organic compound, temperature, relative humidity, NIOSH industrial hygiene survey, April 2016
Location CO2 ppm CO ppm TVOC ppm Temp °F RH %
Off-gas Area 610 1.4 735 67.6 37.8
Main Grinder: to right of discharge 596 7.7 — 69 34.7
Main Grinder: to left of discharge 749 25.7 3,270 69.3 22.4
Main Grinder: behind grinder 770 6.6 953 71.7 30.0
Red Roaster 666 3.9 985 72.3 20.6
Roaster Sample Grinders 794 5.8 1,171 72.2 29.1
Can Line 553 7.8 1,251 73.3 36.9
ICA Line 576 6.2 1,207 72.5 38.2
Note: NIOSH=National Institute for Occupational Safety and Health; CO2=carbon dioxide; CO=carbon monoxide; TVOC=total volatile organic compound; ppm=parts per million; °F=degrees Fahrenheit; RH %=percent relative humidity; —=not measured
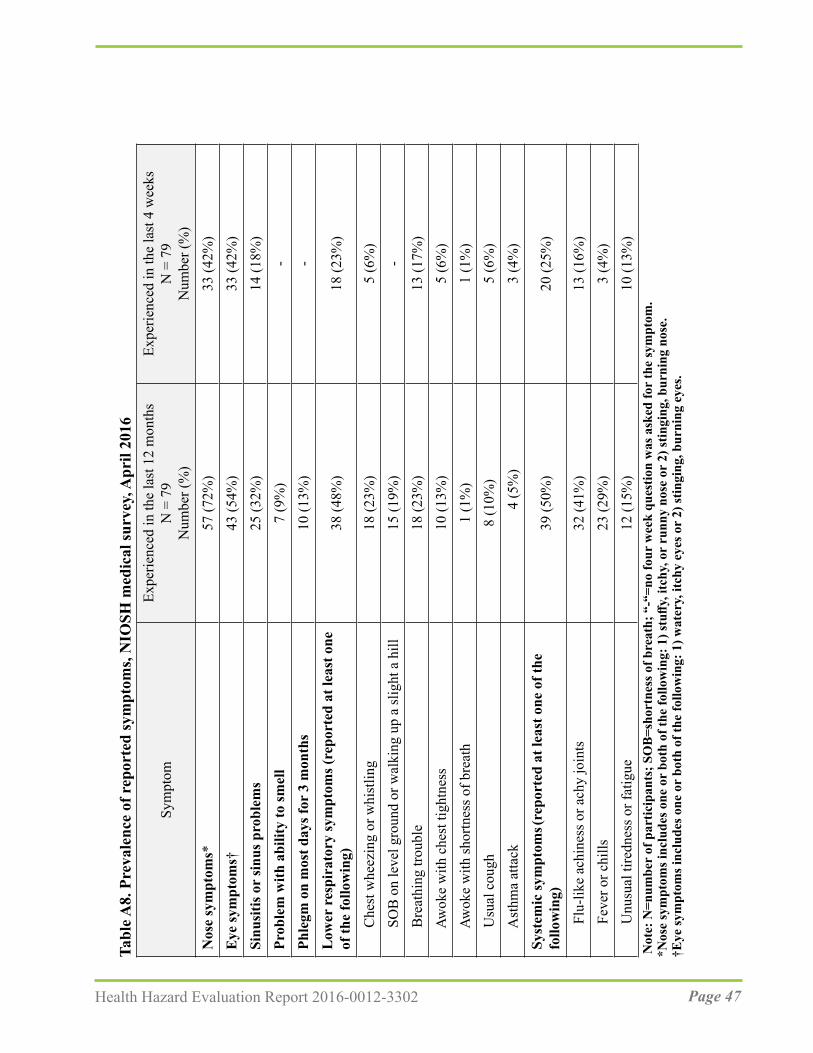
Page 47Health Hazard Evaluation Report 2016-0012-3302
Tabl
e A8.
Pre
vale
nce
of r
epor
ted
sym
ptom
s, N
IOSH
med
ical
surv
ey, A
pril
2016
sEx
perie
nced
in th
e la
st 4
wee
kN
= 7
9N
umbe
r (%
)
Expe
rienc
ed in
the
last
12
mon
ths
N =
79
Num
ber (
%)
Sym
ptom
Nos
e sy
mpt
oms*
57
(72%
)33
(42%
)E
ye sy
mpt
oms†
43
(54%
)33
(42%
)Si
nusi
tis o
r si
nus p
robl
ems
25 (3
2%)
14 (1
8%)
Prob
lem
with
abi
lity
to sm
ell
7 (9
%)
-Ph
legm
on
mos
t day
s for
3 m
onth
s10
(13%
)-
Low
er r
espi
rato
ry sy
mpt
oms (
repo
rted
at l
east
one
of
the
follo
win
g)38
(48%
)18
(23%
)
Che
st w
heez
ing
or w
hist
ling
18 (2
3%)
5 (6
%)
SOB
on
leve
l gro
und
or w
alki
ng u
p a
slig
ht a
hill
15 (1
9%)
-
B
reat
hing
trou
ble
18 (2
3%)
13 (1
7%)
Awok
e w
ith c
hest
tigh
tnes
s10
(13%
)5
(6%
)
Aw
oke
with
shor
tnes
s of b
reat
h1
(1%
)1
(1%
)
U
sual
cou
gh8
(10%
)5
(6%
)
A
sthm
a at
tack
4
(5%
)3
(4%
)Sy
stem
ic sy
mpt
oms (r
epor
ted
at le
ast o
ne o
f the
fo
llow
ing)
39 (5
0%)
20 (2
5%)
Flu
-like
ach
ines
s or a
chy
join
ts
32 (4
1%)
13 (1
6%)
Fev
er o
r chi
lls23
(29%
)3
(4%
)
U
nusu
al ti
redn
ess o
r fat
igue
12 (1
5%)
10 (1
3%)
Not
e: N
=num
ber
of p
artic
ipan
ts; S
OB
=sho
rtne
ss o
f bre
ath;
“-“
=no
four
wee
k qu
estio
n w
as a
sked
for
the
sym
ptom
. *N
ose
sym
ptom
s inc
lude
s one
or
both
of t
he fo
llow
ing:
1) s
tuffy
, itc
hy, o
r ru
nny
nose
or
2) st
ingi
ng, b
urni
ng n
ose.
†Eye
sym
ptom
s inc
lude
s one
or
both
of t
he fo
llow
ing:
1) w
ater
y, it
chy
eyes
or
2) st
ingi
ng, b
urni
ng e
yes.
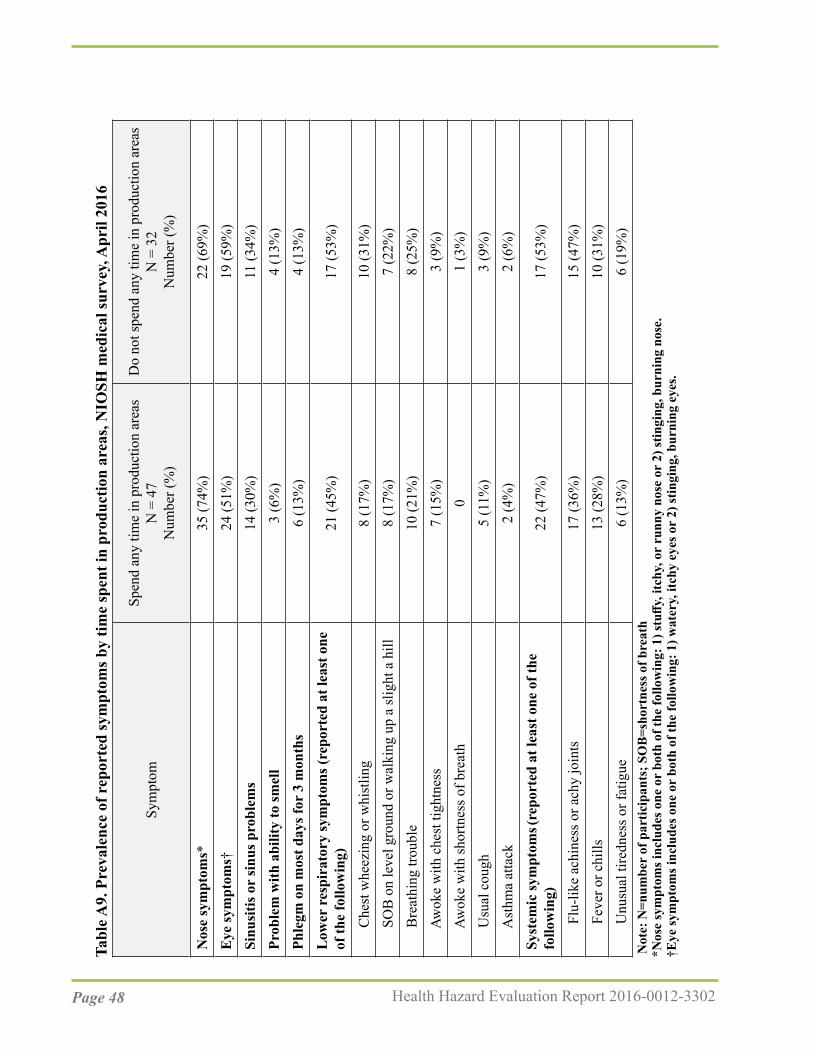
Page 48 Health Hazard Evaluation Report 2016-0012-3302
Tabl
e A9.
Pre
vale
nce
of r
epor
ted
sym
ptom
s by
time
spen
t in
prod
uctio
n ar
eas,
NIO
SH m
edic
al su
rvey
, Apr
il 20
16
Spen
d an
y tim
e in
pro
duct
ion
area
sD
o no
t spe
nd a
ny ti
me
in p
rodu
ctio
n ar
eas
N =
32
Num
ber (
%)
N =
47
Num
ber (
%)
Sym
ptom
Nos
e sy
mpt
oms*
35
(74%
)22
(69%
)E
ye sy
mpt
oms†
24
(51%
)19
(59%
)Si
nusi
tis o
r si
nus p
robl
ems
14 (3
0%)
11 (3
4%)
Prob
lem
with
abi
lity
to sm
ell
3 (6
%)
4 (1
3%)
Phle
gm o
n m
ost d
ays f
or 3
mon
ths
6 (1
3%)
4 (1
3%)
Low
er r
espi
rato
ry sy
mpt
oms (
repo
rted
at l
east
one
of
the
follo
win
g)21
(45%
)17
(53%
)
Che
st w
heez
ing
or w
hist
ling
8 (1
7%)
10 (3
1%)
SOB
on
leve
l gro
und
or w
alki
ng u
p a
slig
ht a
hill
8 (1
7%)
7 (2
2%)
Bre
athi
ng tr
oubl
e10
(21%
)8
(25%
)
Aw
oke
with
che
st ti
ghtn
ess
7 (1
5%)
3 (9
%)
Awok
e w
ith sh
ortn
ess o
f bre
ath
01
(3%
)
U
sual
cou
gh5
(11%
)3
(9%
)
A
sthm
a at
tack
2 (4
%)
2 (6
%)
Syst
emic
sym
ptom
s (rep
orte
d at
leas
t one
of t
he
follo
win
g)22
(47%
)17
(53%
)
Flu
-like
ach
ines
s or a
chy
join
ts
17 (3
6%)
15 (4
7%)
Fev
er o
r chi
lls13
(28%
)10
(31%
)
U
nusu
al ti
redn
ess o
r fat
igue
6 (1
3%)
6 (1
9%)
Not
e: N
=num
ber
of p
artic
ipan
ts; S
OB
=sho
rtne
ss o
f bre
ath
*Nos
e sy
mpt
oms i
nclu
des o
ne o
r bo
th o
f the
follo
win
g: 1
) stu
ffy, i
tchy
, or
runn
y no
se o
r 2)
stin
ging
, bur
ning
nos
e.†E
ye sy
mpt
oms i
nclu
des o
ne o
r bo
th o
f the
follo
win
g: 1
) wat
ery,
itch
y ey
es o
r 2)
stin
ging
, bur
ning
eye
s.
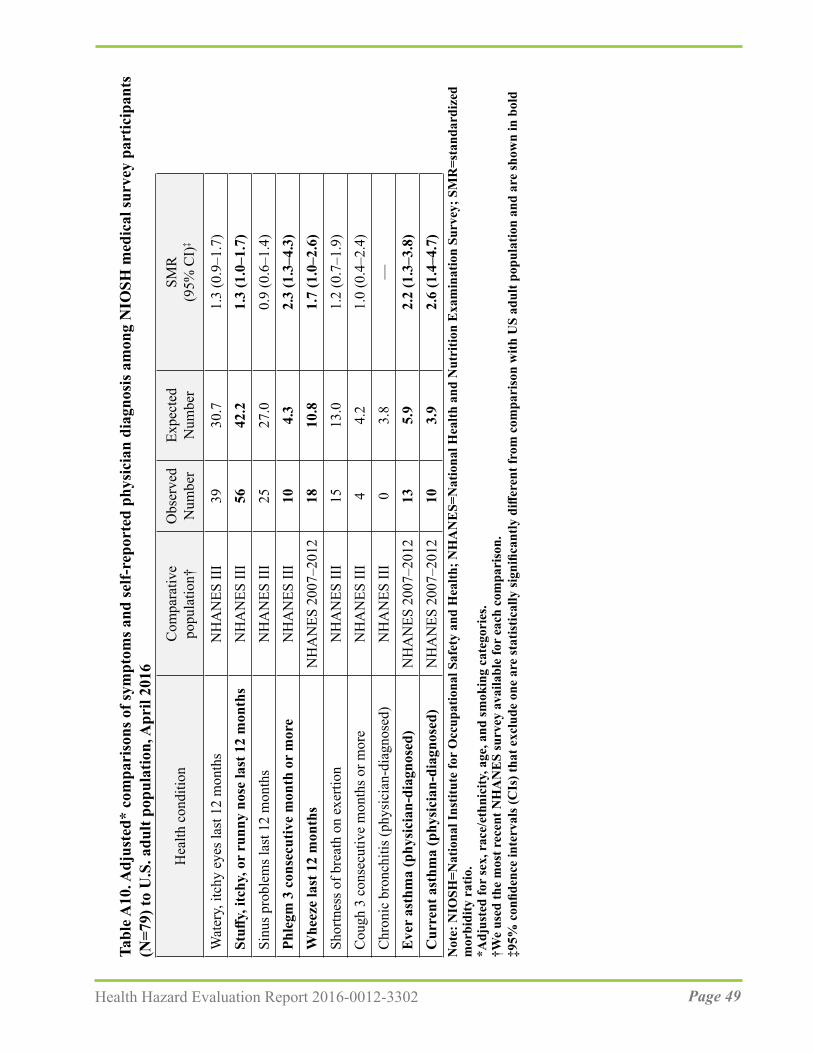
Page 49Health Hazard Evaluation Report 2016-0012-3302
Tabl
e A10
. Adj
uste
d* c
ompa
riso
ns o
f sym
ptom
s and
self-
repo
rted
phy
sici
an d
iagn
osis
am
ong
NIO
SH m
edic
al su
rvey
par
ticip
ants
(N
=79)
to U
.S. a
dult
popu
latio
n, A
pril
2016
‡SM
R(9
5% C
I)Ex
pect
ed
Num
ber
Obs
erve
d N
umbe
rC
ompa
rativ
e po
pula
tion†
Hea
lth c
ondi
tion
Wat
ery,
itch
y ey
es la
st 1
2 m
onth
s
N
HA
NES
III
3930
.71.
3 (0
.9–1
.7)
Stuff
y, it
chy,
or
runn
y no
se la
st 1
2 m
onth
s N
HA
NES
III
5642
.21.
3 (1
.0–1
.7)
Sinu
s pro
blem
s las
t 12
mon
ths
NH
AN
ES II
I25
27.0
0.9
(0.6
–1.4
)Ph
legm
3 c
onse
cutiv
e m
onth
or
mor
eN
HA
NES
III
104.
32.
3 (1
.3–4
.3)
Whe
eze
last
12
mon
ths
NH
AN
ES 2
007–
2012
1810
.81.
7 (1
.0–2
.6)
Shor
tnes
s of b
reat
h on
exe
rtion
N
HA
NES
III
1513
.01.
2 (0
.7–1
.9)
Cou
gh 3
con
secu
tive
mon
ths o
r mor
eN
HA
NES
III
44.
21.
0 (0
.4–2
.4)
Chr
onic
bro
nchi
tis (p
hysi
cian
-dia
gnos
ed)
NH
AN
ES II
I0
3.8
—E
ver
asth
ma
(phy
sici
an-d
iagn
osed
)N
HA
NES
200
7–20
1213
5.9
2.2
(1.3
–3.8
)C
urre
nt a
sthm
a (p
hysi
cian
-dia
gnos
ed)
NH
AN
ES 2
007–
2012
103.
92.
6 (1
.4–4
.7)
Not
e: N
IOSH
=Nat
iona
l Ins
titut
e fo
r O
ccup
atio
nal S
afet
y an
d H
ealth
; NH
AN
ES=
Nat
iona
l Hea
lth a
nd N
utri
tion
Exa
min
atio
n Su
rvey
; SM
R=s
tand
ardi
zed
mor
bidi
ty r
atio
.*A
djus
ted
for
sex,
rac
e/et
hnic
ity, a
ge, a
nd sm
okin
g ca
tego
ries
. †W
e us
ed th
e m
ost r
ecen
t NH
AN
ES
surv
ey a
vaila
ble
for
each
com
pari
son.
‡9
5% c
onfid
ence
inte
rval
s (C
Is) t
hat e
xclu
de o
ne a
re st
atis
tical
ly si
gnifi
cant
ly d
iffer
ent f
rom
com
pari
son
with
US
adul
t pop
ulat
ion
and
are
show
n in
bol
d

Page 50 Health Hazard Evaluation Report 2016-0012-3302
ReferencesACGIH (American Conference of Governmental Industrial Hygienist) [2017a]. 2017 TLVs® and BEIs®: Threshold limit values for chemical substances and physical agents and biological exposure indices. Cincinnati, OH: American Conference of Governmental Industrial Hygienists.
ACGIH [2017b]. Chemicals Substances and Other Issues Under Study (TLV®-CS). Available at: http://www.acgih.org/tlv-bei-guidelines/documentation-publications-and-data/under-study-list/chemical-substances-and-other-issues-under-study-tlv. Date accessed: January 2018.
Akiyama M, Murakami K, Ohtani N, Iwatsuki K, Sotoyama K, Wada A, Tokuno K, Iwabuchi H, Tanaka K [2003]. Analysis of volatile compounds released during the grinding of roasted coffee beans using solid-phase microextraction. J Agric Food Chem 51(7):1961-1969.
Akpinar-Elci M, Travis WD, Lynch DA, Kreiss K [2004]. Bronchiolitis obliterans syndrome in popcorn production plant workers. Eur Respir J 24(2):298-302.
Anderson BA, Shimoni E, Liardon R, Labuza P [2003]. The diffusion kinetics of carbon dioxide in fresh roasted and ground coffee. J Food Eng 59:71-78.
Bailey RL, Cox-Ganser JM, Duling MG, LeBouf RF, Martin SB Jr, Bledsoe TA, Green BJ, Kreiss K [2015]. Respiratory morbidity in a coffee processing workplace with sentinel obliterative bronchiolitis cases. Am J Ind Med 58(12):1235-1245.
Berger KI, Reibman J, Oppenheimer BW, Vlahos I, Harrison D, Goldring RM [2013]. Lessons from the World Trade Center disaster: airway disease presenting as restrictive dysfunction. Chest 144(1):249-257.
Burney PGJ and Chinn S [1987]. Developing a new questionnaire for measuring the prevalence and distribution of asthma. Chest 91(6 Suppl):79S-83S.
Burney PG, Laitinen LA, Perdrizet S, Huckauf H, Tattersfield AE, Chinn S, Poisson N, Heeren A, Britton JR, Jones T [1989]. Validity and repeatability of the IUATLD (1984) Bronchial symptoms questionnaire: an international comparison. Eur Respir J 2(10):940-945.
Burney PGJ, Luczynska C, Chinn S, Jarvis D [1994]. The European community respiratory health survey. Eur Respir J 7(5):954-960.
CDC (Centers for Disease Control and Prevention) [1996]. Third National Health and Nutrition Examination Survey, 1988–1994, NHANES III Examination Data File [CDROM]. Hyattsville, Maryland: U.S. Department of Health and Human Services, Centers for Disease Control and Prevention. (Public use data file documentation No. 76300.)

Page 51Health Hazard Evaluation Report 2016-0012-3302
CDC [2013]. Obliterative bronchiolitis in workers in a coffee-processing facility—Texas, 2008–2012. Morb Mortal Wkly Rep 62(16):305–307.
CDC [2017]. Smoking & tobacco use: quit smoking. Available at: https://www.cdc.gov/tobacco/quit_smoking/index.htm. Date accessed: January 2018.
CDC [2018]. National Center for Health Statistics. National Health and Nutrition Examination Survey Data. Hyattsville, MD: U.S. Department of Health and Human Services, Centers for Disease Control and Prevention, [2007-2012] Available at: https://wwwn.cdc.gov/nchs/nhanes/default.aspx. Date accessed: January 2018.
CFR. Code of Federal Regulations. Washington, DC: U.S. Government Printing Office, Office of the Federal Register.
Daglia M, Papetti A, Aceti C, Sordelli B, Spini V, Gazzani G [2007]. Isolation and determination of α-dicarbonyl compounds by RP-HPLC-DAD in green and roasted coffee. J Agric and Food Chem 55(22):8877-8882.
Day G, LeBouf R, Grote A, Pendergrass S, Cummings K, Kreiss K, and Kullman G [2011]. Identification and measurement of diacetyl substitutes in dry bakery mix production. J Occ Env Hygiene 8(2):93-103.
de Assumpção MS, Gonçalves RM, Martins R, Bobbio TG, Schivinski CI [2016]. Reference equations for impulse oscillometry system parameters in healthy Brazilian children and adolescents. Respir Care 61(8):1090-1099.
Desiraju K, Agrawal A [2016]. Impulse oscillometry: The state-of-art for lung function testing. Lung India 33(4):410-416.
Duling MG, LeBouf RF, Cox-Ganser JM, Kreiss K, Martin SB Jr, Bailey RL [2016]. Environmental characterization of a coffee processing workplace with obliterative bronchiolitis in former workers. J Occup Environ Hyg 13(10):770-781.
Dweik RA, Boggs PB, Erzurum SC, Irvin CG, Leigh MW, Lundberg JO, Olin AC, Plummer AL, Taylor DR; American Thoracic Society Committee on Interpretation of Exhaled Nitric Oxide Levels (FENO) for Clinical Applications [2011]. An official ATS clinical practice guideline: interpretation of exhaled nitric oxide levels (FENO) for clinical applications. Am J Respir Crit Care Med 184(5):602-615.
EAACI Task Force on Occupational Rhinitis, Moscato G, Vandenplas O, Gerth Van Wijk R, Malo JL, Quirce S, Walusiak J, Castano R, De Groot H, Folletti I, Gautrin D, Yacoub MR, Perfetti L, Siracusa A [2008]. Occupational rhinitis. Allergy 63(8):969-980.
http://www.ncbi.nlm.nih.gov/pubmed/?term=Cox-Ganser JM%5BAuthor%5D&cauthor=true&cauthor_uid=27105025
Page 52 Health Hazard Evaluation Report 2016-0012-3302
ECRHS (European Community Respiratory Health Survey)[2014]. Questionnaires, protocols and instructions. Available at: http://www.ecrhs.org/Quests.htm. Date accessed: January 2018. Ferris BG [1978]. Epidemiology standardization project. Am Rev Respir Dis 118(Suppl):1–53.
Figley KD, Rawling FF [1950] Castor bean: an industrial hazard as a contaminant of green coffee dust and used burlap bags. J Allergy 21:545–553.
Grassi M, Rezzani C, Biino G, Marinoni A [2003]. Asthma-like symptoms assessment through ECRHS screening questionnaire scoring. J Clin Epidemiol 56(3):238–247.
Hankinson JL, Odencrantz JR, Fedan KB [1999]. Spirometric reference values from a sample of the general U.S. population. Am J Respir Crit Care Med 159(1):179-187.
Henneberger PK, Redlich CA, Callahan DB, Harber P, Lemière C, Martin J, Tarlo SM, Vandenplas O, Torén K; ATS Ad Hoc Committee on Work-Exacerbated Asthma [2011]. An official American Thoracic Society statement: work-exacerbated asthma. Am J Respir Crit Care Med 184(3):368–378.
Hubbs AF, Cumpston AM, Goldsmith WT, Battelli LA, Kashon ML, Jackson MC, Frazer DG, Fedan JS, Goravanahally MP, Castranova V, Kreiss K, Willard PA, Friend S, Schwegler- Berry D, Fluharty KL, Sriram K [2012]. Respiratory and olfactory cytotoxicity of inhaled 2,3-pentanedione in Sprague-Dawley rats. Am J Pathol 181(3):829-844.
Kanwal R, Kullman G, Piacitelli C, Boylstein R, Sahakian N, Martin S, Fedan K, Kreiss K [2006]. Evaluation of flavorings-related lung disease risk at six microwave popcorn plants.J Occup Environ Med. 48(2):149-57.
Karr RM, Davies RJ, Butcher BT, Lehrer SB, Wilson MR, Dharmarajan V, Salvaggio JE [1978]. Occupational asthma. J Allergy Clin Immunol 61(1):54–65.
Kim TJ, Materna BL, Prudhomme JC, Fedan KB, Enright PL, Sahakian NM, Windham GC, Kreiss K [2010]. Industry-wide medical surveillance of California flavor manufacturing workers: Cross-sectional results. Am J Ind Med 53(9):857-865.
King MS, Eisenberg R, Newman JH, Tolle JJ, Harrell FE Jr, Nian H, Ninan M, Lambright ES, Sheller JR, Johnson JE, Miller RF [2011]. Constrictive bronchiolitis in soldiers returning from Iraq and Afghanistan. N Engl J Med 365(3):222–230.
Komarow HD, Myles IA, Uzzaman A, Metcalfe DD [2011]. Impulse oscillometry in the evaluation of diseases of the airways in children. Ann Allergy Asthma Immunol 106(3):191-199.
Page 53Health Hazard Evaluation Report 2016-0012-3302
Kreiss K [2013]. Occupational causes of constrictive bronchiolitis. Curr Opin Allergy Clin Immunol 13(2):167-72.
Langford NJ [2005]. Carbon dioxide poisoning. Toxicol Rev 24(4):229-235.
LeBouf RF, Stefaniak AB, Virji, MA [2012]. Validation of evacuated canisters for sampling volatile organic compounds in healthcare settings. J Environ Monit 14(3):977–983.
LeBouf RF, Simmons M [2017]. Increased sensitivity of OSHA method analysis of diacetyl and 2,3-pentanedione in air. J Occup Environ Hyg 14(5):343-348.
Lee JY, Seo JH, Kim HY, Jung YH, Kwon JW, Kim BJ, Kim HB, Lee SY, Jang GC, Song DJ, Kim WK, Shim JY, Kim HJ, Shin YJ, Park JW, Cho SH, Lee JS, Hong SJ [2012]. Reference values of impulse oscillometry and its utility in the diagnosis of asthma in young Korean children. J Asthma 49(8):811-816.
Lehrer SB, Karr RM, Salvaggio JE [1978]. Extraction and analysis of coffee bean allergens. Clin Allergy 8(3):217-226.
Malmberg LP, Pelkonen A, Poussa T, Pohianpalo A, Haahtela T, Turpeinen M [2002]. Determinants of respiratory system input impedance and bronchodilator response in healthy Finnish preschool children. Clin Physiol Funct Imaging 22(1):64-71.
Miller MR, Hankinson J, Brusasco V, Burgos F, Casaburi R, Coates A, Crapo R, Enright P, van der Grinten CP, Gustafsson P, Jensen R, Johnson DC, MacIntyre N, McKay R, Navajas D, Pedersen OF, Pellegrino R, Viegi G, Wanger J, ATS/ERS Task Force [2005]. Standardisation of spirometry. Eur Respir J 26(2):319-338.
Morgan DL, Jokinen MP, Price HC, Gwinn WM, Palmer SM, Flake GP [2012]. Bronchial and bronchiolar fibrosis in rats exposed to 2,3-pentanedione vapors: implications for bronchiolitis obliterans in humans. Toxicol Pathol 40(3):448-465.
Morgan DL, Jokinen MP, Johnson CL, Price HC, Gwinn WM, Bousquet RW, Flake GP [2016]. Chemical reactivity and respiratory toxicity of the α-diketone flavoring agents: 2,3-butanedione, 2,3-pentanedione, and 2,3-hexanedione. Toxicol Pathol 44(5):763–783.
Newbury W, Crockett A, Newbury J [2008]. A pilot study to evaluate Australian predictive equations for the impulse oscillometry system. Respirology 13(7):1070-1075.
Newton J [2002]. Carbon monoxide exposure from coffee roasting. Appl Occup Environ Hyg 17(9):600-602.
NIOSH (National Institute for Occupational Safety and Health) [1998]. Occupational noiseexposure. DHHS (NIOSH) Publication Number 98-126. Available at: http://www.cdc.gov/niosh/docs/98-126/. Date accessed: January 2018.

Page 54 Health Hazard Evaluation Report 2016-0012-3302
NIOSH [2003]. NIOSH manual of analytical methods (NMAM®). 4th ed. Schlecht PC, O’Connor PF, eds. Cincinnati, OH: U.S. Department of Health and Human Services, Centers for Disease Control and Prevention, National Institute for Occupational Safety and Health, DHHS (NIOSH) Publication 94–113 (August 1994); 1st Supplement Publication 96–135, 2nd Supplement Publication 98–119; 3rd Supplement 2003–154. Available at: http://www.cdc.gov/niosh/docs/2003-154/. Date accessed: January 2018.
NIOSH [2004]. NIOSH respirator selection logic. Cincinnati, OH: U.S. Department of Health and Human Services, Public Health Service, Centers for Disease Control, National Institute for Occupational Safety and Health, DHHS (NIOSH). Publication No. 2005-100. Available at: http://www.aresok.org/npg/nioshdbs/docs/2005-100/chapter2.html. Date accessed: January 2018.
NIOSH [2010]. NIOSH pocket guide to chemical hazards. Cincinnati, OH: U.S. Department of Health and Human Services, Centers for Disease Control and Prevention, National Institute for Occupational Safety and Health, DHHS (NIOSH) Publication No. 2010-168c. Available at: http://www.cdc.gov/niosh/npg/. Date accessed: January 2018.
NIOSH [2012]. Flavoring-related lung disease. Information for healthcare providers. Department of Health and Human Services, Centers for Disease Control and Prevention, DHHS (NIOSH) Publication No. 2012-148 (supersedes 2012-107). Available at: http://www.cdc.gov/niosh/docs/2012-148/. Date accessed: January 2018
NIOSH [2016]. Flavorings-related lung disease: coffee processing facilities. Available at: http://www.cdc.gov/niosh/topics/flavorings/processing.html. Date assessed: January 2018.
Nishimura F, Abe S, Fukunaga T [2003]. Carbon monoxide poisoning from industrial coffee extraction. JAMA 290(3):334.
Oldenburg M, Bittner C, Baur X [2009]. Health risks due to coffee dust. Chest 136(2):536 --544.
Oppenheimer BW, Goldring RM, Herberg ME, Hofer IS, Reyfman PA, Liautaud S, Rom WN, Reibman J, Berger KI [2007]. Distal airway function in symptomatic subjects with normal spirometry following World Trade Center dust exposure. Chest 132(4):1275–1282.
OSHA (Occupational Safety and Health Administration) [1993]. Compliance and Enforcement Activities Affected by the PELs Decision. August 5, 1993 Memorandum. Available at: https://www.osha.gov/pls/oshaweb/owadisp.show_document?p_table=INTERPRETATIONS&p_id=21220. Date accessed: January 2018.
OSHA [2003]. Enforcement Policy for Respiratory Hazards Not Covered by OSHA Permissible Exposure Limits. January 24, 2003 Memorandum. Available at: https://www.osha.gov/pls/oshaweb/owadisp.show_document?p_table=INTERPRETATIONS&p_id=24749. Date accessed: January 2018.
Page 55Health Hazard Evaluation Report 2016-0012-3302
OSHA [2008]. Sampling and analytical methods: Method 1013 – Acetoin and diacetyl. Available at: http://www.osha.gov/dts/sltc/methods/validated/1013/1013.html. Date accessed: January 2018.
OSHA [2010]. Sampling and analytical methods: Method 1016 – 2,3-pentanedione. Available at: http://www.osha.gov/dts/sltc/methods/validated/1016/1016.html. Date accessed: January 2018.
OSHA [2014]. OSHA Fact sheet: Do you have work-related asthma? A guide for you and your doctor. Washington, D.C.: U.S. Department of Labor, Occupational Safety and Health Administration. Available at: https://www.osha.gov/Publications/OSHA3707.pdf. Date accessed: January 2018.
OSHA [2017]. Permissible exposure limits – annotated tables. Available at: https://www.osha.gov/dsg/annotated-pels/index.html. Date assessed: January 2018.
Park JH, Yoon JW, Shin YH, Jee HM, Wee YS, Chang SJ, Sim JH, Yum HY, Han MY [2011]. Reference values for respiratory system impedence using impulse oscillometry in healthy preschool children. Korean J Pediatr 54(2)64-68.
Pellegrino R, Viegi G, Brusasco V, Crapo RO, Burgos F, Casaburi R, Coates A, van der Grinten CP, Gustafsson P, Hankinson J, Jensen R, Johnson DC, MacIntyre N, McKay R, Miller MR, Navajas D, Pedersen OF, Wanger J [2005]. Interpretative strategies for lung function tests. Eur Respir J 26(5):948–968.
Raffel JB, Thompson J [2013]. Carbon monoxide from domestic coffee roasting: a case report. Ann Intern Med 159(11):795-796.
Rondón C, Campo P, Galindo L, Blanca-López N, Cassinello MS, Rodriguez-Bada JL, Torres MJ, Blanca M [2012]. Prevalence and clinical relevance of local allergic rhinitis. Allergy. 67(10):1282-1288.
Rondón C, Bogas G, Barrionuevo E, Blanca M, Torres MJ, Campo P [2017]. Nonallergic rhinitis and lower airway disease. Allergy 72(1):24-34.
Rose JJ, Wang L, Xu Q, McTiernan CF, Shiva S, Tejero J, Gladwin MT [2017]. Carbon monoxide poisoning: pathogenesis, management, and future directions of therapy. Am J Respir Crit Care Med 195(5):596-606.
Sahay S, Gera K, Bhargava SK, Shah A [2016]. Occurrence and impact of sinusitis in patients with asthma and/or allergic rhinitis. J Asthma 53(6):635-643.
Sakwari G, Mamuya SH, Bråtveit M, Moen BE [2013]. Respiratory symptoms, exhaled nitric oxide, and lung function among workers in Tanzanian coffee factories. J Occup Environ Med 55(5):544-551.

Page 56 Health Hazard Evaluation Report 2016-0012-3302
Shaaban R, Zureik M, Soussan D, Neukirch C, Heinrich J, Sunyer J, Wjst M, Cerveri I, Pin I, Bousquet J, Jarvis D, Burney PG, Neukirch F, Leynaert B [2008]. Rhinitis and onset of asthma: a longitudinal population-based study. Lancet. 372(9643):1049-1057.
Shi Y, Aledia AS, Tatavoosian AV, Vijayalakshmi S, Galant SP, George SC [2012]. Relating small airways to asthma control by using impulse oscillometry in children.Allergy Clin Immunol 129(3):671-678.
Schulz H, Flexeder C, Behr J, Heier M, Holle R, Huber RM, Jörres RA, Nowak D, Peters A, Wichmann HE, Heinrich J, Karrasch S; KORA Study Group [2013]. Reference values of impulse oscillometric lung function indices in adults of advanced age. PLoS One 8(5):e63366. doi: 10.1371/journal.pone.0063366.
Schulze J, Biedebach S, Christmann M, Herrmann E, Voss S, Zielen S [2016]. Impulse oscillometry as a predictor of asthma exacerbations in young children. Respiration 91(2):107-114.
Smith HJ, Reinhold P, Goldman MD [2005]. Forced oscillation technique and impulse oscillometry. In: Gosselink R, Stam H, eds. European Respiratory Monograph 31: Lung Function Testing. Vol. 10. Wakefield, UK: European Respiratory Society Journals, pp. 72–105.
Smith HJ ([email protected]) [2015]. Questions about impulse oscillometry. Email of December 9, 2015, from Hans-Juergen Smith, CareFusion, to Rachel Bailey ([email protected]), Respiratory Health Division, National Institute for Occupational Safety and Health, Centers for Disease Control and Prevention, Department of Health and Human Services.
Song TW, Kim KW, Kim ES, Park JW, Sohn MH, Kim KE [2008]. Utility of impulse oscillometry in young children with asthma. Pediatr Allergy Immunol 19(8):763-768.
Tarlo SM, Lemiere C [2014]. Occupational asthma. N Engl J Med 370:640-649.
Tarlo SM [2016]. Update on work-exacerbated asthma. Int J Occup Med Environ Health 29(3):369-374.
Thomas KE, Trigg CJ, Baxter PJ, Topping M, Lacey J, Crook B, Whitehead P, Bennett JB, Davies RJ. [1991]. Factors relating to the development of respiratory symptoms in coffee process workers. Br J Ind Med 48(5):314–322.
Vogel J, Smidt U [1994] Impulse oscillometry. Analysis of lung mechanics in general practice and clinic, epidemiological and experimental research. 1st ed. Frankfurt: PMI-Verlagsgruppe.
Page 57Health Hazard Evaluation Report 2016-0012-3302
Weinstein DJ, Hull JE, Ritchie BL, Hayes JA, Morris MJ [2016]. Exercise-associated excessive dynamic airway collapse in military personnel. Ann Am Thorac Soc 13(9):1476-1482.
Zuskin E, Valić F, Skurić Z [1979]. Respiratory function in coffee workers. Br J Ind Med 36(2):117–122.
Zuskin E, Kanceljak B, Skurić Z, Butković D [1985]. Bronchial reactivity in green coffee exposure. Br J Ind Med 42(6):415-420.
Zuskin E, Schachter EN, Kanceljak B, Witek TJ Jr, Fein E [1993]. Organic dust disease of airways. Int Arch Occup Environ Health 65(2):135-140.

Page 58 Health Hazard Evaluation Report 2016-0012-3302
This page left intentionally blank
Page 59Health Hazard Evaluation Report 2016-0012-3302
Keywords: NAICS 311920 (Coffee roasting), Massachusetts, diacetyl, 2,3-pentanedione, 2,3-hexanedione, coffee, carbon monoxide, carbon dioxide, volatile organic compounds (VOCs).
Page 60 Health Hazard Evaluation Report 2016-0012-3302
The Health Hazard Evaluation Program investigates possible health hazards in the workplace under the authority of the Occupational Safety and Health Act of 1970 (29 U.S.C. § 669(a)(6)). The Health Hazard Evaluation Program also provides, upon request, technical assistance to federal, state, and local agencies to investigate occupational health hazards and to prevent occupational disease or injury. Regulations guiding the Program can be found in Title 42, Code of Federal Regulations, Part 85; Requests for Health Hazard Evaluations (42 CPR Part 85).
Disclaimer The recommendations in this report are made on the basis of the findings at the workplace evaluated and may not be applicable to other workplaces.
Mention of any company or product in this report does not constitute endorsement by the National Institute for Occupational Safety and Health (NIOSH).
Citations to Web sites external to NIOSH do not constitute NIOSH endorsement of the sponsoring organizations or their programs or products. NIOSH is not responsible for the content of these Web sites. All Web addresses referenced in this document were accessible as of the publication date.
AcknowledgmentsDesktop Publisher: Tia McClelland Data Analysis Support: Nicole Edwards and Brian TiftLaboratory Support: Dru Burns, Kyle Hatcher, Ryan LeBouf, Anand RanparaSite Visit Team Members: Marcia Stanton, Randall Nett, Randy Boylstein, Matthew Duling, Nicole Edwards, Kathleen Fedan, Jason Ham, Michael Humann, Robert Lawrence, Stephen Martin Jr., Chris Mugford, Alice Shumate, Brian Tift, and Sandy White
Availability of ReportCopies of this report have been sent to the employer and employees at the facility. The state health department and the Occupational Safety and Health Administration Regional Office have also received a copy. This report is not copyrighted and may be freely reproduced.
This report is available at http://www.cdc.gov/niosh/hhe/reports/pdfs/2016-0012-3302.pdf.
All other Health Hazard Evaluation Reports may be found at http://www2a.cdc.gov/hhe/search.asp.
Recommended citation for this report:NIOSH [2018]. Health hazard evaluation report: Evaluation of exposures and respiratory health at a coffee roasting and packaging facility. By Stanton ML, Martin SB, Nett RJ. Morgantown, WV: U.S. Department of Health and Human Services, Centers for Disease Control and Prevention, National Institute for Occupational Safety and Health, NIOSH HHE Report No. 2016-0016-3302

To receive documents or other information aboutoccupational safety and health topics, contact NIOSH
Telephone: 1-800-CDC-INFO (1-800-232-4636)TTY: 1-888-232-6348email: [email protected] visit the NIOSH website at http://www.cdc.gov/niosh
Delivering on the Nation’s promise:Safety and health at work for all people through research and prevention