SECY-21-0055: Weekly Information Report Week Ending May 21 ...

Page 1Health Hazard Evaluation Report 2012-0055-3337
Evaluation of exposures and respiratory health concerns in a paper converting equipment manufacturing facility
Report No. 2012-0055-3337February 2019
Marcia L. Stanton, BS Randall J. Nett, MD, MPH
U.S. Department of Health and Human ServicesCenters for Disease Control and PreventionNational Institute for Occupational Safety and Health

Page 2 Health Hazard Evaluation Report 2012-0055-3337
ContentsHighlights .................................................................................. i
Abbreviations ........................................................................ vii
Summary .................................................................................. 1
Introduction ............................................................................. 4
Process Description ................................................................. 4
Methods ................................................................................... 6
Results ....................................................................................17
Discussion ..............................................................................41
Conclusions ............................................................................46
Recommendations.................................................................47
Appendix A: Methods ............................................................52
Appendix B: Tables ................................................................54
Appendix C: Tracer Gas Testing ............................................95
Appendix D: Microbiome Analysis .....................................100
References ............................................................................127
Acknowledgements .............................................................137
The employer is required to post a copy of this report for 30 days at or near the workplace(s) of affected employees. The employer must take steps to ensure that the posted report is not altered, defaced, or covered by other material.
The cover photo is a close-up image of sorbent tubes, which are used by the HHEProgram to measure airborne exposures. This photo is an artistic representation that maynot be related to this Health Hazard Evaluation.

Page iHealth Hazard Evaluation Report 2012-0055-3337
We conducted surveys at a paper converting equipment manufacturing facility in 2013 and 2016 to evaluate whether workers had respiratory disease and to look for potential respiratory hazards. In the 2013 visit, we identified four non-smoking employees who had an unusual respiratory disease involving the deep lung (lymphocytic bronchiolitis with extension into alveolar ducts and emphysema). An additional employee with this disease was identified after our 2016 visit. We confirmed this unusual disease by arranging for five different pathologists to review lung tissue samples from employees with the disease. We evaluated processes and materials used in the facility and did extensive environmental sampling, including using advanced techniques to evaluate for bacteria in process fluids. We did not identify any unusual exposures and none of the exposure levels measured exceeded regulatory standards. Thus, we were not able to identify the specific agent(s) responsible for this disease. While not certain, indications that workplace exposures at the facility contributed to development of lung disease include the following: 1) an unusual and advanced lung disease was identified in a cluster of five employees all working in the production area of a single manufacturing facility; 2) the five employees lived in three separate communities in the greater area and had no shared exposures to respiratory hazards outside of work that we could ascertain; 3) respiratory symptom onset for each of the five employees began after beginning work at the facility; and 4) other cases of this unusual and advanced lung disease were not recognized by physicians in the community, or at a regional medical center or tertiary referral center. Based on what we found, we recommend engineering controls to maintain production-related airborne exposures to the lowest level feasible and administrative controls to ensure that only those who need to be in production areas are present. We also recommend consideration of providing respiratory protection in the form of disposable filtering facepiece respirators with any P- or R-series particulate filter for voluntary use by employees who enter the production area. We also recommend implementing a medical monitoring program that includes periodic spirometry for employees who work in the production area so that disease can be detected early, should it occur again.
Highlights of this EvaluationThe Health Hazard Evaluation Program of the National Institute for Occupational Safety and Health received a confidential request from employees at a paper converting equipment manufacturing facility who were concerned about workplace exposures to and health effects from machining processes. Early in the investigation, we identified four employees who had developed severe lung disease, including one employee who required lung transplantation.
What We Did ● In June 2012, we conducted an initial
walkthrough of the facility; interviewed employees, managers, and the company’s nurse; observed employees at work; and collected bulk samples of both unused (neat) and in-use process fluids. Bulk fluid samples collected from the facility were subsequently analyzed for bacteria, fungi, mycobacteria, and endotoxin.
● We identified four individuals with history of employment in the facility who had severe lung disease. To better understand their lung disease, we conducted medical record reviews and requested lung tissue specimens that had been obtained by their healthcare providers. We arranged for these specimens to be reviewed by pathologists. We also made plans to conduct detailed industrial hygiene and medical surveys in an effort to better understand what might have caused the cases of severe lung disease, so future cases could be prevented.
● In February 2013, we conducted an industrial hygiene survey.
○ We collected personal and area air samples, and bulk samples of both unused (neat) and in-use process fluids.
○ We analyzed air samples for thoracic aerosol mass concentration, metalworking fluid, endotoxin, microorganisms by culture and molecular methods, volatile organic

Page ii Health Hazard Evaluation Report 2012-0055-3337
compounds, and metals; we also analyzed bulk fluid samples for microorganisms by culture and molecular methods, and endotoxin.
○ We examined the ability of local exhaust ventilation systems to capture smoke and examined airflow in the facility by releasing a safe tracer gas.
● In March 2013, we conducted a medical survey.
○ We offered a health questionnaire and breathing tests to all current and some former employees.
○ We examined the relationship between the 2013 air sample results and the 2013 health findings.
○ We conducted an analysis of bacterial populations in the lung tissue specimens that had been obtained from four employees with severe lung disease using molecular techniques (microbiome analysis).
○ We subsequently reported the 2013 industrial hygiene and medical survey findings, and the findings of the microbiome analysis, with interim recommendations.
● In September 2016, we conducted follow-up industrial hygiene and medical surveys.
○ We collected general area air samples throughout the facility including both the production and administration areas.
○ We collected bulk fluid samples from a variety of machines and samples of unused metalworking fluid and municipal water.
○ We analyzed the 2016 air samples for thoracic aerosol mass concentration, metalworking fluid, endotoxin, and microbial populations by culture and molecular methods (microbiome analysis).
○ We analyzed the 2016 bulk fluid samples for microbial populations by culture and microbiome analysis.
○ We offered a health questionnaire, breathing tests, and assessment of the upper airway microbiome to all current employees.
○ We reviewed the medical records and lung tissue specimens from an additional employee who had developed severe lung disease in the interval between the first and second medical surveys.
○ We subsequently reported the 2016 industrial hygiene and medical survey findings, with interim recommendations.
What We Found ● At the time of the initial industrial hygiene and medical surveys in 2013, four
nonsmoking employees with respiratory symptom onset during 1995–2007 were identified as having advanced lung disease; each of these employees worked in either the assembly or machine shop areas. The lung disease was later characterized by

Page iiiHealth Hazard Evaluation Report 2012-0055-3337
evaluation of lung tissue samples as demonstrating a lymphocytic bronchiolitis with extension into alveolar ducts and emphysema.
● Consulting pulmonary pathologists indicated the pathological findings were unusual and not previously described. Local and state health officials, and physicians practicing in the local community, including a regional medical center and tertiary care referral center, were unaware of similar cases occurring in the community or at other workplaces.
● Twelve employees who participated in both the 2013 and 2016 medical surveys had declines in their lung function beyond that expected from normal aging of 10% or greater from their 2013 baseline.
○ Ten of the 12 employees with declines in lung function exceeding 10% worked in either the assembly or machine shop areas.
○ Following the 2016 medical survey, one production employee who had an excessive decline in lung function underwent lung biopsy. Consulting pulmonary pathologists examined the lung tissue and identified the same unusual pattern of disease as seen in the four previous cases,
● In total, five employees who worked in either the assembly or machine shop areas were found to have an unusual and advanced lung disease characterized by lymphocytic bronchiolitis with extension into alveolar ducts and emphysema; four were identified by 2013 and a fifth was identified in 2016. Chest computed tomography and pathological findings were not consistent with hypersensitivity pneumonitis.
● A variety of processes with the potential to generate airborne exposures were noted to occur in the facility. For example, metals (steel, aluminum, and cast iron) and plastics were cut using saws, pressurized water, or plasma technology. Cut pieces were then processed into parts using grinders, mills, and lathes. Welding and painting were performed. Assembled machines were tested for functionality using customers’ paper.
● The facility used two metalworking fluids, preserved and non-preserved; the preserved metalworking fluid was designed for use with bactericide and the non-preserved metalworking fluid did not require bactericide.
● Airborne concentrations of small (thoracic) particulate mass, metalworking fluid, metals, and volatile organic compounds in the 2013 personal and area air samples and 2016 area air samples were below occupational exposure limits.
● Two personal endotoxin air samples collected in 2013 from employees in the machine shop were above the Dutch Expert Committee on Occupational Safety (DECOS) recommended exposure limit of 90 endotoxin units per cubic meter. All area air samples were below this level in 2016.
● Microbiological culture results in 2012, 2013, and 2016 were similar.
● Pseudomonas oleovorans/pseudoalcaligenes was the primary bacteria cultured from the bulk process fluid samples. Molecular analyses demonstrated more complex microbiomes in the bulk fluids, with a number of other types of bacteria present.
Page iv Health Hazard Evaluation Report 2012-0055-3337
● Tracer gas studies indicated migration of tracer gas from the machine shop to assembly areas. Smoke released in the VMC-160 enclosure was not fully captured by the mist collector.
● Detailed evaluations of exposures and health of the full working population did not identify a specific agent or combination of agents causing lymphocytic bronchiolitis with extension into alveolar ducts and emphysema. Identifying a specific causative agent or agents might not be possible until additional outbreaks of this rare lung disease are identified in other locations and compared with this one, or until experimental toxicology studies evaluating potentially causative agents are performed. Also, given the small proportion of production employees developing disease, some as-yet unidentified susceptibility factor might be present in those employees who developed severe lung disease.
● Even though we were unable to identify a specific agent or agents responsible for causing the rare, severe lung disease affecting five employees in the production area of the facility, the occurrence of this case cluster suggests that exposures in the assembly and machine shop areas contributed to development of lung disease. In view of the occurrence of a case several years after the initial case cluster, it is important to anticipate ongoing risk. In view of this, we recommend a proactive approach that includes protective measures against the range of potential airborne hazards in production areas and medical monitoring of employees working in those areas for early detection of any future possible cases, should any additional cases emerge.
What the Employer Can Do ● Optimize ventilation to minimize air circulation from the machine shop to assembly
areas. Continue to prevent air circulation from production areas to administration.
● Routinely evaluate the effectiveness of all mist collection systems to assure they function at high efficiency.
● Implement administrative controls to limit employees in machine shop and assembly areas and in proximity to processes generating airborne contaminants to only those needing to be present.
● Maintain exposures to production-related aerosols and vapors at the lowest levels feasible.
● Consider using the range of exposure controls described by the Occupational Safety and Health Administration (OSHA) in its guidance document Metalworking Fluids: Safety and Health Best Practices Manual available on the OSHA website.
● Maintain a comprehensive respiratory protection program and provide respiratory protection as appropriate. Consider providing disposable filtering facepiece respirators with any P- or R-series particulate filter for voluntary use by employees who enter production areas and wish to further reduce exposure to production-related aerosols.
● Establish a medical monitoring program that includes periodic spirometry for all

Page vHealth Hazard Evaluation Report 2012-0055-3337
employees in the production area.
○ Ensure the spirometry provider conducts high quality spirometry and monitors changes in lung function over time to identify employees with abnormal declines.
○ As part of the medical monitoring program, the provider should refer employees with concerning respiratory symptoms, new spirometric abnormalities, or excessive declines in lung function for further evaluation and management by a physician with specialized training in occupational medicine or pulmonary medicine.
● Assist physicians in implementing individualized management plans that include work recommendations such as using respiratory protection or transfer to non-production areas in the workplace.
● Encourage employees to report health concerns to their personal physicians and to the facility’s nurse.
What Employees Can Do ● Follow all safety precautions as instructed by your employer.
● Use local exhaust ventilation systems and respiratory protection as instructed by your employer.
● Participate in medical monitoring if offered by your employer.
● Consider the voluntary use of disposable filtering facepiece respirators with any P- or R-series particulate filters to further reduce exposure to production-related aerosols.
● Report new or ongoing or worsening respiratory symptoms to the facility’s nurse and your personal physician and follow your physician’s recommendations.

Page vi Health Hazard Evaluation Report 2012-0055-3337
This page left intentionally blank

Page viiHealth Hazard Evaluation Report 2012-0055-3337
Abbreviationsµg Microgramμm MicrometerACOEM American College of Occupational and Environmental MedicineATS American Thoracic SocietyAX Reactance area between five Hertz and resonant frequencyCFM Cubic feet per minuteCFU/mL Colony forming unit per milliliterCI Confidence intervalCNC Computer numerical controlCOPD Chronic obstructive pulmonary diseaseCT Computed tomographyDECOS Dutch Expert Committee on Occupational SafetyDNA Deoxyribonucleic acidDR5-R20 The difference between resistance at 5 and 20 HertzECRHS European Community Respiratory Health SurveyEF Exhaust fanEU Endotoxin unitEU/mL Endotoxin unit per milliliterEU/m3 Endotoxin unit per cubic meterFEV1 Forced expiratory volume in 1 secondFres Resonant frequencyFVC Forced vital capacityGM Geometric meanHHE Health hazard evaluationLAL Limulus amoebocyte lysateLOD Limit of detectionLOQ Limit of quantitationLPS LipopolysaccharideMLE Maximum likelihood estimationMWF Metalworking fluidmg/m3 Milligrams per cubic metermL Millilitermm MillimeterMUA Make-up airND Not detectedNHANES III Third National Health and Nutrition Examination Survey

Page viii Health Hazard Evaluation Report 2012-0055-3337
NIOSH National Institute for Occupational Safety and HealthOEL Occupational exposure limitOSHA Occupational Safety and Health AdministrationPBS Phosphate-buffered salinePCR Polymerase chain reactionPPE Personal protective equipmentPR Prevalence ratioR ResistanceR5 Resistance at 5 HertzR20 Resistance at 20 HertzrRNA Ribosomal ribonucleic acid REL Recommended exposure limitSF6 Sulfur hexafluorideSMR Standardized morbidity ratioTWA Time-weighted averageVOC Volatile organic compoundX ReactanceX5 Reactance at 5 Hertz

Page 1Health Hazard Evaluation Report 2012-0055-3337
Summary In January 2012, the National Institute for Occupational Safety and Health received a confidential employee request for a health hazard evaluation at a paper tissue converting equipment manufacturing facility regarding concerns about lung disease and air quality, with exposures to coolants, oils, solvents, paper dust, exhaust fumes, welding and plasma cutting fumes, and lacquer thinner encountered during production activities. In June 2012, we toured the facility; interviewed employees, managers, and the company’s nurse; observed employees at work; assessed some of the mist collectors and vacuum pumps; and collected bulk samples of unused (neat) and in-use process fluids. Gram-negative bacteria, particularly Pseudomonas oleoverans/pseudoalcaligenes, were present in all in-use fluid samples ranging from 140 million colony forming units per milliliter to 1.4 billion colony forming units per milliliter. Concentrations of endotoxin, a component of gram-negative bacterial cell walls, in the fluid samples ranged from 3,001 endotoxin units per milliliter to 108,017 endotoxin units per milliliter. We identified four nonsmoking employees who had severe lung disease, including one employee who required lung transplantation. In response, we conducted medical record reviews and obtained reviews of lung tissue specimens for the four employees with severe lung disease. Lung tissue specimens from the employees, obtained by lung biopsy or at the time of lung transplantation, were reviewed by five pulmonary pathologists at three different institutions.The pathologists found the tissue samples demonstrated an unusual pattern of lung disease involving lymphocytic bronchiolitis with extension into alveolar ducts and emphysema. Chest computed tomography scans primarily demonstrated centrilobular emphysema. Spirometry demonstrated airways obstruction and that diffusing capacity of the lung for carbon monoxide was decreased, consistent with small airways disease and emphysema. In an effort to better understand what might have caused the cases of severe lung disease and to prevent future cases of illness, we conducted a detailed industrial hygiene survey in February 2013 and a medical survey in March 2013. The industrial hygiene survey involved collecting personal and area air samples for thoracic aerosol, metalworking fluids, and endotoxin; area air samples for bioaerosols, volatile organic compounds, and metals, and total particulate (collected with closed-face cassette) for microbiome analysis; real-time measurements of volatile organic compounds and size-selective particulate; collection of bulk process fluids for analysis of culturable bacteria, culturable fungi, endotoxin, and microbiome; and examination of the airflow using a safe tracer gas. The medical survey involved administering a health questionnaire and breathing tests to employees. In addition, a microbiome analysis of lung tissue specimens from the four employees with severe lung disease was performed. Local and state health officials, and physicians who worked in the local community, including a regional medical center and tertiary care referral center, were contacted regarding their awareness of other cases of this severe lung disease occurring in the surrounding region.
During the 2013 survey, we identified a variety of processes with the potential to generate airborne exposures. For example, metals (steel [85–90%], aluminum [10–15%], and cast iron [less than 1%]) and plastics (less than 1%) were cut using saws, pressurized water, or plasma technology. Cut pieces were then processed into parts using grinders, mills, and lathes. Welding and painting were performed. Assembled machines were tested for functionality

Page 2 Health Hazard Evaluation Report 2012-0055-3337
using customers’ paper. We also found the facility used two metalworking fluids, preserved and non-preserved. The preserved metalworking fluid was designed for use with a bactericide and the non-preserved metalworking fluid did not require bactericide. Most process fluid bulk samples demonstrated growth of gram-negative bacteria, particularly Pseudomonas oleovorans/pseudoalcaligenes, at levels ranging from 70 colony forming units per milliliter to 57 million colony forming units per milliliter. Concentrations of endotoxin in the fluid samples ranged from 338 endotoxin units per milliliter to 390,633 endotoxin units per milliliter. Thoracic aerosol, metalworking fluids, metals, and volatile organic compounds were measureable in air at levels below occupational exposure limits and were highest in production areas. Two personal endotoxin samples from employees in the machine shop were above the Dutch Expert Committee on Occupational Safety (DECOS) recommended exposure limit of 90 endotoxin units per cubic meter (EU/m3). Assessment of the ventilation in the production area using a safe tracer gas demonstrated flow from the machine shop to the assembly area, highlighting opportunities for air contaminants in the machine shop area to reach assembly employees. Among current employees, some symptoms were more common than expected, while spirometric abnormalities were not in excess. Physicians and public health practitioners in the community and surrounding region had not observed cases of severe lung disease involving lymphocytic bronchiolitis with extension into alveolar ducts and emphysema occurring outside of employees at this facility. Lung tissue samples from the four employees with severe lung disease involving lymphocytic bronchiolitis with extension into alveolar ducts and emphysema were more enriched with Pseudomonas bacteria compared with lung tissue samples obtained from patients who did not work at the facility and underwent lung biopsies at the same nearby regional hospital.
Because there was a cluster of workers with unusual lung disease, the cause of the lung disease was uncertain, and organized medical surveillance of the workforce was not in place, we conducted follow-up medical and industrial hygiene surveys in September 2016. The industrial hygiene survey consisted of collecting area air samples to analyze for thoracic aerosol, metalworking fluid and endotoxin, and bulk process fluid samples analyzed for culturable bacteria, culturable fungi, bacterial populations (microbiome) using molecular methods, and endotoxin. The medical survey consisted of a health questionnaire and breathing tests, and analysis of microbiome using molecular methods for samples taken from the skin, nose, and mouth of employees. The medical records for an additional employee identified as having severe lung disease were reviewed and lung tissue specimens were reviewed by the same five pathologists that had previously reviewed lung tissue from four employees.
The overall concentrations of thoracic aerosol and extracted metalworking fluid in the air samples were lower during the 2016 survey compared with the 2013 survey. The installation of nine new mist collectors and the natural ventilation from open windows and bay doors might have contributed to the decrease in these concentrations. Pseudomonas oleoverans/pseudoalcaligenes was the only type of gram-negative bacteria identified by culture with concentrations ranging from 370 colony forming units per milliliter to greater than 30 million colony forming units per milliliter. Endotoxin concentrations ranged from 35 endotoxin units per milliliter to 10,059 endotoxin units per milliliter. Microbiome analyses identified

Page 3Health Hazard Evaluation Report 2012-0055-3337
differences in the types of bacteria between the two types of metalworking fluids. Preserved metalworking fluid samples were enriched with different types of bacteria, including Brevundinomonas, Alcaligenaceae (u.g.), and Sphingobacterium. In contrast, non-preserved metalworking fluid samples were predominantly enriched with Pseudomonas.
Among the total population of current employees who participated in the 2016 medical survey, the occurrence of wheeze in the last 12 months was more common than expected while spirometric abnormalities were not in excess relative to the general population. Twelve participants had declines in lung function exceeding 10% between 2013 and 2016, including two employees in the production area with marked declines of approximately one-third or more of their lung function. Ten of the 12 employees with declines in lung function exceeding 10% worked in the assembly or machine shop areas. One of the employees who had an excessive decline in lung function was a nonsmoker who worked in the production area and had a lung biopsy demonstrating the same pattern of disease previously identified among four employees. Samples of non-preserved metalworking fluids had greater bacterial similarity with human samples (skin, nasal passage, and oral cavity) taken from employees in the machine shop compared with samples taken from employees in administration.
Thus, a total of five nonsmoking employees who worked in either the assembly or machine shop areas were diagnosed with an unusual and advanced lung disease characterized by lymphocytic bronchiolitis with extension into alveolar ducts and emphysema; each had chronic breathing difficulty, and one underwent lung transplantation. Although evaluation of this single case cluster did not identify a definitive specific cause for the five cases of a rare, severe lung disease, the occurrence of this cluster indicates that production-related inhalational exposures at this facility were contributory. The occurrence of a new case between 2013 and 2016 raises concerns for ongoing risk. Given the small proportion of production workers who have developed this unusual and advanced lung disease, some as-yet unidentified susceptibility factor might be present in those employees who developed disease. In the absence of certainty regarding the specific agent or combination of agents responsible for the cluster of lung disease identified in this facility, we recommend engineering controls to maintain production-related airborne exposures to the lowest level feasible and administrative controls to ensure that only those who need to be in production areas are present. We also recommend consideration of providing respiratory protection in the form of disposable filtering facepiece respirators with any P- or R-series particulate filter for voluntary use by employees who enter the production area. We also recommend implementing a medical monitoring program that includes periodic spirometry for employees who work in the production area so that disease can be detected early, should it occur again.

Page 4 Health Hazard Evaluation Report 2012-0055-3337
IntroductionIn January 2012, the National Institute for Occupational Safety and Health (NIOSH) received a confidential employee request for a health hazard evaluation at a paper tissue converting equipment manufacturing facility. The employees submitted the health hazard evaluation request because of concerns about air quality and exposures to coolants, oils, solvents, paper dust, exhaust fumes, welding and plasma cutting fumes, and lacquer thinner encountered during production activities and concerns about lung disease. NIOSH completed an initial site visit in June 2012. Early in the investigation, we identified four employees who had developed severe lung disease and were undergoing treatment by local physicians, including one employee who required lung transplantation. In response, for the four employees with severe lung disease we conducted medical record reviews, a thoracic radiologist reviewed radiology images, and five pulmonary pathologists from three different institutions conducted reviews of tissue samples. Additionally, we conducted detailed industrial hygiene and medical surveys to better understand what might have caused the cases of severe lung disease and to prevent future cases of illness. NIOSH conducted a detailed industrial hygiene survey in February 2013 and medical survey in March 2013. A microbiomic analysis of lung tissue specimens from the four employees with severe lung disease was also performed. Results from those surveys were reported previously. To assess whether an ongoing risk of lung disease in the facility existed, NIOSH conducted follow-up industrial hygiene and medical surveys in September 2016. The results of the 2016 industrial hygiene and medical surveys were also reported previously.
Process DescriptionThe process description below describes the production areas of the facility at the time of the 2013 industrial hygiene survey.
The company produced paper converting machines for use by customers that manufactured paper products such as folded napkins and facial tissues. The manufacturing process occurred in the machine shop and assembly areas. Beginning in the machine shop, metals (steel [85–90%], aluminum [10–15%], and cast iron [less than 1%]) and plastics (less than 1%) were cut using saws, pressurized water, or plasma technology. Cut pieces were then processed into parts using grinders and computer numerically controlled (CNC) machines consisting of horizontal, vertical, and gantry mills, and lathes. Machinists typically operated a single machine at a time, although they were cross-trained to fill in on other machines when needed.
The two metalworking fluids in use for cooling and lubrication of cutting tools and parts being machined included a water-miscible, mineral oil-based fluid, Blasocut BC935, and a synthetic, oil-free, water-miscible grinding fluid, Blaser Grindex 10. Blasocut BC935 did not require a bactericide and is referred to as non-preserved metalworking fluid. Blaser Grindex 10 was designed for use with a bactericide and is referred to as preserved metalworking fluid. Each machine requiring the use of a metalworking fluid had an individual reservoir. The concentration of the metalworking fluid in each reservoir was determined on a daily basis by

Page 5Health Hazard Evaluation Report 2012-0055-3337
a refractometer; fresh metalworking fluid and water were added as needed to maintain the desired concentration and to top-off the level in the reservoir. Each reservoir was skimmed at least weekly to remove waste tramp oil. This process occurred by hand or automatically, depending on the machine’s capability. The metalworking fluid in each machine was filtered periodically (3 to 10 times per year) according to a maintenance schedule using a mobile device called a “sump sucker” that removed the fluid from the reservoir, passed it through a filter, and returned it to the machine’s reservoir. In some machines, instead of filtering, the metalworking fluid was properly disposed of by a contracted outside firm and replaced periodically; metalworking fluid was changed in all other machines annually. Depending on its condition and the metal machined, some metalworking fluids required maintenance outside the usual schedule; for instance, metalworking fluid was routinely replaced after cast iron was machined. The company did not monitor the metalworking fluid for pH or microbial growth; however, the distributor and manufacturer did occasionally when on site. Mist collectors were introduced in the late 1990s and installed on many but not all machines. Filtered air from the mist collectors was returned into the machine shop space.
There were two areas in the facility where welding activities occurred; the heavy weld shop located in the machine shop and the welding fabrication shop in the assembly area. The heavy weld shop received cut material directly from the plasma water table and saws. This was where welding of structural frame components for the product machines and subassemblies occurred. Mainly sheet metal was welded in the welding fabrication area. Both metal inert gas (MIG) (85% of the time) and tungsten inert gas (TIG) (15% of the time) welding was performed. Both weld shops were under negative pressure with respect to the remainder of the facility.
Machined parts were transferred to the paint prep area of assembly next to the paint booth. Assembly was where the paper converting machines were put together, tested, disassembled, and shipped. Small parts were deburred in a device that used agitation with ceramic stones to remove sharp edges, or they might have been sandblasted (sand blasting was less than 1% of parts). Larger parts were deburred by hand grinding, sanding, or filing. After deburring, mid-sized parts were cleaned in a ventilated automated washer. Washer stages were (1) hot water (3% alkaline cleaning solution), (2) excess water blown off the parts, (3) rinsed with 1.5% rust-inhibiting solution, and (4) excess water blown off parts. Larger parts (est. 5% of the total) were wiped down with lacquer thinner to remove surface residue. After washing, parts were painted (low volatile organic compound (VOC) industrial enamel) according to the customer’s specifications in the paint booth. The paint booth was an enclosed room with downdraft ventilation isolated from the rest of the assembly area. Painters in the paint booth used supplied air hoods. Painted parts were transferred from the paint booth to an open staging area, then to a low temperature (140°F maximum) enclosed dryer. Occasionally, some parts (2%–3%) underwent “blackening” (black oxide cold process) rather than painting, during which they were treated chemically to color and finished with a water soluble rust inhibitor on the surface to protect from rust. Painted or blackened parts were transferred to one of multiple bays in assembly. Mechanical assembly was followed by electrical and plumbing assembly. Assembled machines were tested for functionality using the customer’s paper. The company produced 35–40 machines per year. The machine testing occurred over

Page 6 Health Hazard Evaluation Report 2012-0055-3337
a three to five week timeframe with each machine running paper for an average of 15 total hours over the three to five week period. The paper converting machines used vacuum pumps to create suction for control of paper during cutting and folding. The vacuum pumps cycled on/off primarily on the day shift; on average they ran 3.4% of total working hours. Several types of pumps (water sealed [25%–30%], oil sealed [0%–5%], and air sealed [70%]) were used. Oil-sealed vacuum pumps were fitted with mist collectors, and water vacuum pumps had condensers. They were not typically exhausted to the outdoors. Test machines were disassembled in preparation for shipment. Parts that incurred scratches during the assembly process sometimes went through touch-up painting rather than only cleaning. Larger assemblies that did not fit in the down draft paint booth were touched–up in the touch-up paint booth in the shipping bay of the assembly area. The touch-up paint booth was partially enclosed and had side-draft ventilation. Employees in this area wore full-face respirators.
Contract machining services were provided occasionally to other industries such as mining, food production, wood products, defense, and fabricators.
Methods2012 Initial walkthrough
We first visited the facility in June 2012. During the initial visit we held an opening meeting with the employer and employee representatives to discuss the health hazard evaluation request. We toured the facility including the administration area, machine shops, coolant storage rooms, assembly bays, paint booth areas, welding areas, and the shipping and receiving area to understand work processes, practices, and workplace conditions. In addition to speaking with company managers, we held confidential interviews with employees from each of the primary work areas.
Ten bulk samples of metalworking fluids were collected to assess for the presence of microorganisms using various techniques. Seven of the 10 samples were in-use process fluids collected from the reservoirs of individual machines. One sample each of unused non-preserved metalworking fluid, unused non-preserved metalworking fluid diluted with municipal water, and unused preserved metalworking fluid, were also collected. Samples were analyzed (by a commercial laboratory) using culture techniques for bacteria and fungi to detect organism growth under laboratory conditions. Determination of endotoxin levels was performed at NIOSH using the same method described below for the 2013 survey. Non-culture tests to identify mycobacterial deoxyribonucleic acid (DNA), and to identify bacterial and fungal genus and species by ribosomal ribonucleic acid (rRNA) sequencing in fluids collected in 2012, were also performed at NIOSH.
A summary of the materials and methods used to determine mycobacterial DNA and gene sequencing procedures can be found in Appendix A.
Page 7Health Hazard Evaluation Report 2012-0055-3337
2013
Case DescriptionsWe obtained authorized medical releases from the four employees identified as having severe lung disease to obtain and review their medical records, radiology images, and tissue specimens. A thoracic radiologist reviewed the chest computed tomography (CT) images sent by employees’ healthcare providers. Five experienced pulmonary pathologists from three different institutions with subject matter expertise in interstitial lung disease and occupational chest pathology reviewed the lung tissue specimens provided by employees’ healthcare providers. Specimens were subjected to the following stains by both local healthcare facilities and the five experienced pathologists: 1) hematoxylin and eosin stain; and immuno-staining for 2) CD3; 3) CD5; 4) CD20; 5) CD21; 6) CD43; 7) BCL-2; 8) Kappa chain; and 9) Lambda chain. Each pathologist reviewed tissue specimens from the four employees including open lung biopsies from three employees and explanted lung tissue obtained from one employee who underwent lung transplantation. The pathologists then discussed their findings to determine the best way to describe the pathological findings.
Industrial Hygiene SurveyDuring February 11–14, 2013, we conducted an evaluation in the facility including air and bulk fluid sampling and an assessment of the ventilation system. A summary of the industrial hygiene sampling methods is provided in Table 1B in Appendix B.
Interviews and ObservationsDuring the environmental sampling survey, we observed work practices and personal protective equipment (PPE) use. We also discussed the fluid maintenance schedule with the metalworking fluid supplier representative and reviewed the company’s metalworking fluid, mist collector, and vacuum pump maintenance records with management.
Ventilation AssessmentWe reviewed the ventilation system and assessed airflow patterns using a hand-held smoke generator and a safe tracer gas.
Dilution VentilationMany of the metalworking machines in the machine shops were equipped with local exhaust ventilation systems designed to collect airborne contaminants at the source of their generation. During the evaluation, the effectiveness of individual local exhaust ventilation systems was not determined. However, a visual assessment of the general ventilation system in the production areas of the facility was conducted. These systems were designed to introduce outdoor air into the facility to dilute airborne contaminants.
A handheld smoke generator (Wizard Stick, Zero Toys, Inc., Concord, MA) was used to visualize air movement throughout the production areas and qualitatively assess the effectiveness of the touch-up paint booth in the assembly area. Smoke was released around the periphery of and in the interior of the touch-up paint booth hood to qualitatively evaluate the capture efficiency and observe for areas of concern. Quick and direct capture of smoke by

Page 8 Health Hazard Evaluation Report 2012-0055-3337
the hood at the point where operations were performed suggested effective control design and performance. Slow capture of smoke or smoke taking a circuitous route to the air intake for the exhaust indicated a potential problem. We also evaluated the ventilation for the VMC-160 to determine the effectiveness of the mist collector.
Tracer Gas TestsTracer gas testing techniques have been safely used for decades in many applications, such as medical diagnostics and treatments, critical leak detection, air dispersion studies, indoor air quality evaluations, and fume hood testing. Sulfur hexafluoride (SF6), a colorless, odorless, biologically inert, non-toxic, and non-combustible gas, is commonly used for tracer studies. In these tests, the SF6 gas was released at a location and monitors were placed in other locations to measure the time and concentration of any gas that reached them.
Tracer gas testing was primarily conducted to determine whether aerosols generated in the machine shops (old machine shop, new machine shop, and CNC Department) and CNC Department could migrate across the facility to the assembly area. A detailed description of the tracer gas tests can be found in Appendix C.
Environmental SamplingPersonal SamplesWe collected 104 personal air samples for thoracic particulate mass and extracted metalworking fluid mist paired with endotoxin samples. The thoracic aerosol and metalworking fluid samples were collected on 37-millimeter (mm), polytetrafluoroethylene filters for analysis by NIOSH Method 5524; the analytical method limit of detection (LOD) for the thoracic aerosol was 30 micrograms (µg) per sample. Thoracic aerosol includes all dust and other aerosols in the air in addition to the metalworking fluid. After the filter was gravimetrically weighed, a ternary solvent blend was used to extract the metalworking fluid. The LOD for the extracted metalworking fluid mist was 30 µg per sample. Airborne endotoxin samples were collected on 37-mm A/E glass fiber filters. Endotoxin levels (relative potencies) were determined using the kinetic chromogenic Limulus amoebocyte lysate (LAL: Associates of Cape Cod, Inc., Falmouth, MA) assay method and reported as endotoxin units per milliliter (EU/mL) or endotoxin units per cubic meter (EU/m3). The LOD for the endotoxin samples was either 0.02 EU/per filter or 0.05 EU/filter depending on the control standard used during analysis. Invalid samples were not included in the concentration calculations. Invalid sample results were caused by technical interferences during the analyses. Endotoxin is a lipopolysaccharide compound released by the outer cell walls of gram-negative bacteria when they die, or their cell walls are damaged. Endotoxin causes inflammation and is associated with adverse respiratory effects.
Employees from all areas of the facility were asked to wear two air samplers in their breathing zone for an entire work shift. For all personal samples, we recorded information on the type of activity or task being performed. For those working in the machine shops, we collected information on the machine characteristics, ventilation controls in use, and process fluid information for each machine operated including date of last fluid change. Employees who participated in air sampling were given the opportunity to request their individual air sampling results.
Page 9Health Hazard Evaluation Report 2012-0055-3337
Area SamplesTen area baskets were stationed throughout the facility daily and equipped with multiple air sampling instruments including separate closed-face cassettes analyzed for total particulate matter, metals, endotoxin, evacuated canisters for VOCs, thoracic cyclone for aerosol and metalworking fluid, and an impinger for bacteria and fungi. Temperature and relative humidity readings were also recorded. Real-time measurements for VOCs and size-selective particulates were recorded in some areas using a photoionization detector and an aerosol monitor. Two area basket setups were collected outdoors for comparison purposes.
Analysis of endotoxin, thoracic aerosol, and extracted metalworking fluid have been described above. Closed-face cassette samples were collected on 37-mm mixed cellulose ester filters for elemental analysis by NIOSH Method 7303 and on 37-mm polychloride filters for polymerase chain reaction (PCR) analysis. PCR analysis is a technique that allows for analysis of DNA from a sample. PCR also permits the identification of non-cultivatable or slow-growing microorganisms such as bacteria or viruses from environmental samples and from tissue culture assays (see Appendix D for methods). The 450-mL evacuated canisters were used to collect area air VOC samples, and were equipped with restricted flow controllers that allow for calculation of a time-weighted average (TWA) concentration. The canister air samples were analyzed for VOCs using a pre-concentrator-gas chromatograph-mass spectrometer (GC-MS) system pursuant to a published method validation study [LeBouf et al. 2012] with the following modifications: the pre-concentrator was a Model 7150 (Entech Instruments, Inc.); and qualitatively identified compounds were compared with National Institute of Standards and Technology (NIST) 2008 Mass Spectral Library and included in the analytical report if the quality factor was greater than 75%.
Twenty-three area samples for airborne bacterial and fungal microorganisms (bioaerosols) were collected using the BioSampler® (SKC Inc., Eighty Four, PA) liquid impinger containing mineral oil. The use of mineral oil allowed for full-shift sampling in various areas throughout the facility. The mineral oil was analyzed by a commercial laboratory for culturable fungi and bacteria.
We used DustTrak DRX 8533 (Thermo Scientific Corp., Franklin, MA) particulate monitors to obtain real-time continuous levels of airborne size-selective dust.
We used ppbRae Plus (Rae Systems, Inc.) real-time photoionization detectors with 10.6 electron volt lamps to monitor total airborne VOC concentrations.
Bulk SamplesBulk samples of process fluids from each machine operated by an employee wearing a personal sampler, including unused preserved and non-preserved metalworking fluid, and municipal water, were collected and analyzed for bacteria and fungi via culture and non-culture techniques, and endotoxin. Approximately 150 mL of each bulk sample were collected into three 50 mL polypropylene centrifuge tube containers. To avoid contamination, a new pair of nitrile gloves and a sterile pipette were used during the collection of each sample. The bulk samples were refrigerated immediately following collection and were

Page 10 Health Hazard Evaluation Report 2012-0055-3337
shipped overnight in coolers with ice packs to the laboratories.
Bulk fluids, air samples collected in 2013 and 2016, and lung tissue specimens were analyzed for the presence of bacterial populations using molecular analysis (microbiome analysis) by Leopoldo Segal, MD, MS, at the New York University Genome Technology Center. See Appendix D for a detailed description of the methods and results.
Field blank filter cassette samples for each applicable method were collected by exposing the media briefly to ambient air, then resealing.
During the medical survey in March 2013, employees expressed concern about the use of a Sullair oil-cooled vacuum pump in the assembly area. Two samples of filter material from the vacuum pump discharge unit were collected on March 14, 2013, and shipped overnight to NIOSH. The condition of the filter media samples was visually assessed by NIOSH industrial hygienists.
Medical SurveyWe conducted a medical survey during March 11–15, 2013. We invited all of the facility’s current employees and several former employees to give written informed consent for an interviewer-administered questionnaire and lung function testing. The questionnaire included questions from the American Thoracic Society (ATS) adult respiratory questionnaire [Ferris 1978], the Third National Health and Nutrition Examination Survey (NHANES III) [CDC 1996], and the European Community Respiratory Health Survey (ECRHS) [Grassi et al. 2003]. Questions addressed respiratory and dermatological symptoms, asthma and other diagnoses, smoking history, work history and practices, and demographic information. To explore the possibility that respiratory symptoms or lung function impairment was associated with exposures outside of work, we included questions assessing activities and exposures that occurred away from the facility. We asked participants who reported symptoms whether those symptoms were the same, worse, or better when away from the facility on days off or on vacation. Participants who worked in administration were asked to designate the percentage of time spent in the machine shop and the assembly area.
The lung function testing consisted of spirometry, a test that measures how well air moves in and out of the lungs and, in some cases, bronchodilator administration. A bronchodilator is a medication that can open the lung airways if they are reversibly constricted, as in asthma. Following ATS guidelines [Miller et al. 2005], NIOSH technicians administered spirometry tests using a dry rolling-seal spirometer interfaced to a personal computer. Unless contraindicated, participants with any spirometric abnormality were administered a bronchodilator to determine reversibility, using four puffs of a beta-agonist (albuterol). In some cases, such as if a participant reported asthma, bronchodilator was offered despite normal spirometry.
We compared spirometry results with reference values generated from NHANES III data [Hankinson et al. 1999]. Each participant’s largest forced vital capacity (FVC) and forced expiratory volume in one second (FEV1) were selected for analysis. We classified participants

Page 11Health Hazard Evaluation Report 2012-0055-3337
as having airways obstruction if they had FEV1 and a ratio of FEV1/FVC below their respective lower limits of normal (5th percentiles) with a normal FVC. We defined restriction as a normal FEV1/FVC ratio with FVC below the lower limit of normal. We classified participants with both FEV1/FVC ratio and FVC below the lower limit of normal as having mixed obstructive and restrictive abnormalities. We classified the severity of a spirometric abnormality on the basis of the FEV1 percent predicted as follows: ≥ 70% = mild, 60%–69% = moderate, 50%–59% = moderately severe, 35%–49% = severe, < 35% = very severe [Pellegrino et al. 2005]. We defined reversibility as a 12% and 200 mL improvement in FEV1 after bronchodilator administration [Pellegrino et al. 2005].
A report was mailed to each participant’s home address within four weeks of testing that explained each individual’s spirometry results and provided recommendations for follow-up of abnormalities.
Physicians who worked in the local community, including a regional medical center and tertiary care referral center, and public health officials at the state and local health departments, were contacted regarding their awareness of other cases of this severe lung disease occurring in the surrounding region.
Data AnalysisThe Tobit regression method was used to address measurements below the LOD in summarizing exposure data by location (Lubin et al., 2004). Tobit regression uses the maximum likelihood estimation (MLE) method to provide estimates of mean exposures while account ing for the measurements below the LOD. The log-likelihood function used in Tobit regression has two components, one for observed data and the other for data below the LOD; MLE of the model parameters (e.g., for locations) are then obtained by maximizing the log-likelihood function. The MLE method is shown to be an optimal method to address measurements below the LOD across a wide range of scenarios for the number of measurements and percent of censored data (Hewett and Ganser, 2007). This method was used to summarize personal and area air measurements for thoracic aerosol mass concentration, metalworking fluid, endotoxin, and metals exposures for each location. Log-transformed exposure variables were used as the outcome variable and location as the predictor. The means of the log-transformed exposures for each location were exponentiated to obtain the geometric mean (GM), and were also used in the equation to calculate the minimum variance unbiased estimator (MVUE) of the arithmetic mean (Mulhausen and Damiano, 1998).
To explore potential associations between health problems and work, we examined questionnaire responses and lung function test results by exposure groups developed from work histories, air sampling results, and self-reported activities and exposures outside of work. We categorized facility tenure on the basis of the median value. We used work histories to group participants into three categories (administration, assembly, and machine shop) based on their current department. “Administration” consisted of all office employees, expediters, and janitorial staff. “Assembly” consisted of the assembly department, deburr/paint, parts room, shipping, and welding fabrication employees. “Machine shop” consisted

Page 12 Health Hazard Evaluation Report 2012-0055-3337
of the CNC department, old machine shop, new machine shop, contractor, heavy weld, maintenance, and tool crib employees. Separately, we assigned the location-specific (job group) concentrations of airborne thoracic aerosol, metalworking fluid, and endotoxin exposure, to each participant using the results of our air sampling measurements. Job groups were as follows: administrative offices, assembly, CNC programming, CNC tool crib, deburr/paint, expediter, heavy weld, janitorial, machine shop, maintenance, parts room, and welding fabrication.
We assigned the location-specific job group arithmetic mean, geometric mean, and maximum concentration for each type of exposure to participants who worked in those locations. We treated exposure as a continuous measurement and divided the participants into low, middle, and high thirds (“tertiles”) for each type of exposure variable. The distributions of participants by tertiles of exposure were similar but not identical to the categorization by current department. A majority of participants from administration fell into the first (lowest) exposure tertiles, from assembly into the second (middle) exposure tertiles, and the machine shop into the third (highest) exposure tertiles. However, some clear differences existed. For instance, for maximum thoracic aerosol exposure and maximum metalworking fluid exposure, the majority of participants from assembly fell into the third (highest) exposure tertiles. Thus, the exposure tertiles did not simply reiterate the current department categories.
We examined the relationship between machines’ bulk fluid parameters (bacteria colony counts, endotoxin concentration) and the corresponding log-transformed personal air sampling results using Tobit regression models to address measurements below the LOD. When a machine had more than one corresponding air sample, we used the first collected air sample for these analyses. We explored the effects of machine characteristics (sump size, type of enclosure, presence of mist collector, and fluid change date) on personal air sampling results using Tobit regression. For these analyses, when a machine had more than one corresponding air sample, we included all air sampling results.
We defined work-related symptoms as those that improved away from the facility. We defined asthma-like symptoms as at least one of the following: wheezing or whistling in the chest in the past 12 months; being woken up with a feeling of tightness in the chest in the past 12 months; an attack of asthma in the past 12 months; or currently taking any medicine for asthma [Grassi et al. 2003].
We calculated standardized morbidity ratios (SMRs) of symptoms, diagnoses, and spirometric abnormalities from comparisons with data obtained from the U.S. adult population from NHANES III [CDC 1996] using indirect standardization for race (white, black, or Mexican-American), sex, age (17 years–39 years or ≥ 40 years), and cigarette smoking status (ever or never). SMRs indicate how often health problems occurred in participants compared with the U.S. adult population. An SMR above one indicated the prevalence of the health problem was more common among participants than expected. An SMR of one indicated the health problem was as common among participants as expected. An SMR below one indicated the prevalence of the health problem was less common among participants than expected. An SMR above or below one was considered statistically

Page 13Health Hazard Evaluation Report 2012-0055-3337
significant if the 95% confidence interval (CI) did not include one.
For binomial (yes/no) health outcomes, we used contingency tables and prevalence ratios (PRs) to examine associations; significance was assessed using the chi-square test and Cochran Armitage trend test. For continuous (numerical) outcomes, we used analysis of variance to compare means. When these analyses revealed significant associations, we used generalized linear models to examine possible confounding by ever smoking and age. Statistical analyses were conducted using SAS software version 9.3 and JMP software version 10.0.1 (SAS Institute, Inc., Cary, NC). We considered two-sided p≤0.05 to be statistically significant.
Activities Following 2013 SurveysIn May 2014, the company’s management requested to meet with NIOSH investigators to review activities undertaken as part of the ongoing health hazard evaluation. Meeting participants included company management, employee representatives, company-hired consultants, metalworking fluid manufacturer representatives, NIOSH health hazard evaluation team members, NIOSH scientific collaborators, and NIOSH Respiratory Health Division leadership. A summary of the meeting was prepared by NIOSH and provided to all meeting participants and the health hazard evaluation confidential requestors.
In December 2015, another meeting was held to review the pathology findings, microbiome analyses of lung tissue and environmental samples, results from the 2013 industrial hygiene and medical surveys, and the NIOSH proposal for additional evaluations. Meeting participants included company management, employee representatives, company-hired consultants, metalworking fluid manufacturer representatives, NIOSH health hazard evaluation team members, NIOSH scientific collaborators, and NIOSH Respiratory Health Division/Field Studies Branch leadership. A summary of the meeting was prepared by NIOSH and provided to all meeting participants and the health hazard evaluation confidential requestors.
2016During September 12–16, 2016, we conducted a second industrial hygiene survey and medical survey.
Industrial Hygiene SurveyThe industrial hygiene evaluation consisted of collecting general area air samples throughout the facility and bulk samples of both unused and in-use process fluids. A summary of the industrial hygiene sampling methods is provided in Appendix B in Table 2B.
Air samples for metalworking fluid and endotoxinWe collected 90 paired general area air samples for thoracic aerosol and airborne metalworking fluid using the thoracic cyclone, and endotoxin using closed-face cassette. Forty-two area baskets were stationed throughout the facility daily, and three area baskets were placed outdoors for comparison. Field blank filter cassette samples for each applicable method were collected by exposing the media briefly to ambient air and then resealing.
Page 14 Health Hazard Evaluation Report 2012-0055-3337
Air samples for thoracic aerosol and metalworking fluid analyses were collected by using 37-mm cassettes containing pre-weighed, polytetrafluoroethylene filters. The sampling train consisted of a BGI thoracic cyclone, 37-mm cassette and tubing connecting the sampling train to GilAir5 air-sampling pump. A sampling rate of 1.6 L was used. Each pump was calibrated before use, and the flow rate was checked after use to ensure it was within an acceptable range. Because airborne metalworking fluid concentrations in 60% of area samples and 47% of personal samples in February 2013 were below the LOD, we used composite samples, whereby the same filter cassette sampler was used over a two-day sampling period. This approach was designed to increase the mass collected on the filters, thereby increasing the likelihood of exceeding the analytical method LOD for metalworking fluid and endotoxin. At the end of sampling on the first day, the metalworking fluid and endotoxin filter cassettes were capped and placed in a re-sealable plastic bag for storage until the next day.
The metalworking fluid samples were analyzed by NIOSH Method 5524 [NIOSH 2017]. The analytical method LOD is the lowest mass an instrument can detect above background and is a criteria used to determine whether to report a result from a sample. The limit of quantitation (LOQ) is the lowest mass that can be reported with precision; we have a greater confidence in the reported result if it is above the LOQ. The reported LOD value for thoracic aerosol was 40 µg per sample, and the metalworking fluid LOD was 50 µg. The LOQ value for thoracic aerosol was 120 µg, and metalworking fluid was 170 µg. After the gravimetric analysis, a ternary solvent blend was used to extract the metalworking fluid fraction from each filter. The extractable fraction represents the portion of the sample comprising metalworking fluid.
Airborne endotoxin samples were collected on 37-mm A/E glass fiber filters. Before use, all filters were baked at 260°C for 40 minutes to make them endotoxin free. Endotoxin levels [i.e., relative potencies to reference standard endotoxin (lot # G3E069 and lot # H0K354; Escherichia coli O113:H10 strain; US Pharmacopeia, Rockville, MD)] were determined using the kinetic chromogenic Limulus amoebocyte lysate (LAL: Associates of Cape Cod, Inc., Falmouth, MA) assay and a parallel-line estimation method [Milton et al. 1992]. Endotoxin potencies were reported as EU/mL or EU/m3. The LOD was 0.02 EU/filter. Invalid samples were not included in the concentration calculations. Endotoxin sample results were categorized as invalid if dilution-independent interferences were detected in sample extracts during analyses [Milton et al. 1997].
Bulk samplesThirty-three bulk fluid samples (described below) were collected and analyzed for bacteria and fungi via culture and for measurement of endotoxin concentration. Culture analyses were performed at a contract laboratory and endotoxin analyses were performed at NIOSH. Samples included process fluids from 29 individual machines, one unused (neat) non-preserved metalworking fluid, one unused (neat) preserved metalworking fluid, and one municipal water sample. A duplicate set of these samples was collected and provided to the fluid manufacturer (Blaser Swisslube, Inc./Dr. Peter Kuenzi). Thirty-one of 33 samples were collected from the same locations or machines as in the February 2013 survey. Approximately 50 mL of each bulk sample was collected into sterile polypropylene

Page 15Health Hazard Evaluation Report 2012-0055-3337
centrifuge tube containers. To avoid contamination, a new pair of sterile, latex surgical gloves and a sterile pipette were used during each sample collection. The bulk samples were refrigerated immediately following collection and shipped overnight in coolers with ice packs to the laboratories.
Medical SurveyWe conducted a medical survey during September 12–16, 2016. We invited all current employees to give written informed consent. The questionnaire was the same as that used during the 2013 medical survey and as described above.
The lung function testing consisted of spirometry using the same methods as in the 2013 medical survey and as described above. A bronchodilator was not administered. We also performed impulse oscillometry, a test that measures the airways’ reaction to sound waves. For those employees who participated in the 2013 and 2016 medical surveys, we compared interpretable spirometry data from the two surveys. We analyzed declines in FEV1 and FVC by calculating the longitudinal normal limit according to Method 2 of the American College of Occupational and Environmental Medicine (ACOEM), which accounts for the expected change caused by normal aging [Townsend 2005]. We examined both 10% and 15% thresholds of decline. A 15% decline is recommended by ACOEM as an appropriate threshold for identification of excessive decline [Townsend 2005]. With high quality spirometry, and in certain higher-risk situations, smaller declines in FEV1 (e.g., 10%) can be used to identify persons with potentially excessive lung function decline [Redlich, et al. 2014, Townsend, et al. 2011]. This lower threshold has greater sensitivity for detection of lung disease, but lower specificity.
Many occupational lung diseases (e.g., chronic obstructive pulmonary disease [COPD], asthma) involve the small airways. However, the small airways are challenging to evaluate non-invasively. Oscillometry is a helpful technology to understand the effects of occupational exposures on the small airways. There are no contraindications as this test is conducted using regular breathing and does not require a forceful exhalation [Smith et al. 2005]. Spirometry can be normal despite respiratory symptoms or evidence of small airways disease on lung biopsy [King et al. 2011; Oppenheimer et al. 2007]; therefore, oscillometry results complement spirometry and can be used when spirometry is not possible because of a contraindication.
We used an impulse oscillometry machine (CareFusion Corp., San Diego, CA) to measure resistance (R), the energy required to spread the pressure wave through the airways, and reactance (X), which reflects the elastic properties of the respiratory system. The impulse oscillometry testing machine sends sound waves called pressure oscillations at different frequencies (e.g., 5 Hertz and 20 Hertz) into the airways to measure how airways respond to these small pressures. The test calculates 1) the airway resistance at different frequencies including 5 Hertz (R5) and 20 Hertz (R20), and the difference between R5 and R20 (DR5-R20); 2) the reactance at different frequencies including 5 Hertz (X5); 3) resonant frequency (Fres) which is the frequency where there is no airway reactance; and 4) the total reactance (AX) at all frequencies between 5 Hertz and the Fres. The predicted values

Page 16 Health Hazard Evaluation Report 2012-0055-3337
for R and X were based on gender and age according to reference values recommended by the manufacturer [Vogel and Smidt 1994]. R5 was considered abnormal (elevated) if the measured value was ≥140 percent of the predicted R5. X5 was considered abnormal (decreased) if the value of the predicted X5 minus measured X5 was ≥ 0.15 kilopascals per liter per second (kPa/(L/s)) DR5-R20 values > 30% were considered abnormal and evidence of frequency dependence. We interpreted the test as normal if both the R5 and X5 were normal. We defined a possible large (central) airways abnormality as a normal X5 and elevated R5 with no evidence of frequency dependence. We defined a possible small airways abnormality if evidence of frequency dependence or a decreased X5 with or without an elevated R5. We defined possible combined small (peripheral) and large (central airways) abnormality as a decreased X5 and elevated R5 with no evidence of frequency dependence.
We mailed each participant an individual report explaining their breathing test results and recommended each participant provide the information to their personal physician. Participants who had spirometry in 2013 and 2016 were provided with the percent change in FEV1 between the two tests and notified if a decline in FEV1 occurred that was greater than the decline expected with normal aging. We used the ACOEM Method 2 (as described above) to determine if the decline in FEV1 exceeded a 10% or 15% threshold [Townsend 2005].
Data AnalysisWe defined work-related and asthma-like symptoms as described above. We calculated SMRs of symptoms, diagnoses, and spirometric abnormalities from comparisons with data obtained from the U.S. adult population from NHANES III (1988–1994, symptom and spirometry data), NHANES 2007–2012 (symptom data), and NHANES 2007–2010 (spirometry data) adjusted for gender, race/ethnicity, age (less than 40 years or 40 years or greater), and cigarette smoking categories (ever/never) [CDC 1996, 2017].
To explore potential associations between health problems and work, we examined questionnaire responses and lung function test results by exposure groups developed from work histories, and self-reported activities and exposures outside of work. We categorized facility tenure based on the median value. We used work histories to group participants into three categories (administration, assembly, and machine shop) based on their current department and job title as described above.
For binomial (yes/no) health outcomes, we used contingency tables and SMRs to examine associations. For continuous (numerical) outcomes, we used analysis of variance to compare means. Statistical analyses were conducted using SAS software version 9.4 (SAS Institute, Inc., Cary, NC). We considered two-sided p≤0.05 to be statistically significant.
Case DescriptionWe obtained an authorized medical release from a fifth employee identified as having excessive lung function decline to obtain and review medical records, radiology images, and lung tissue specimens. The same thoracic radiologist that reviewed earlier cases reviewed the chest CT images for this employee. The same five pulmonary pathologists independently reviewed tissue specimens obtained by lung biopsy. The pathologists then met to discuss

Page 17Health Hazard Evaluation Report 2012-0055-3337
their findings and determine how best to describe them.
Microbiome AnalysesSkin and nasal swab samples and oropharyngeal samples obtained by gargling were obtained from participants in the 2016 medical survey. Bacterial populations in these samples, and in bulk fluid and area air samples, were analyzed using molecular analyses (microbiome analyses) by Leopoldo Segal, MD, MS at the New York University Genome Technology Center. See appendix D for a detailed description of the methods and results.
Results2012 Initial Walkthrough
The initial walkthrough contributed to understanding the facility processes detailed earlier in this report. Identification of four individuals with severe lung disease with histories of employment in the facility led to the collection of the clinical information described below. Environmental sampling during the initial walkthrough in June 2012 was limited to collection and evaluation of bulk fluid samples. Results from the culture analyses of the bulk fluid samples are illustrated in Table 3B in Appendix B.
Gram-negative bacteria were present by culture in all seven of the in-use fluid samples ranging from 140 million colony forming units per milliliter (CFU/mL) in the sample from the Okuma MA-500 to 1.4 billion CFU/mL in the sample from the sump sucker. Gram-negative bacteria were not present by culture in the unused (neat) non-preserved metalworking fluid or unused (neat) preserved metalworking fluid samples. The sample of the unused non-preserved fluid diluted with municipal water measured 1,900 CFU/mL. The genus and species of bacteria identified in some samples included Pseudomonas oleovorans/pseudoalcaligenes, Yersinia frederiksenii, Pseudomonas mendocina, Novosphingobium subterraneum, or Serratia marcescens.
The highest concentration of gram-negative bacteria (1.4 billion CFU/mL) was detected in the sample collected from the sump sucker. The sump sucker was reported to have been drained and serviced on June 23, 2012, which was four days before the sample was collected. The second highest concentration of bacteria was identified in the sample collected from the UMB-6 (1 billion CFU/mL). The fluid in this machine was last cleaned May 18, 2012.
Fungal growth was identified by culture in four of the 10 bulk fluid samples and included Fusarium, Scedosporium, and yeast. Results for Fusarium were 200 CFU/mL in the sample from the sump sucker and 500 CFU/mL in the sample from the radial drill (YMZ TRE-2000D). Scedosporium was detected at a level of 1,200 CFU/mL in the sample from the cylinder grinder (BUC63A). Yeast was identified in two samples: 100 CFU/mL in the Tacchi lathe (HD3) sample and 2,500 CFU/mL in the sump sucker sample.
Endotoxin was present in nine of the 10 samples. Endotoxin levels ranged from 5 EU/mL in

Page 18 Health Hazard Evaluation Report 2012-0055-3337
the unused (neat) preserved fluid sample to 108,017 EU/mL in the sample at the Okuma MA-500. The high endotoxin levels observed in some samples was consistent with the presence of gram-negative bacteria as demonstrated by culture and molecular methods.
NIOSH biologists in the Health Effects Laboratory Division analyzed the bulk fluid samples using quantitative PCR and rRNA sequencing. These test methods allow for the identification of different bacterial, fungal, and mycobacterial species in the samples, regardless of whether they grow in culture. Mycobacterial nucleic acid was not detected in any of the samples analyzed.
DNA extracted from the 10 bulk samples was characterized by using 16S rRNA gene sequencing to detect the bacterial and fungal species present. The gene sequence data were compared with the National Center for Biotechnology Information (NCBI) database to determine the closest characterized bacterium/fungus to which the sequence belonged. Bacterial and fungal sequencing results are provided in Tables 4B and 5B in Appendix B.
Nine of the 10 samples yielded bacterial amplification. The major bacterial species identified in the nine samples were members of the Pseudomonas aeruginosa group and included P. alcaliphila, mendocina, and oleovorans/pseudoalcaligenes. Another common species was Wautersiella falsenii, which was detected in seven of the nine samples. Six of the 10 samples yielded fungal amplification. The two common species identified were Bullera sakaeratica and Hyphoderma puberum.
2013
Case DescriptionsData for the four employees with severe lung disease identified in 2012 and a fifth employee identified in 2016 are summarized in Table 27B. Characteristics of all five cases are described here. The five employees were aged 27 to 50 years when they presented for care to their primary care physician with one or more of the following symptoms that began during a span of over 20 years beginning in 1995: sinus congestion, throat clearing, cough, wheeze, or shortness of breath on exertion. All five employees were never smokers. The employees reported working in the production area at the facility for 1–16 years before initial symptom onset. The first recorded pulse oximetry on room air for each of the employees ranged from 85% to 96%. Pulmonary function tests (PFTs) first completed 0–10 years after initial presentation for each of the four employees demonstrated the following ranges: FEV1, 39–58% of predicted; FVC, 52–89% of predicted; FEV1/FVC ratio, 0.40–0.78; total lung capacity, 100–134% of predicted; residual volume, 144–252% of predicted; and, diffusing capacity for the lung for carbon monoxide (DLCO), 48–80% of predicted. The employee illnesses were initially attributed to allergic rhinitis, sinusitis, upper respiratory infection, reactive airway disease, or bronchiolitis. Despite initial treatments, each of the employees had worsening respiratory symptoms, including shortness of breath on exertion. Follow-up spirometry completed 2–17 years after initial presentation demonstrated the following ranges: FEV1, 14–48% of predicted; FVC, 30–79% of predicted; and FEV1/FVC ratio, 0.36–0.78. The employees underwent diagnostic tests to rule out numerous diagnoses,

Page 19Health Hazard Evaluation Report 2012-0055-3337
and had negative test results for one or more of the following tests: sweat chloride test, total serum immunoglobulin (Ig)G levels, skin prick testing for Aspergillus fumigatus, serum anti-A. fumigatus IgE and IgG, serum anti-Micropolyspora faeni IgG, serum anti-Thermoactinomyces vulgaris IgG, serum antinuclear antibody, serum c- and p-anti-neutrophil cytoplasmic antibodies, tuberculin skin test, HIV antibody, and pathogenic organisms on culture following bronchoalveolar lavage. One employee reported improved breathing when away from work. One employee had improved respiratory symptoms and lung function following a temporary work restriction whereby the employee was not exposed to the production area while also on oral corticosteroid therapy. Two employees were placed on chronic antibiotic regimens with no substantial improvement in clinical symptoms. Two employees chose to retire from the facility because of chronic breathing difficulty during work. One employee required lung transplantation and each of the four employees who had not undergone lung transplantation had chronic shortness of breath on exertion.
Computed Tomography (CT) ReviewsThe CT scans described below were obtained from each of the five employees 1–17 years following initial presentation.
Scan 1: A CT of the chest revealed central bronchiectasis and bronchial wall thickening, centrilobular emphysema, and bibasilar linear atelectasis; there was notable absence of ground glass opacities, centrilobular nodules, fibrosis, and adenopathy.
Scan 2: A CT of the chest revealed central bronchiectasis and bronchial wall thickening, few scattered areas of centrilobular emphysema, and bibasilar linear atelectasis; there was notable absence of ground glass opacities, centrilobular nodules, fibrosis, and adenopathy.
Scan 3: A CT of the chest revealed moderate centrilobular emphysema, while there was notable absence of ground glass opacities, centrilobular nodules, fibrosis, and adenopathy.
Scan 4: A CT of the chest revealed moderate centrilobular emphysema and air trapping in the left lower lobe, while there was notable absence of ground glass opacities, centrilobular nodules, fibrosis, and adenopathy.
Scan 5: A CT of the chest revealed mild bibasilar bronchiectasis, right lobe atelectasis, and mild centrilobular emphysema, while there was notable absence of ground glass opacities, centrilobular nodules, fibrosis, and adenopathy.
Tissue Specimen ReviewsOriginal clinical reviewsTissue specimens 1: emphysematous lung parenchyma involved by prominent alveolar septate lymphoplasmacytic infiltrate comprised of small lymphocytes, plasma cells, histiocytes, and non-necrotizing granulomas consistent with lymphoid interstitial pneumonia.
Tissue specimens 2: lymphocytic bronchiolitis with hyperplasia of the bronchial lymphoid tissue; pattern different than lymphocytic interstitial pneumonia and stains did not support

Page 20 Health Hazard Evaluation Report 2012-0055-3337
obstructive bronchiolitis.
Tissue specimens 3: alveolar parenchyma with emphysematous architectural changes; nodular, interstitial, and peribronchial lymphocytic infiltrate; occasional small germinal centers; no evidence of interstitial fibrosis; reactive appearing population of CD3, CD5, and CD43-expressing T-cells and CD20-expressing B-cells; no evidence of kappa or lambda light chain overexpression; small benign germinal centers with CD10 expression and absence of BCL2-expression.
Tissue specimens 4: appreciable emphysematous changes; pulmonary parenchyma with patchy lymphoid aggregates occasionally located adjacent to bronchial epithelium, within the interstitium, and in a subpleural location; lymphocytes in the aggregates mature and small in size; patchy prominent plasma cells within interstitium; no significant increase in interstitial fibrous tissue; CD20-positive B-cells within aggregates with admixed CD3-positive T-cells; CD10 negative; no evidence of co-expression of CD5 or CD43 within B-cells; no kappa or lambda overexpression within plasma cells.
Tissue specimens 5: alveolar parenchyma with architectural changes suggestive of emphysematous change with wide and expanded alveolar spaces separated by a paucity of thin alveolar septae; some areas of interstitium demonstrates nodular lymphocytic infiltrate in predominantly perivascular distribution; nodules with small, monotonous population of mature lymphocytes; germinal centers not appreciated; CD3, CD5, and CD43-expressing T-cells; CD21, CD21, and CD21-positive B-cells that are negative for CD5 and CD10; no cyclin-D1 expression; no kappa or lambda light chain overexpression.
Consultant reviewsLung tissue from the five employees who underwent open lung biopsy (n=4) or lung transplantation (n=1) demonstrated a similar constellation of pathological changes characterized by the pathologists as lymphoplasmacytic bronchiolitis and alveolar ductitis with emphysema. The pathologists suggested the term “B-cell bronchiolitis-alveolar ductitis and emphysema” to describe the disease process. The pathological features were thought to be distinctive and unlike any well-recognized disease entity.
Details of the pathological findings included: bronchiolocentric lymphoplasmacytic infiltrates with scattered CD20 positive B-cell primary lymphoid follicles without germinal centers. The lymphoplasmacytic infiltrates involved both bronchioles and alveolar ducts. There were scattered CD3 positive T-cells predominantly cuffing the B-cell follicles, no appreciable interstitial or airway fibrosis, and alveolar enlargement with septal wall fragmentation consistent with mild to moderate emphysema. Scattered intraalveolar clusters of foamy macrophages, considered a non-specific secondary finding, were noted in a specimen from one employee. Rare hemosiderin-laden macrophages were noted. Focal pleuritis was present in one specimen and, in the explant (removed lungs), there was a focus of organizing pneumonia and a rare granuloma.
There was a notable absence of classic features of constrictive bronchiolitis and an absence

Page 21Health Hazard Evaluation Report 2012-0055-3337
of complete obliteration of small airways. The histologic features were distinct from hypersensitivity pneumonitis because of the lack of granulomas (except for a rare granuloma noted in a single case), the presence of B-cell follicles, and the absence of a more uniform T-cell infiltrate involving bronchiolar walls and more diffusely on alveolar walls. The features were not typical of follicular bronchiolitis in connective tissue disease, which tends to have a greater profusion and coalescence of lymphoid follicles with germinal centers, most prominent in the membranous bronchioles rather than alveolar ducts.
During the pathology review it was noted that tissue specimens from one employee had focal accumulation of mixed opaque and birefringent dust in the tissues. Further analysis using scanning electron microscopy and energy dispersive x-ray spectroscopy revealed no unusual metals as detectable insoluble particulates. Particles of aluminum silicates, silica, iron and titanium were present.
Industrial Hygiene SurveyObservationsThe process description was as described earlier. Overall, the production areas of the facility appeared orderly and clean, and no visible mist was present during our sampling.
Compressed air was used in various areas including in the assembly bays and welding fabrication area. In the assembly bays, compressed air was used to clean floors. An employee in the welding fabrication area was observed using compressed air to blow down clothing after grinding activities. We also observed compressed air being used in conjunction with lacquer thinner or alcohol to remove particulate matter from metal parts that had been drilled and tapped before painting. Solvent odors were strong during this procedure. The OSHA standard 29 CFR 1910.242(b) requires compressed air must be reduced to less than 30 pounds per square inch for cleaning purposes. We did observe employees using respiratory protection during the compressed air operation to remove particulate matter from a work piece.
Solvent vapors from lacquer thinner and denatured alcohol use in the deburr/paint and roll table areas had strong odors and were irritating to the eyes. In addition to the exposures occurring during the use of compressed air and solvents, some exposures were likely occurring because of evaporation from lacquer-thinner-soaked items left out on work tables and from the residual solvent vapors remaining in the work area because of poor ventilation.
Grinding activities at the deburr bench were observed. We observed no local exhaust ventilation at the bench area, and visible dust accumulation on the surfaces, floor, and on an employee. A respirator was seen lying on the deburr bench without being in a protective bag, presenting the opportunity for it to become contaminated.
The lids to the blackening tanks in the deburr/paint area were observed to be left open and visible steam and mist was observed rising from the tanks into the room air. The chemical composition of the products used in the blackening process can be irritating to the respiratory tract and mucous membranes.

Page 22 Health Hazard Evaluation Report 2012-0055-3337
The heavy weld area was under negative pressure. We observed potential issues involving the ventilation system for the weld table. It appeared air was directed from the back wall ventilation system toward the table in an attempt to direct it away from the employee. However, this actually resulted in contaminated air being blown into the employee’s breathing zone. The welding table was also fitted with an articulating arm exhaust device designed to allow an employee to place the exhaust face as close to the welding operation as possible. The arm was not able to reach all areas of the welding table, particularly when large work pieces were being welded. We also noticed a welder was wearing a respirator that did not appear to fit properly.
A cutoff saw was located in the heavy weld area although it was not part of welding operations located in the room. During the survey, cut off saw operations were observed to release considerable particulate matter into the room and generated high noise levels. The saw was fitted with a local ventilation system that appeared to be ineffective in removing contaminated air from the room.
We observed the floors around several machines with partial enclosures in the machine shop areas to be covered in metalworking fluid and presented a slip, trip, or fall hazard.
In the assembly area, we observed employees spray painting a large work piece in the touch-up paint booth. The end of the work piece extended more than halfway out from the capture area of the booth thus negating proper capture of spray paint exhaust. The employee conducting the spray painting was wearing a full-face respirator while another worker within three feet of the operation was wearing no respiratory protection.
Preventive Maintenance Activities
FluidsThe facility had a fluid management system in place that included monitoring fluid levels, skimming tramp oil from reservoirs, topping off fluid as needed, filtering fluid, and changing fluid annually at a minimum. Some of the machines’ fluid reservoirs were equipped with auto-skimmers to remove tramp oil. Tanks without auto-skimmers installed were manually skimmed weekly. A “sump sucker” was used to remove used fluids, sludge, and chips from individual machine sumps. The fluid was either filtered and returned to the sump or discarded according to the fluid maintenance schedule.
Mist CollectorsA variety of mist collectors were installed on various machines. A preventive maintenance schedule was in place whereby operators and maintenance staff performed maintenance tasks including checking and changing the filters at regular intervals as specified by the mist collector manufacturer and dependent on production demands.
Vacuum PumpsThree types of vacuum pumps were used in the assembly bays including positive displacement vacuum blowers, water seal vacuum pumps, and oil seal rotary screw vacuum

Page 23Health Hazard Evaluation Report 2012-0055-3337
pumps. We used evacuated canisters to collect area air samples for VOCs during the operation of two pumps. Samplers were placed near the air exhaust ports of the pumps. Table 15B displays the results of before and after air monitoring of the operation of a Robuschi positive displacement vacuum pump in bay 4 and a Nash water seal vacuum pump in bay 6 in assembly. No appreciable differences in levels or types of VOCs were detected.
The filter samples collected from the Sullair oil seal rotary screw vacuum pump discharge unit in March 2013 were visually examined by NIOSH industrial hygienists. The filters were reportedly changed last in October 2012, and preventive maintenance on the vacuum pump itself was reported to have been completed on March 1, 2013. At the time of the medical survey during March 11–15, 2013, the Sullair was being used for the preliminary startup of a machine and before this was reportedly used for seven days. The pre-filter media sample had a slight yellow discoloration and minimal visible particulate matter. There was a slight oiliness on the surface of the media and an odor similar to the vacuum pump oil. The pleated filter sample was white with no apparent discoloration or visible particulate accumulation.
Dilution VentilationThe production area was equipped with seven make-up air (MUA) systems designed to bring outdoor air into the facility. By report, four of the seven systems were usually operated. Two of the systems were in continuous operation during the NIOSH visit. MUA unit #6 (MUA-6) was located in the northeast corner of the CNC Department near the Okuma MA800. While we did not have equipment to measure flow rates, MUA-6 was reported to provide 18,000 cubic feet per minute (cfm) of conditioned outdoor air to the CNC Department. MUA-7 was reported to provide 3,000 cfm of conditioned outdoor air into the old and new machine shop areas. MUA-7 was located in the northwest corner of the new machine shop near the water jet storage area. Together, a total of approximately 21,000 cfm of conditioned outdoor air was continuously introduced into the production portion of the facility.
MUA-2 and MUA-3 were the other two MUA units reported to be operated on an intermittent basis. Both of these units were located on the roof above Assembly Bay #7. Together these two MUA units reportedly brought in 33,600 cfm of conditioned outdoor air. Their usage was linked to exhaust fans #6 and #7 (EF-6 and EF-7) that provided exhaust airflow from the touch-up paint booth in the assembly area. When the touch-up paint booth was used, EF-6 and EF-7 exhausted a reported 30,000 cfm from the assembly area. At those times, MUA-2 and MUA-3 were activated to offset the large amount of exhaust air.
Smoke TestsVisual observation of handheld smoke generation near the touch-up paint booth suggested that the booth had adequate collection efficiency to approximately 10 feet. Beyond 10 feet, the ventilation efficiency of the booth was diminished and negatively impacted by forklift and other traffic.
When we conducted handheld smoke generation at the opening of the entry slot of the mist collector inside the VMC-160 enclosure, the smoke traveled straight up and exited through the open top and into the room rather than being captured by the mist collector. This is an

Page 24 Health Hazard Evaluation Report 2012-0055-3337
indication the mist collector was not efficiently capturing aerosols, thereby allowing the potential for coolant aerosols to enter the workplace environment.
Tracer Gas TestsDetailed information regarding tracer gas tests, and figures illustrating the tracer gas release points and monitoring stations for both tests, can be found in Appendix C.
The two tracer gas tests indicated airborne contaminants generated in the machine shops or the CNC Department had the potential to reach employees working throughout the rest of the production areas of the facility. However, these test results represented only two snapshots in time corresponding to when the testing was conducted. During the NIOSH visit, the doors and windows were generally closed because of the winter season. While efforts were made to prevent the use of the paint booths and parts drying oven during the tracer tests (to eliminate the effects the exhaust/additional outdoor air had on the results), eliminating their use was not possible. Variables such as using the paint booths or parts drying oven, opening or closing of doors and windows, and operating equipment might have influenced the airflow patterns and subsequent spread of airborne contaminants throughout the facility.
Environmental SamplingPersonal SamplesResults by location for the 104 personal air samples for thoracic aerosol and extracted metalworking fluid are presented in Table 6B-1, and the airborne endotoxin results are presented in Table 6B-2 in Appendix B. The samples were collected from employees in all areas of the facility including the administrative offices on two day shifts and two afternoon shifts. Results are reported as the geometric mean (GM) and range.
Forty-two percent (44/104) of the thoracic aerosol personal sample results were greater than the analytical method LOQ, 49% (51/104) were between the analytical method LOD and LOQ, and 9% (9/104) were below the LOD. Nine percent (9/104) of the extracted metalworking fluid sample results were greater than the LOQ, 44% (46/104) were between the LOD and LOQ, and 47% (49/104) were below the LOD. Ninety-six percent (98/102) of the endotoxin personal sample results were above the LOD. Measurements that fell between the LOD and LOQ were used as best estimates of the concentrations, recognizing their limitations as quantitative measurements.
Thoracic AerosolPersonal thoracic aerosol concentrations varied from <0.03 milligrams per cubic meter of air (mg/m3) to 1.58 mg/m3.
The highest maximum personal concentrations of thoracic aerosol by location were measured in heavy weld and welding fabrication at 1.58 mg/m3 and 0.84 mg/m3, respectively. The GM of the three samples collected in heavy weld was 0.94 mg/m3 (range: 0.46 mg/m3–1.58 mg/m3). The overall GM concentration in the machine shop was 0.15 mg/m3 with results of 0.18 mg/m3 in the old and new machine shops, 0.15 mg/m3 for shop helpers, and 0.12 mg/m3 in the CNC department. The next highest GM concentration of thoracic aerosol of 0.13

Page 25Health Hazard Evaluation Report 2012-0055-3337
mg/m3 was measured on the expediters. Employees in both maintenance and the general assembly area had a GM thoracic concentration of 0.09 mg/m3. The lowest concentration of thoracic aerosol (range: <0.03 mg/m3–0.04 mg/m3) was measured in eight samples from employees in administration, including the front office, 2nd floor sales, and upper and lower engineering.
Airborne Extracted Metalworking FluidConcentrations of extracted metalworking fluid in all personal samples ranged from <0.03 mg/m3 to 0.32 mg/m3.
The highest GM personal concentration of extracted metalworking fluid was in heavy weld (0.15 mg/m3; range 0.10 mg/m3–0.32 mg/m3). The overall GM concentration in the machine shops was 0.06 mg/m3 with 0.09 mg/m3 in the old machine shop, followed by the new machine shop (0.07 mg/m3), CNC department (0.06 mg/m3), and shop helpers (0.03 mg/m3). GM concentrations of extracted metalworking fluid for expediters was 0.04 mg/m3. Employees in assembly, maintenance, the parts room, and administration had the lowest measured concentrations of extracted metalworking fluid ranging from <0.03 mg/m3–0.20 mg/m3; the majority of samples were below the LOD.
Airborne EndotoxinTwo of the 104 personal endotoxin samples collected (one from deburr/paint and one from maintenance) were voided because of possible contamination or a damaged cassette. One of the results from a sample in the CNC department was considered invalid because of technical interferences during the laboratory analyses. The personal endotoxin levels in the air ranged from <0.04EU/m3 to 115.56 EU/m3.
The highest GM personal endotoxin concentrations by location were in the machine shops (11.59 EU/m3) with a GM of 16.97 EU/m3 (range 1.86 EU/m3–94.93 EU/m3) in the new machine shop, 10.92 EU/m3 (range: 0.75 EU/m3–115.56 EU/m3) in the CNC department, and 10.00 EU/m3 (range: 4.49 EU/m3–55.88 EU/m3) in the old machine shop.
The GM concentration of endotoxin in samples from expediters was 10.63 EU/m3 (range: 5.75 EU/m3–24.22 EU/m3). Maintenance employees’ GM concentration was 7.47 EU/m3 (range: 6.75 EU/m3–8.91 EU/m3. Employees in the assembly area had personal GM endotoxin concentrations of 1.80 EU/m3 (range: <0.04 EU/m3–8.20 EU/m3). Administrative employees in office areas including the front office area, 2nd floor sales, and upper and lower engineering had GM endotoxin concentration of 0.74 EU/m3 (range: 0.17 EU/m3–3.58 EU/m3). Personal GM endotoxin concentrations were lowest in welding fabrication at 0.10 EU/m3.
Bulk Fluid Parameters and Machine CharacteristicsWe collected a total of 49 personal air samples on machinists working on 28 unique machines. The 28 machines were represented by both bulk samples and personal air samples of the corresponding machinists. We found no associations between the bacterial colony counts in the bulk fluid and concentrations of thoracic aerosol, metalworking fluid, or

Page 26 Health Hazard Evaluation Report 2012-0055-3337
endotoxin in air. The concentration of endotoxin in the bulk fluid was significantly associated with the concentration of endotoxin in air (p=0.01; coefficient=0.24).
We found no associations between sump size and concentrations of thoracic aerosol, metalworking fluid, or endotoxin in air. After accounting for the concentration of endotoxin in the machines’ bulk fluids, we found no associations between type of machine enclosure (none, partial, or full) and concentrations of thoracic aerosol, metalworking fluid, or endotoxin in air. Compared with machines without mist collectors, machines with mist collectors had a significantly lower mean concentration of thoracic aerosol in the air (p=0.013). After accounting for the concentration of endotoxin in the machines’ bulk fluids, there was no association between mist collectors and concentrations of endotoxin in the air. There was no association between fluid change date and concentrations of thoracic aerosol, metalworking fluid, or endotoxin in air.
Area SamplesTable 7B-1 in Appendix B presents the GM and range results from the 40 area air samples collected for thoracic aerosol and metalworking fluid, and Table 7B-2 contains the endotoxin levels.
Thirty percent (12/40) of the sample results for thoracic aerosol were greater than the LOQ, 53% (21/40) of the results were between the LOD and LOQ, and 18% (7/40) were below the LOD. One sample result for the extracted metalworking fluid was greater than the LOQ, 38% (15/40) of the results were between the LOD and LOQ, and 60% (24/40) were below the LOD. Ninety-eight percent (39/40) of the endotoxin sample results were greater than the LOD.
Thoracic Aerosol Thoracic aerosol concentrations in the general area air samples ranged from <0.04 mg/m3 to 0.36 mg/m3.
The highest thoracic aerosol concentration was measured in heavy weld (0.22 mg/m3). The
GM area concentration of thoracic aerosol in the old machine shop was 0.18 mg/m3. The next highest GM concentrations were found in the new machine shop with results of 0.15 mg/m3 and in the CNC department at 0.11 mg/m3. The lowest indoor concentrations of thoracic aerosol were measured in the administrative offices (range: <0.04 mg/m3–0.05 mg/m3).
Airborne Metalworking FluidConcentrations of extracted metalworking fluid in all area samples ranged from <0.02 mg/m3 to 0.13 mg/m3.
The highest GM concentration of extracted metalworking fluid was in the new machine shop (0.07 mg/m3; range <0.04 mg/m3–0.12 mg/m3). The GM concentration of extracted metalworking fluid in the old machine shop and CNC department were 0.05 mg/m3 and 0.04 mg/m3, respectively. Apart from the machine areas, the highest concentration of extracted metalworking fluid was measured in the heavy weld area sample. Concentrations of extracted

Page 27Health Hazard Evaluation Report 2012-0055-3337
metalworking fluid in administration, assembly, deburr/paint, and welding fabrication were the lowest; the majority were below LOD.
The results for both thoracic aerosol and extracted metalworking fluid were below the LOD in the outdoor samples.
Airborne EndotoxinThe area endotoxin results are reported in Table 7B-2. Results from three samples, one each from administration, CNC department, and welding fabrication were considered invalid because of technical interferences during the analyses.
Area endotoxin levels in the air ranged from <0.05 Eu/m3 to 82.84 EU/m3. The highest endotoxin concentrations by area were in the machine shops with GMs of 18.62 EU/m3 (range: 7.12 EU/m3–30.57 EU/m3) in the new machine shop, 10.63 EU/m3 (range 2.92 EU/m3–61.87 EU/m3) in the CNC department, and 9.25 EU/m3 (range: 1.94 EU/m3–82.84 EU/m3) in the old machine shop. The concentrations of endotoxin were lower in deburr/paint (range: 9.39 EU/m3–10.60 EU/m3), heavy weld (4.41 EU/m3), and assembly (range: 0.77 EU/m3–6.06 EU/m3). The lowest endotoxin concentrations were in the parts room (0.97 EU/m3) and in administration (0.16 EU/m3).
BioaerosolsTwenty-three area samples for airborne microorganisms were collected using the BioSampler® (SKC Inc., Eighty Four, PA) liquid impinger containing mineral oil to allow for a longer sampling duration in various areas throughout the facility. The concentrations of culturable bacteria and fungi in the air were low with detectable results in eight of the 23 samples. Bacteria including Bacillus circulans and Micrococcus luteus were identified in six samples in concentrations ranging from 27.55 CFU/m3–30.11 CFU/m3; four in the CNC department, one in old machine shop, and one in heavy weld. Fungi including Penicillium brevicompactum, Penicillium chrysogenum, and Penicillium roqueforti were identified in three samples in concentrations ranging from 29.32 CFU/m3–32.77 CFU/m3; two in assembly and one in the CNC department. One sample in the CNC Department contained both bacteria and fungi.
MetalsTable 8B in Appendix B presents results of analysis of airborne metals. Few samples had levels above the LOD, and all levels were substantially below the applicable NIOSH recommended exposure limits [NIOSH 2016]. Of the metals that had levels above the LOD, only iron, manganese, lanthanum, and copper had more than 20 out of 40 samples above the LOD. The heavy weld area had the highest levels of iron, manganese, and copper.
Volatile Organic CompoundsTables 9B through 13B present the results of the airborne VOC evacuated canister results. Ethanol, acetone, isopropyl alcohol, toluene, and xylene were detected in almost all samples collected in assembly, CNC department, and old and new machine shop areas. This is consistent with the use of lacquer thinner throughout the facility. All levels were substantially

Page 28 Health Hazard Evaluation Report 2012-0055-3337
below the applicable NIOSH recommended exposure limits [NIOSH 2016].
Bulk SamplesThirty-four bulk fluid samples including municipal water, unused preserved and non-preserved metalworking fluid, unused non-preserved metalworking fluid diluted with municipal water, and in-use fluids from 29 different machines were analyzed for microbial composition and endotoxin levels. The majority of machines sampled (86%) used the non-preserved fluid. The average temperature of the bulk fluid samples was 73ºF, and the average pH was 8.8. All results are presented in Table 14B.
Culturable Bacteria and FungiBacteria and fungi were not detected in the sample of municipal water, in the unused (neat) preserved and non-preserved metalworking fluids, or in the oil from the Fellows Gear Hob in the new machine shop. The gram-negative bacteria Pseudomonas oleovorans/pseudoalcaligenes was identified in 19 of the 34 (56%) samples. Other gram-negative bacteria identified included Alcaligenes faecalis, Brevundimonas vesicularis, Burkholderia glathei, Corynebacterium variabile, Herbaspirillium huttiense, Novosphingobium aromaticivorans, Pseudomonas luteola, Sphingomonas yanoikuyae, and Sphingopyxis macrogoltabida. Two gram-positive forms of bacteria, Aerococcus viridans and Curtobacterium luteum, were identified. The concentrations of gram-negative bacteria ranged from ND in the unused fluids to 57 million CFU/mL in the sample from the UMB6. Fungi including Aureobasidium pullulans, Fusarium sp., Fusarium oxysporium, and Yeasts were identified in 13 (38%) samples of the in-use fluids.
The plasma cutter and waterjet machines did not use metalworking fluid but had reservoirs containing water. The concentration of bacteria in the sample from the plasma cutter was 1.4 million CFU/mL. Both biocide and rust inhibitor were added to the plasma cutter reservoir. The waterjet had two different tanks. The sample taken from the tank on the left had 1.9 million CFU/mL of Novosphingobium aromaticivorans, and the sample from the tank on the right had 1.2 million CFU/mL of Herbasprillium huttiense.
EndotoxinThe concentrations of endotoxin in the bulk process fluids were highly variable and ranged from ND in the unused (neat) preserved metalworking fluid sample to 390,633 EU/mL in the sample from the Okuma V60R vertical turning center (Table 14B). The sample of municipal water and the non-preserved metalworking fluid diluted with water had the lowest endotoxin concentrations of 0.16 and 6.94 EU/mL, respectively. Endotoxin was measured in all of the in-use fluids ranging from 338 EU/mL (left tank of Water Jet) to 390,633 EU/mL in the sample from the Okuma V60R vertical turning center. The highest concentration of endotoxin measured in the Old Machine Shop was in the sample from the Takumi Seki 8VA vertical machine center at 80,059 EU/mL. In the New Machine Shop, the Okuma V60R vertical turning center and the Haas VF-2 #2 turning center had the highest endotoxin concentrations at 390,633 and 234,449 EU/mL, respectively. The highest endotoxin concentrations measured in the CNC Department were in the sample from the Okuma MA4000HA (166,117 EU/mL) and the Okuma MA500 (96,354 EU/mL); both are horizontal machine centers.

Page 29Health Hazard Evaluation Report 2012-0055-3337
Real-time Air Sampling Real-time particulate monitor data ranged from 0.047 mg/m3 to 0.44 mg/m3 for total particulate. No attempts were made by investigators to log activities occurring in the area of the samplers; therefore, results provide only a general concentration at the time of sampling. Average levels were lower during the night shift and some short-term spikes occurred during the morning but leveled off for the remainder of the day.
Real-time total VOC concentrations generally ranged from 1 ppm to 5 ppm with some short-term peaks occurring intermittently. As with the real-time particulate monitoring, activity logging was not conducted. The real-time instrument measured the total amount of VOCs in air and did not differentiate between chemical types as occurs with the VOC canister technique.
2013 Medical SurveyA total of 391 current and former employees participated in the survey at the facility or off-site. Among all current employees, the overall participation rate was 89%. When only current employees who were available that week were considered, the participation rate was 95%. Below we present the results for the 388 current employees who participated, all of whom completed the questionnaire, and a majority (n=376; 97%) of whom underwent spirometry testing. All but one of the spirometry tests were interpretable and included in our analyses. Table 16B demonstrates the participants’ demographic characteristics and Table 17B the participants’ work history characteristics.
Table 18B displays participants’ responses to questions on symptoms. The most commonly reported symptoms were nasal symptoms (71%), asthma-like symptoms (39%), wheeze (33%), and eye symptoms (32%). Work-related nasal symptoms were reported by 14% and work-related asthma-like symptoms by 10%. A majority of shortness of breath (69%), cough (72%), wheeze (83%), and flu-like illness (100%) was reported to have started after hire. One-third of participants reported a recent respiratory infection (cold or flu) (not shown).
Table 18B also illustrates responses to questions on diagnoses. The most commonly reported diagnosis was sinusitis (35%). Nine percent of participants reported ever being diagnosed with asthma, and 6% reported current asthma. Other diagnoses (data not displayed) were uncommon. Six participants reported an autoimmune disease, four reported chronic bronchitis, four reported COPD, and no participant reported a diagnosis of common variable immunodeficiency. Proportions of various conditions reported to have been diagnosed after hire included total hay fever (36%), eczema (51%), pneumonia (41%), and ever asthma (31%).
Compared with the U.S. adult population, participants were significantly more likely to report wheeze in the last 12 months, nasal symptoms in the last 12 months, and a diagnosis of hay fever (Table 19B). Participants were significantly less likely to report eye symptoms in the last 12 months and a diagnosis of chronic bronchitis. These patterns were generally consistent in analyses of subgroups of participants defined by current department (administration, assembly, and machine shop).

Page 30 Health Hazard Evaluation Report 2012-0055-3337
We examined the relationship between symptoms and facility tenure. Rash was significantly associated with facility tenure, with more reports of rash among those with longer tenure. Otherwise, no significant associations existed between symptoms and facility tenure.
Table 20B displays the prevalence of symptoms and self-reported diagnoses by current department categories. Symptoms were generally more common in assembly and machine shop employees, compared with administration employees. For many symptoms, the prevalence was lowest in administration employees, intermediate in assembly employees, and highest in machine shop employees. These patterns were statistically significant for asthma-like symptoms, eye symptoms, and nearly all work-related symptoms. These associations remained significant in models adjusted for age and smoking status (data not displayed). There were no significant differences in the prevalence of self-reported diagnoses across current department categories.
Participants reported a variety of exposures at work as causing or aggravating their symptoms. When asked to identify what caused or aggravated their nose symptoms, 12% of those with nasal symptoms identified a lack of fresh air, dust in the air, chemicals in machine shop, coolant mist and odors, smoke from machines, machining of carbide and Ryertex (a type of plastic), cleaning with compressed air, paper dust especially in the assembly area, dust particles and metal from deburring, or exhaust from vacuum pumps. Some participants gave examples of specific machines, including the Okuma MA500 (CNC Horizontal Machine Center) and the Okuma 3VA (CNC Vertical Machine Center), believed to contribute to symptoms.
When asked to identify what caused or aggravated their eye symptoms, 12% of those with eye symptoms described conditions including dust and coolant mist in the machine shop air, grinding Ryertex, paper dust, use of compressed air to clean floors, environmental allergies, or welding fumes and flash.
Seventeen percent of those with rash or skin problems reported their skin rash or skin problems were caused or aggravated by working with a carbon fiber roll, coolant fluid, chemicals in cleaners, or removing oil from hands.
Employees specifically mentioned the Okuma MA500 (CNC Horizontal Machine Center) and the Okuma 3VA (CNC Vertical Machine Center) as machines of concern. A strong mist was described when the doors of the Okuma MA500 open. Employees also reported smoke was sometimes emitted from the Tacchi turning center during the machining of some parts.
When symptoms were analyzed by ever having worked in a department, symptoms were generally less common among participants who ever worked in administration, compared with those who never worked in administration (data not displayed). These differences were statistically significant for wheeze, asthma-like symptoms, and a majority of work-related symptoms. Participants who ever worked in assembly were significantly more likely than those who never worked in assembly to report shortness of breath, work-related shortness of breath, usual cough, wheeze, and asthma-like symptoms. Participants who ever worked in

Page 31Health Hazard Evaluation Report 2012-0055-3337
the machine shop were significantly more likely than those who never worked in the machine shop to report work-related flu-like illness, work-related nasal symptoms, eye symptoms, rash, and work-related rash. There were no significant differences in the prevalence of self-reported diagnoses by ever department categories.
Table 21B illustrates the prevalence of symptoms and self-reported diagnoses by tertile of arithmetic mean endotoxin exposure. For a majority of symptoms, the prevalence was lowest in the first (lowest) tertile of exposure and highest in the third (highest) tertile of exposure. These trends were statistically significant for shortness of breath, usual cough, asthma-like symptoms, flu-like illness, rash, and all work-related symptoms. There were no significant differences in the prevalence of self-reported diagnoses across tertiles of mean endotoxin exposure.
Symptoms were generally more common in participants who reported a recent respiratory infection (cold or flu). However, the prevalence of recent respiratory infection did not differ across current department categories or tertiles endotoxin exposures. There was no association between reported recent respiratory infection (cold or flu) and endotoxin exposure in models that treated exposure as a continuous variable.
We examined the relationship between symptoms and self-reported activities and exposures outside of work by current department (Table 22B). Employees working in the machine shop more often reported participating in farming activities compared with employees working in administration or assembly. Employees working in administration more often reported exposure to mold or mildew at home compared with employees working in assembly or the machine shop. Further analysis indicated that participants who reported farming activities were significantly less likely than other participants to report shortness of breath walking with people one’s own age (PR=0.2; 95% CI=0.1–1.0) and shortness of breath walking at one’s own pace (PR=0; none with this symptom reported this activity). Participants who reported exposure to dust, smoke, welding fumes, gases, or chemical vapors outside of work were significantly more likely than other participants to report work-related shortness of breath (PR=2.9; 95% CI=1.0–8.7) and work-related cough (PR=2.8; 95% CI 1.1–7.6). Participants who reported water damage to their home or its contents were significantly less likely than other participants to report work-related wheeze (PR=0; none with this symptom reported this exposure) and work-related asthma-like symptoms (PR=0; none with this symptom reported this exposure). Participants who reported mold or mildew on surfaces at home were significantly less likely than other participants to report work-related shortness of breath (PR=0; none with this symptom reported this exposure) and significantly more likely to report nasal symptoms (PR=1.2; 95% CI=1.1–1.4) and rash (PR=2.4; 95% CI=1.4–4.1). Participants who reported exposure to any chemical or substance that had affected their breathing were significantly more likely than other participants to report shortness of breath walking on level ground (PR=3.0; 95% CI=1.4–6.5) and walking with people one’s own age (PR=4.7; 95% CI=1.6–14). There were no other significant associations between symptoms and activities and exposures outside of work. The previously described association between work-related cough and tertile of mean endotoxin exposure was marginally significant in a model that adjusted for reported exposure to dust, smoke, welding fumes, gases, or chemical

Page 32 Health Hazard Evaluation Report 2012-0055-3337
vapors outside of work (p=0.08). Otherwise, all previously described associations between symptoms and current department category and tertiles of mean total thoracic aerosol, metalworking fluid, and endotoxin exposures remained significant in models that adjusted for activities and exposures outside of work.
Table 23B displays the spirometry and bronchodilator test results, which includes two of the four employees identified later as having an unusual and advanced lung disease characterized as B-cell bronchiolitis-alveolar ductitis and emphysema. Fourteen (4%) participants who had an interpretable spirometry test had an abnormal result. Severity varied as follows: nine abnormalities were mild; two were moderate; one was moderately severe, and two were severe. All abnormalities of greater than mild severity were obstruction or mixed. The mean percent predicted values for FEV1 (102%) and FVC (104%) were normal. Bronchodilator was administered to 38 participants, including 27 (7%) of those with normal baseline spirometry and 11 (79%) of those with abnormal baseline spirometry. Five (19%) of those with normal baseline spirometry and two (18%) of those with abnormal baseline spirometry responded to bronchodilator.
Table 24B illustrates comparisons with the U.S. adult population for spirometric abnormalities. Both obstruction and obstruction including mixed pattern were less common among participants than expected, but these differences were not statistically significant. Restriction was significantly less common among participants than expected. These patterns were consistent in analyses of subgroups of participants defined by current department (administration, assembly, and machine shop) (data not displayed).
We examined the distribution of spirometric abnormalities by exposure. There was no association between spirometric abnormalities and facility tenure. Restriction was more common among participants who had ever worked in assembly (SMR=9.0; 95% CI=1.1–76). Otherwise, there were no significant differences in the prevalence of spirometric abnormalities by current department category or ever department category. The prevalence of spirometric abnormalities did not significantly vary across tertiles of thoracic aerosol, metalworking fluid, or endotoxin exposure. Spirometric abnormalities were not associated with continuous thoracic aerosol, metalworking fluid, or endotoxin exposure.
We examined the relationship between spirometric parameters and exposure. The percent predicted FEV1 and percent predicted FVC were not associated with facility tenure. The FEV1/FVC ratio was significantly and inversely associated with facility tenure in a simple model, but not in a model adjusted for age. There was no association between spirometric parameters and current department category or ever department category. There were no significant differences in mean spirometric parameters across tertiles of thoracic aerosol, metalworking fluid, and endotoxin exposure. The percent predicted FEV1 and percent predicted FVC were not associated with continuous thoracic aerosol, metalworking fluid, and endotoxin exposure. The FEV1/FVC ratio was significantly associated with continuous endotoxin exposure in the simple model, but not in the model adjusted for age.
Physicians and public health practitioners in the community and surrounding region had

Page 33Health Hazard Evaluation Report 2012-0055-3337
not observed cases of lymphocytic bronchiolitis with extension into alveolar ducts and emphysema other than among employees at this facility. Two of the four employees were siblings; the other two employees had no known associations outside of the workplace with the two siblings.
2013 Microbiome AnalysesA summary of the key findings of the microbiome analysis are provided below. Figures and a detailed description of methods and results are located in Appendix D.
● Lung tissue samples from four employees with the advanced lung disease characterized as lymphocytic bronchiolitis with extension into alveolar ducts and emphysema had a similar number of bacterial species detected compared with lung tissue samples from control patients at a nearby hospital.
● Environmental samples from the facility had a similar number of bacterial species detected compared with environmental samples from control facilities.
● Bacterial species from employee lung tissue specimens were more closely related to the bacterial species from the facility’s environmental samples than were control lung tissue samples when compared with control environmental samples.
● Facility environmental samples were enriched with different types of bacteria than the control environmental samples.
● Previously, we reported the results of bacterial culture of facility bulk fluids. These cultures primarily grew Pseudomonas. However, Pseudomonas was not the predominant genus detected in facility bulk fluid samples using 16S rRNA gene analysis. This means that although Pseudomonas was present and could be cultured, other types of bacteria that could not be cultured (grown) were actually more common in these samples than Pseudomonas. Similarly, for facility air samples, Micrococcus predominated in culture but not in the analyses based on the 16S rRNA gene.
● Employee lung tissue samples were enriched with different types of bacteria than the control lung tissue samples; the greatest difference was for Pseudomonas, which was enriched in the employee lung tissue samples compared with the control lung tissue samples.
Ability of In-Use Metalworking Fluids to Stimulate Proliferation of Murine B-CellsIn-use non-preserved and preserved metalworking fluid samples collected from the facility in June 2012 and February 2013 were able to stimulate proliferation of mouse splenic B-cells in vitro while unused non-preserved and preserved metalworking fluid did not stimulate the B-cells. Details are provided in Appendix D.
2016 Industrial Hygiene SurveyThe facility design and overall processes were mostly unchanged from conditions in February 2013. The specific formulation of the non-preserved metalworking fluid used in the facility was changed in January 2014, and not directly comparable with the non-preserved

Page 34 Health Hazard Evaluation Report 2012-0055-3337
metalworking fluid used in February 2013. The preserved metalworking fluid was the same as in February 2013. As previously noted, we focused the September 2016 air sampling on general area samples with long sampling durations to minimize samples below the LOD. To provide information across the facility, sample locations were selected to cover as many of the machines and work areas occupied by employees as feasible.
Area Air SamplesTable 25B in Appendix B presents results by location for the 90 area air samples collected for thoracic aerosol and extracted metalworking fluid and airborne endotoxins. Two samples were collected in each location, with the first sample (Sample 1) collected over two afternoon shifts (September 13–14, 2016), and the second sample (Sample 2) collected over two day shifts (September 15–16, 2016). Recognizing the limitations, measurements between the LOD and the LOQ are provided as best estimates of the concentrations.
Thoracic Aerosol Four percent (4/90) of the sample results for thoracic aerosol were greater than the LOQ, 47% (42/90) were between the LOD and LOQ, and 49% (44/90) were below the LOD. Thoracic aerosol concentrations ranged from <0.04 mg/m3 to 0.28 mg/m3.
More than half of the samples (58%, 52/90) were collected in the machining areas (old machine shop, new machine shop, CNC department, and heavy weld) of the facility. Thoracic aerosol concentrations in the machining areas ranged from <0.04 mg/m3 to 0.28 mg/m3. The highest concentration was measured in the heavy weld area.
Twenty samples were collected in the assembly side of the building including the parts room (two samples), the deburr/paint area (four samples), and welding fabrication (two samples). Thoracic aerosol concentrations in assembly ranged from <0.04 mg/m3 to 0.08 mg/m3. One sample in the welding fabrication area was greater than the LOQ, and one sample near the parts washer was between the LOD and LOQ.
Twelve samples were collected in various locations throughout the administrative areas including in reception, front office, atrium, lower engineering, upper engineering, and the second floor sales office areas. All samples in the administrative areas were below the LOD except for a sample in the atrium that had a concentration between the LOD and LOQ.
The results for thoracic aerosol were below the LOD in all outdoor samples.
Airborne Metalworking FluidTwenty percent (18/90) of the extracted metalworking fluid results were between the LOD and LOQ, and 80% (72/90) were below LOD. Extracted metalworking concentrations ranged from <0.05 mg/m3 to 0.08 mg/m3.
Thirty-three percent (17/52) of the samples from the machining areas had extracted metalworking fluid concentrations between the LOD and LOQ ranging from 0.03 mg/m3 to 0.07 mg/m3. Sixty-seven percent (35/52) of the samples were below the LOD. The highest

Page 35Health Hazard Evaluation Report 2012-0055-3337
concentration of extracted metalworking fluid in the machining areas was measured in a sample taken at the surface grinders in the old machine shop.
One extracted metalworking fluid sample collected near the parts washer in the assembly side of the facility was between the LOD and the LOQ with a concentration of 0.04 mg/m3. All samples in the administrative areas were below the LOD.
The results for extracted metalworking fluid were below the LOD in all outdoor samples.
Airborne EndotoxinThe area airborne endotoxin results are also reported in Table 25B. All endotoxin sample results were greater than the LOD. Overall area endotoxin levels in air ranged from 0.04 EU/m3 to 42.9 EU/m3.
The endotoxin concentrations in the machining areas ranged from 0.35 EU/m3 in heavy weld to 42.9 EU/m3 in the CNC Department. Within the machining areas, heavy weld had the lowest measured concentrations of endotoxin, followed by the old machine shop, new machine shop, and the CNC Department. The sample with the highest concentration of endotoxin in the CNC Department was collected at a CNC turning center.
In the assembly areas, endotoxin concentrations ranged from 0.24 EU/m3 near Bay 1 in the general assembly area to 3.94 EU/m3 in the deburr/paint area.
In the administrative areas endotoxin concentrations ranged from 0.04 EU/m3 to 0.68 EU/m3.
Bulk SamplesResults of bacterial and fungal culture and endotoxin analyses are presented in Table 26B. The majority of machines sampled (83%) used the non-preserved metalworking fluid.
Culturable Bacteria and FungiBacteria and fungi were not detected in the municipal water sample or in the unused (neat) preserved metalworking fluid. Additionally, no bacteria or fungi were detected in samples from two machines using the preserved metalworking fluid, the Sigma Tos BUC63A or Okamoto Accugar 124N, in the old machine shop. The gram-negative bacteria Pseudomonas oleovorans/pseudoalcaligenes was identified in 25 (76%) of 33 samples, including in the unused (neat) non-preserved metalworking fluid sample, and a majority of the in-use non-preserved metalworking fluid samples. The concentrations ranged from 370 CFU/mL in the sample from the Takumi 8VA to greater than 30 million CFU/mL in the samples from the Haas VF2 #2 Mill and Mori Seiki NL3000Y. Gram-positive bacteria identified included: Actinomyces hyovaginalis, Bacillus spp., Cellulomonas spp., and Corynebacterium spp. Fungi including Aureobasidium pullulans, Fusarium spp., Trichoderma harzianum, yeasts, and non-sporulating fungi were identified in 13 (39%) samples of in-use process fluids.The plasma cutter and waterjet machines did not use metalworking fluids but had reservoirs containing water. The concentration of bacteria (Pseudomonas oleovorans/pseudoalcaligenes and Staphylococcus gallinarum) in the sample from the plasma cutter was 9.5 million CFU/

Page 36 Health Hazard Evaluation Report 2012-0055-3337
mL. Both biocide and rust inhibitor were reportedly added to the plasma cutter reservoir. The waterjet had two tanks. The sample taken from the tank on the left had 830,000 CFU/mL of Actinomyces hyovaginalis and 370,000 CFU/mL of Corynebacterium spp. and the sample from the tank on the right had 590,000 CFU/mL of Actinomyces hyovaginalis and 290,000 CFU/mL of Corynebacterium spp.
EndotoxinThe concentrations of endotoxin in the bulk process fluids (Table 26B) ranged from below the LOD in the unused (neat) diluted non-preserved metalworking fluid sample to 10,059 EU/mL in the sample from the Okuma 3VA. The sample of unused (neat) diluted preserved metalworking fluid had the lowest measureable endotoxin concentration of 0.34 EU/mL. Endotoxin was measured in 29 of 30 in-use process fluids ranging from 3 EU/mL (Bridgeport EZ Path) to 10,059 EU/mL in the sample from the Okuma 3VA.
ControlsFluid ManagementThe metalworking fluid management system included monitoring each machine’s metalworking fluid level, skimming tramp oil from reservoirs, metalworking fluid top off or filtering, and annual metalworking fluid change outs. Four machines had their metalworking fluid changed the week before samples were collected in September 2016. The bacterial concentrations in samples from these machines varied widely and ranged from 30 CFU/mL to 6.3 million CFU/mL.
Mist CollectorsMist collectors were present on 32 machines. Since the February 2013 industrial hygiene survey, nine new mist collectors had been installed and four machines had their mist collector changed or upgraded. A preventive maintenance schedule was followed by operators and maintenance staff including monitoring the condition of and changing filters according to the manufacturer’s recommendations.
Comparison of 2013 and 2016 Air Sample ResultsOverall concentrations of thoracic aerosol, extracted metalworking fluid, and endotoxin in air were lower in September 2016 than in February 2013, and were below any occupational exposure limits at each time period (data not displayed). During the sampling in September 2016, many of the exterior doors, including bay doors, in both the machine shops and assembly were open allowing for natural ventilation unlike in February 2013, when all exterior doors and windows were closed. Additional mist collectors were also installed between the two sampling periods.
2016 Medical SurveyA total of 307 current employees participated in the survey at the facility. Among all 375 current employees, the overall participation rate was 82%. When only the 322 current employees who were available the week of the medical survey were considered, the participation rate was 95%. Among the participating employees, 307 completed the questionnaire, 302 completed spirometry testing, 306 completed impulse oscillometry, and

Page 37Health Hazard Evaluation Report 2012-0055-3337
303 completed at least one microbiome test. Of the 307 employee participants, 250 (81%) completed spirometry testing during both the 2013 and 2016 medical surveys.
Table 16B displays the participants’ demographic characteristics, Table 17B displays the participants’ work history characteristics, and Table 22B displays participants’ reported activities and exposures outside of work by current department. The majority of participants were male, white, and never-smokers. Current department was distributed among administration (36%), assembly (30%), and machine shop (34%). Employees working in the machine shop more often reported participating in farming activities compared with employees working in administration or assembly. Employees working in administration more often reported exposure to mold or mildew at home compared with employees working in assembly or the machine shop.
Table 18B displays participants’ responses to questions on symptoms. The most commonly reported symptoms were nasal (50%), eye (33%), and asthma-like symptoms (24%). Work-related nasal symptoms were reported by 9%, work-related eye symptoms by 6%, and work-related asthma-like symptoms by 5%. The majority of shortness of breath (78%), cough (83%), wheeze (91%), and flu-like illness (100%) was reported to have started after hire.
Table 18B also displays responses to questions on diagnoses. The most commonly reported diagnoses were sinusitis (33%), hay fever (20%), and pneumonia (15%). Nine percent of participants reported ever having received a diagnosis of asthma, and 5% reported currently having a diagnosis of asthma. Other diagnoses (data not displayed) were less frequently reported. Eleven (4%) participants reported an autoimmune disease, and fewer than five participants reported having a diagnosis of chronic bronchitis, COPD, or common variable immunodeficiency. A substantial proportion of the total hay fever (38%), eczema (48%), pneumonia (49%), and asthma (22%) diagnoses was reported to have been diagnosed after hire.
Table 19B compares the prevalence of symptoms among participants by current department with the U.S. adult population. All participants were approximately 1.7 times more likely to report wheeze in the last 12 months and 1.5 times more likely to report ever having received a diagnosis of hay fever. Participants were less likely to report shortness of breath on exertion. These associations remained significantly increased in analyses by current department, with the exceptions that among participants currently in assembly and the machine shop, shortness of breath was not significantly different than expected, and among participants in the machine shop, hay fever was not significantly different than expected.
Table 20B displays the prevalence of symptoms and self-reported diagnoses by current department categories. Symptoms were generally more common among employees currently working in assembly and in the machine shop. Employees working in assembly were significantly more likely to have shortness of breath on exertion and usual cough; whereas, employees working in administration were significantly more likely to have had a diagnosis of eczema.

Page 38 Health Hazard Evaluation Report 2012-0055-3337
Table 23B displays the spirometry and impulse oscillometry test results. Among all participants, the mean percent predicted values for FEV1 (101%) and FVC (103%) were normal. Fourteen (5%) of the 299 participants who had an interpretable spirometry test had an abnormal result. Severity varied as follows: nine abnormalities were mild, one was moderate, three were severe, and one was very severe. Among those abnormalities classified as severe or very severe, one was a restrictive pattern, and three were a mixed pattern.
A total of 250 participants had interpretable spirometry results from both 2013 and 2016. Twelve (5%) had a decline in FEV1 or FVC of 10% or greater from baseline (in addition to expected age-related decline). One participant had a decline in FVC, but not FEV1, of 10% or greater. Eleven (4%) participants had declines of greater than 10% in FEV1; of these, three (1%) had declines of greater than 15% in FEV1, which is a less sensitive but more specific indicator of loss of lung function. Two of these participants had declines in FEV1 far in excess of 15%; they are described below. Eight (3%) participants had declines of greater than 10% in FVC; of these, four (2%) had declines of greater than 15% in FVC. Ten of the 12 participants with declines in FEV1 or FVC of 10% or more worked in assembly or the machine shop. The three participants with declines greater than 15% in FEV1 worked in the production area.
Sixty-five participants had oscillometry results interpreted as abnormal as follows: 30 (10%) participants were characterized as having a small airways abnormality, 23 (8%) as having a large airways abnormality, and 12 (4%) as having a small and large airways abnormality. Among the 65 participants with oscillometry results interpreted as abnormal, 11 (17%) had shortness of breath on exertion and 21 (32%) had wheeze in the last 12 months. In comparison, among the 241 employees with normal oscillometry results, 10 (4%) had shortness of breath on exertion and 37 (15%) had wheeze in the last 12 months. Participants with oscillometry characterized as abnormal worked in administration (n=18 [16% of total administration participants]), assembly (n=25 [27%]), and machine shop (n=22 [21%]). Six participants had both abnormal spirometry and abnormal oscillometry.
Two participants (Employees A and B) were identified as having respiratory symptoms and declines in lung function worrisome for the development of severe lung disease. Employee A began working in the production area less than five years before the 2013 medical survey. During the 2013 medical survey, Employee A reported the onset of wheezing approximately 19 months after beginning employment in the production area. The wheezing was reported as the same when away from the facility. The 2013 spirometry test demonstrated a normal FEV1, normal FVC, and a reduced FEV1/FVC ratio. Following administration of a bronchodilator, FEV1 increased by 11.3%, FVC increased by 2.6%, and FEV1/FVC increased by 5.7%. As the FEV1 was not low, these findings did not meet our definition of obstruction, but we noted the decreased FEV1/FVC ratio could indicate possible airways obstruction. During the 2016 medical survey, Employee A reported a chronic cough that began one year earlier and did not improve when away from the facility, shortness of breath on exertion, wheeze, and chest tightness. The 2016 spirometry test indicated severely reduced FEV1, reduced FVC, and reduced FEV1/FVC ratio, consistent with a severe mixed obstructive and restrictive pattern. Employee A’s change in spirometric parameters from 2013 to 2016 was

Page 39Health Hazard Evaluation Report 2012-0055-3337
far in excess of that expected with normal aging; the FEV1 decreased over 2,000 mL (53% decline), and the FVC decreased over 2,300 mL (41% decline).
Employee B began working in the production area less than five years before the 2013 medical survey. During the 2013 medical survey, Employee B reported no respiratory symptoms. The 2013 spirometry test indicated mildly reduced FEV1, reduced FVC, and normal FEV1/FVC ratio, consistent with a mild restrictive pattern. Following administration of a bronchodilator, FEV1 decreased by 1.5%, FVC increased by 0.1% and FEV1/FVC decreased by 1.2%. During the 2016 survey, Employee B reported shortness of breath on exertion that did not improve when away from the facility. The 2016 spirometry test demonstrated severely reduced FEV1, reduced FVC, and normal FEV1/FVC ratio, consistent with a severe restrictive pattern. Employee B’s change in spirometric parameters from 2013 to 2016 was far greater than expected with normal aging; the FEV1 decreased over 1,000 mL (36% decline), and the FVC decreased over 1,150 mL (30% decline).
One employee who worked in the production area and was identified as having excessive decline in lung function underwent an open lung biopsy in 2017. Lung tissue specimens were characterized as having the same findings as previously found among four earlier cases of severe lung disease characterized by pathologists as lymphocytic bronchiolitis with extension into alveolar ducts and emphysema. Other clinical characteristics for this employee are included with the four other employees described above. This employee had no associations outside of the workplace with the other four employees who were characterized as having lymphocytic bronchiolitis with extension into alveolar ducts and emphysema.
Table 27B displays the clinical characteristics of the five employees diagnosed with the unusual and advanced lung disease characterized as lymphocytic bronchiolitis with extension into alveolar ducts and emphysema. Each of these employees worked in the machine shop or assembly areas, and each had sinus congestion, cough, wheeze, and shortness of breath on exertion. The mean percent predicted FEV1 (44%) and mean percent FEV1/FVC (54%) were low as was the mean percent predicted DLCO (60%). Each of the five employees underwent CT testing; five had observed emphysema and four had bronchial disease. None of the employees had CT scan findings consistent with the diagnosis of hypersensitivity pneumonitis. One of the five employees underwent lung transplantation, and the remaining four had ongoing chronic shortness of breath on exertion. Two of the employees were siblings, but otherwise there were no known associations outside of the workplace among the employees. They lived in three separate communities. All were nonsmokers, and activities that occurred outside of work also did not explain the presence of this unusual and advanced lung disease.
Table 28B displays characteristics from the 2013 and 2016 medical surveys for the 12 participants who had declines of ≥10% in FEV1 or FVC since the 2013 medical survey. The majority of these participants worked in the assembly or machine shop areas, and were never smokers. Compared with their responses during the 2013 medical survey, a greater proportion of these participants during the 2016 survey reported shortness of breath on level ground, shortness of breath walking with people of their own age, shortness of breath when

Page 40 Health Hazard Evaluation Report 2012-0055-3337
walking at their own pace, and usual cough. Among participants with this level of decline in FEV1 or FVC, the number with severe or very severe abnormalities on spirometry increased from one in 2013 to four in 2016.
Table 24B displays adjusted comparisons with the U.S. adult population for spirometric abnormalities. Both obstruction and obstruction including mixed pattern appeared to be less common among the population of participants as a whole than expected, but these differences were not statistically significant. Restriction was significantly less common among the population of participants compared with the general U.S. population.
2016 Microbiome AnalysesA summary of the key findings of the microbiome analyses are displayed here. Figures and a detailed description of the results are located in Appendix D.
● In-use non-preserved metalworking fluid samples had fewer number of bacterial species compared with in-use preserved metalworking fluid samples.
● In-use preserved metalworking fluid samples were enriched with different types of bacteria, including Brevundinomonas, Alcaligenaceae (u.g.), and Sphingobacterium. In contrast, non-preserved metalworking fluid samples were predominantly enriched with Pseudomonas.
● When the types of bacteria found in the air samples were compared with the types of bacteria found in the metalworking fluid samples, the air samples from assembly and the machine shop areas were more similar to the metalworking fluid samples than were the air samples from administration. These findings demonstrate that air samples from the assembly and machine shop areas were influenced by metalworking fluids.
● Non-preserved metalworking fluid had greater similarity to human skin, nasal, and oral wash samples from employees in the machine shop compared with the similarity between non-preserved metalworking fluid and the same samples from employees in administration. A similar trend was noted among preserved metalworking fluid and skin samples, where similarity was greater for employees in the machine shop. These findings reveal that samples obtained from employees in the machine shop area were influenced by the microbial composition of metalworking fluid.
● Pseudomonas was consistently enriched in the skin, nasal, and oral wash samples among employees in the machine shop area compared with samples from employees in the administration or assembly areas.
● The most abundant operational taxonomic unit differentially enriched in metalworking fluid and the employee samples was annotated to the genus Pseudomonas (Pseudomonas_813945).
Discussion We conducted two site evaluations in 2013 and 2016 in response to a 2012 health hazard

Page 41Health Hazard Evaluation Report 2012-0055-3337
evaluation request from employees who were concerned about workplace exposures and lung health. Four employees were identified as having a severe lung disease, which prompted a detailed industrial hygiene survey and medical investigation to better understand the cause of the severe lung disease and identify potential prevention opportunities. The 2013 evaluation was designed to characterize the severe lung disease experienced by four employees, describe workplace exposures through collection of air samples and bulk fluid samples, and to assess the prevalence of respiratory symptoms and breathing abnormalities among employees. The air sampling strategy included a variety of samples including metalworking fluid, metals, volatile organic compounds, and bioaerosols designed to allow for a comprehensive evaluation. The 2016 follow-up evaluation was designed to allow us to determine the prevalence of respiratory symptoms and lung function abnormalities among the current employees. In addition, we evaluated the lung function change between 2013 and 2016 among individuals and across the entire population of participants at both time points. Additionally, the collection of general area air samples and bulk fluid samples provided information on current workplace exposures.
In total, five relatively young, non-smoking employees developed an unusual and advanced lung disease during employment with lymphocytic bronchiolitis and scattered B-cell predominant follicles without germinal centers, extension into alveolar ducts, and emphysema characterized by pathologists as “B-cell bronchiolitis-alveolar ductitis and emphysema.” Each of these employees worked in either the machine shop or assembly. The clinical presentation and course of the disease in each employee was similar. All five employees experienced sinus congestion, cough, wheeze, and shortness of breath on exertion. Spirometry revealed substantially reduced FEV1 for each employee. In addition, elevated residual volumes indicated air trapping and reduced DLCOs indicated impairment of air exchange. CT images for each of the five employees revealed centrilobular emphysema and an absence of ground glass opacities and centrilobular nodules. Thus, the CT scan findings for each of the employees were not typical for hypersensitivity pneumonitis, while both CT and lung function data documented the prominent role of emphysema in the employees’ respiratory illness. These employees experienced significant respiratory impairment, and one underwent lung transplantation.
While not certain, indications that workplace exposures at the facility contributed to development of lung disease include the following: 1) an unusual and advanced lung disease was identified in a cluster of five employees all working in the production area of a single manufacturing facility. It seems unlikely that such a cluster would have occurred by chance; 2) the five employees lived in three separate communities in the greater area and had no shared exposures to respiratory hazards outside of work that we could ascertain; 3) respiratory symptom onset for each of the five employees began after beginning work at the facility; and 4) other cases of this unusual and advanced lung disease were not recognized by physicians in the community, or at a regional medical centers or tertiary referral center. The tissue specimens from five facility employees demonstrated an unusual combination of pathological findings differing from various previously-recognized conditions such as constrictive bronchiolitis, hypersensitivity pneumonitis, follicular bronchiolitis, and diffuse

Page 42 Health Hazard Evaluation Report 2012-0055-3337
panbronchiolitis [Poletti et al. 2006, Visscher and Myers 2006, Tomashefski 2008, Allen 2010, Leslie and Wick 2017]. Unlike constrictive bronchiolitis, these specimens had more of an inflammatory component with prominent lymphoid follicles, primarily involved the respiratory bronchioles and alveolar ducts, had a notable absence of airway fibrosis and obliteration of the airways, and had the presence of background emphysema. The specimens from the five employees were also distinct from hypersensitivity pneumonitis in the absence of granulomas as a prominent feature, the primary involvement of the respiratory bronchioles and alveolar ducts, the presence of primarily B-cell follicles and not T-cells, and the presence of background emphysema. The specimens also differed from follicular bronchiolitis in the presence of primary follicles without germinal centers, a greater involvement of respiratory bronchioles and alveolar ducts, and the presence of background emphysema. Finally, the specimens differed from those seen in diffuse panbronchiolitis considering that while foamy macrophages were noted, they were primarily interstitial and not a dominant component, the substantial involvement of the alveolar ducts, and the follicles were primary and not secondary.
Chest CT scans demonstrated centrilobular emphysema, pulmonary function tests demonstrated airways obstruction and decreased diffusing capacity of the lung for carbon monoxide, and pathological examination of lung tissue samples all documented the prominent role of emphysema in the severe respiratory disease process affecting five employees. Emphysema is part of a spectrum of lung disease referred to as COPD. In the general population, cigarette smoking is the most important risk factor for COPD. However, all five affected workers were nonsmokers. COPD can also be caused by various occupational exposures [Eisner et al. 2010]. A review found that evidence for occupational exposures causing COPD was strongest for coal mining and work entailing exposure to silica, cotton dust, or cadmium fume, with less conclusive evidence for welding fume, agricultural dusts, and diesel fume [Cullinan 2012]. A recent population-based European study of occupational exposures and COPD concluded that exposure to biological dusts, gases and fumes, and pesticides was associated with increased COPD incidence, with occupational exposures accounting for 21% of cases in the study population [Lytras et al. 2018]. Various exposures in the facility with the potential to contribute to the development of emphysema could possibly include chemical and welding fumes, biological materials such as metalworking fluids containing microbial products such as endotoxin, metal particles, and perhaps others. However, these exposures have not been associated with the combination of emphysema with lymphocytic bronchiolitis and alveolar ductitis seen in affected employees.
Evaluation of the workforce as a whole identified respiratory symptoms among workers other than the five identified as having B-cell bronchiolitis-alveolar ductitis and emphysema. During the 2013 medical survey, some respiratory symptoms (but not lung function abnormalities) were more common among production and facility employees with higher workplace exposures to thoracic aerosol, metalworking fluid, and endotoxin, a component of some bacteria.
Similar to the 2013 medical survey, we determined in the 2016 medical survey that nasal symptoms, eye symptoms, and asthma-like symptoms were the most common symptoms

Page 43Health Hazard Evaluation Report 2012-0055-3337
reported. Nearly 50% of participants in the 2016 medical survey reported nasal symptoms, 33% eye symptoms, 24% asthma-like symptoms, and 19% wheezing. When comparisons were performed across departments, these symptoms generally occurred more frequently among current employees in the assembly and machine shop areas than among employees in the administration area. Employees in the assembly and machine shop areas were also more likely to report current asthma or ever receiving the diagnosis of asthma. Compared with employees in the administration area, a higher percentage of employees in assembly and machine shop areas reported having work-related asthma symptoms, nasal symptoms, eye symptoms, and rash.
Despite associations between respiratory health symptoms and workplace factors across the workforce as a whole, only five employees developed the severe lung disease characterized as lymphocytic bronchiolitis with extension into alveolar ducts and emphysema. Based on the evaluation of this single disease cluster occurring in a complex work environment that lacked exposures standing out as unique or unusual, it is not possible to determine what specific exposure or combination of exposures might have been causative. In addition, because only five production employees developed severe disease, it is possible that some as-yet unknown individual susceptibility factors contributed to disease development following one or more occupational exposures.
Fourteen of the 2016 participants had an abnormal spirometry result, and 65 had an abnormal impulse oscillometry result. Across all workers, lung function abnormalities were not more common among employees who worked in the assembly and machine shop areas compared with administration. Participants with abnormal impulse oscillometry had a higher prevalence of shortness of breath on exertion and wheeze compared with participants who had normal impulse oscillometry. Twelve participants who participated in both the 2013 and 2016 surveys had declines in their lung function of 10% or greater; of these, 10 worked in the assembly or machine shop areas. We used a decline of ≥10% in FEV1 or FVC between 2013 and 2016 as a sensitive threshold for analysis [Redlich 2014]. A greater proportion of the participants with a decline of ≥10% in FEV1 or FVC had respiratory symptoms in 2016 compared with 2013, further demonstrating a worsening in the respiratory health for some of these participants.
Three participants had declines in their FEV1 between 2013 and 2016 of 15% or greater, a less sensitive but more specific indicator of excessive decline than the lesser threshold of 10% [Redlich 2014]. Two participants had marked declines far greater than 15%. The occurrence of these declines, and the biopsy findings identified in one participant that were consistent with those identified among the four index cases, raises the concern there might have been an ongoing causative workplace exposure in the production area during 2013–2016. Continued medical monitoring of the workforce using spirometry with attention to excessive declines in lung function could help to identify employees who are developing lung disease at early enough stages to prevent symptomatic illness through modification of work activities.
The disease occurring here in some ways resembles flock workers’ lung, which is caused by

Page 44 Health Hazard Evaluation Report 2012-0055-3337
inhalation of synthetic materials such as nylon, rayon, and polyester, and has been described “as a lymphocytic bronchiolitis and peribronchiolitis with lymphoid hyperplasia represented by the presence of lymphoid aggregates” [Eschenbacher et al. 1999]. However, flock workers’ lung differs from the disease encountered in the current investigation in a number of ways. Pathologically, flock workers’ lung is not reported as extending into the alveolar ducts or being associated with emphysema. Radiologically, flock workers’ lung is often associated with ground glass opacities and micronodules. Pulmonary function tests most often demonstrate restriction [Eschenbacher et al. 1999, Kern 2000, Weiland et al. 2003].
Various processes at this facility had the potential to generate airborne exposures to metal and silica particles and one employee had such particles demonstrated in his lung tissue. However, the disease encountered here is not pathologically or radiologically consistent with hard metal lung disease [Mizutani et al. 2016] or silicosis [Leung et al. 2012].
During the evaluation, we carefully evaluated metalworking fluid and related exposures. The reason for special attention to this specific exposure was that in other settings it has been associated with outbreaks of hypersensitivity pneumonitis, a type of immunologically-mediated lung disease. However, it should be noted that despite the lymphocytic nature of bronchiolitis and alveolar ductitis identified in the affected employees’ lung tissue samples, their pathological findings and chest CT scans were not consistent with hypersensitivity pneumonitis and if a hypersensitivity pneumonitis-like process was present, it would be an atypical presentation. In addition to hypersensitivity pneumonitis, occupational exposure to metalworking fluid has been associated with upper and lower respiratory symptoms, skin symptoms, respiratory diseases including asthma and chronic bronchitis, and other adverse health effects [Kreiss and Cox-Ganser 1997, NIOSH 1998, Zacharisen et al. 1998, Suuronen et al. 2008, Jaakkola et al. 2009, Rosenman 2009, Burton et al. 2012].
The exact components of metalworking fluids responsible for causing hypersensitivity pneumonitis in other settings has never been definitively established, although evidence points to microbial contaminants [Kreiss and Cox-Ganser 1997; Beckett et al. 2005]. Systems using water-miscible fluids are prone to population with multiple types of bacteria. According to the manufacturer of the metalworking fluid used in this facility, the non-preserved metalworking fluid being used in the majority of machines was expected to be predominated by one species of gram-negative bacteria, Pseudomonas oleovorans/pseudoalcaligenes [Kuenzi et al. 2014, Dilger et al. 2005], which should limit the growth of other bacteria. Pseudomonas oleovorans/pseudoalcaligenes was the only gram-negative bacteria identified by culture in the bulk samples in 2016. However, Pseudomonas was not the predominant genus detected in facility bulk fluid samples using 16S rRNA gene analysis. In 2013, nine other types of gram-negative bacteria were measured in addition to Pseudomonas oleovorans/pseudoalcaligenes in the bulk samples. Although Pseudomonas was present and could be cultured, other types of bacteria that could not be cultured (grown) were actually more common in these samples than Pseudomonas. Similarly, for samples of in-use non-preserved metalworking fluid samples collected at a different facility, Pseudomonas oleovorans/pseudoalcaligenes was not one of the top three bacterial species identified [NIOSH 2015].

Page 45Health Hazard Evaluation Report 2012-0055-3337
The microbiome analyses demonstrated that four facility employees with severe lung disease characterized as lymphocytic bronchiolitis with extension into alveolar ducts and emphysema and employees working in the production area were likely exposed to bacteria from metalworking fluids used in the facility. The analyses highlighted differences in the bacterial populations of lung tissue from four facility employees with lymphocytic bronchiolitis with extension into alveolar ducts and emphysema compared with lung tissue from 20 people who did not work at the facility and did not have this unusual and advanced lung disease. It is of interest that some of the lung tissue samples from facility employees had high relative abundance of Pseudomonas andersonii, as this species has been associated with pulmonary granuloma [Han et al. 2001; Simmon et al. 2011]. It is also of interest that in-use metalworking fluid collected from the facility in June 2012 and February 2013 was able to stimulate and activate mouse B-cells following in vitro exposure, indicating the metalworking fluid might be a source of immune stimulation.
NIOSH recommends limiting exposures to metalworking fluid aerosols to 0.4 mg/m3 thoracic particulate mass as a TWA concentration, for up to 10 hours per day during a 40-hour workweek [NIOSH 1998]. There are no exposure limits for endotoxins set by OSHA or recommended by NIOSH. In 2010, DECOS recommended a health-based exposure limit for airborne endotoxin of 90 EU/m3 as an 8-hour TWA [DECOS 2010]. Exposures to metalworking fluid levels below the NIOSH recommended exposure limit and endotoxin below the DECOS exposure limit have been associated with respiratory symptoms [Reed and Milton 2001, DECOS 2010, Park et al. 2008, Lillienberg et al. 2010, Broadwater et al. 2016]. In addition, the majority of hypersensitivity pneumonitis outbreaks have occurred in facilities where air sampling results for metalworking fluids were within exposure limits [Burge 2016].
During the 2016 industrial hygiene survey, the average concentrations of total thoracic aerosol, extracted metalworking fluid, and endotoxin in air were lower than measured in the February 2013 survey. The NIOSH recommended exposure limit is based on personal air sampling; thus, area air samples are not directly applicable to determination of adherence to the recommended exposure limit [NIOSH 1998]. Still, all total thoracic aerosol concentrations measured by area air sampling were below the concentrations specified for relevant occupational exposure limits. The highest concentration of airborne endotoxin was measured in the CNC Department and was just under one-half of the endotoxin exposure limit recommended by the DECOS of 90 EU/m3. This might be in part because of the installation of nine additional mist collectors after the February 2013 evaluation. In addition, during the September 2016 sample collection many of the doors and windows were open allowing for additional natural ventilation not available in February 2013.
NIOSH recommends annual exposure monitoring for metalworking fluids. If employee exposures are at or above one-half of the recommended exposure limit (0.2 mg/m3) sampling should be done at least every six months [NIOSH 1998]. Exposures should be reevaluated if changes are made to production, machining equipment, or engineering controls. If employees report symptoms related to work, exposure monitoring in their particular work area should be considered. Employees should be notified of all sampling results. Additional information on exposure monitoring can be found in the NIOSH Criteria for a Recommended Standard:

Page 46 Health Hazard Evaluation Report 2012-0055-3337
Occupational Exposure to Metalworking Fluids (https://www.cdc.gov/niosh/docs/98-102/pdfs/98-102.pdf) and in OSHA’s Metalworking Fluids: Safety and Health Best Practices Manual (https://www.osha.gov/SLTC/metalworkingfluids/metalworkingfluids_manual.html).
No limits have been established for endotoxin concentrations in bulk metalworking fluids. Although the bacterial concentrations in the in-use fluids were generally similar in 2013 and 2016, endotoxin concentrations were lower in 2016 (range: 15 EU/mL to 10,059 EU/mL) compared with 2013 (range: 338 EU/mL to 390,633 EU/mL). To confirm this difference in endotoxin concentrations was not caused by analytical issues, we reanalyzed some 2016 samples and were confident the results were valid.
The endotoxin levels measured in the bulk samples in 2013 and 2016 do not indicate excessive levels relative to other reported studies. For example, one study reported endotoxin levels in bulk metalworking fluids ranging from below the LOD to 1,870,000 EU/mL [Simpson et al. 2003]. Concentrations of endotoxin in eight bulk metalworking fluid samples from a rifle barrel manufacturing company using a similar non-preserved metalworking fluid ranged from 3.36 EU/mL to 598 EU/mL [NIOSH 2016]. Endotoxin concentrations ranged from 77,300 EU/mL to 527,000 EU/mL in a different facility using a non-preserved metalworking fluid [NIOSH 2015].
Conclusions While not certain, indications that workplace exposures at the facility contributed to development of lung disease include the following: 1) an unusual and advanced lung disease was identified in a cluster of five employees all working in the production area of a single manufacturing facility; 2) the five employees lived in three separate communities in the greater area and had no shared exposures to respiratory hazards outside of work that we could ascertain; 3) respiratory symptom onset for each of the five employees began after beginning work at the facility; and 4) other cases of this unusual and advanced lung disease were not recognized by pulmonologists in the community, or at a regional medical center or tertiary referral center.
Medical findings indicated the potential usefulness of longitudinal spirometry for early detection of disease. Eleven participants had declines in FEV1 exceeding 10% between 2013 and 2016, with three having declines in FEV1 exceeding 15%. An additional participant had a drop in FVC exceeding 10%. Ten of the 12 employees with declines in lung function exceeding 10% worked in the assembly or machine shop areas. One employee with excessive decline in FEV1 exceeding 15% was later identified following an open lung biopsy as having the same unusual and advanced lung disease as previously identified among four employees.
Loss of lung function in some employees occurred despite apparent reductions in overall concentrations of thoracic aerosol and extracted metalworking fluids in air samples collected during the 2016 survey compared with the 2013 survey. The installation of nine new mist collectors and the natural ventilation from open windows and bay doors might have contributed to the decrease in these concentrations.

Page 47Health Hazard Evaluation Report 2012-0055-3337
It is possible that workplace exposures in the assembly or machine shop areas occurring since 2013 contributed to the worsening of lung function among certain employees. In view of these findings, we recommend engineering controls to maintain production-related airborne exposures to the lowest level feasible and administrative controls to ensure that only those who need to be in production areas are present. We also recommend ongoing periodic respiratory health screening to detect any additional employees developing respiratory disease as early as possible so that efforts can be made to prevent progression to severe disease. Such efforts could include reassignment to non-production areas, use of respiratory protection in production areas, and frequent medical follow-up to assess the impact of these interventions.
Recommendations Based on our findings, our final comprehensive recommendations to prevent future cases of lung disease are listed below. These include recommendations to identify, should they occur, any new cases early in their course. We encourage the facility to use a labor-management health and safety committee or working group to discuss our recommendations and develop an action plan. Those involved in the work can best set priorities and assess the feasibility of our recommendations for the specific situation at this paper converting equipment manufacturing facility.
Our recommendations are based on an approach known as the hierarchy of controls. This approach groups actions by their likely effectiveness in reducing or removing hazards. In a majority of cases, the preferred approach is to eliminate hazardous materials or processes and install engineering controls to reduce exposure or shield employees. Until such controls are in place, or if they are not effective or feasible, administrative measures and personal protective equipment might be needed.
Elimination or SubstitutionThe most effective means of reducing hazards are elimination or substitution. Removal of a hazard is the most effective control while substitution is the second most effective method for control.
1. Because a causative exposure or combination of exposures could not be definitively identified, we cannot recommend elimination or substitution of any specific material in the workplace. Instead, we recommend comprehensive efforts to minimize all airborne exposures as noted below.
Engineering ControlsEngineering controls reduce exposures to employees by removing the hazard from the process or placing a barrier between the hazard and the employee. Engineering controls can be effective at protecting employees without placing primary responsibility of implementation on the employee.

Page 48 Health Hazard Evaluation Report 2012-0055-3337
1. Reduce exposures to production-related aerosols and vapors as much as feasible.
a. Optimize ventilation configurations to minimize the migration of airborne contaminants generated in the machine shop to assembly areas and maintain ventilation so that contaminants generated in either production area cannot migrate into the administration areas.
b. Routinely evaluate the effectiveness of local exhaust ventilation such as mist collection systems to assure they function at high efficiency. Regularly inspect all mist collection systems and clean or replace their air filters following the manufacturer’s recommendations.
2. Employ the range of controls suggested by OSHA in its document Metalworking Fluids: Safety and Best Health Practices Manual available at https://www.osha.gov/SLTC/metalworkingfluids/metalworkingfluids_manual.html to reduce exposures to metalworking fluid aerosols to as low as feasible. Conduct periodic air sampling for metalworking fluids to ensure controls continue to be effective. Note that the immunologically-mediated lung disease hypersensitivity pneumonitis has been documented to occur even at levels below occupational exposure limits. Because of the severity of lung disease that has occurred in some employees, and the concern that lymphocytic bronchiolitis with extension into alveolar ducts and emphysema might also occur at low levels of exposure, efforts to achieve metalworking fluid aerosol air concentrations as low as feasible are likely justified.
Administrative ControlsAdministrative controls are management-determined work practices and policies to reduce or prevent exposures to workplace hazards. The effectiveness of administrative changes in work practices for controlling workplace hazards is dependent on management commitment and employee acceptance. Regular monitoring and reinforcement is necessary to ensure control policies and procedures are not circumvented for convenience or production.
1. Limit employees in machine shop and assembly areas and in proximity to processes generating airborne contaminants to only those needing to be present.
2. Continue with the fluid management plan including procedures for metalworking fluid maintenance, and change-out and cleaning schedules. Your metalworking fluid supplier should be able to provide you with specific information for draining, cleaning and recharging procedures.
3. Continue working with the metalworking fluid supplier to monitor levels of microbial growth and maintain levels at the lowest concentration feasible while appropriate for optimal fluid performance.
Personal Protective EquipmentRespiratory personal protective equipment (PPE) must be used properly to reliably protect against hazardous exposures. Because many things can go wrong, proper use of PPE requires implementation of a comprehensive respiratory protection program and a high

Page 49Health Hazard Evaluation Report 2012-0055-3337
level of employee and management involvement and commitment. The right PPE must be chosen for each hazard. The respiratory protection program should ensure good practices such as employee training in the use of respirators, appropriate respirator maintenance and change-out schedules, medical assessment of employees for their ability to wear respirators, and annual fit testing to ensure respirators used by employees fit properly. Because of the potential for things to go wrong, PPE should not be the sole method for controlling hazardous respiratory exposures. Rather, PPE should be used until effective engineering and administrative controls are in place.
In the document Criteria for a Recommended Standard: Occupational Exposure to Metalworking Fluids, NIOSH notes the primary goal of a respiratory protection program is to reduce metalworking fluid aerosol exposures to concentrations below the recommended exposure limit. The secondary goal is to reduce these exposures further to protect employees who might experience adverse respiratory effects at concentrations below the recommended exposure limit. A possible (but unevaluated) use of personal respiratory protection might be to protect unaffected employees who are not exposed at concentrations above the recommended exposure limit, but who work in a facility with recent disease outbreak (e.g., hypersensitivity pneumonitis) associated with metalworking fluid aerosol [NIOSH 1998].
We recommend the prudent use of respiratory protection as follows:
1. Continue current use of respiratory protection targeted to specific tasks and jobs. The Respirator Program Administrator should work with employees to ensure the chosen respirator fits properly.
2. Provide respiratory protection to employees for whom a physician has determined respiratory protection is necessary to further reduce exposure to gases, vapors, or particulates such as metalworking fluid aerosols. In the case of particulates, caused by the presence of metalworking fluid, we recommend any air-purifying respirator equipped with any P- or R-series particulate filter or any powered, air-purifying respirator equipped with a hood or helmet, and a high efficiency particulate air (HEPA) filter. Particulate air filters will not protect against gases or vapors, which require use of cartridges appropriate to the exposure. Respirators have a range of assigned protection factors. Provide the type of respirator determined to be necessary by the employee’s physician.
3. Provide disposable filtering facepiece respirators with any P- or R-series particulate filter for voluntary use by employees who enter production areas and wish to further reduce exposure to airborne particles, including metalworking fluid aerosols. Disposable respirators should be available in various sizes, and each potential user should receive a copy of Appendix D of the OSHA Respiratory Protection Standard (https://www.osha.gov/pls/oshaweb/owadisp.show_document?p_table=standards&p_id=9784) Information about voluntary use of respirators can be found on the OSHA website at https://www.osha.gov/video/respiratory_protection/voluntaryuse_transcript.html. Directions for how to properly put on and take off a disposable respirator can be found on the NIOSH website at https://www.cdc.gov/niosh/docs/2010-133/pdfs/2010-133.pdf.

Page 50 Health Hazard Evaluation Report 2012-0055-3337
Medical SurveillanceMonitoring of spirometry results over time can help individual employees by identifying early stages of lung disease so steps can be taken to stop progression to severe disease. Monitoring results can be used at the population level to evaluate the effectiveness of current controls in preventing disease and to prioritize the introduction of new controls. Spirometry quality is crucial to this effort: without high quality spirometry, it is impossible to know if year-to-year variations in values are real or reflect imprecise measurements.
1. Start an annual medical surveillance program for employees that work in the production area. The program should include a respiratory symptom questionnaire and spirometry. We recommend annual screening because of the marked changes in FEV1 identified in some employees over the three-year period from 2013 to 2016. The ACOEM guidance statement for conducting spirometry in the occupational health setting contains much useful information and can be found here: https://journals.lww.com/joem/Fulltext/2011/05000/Spirometry_in_the_Occupational_Health_Setting_2011.16.aspx. Another useful source of information is the American Thoracic Society statement on occupational spirometry [Redlich 2014]. If you wish, NIOSH staff are available to assist you in developing and ensuring the quality of the surveillance program.
2. Ensure that spirometry provided to employees is of high quality. Multiple resources are available to assist in this. An OSHA/NIOSH Infosheet on spirometry screening and surveillance resources [NIOSH 2011] includes a checklist for employers detailing critical elements of spirometry testing that should be considered for inclusion in contracts with providers. OSHA’s Best Practices document [OSHA 2013] might also be useful. In addition, the NIOSH publication Spirometry Quality Assurance: Common Errors and Their Impact on Test Results [NIOSH 2012] is a good resource.
3. The medical professional providing surveillance services to employees should routinely compare spirometry test results to previous results to monitor changes in lung function over time. A decline in percent predicted FEV1 of 15% or greater from baseline is excessive and should definitely prompt further medical evaluation to assess for respiratory disease [Redlich 2014]. However, a decline in percent predicted FEV1 of 10% or greater from baseline can potentially be used as a more sensitive (though less specific) for early detection of disease [Redlich 2014]. Given the severity of disease identified in some employees, we recommend careful medical evaluation and follow up of employees exceeding the 10% threshold. An available resource for following serial spirometry tests is NIOSH’s Spirometry Longitudinal Data Analysis (SPIROLA) software. SPIROLA is a visual and quantitative tool intended to assist the healthcare provider in monitoring and interpreting computerized longitudinal spirometry data for individual patients and for a group. SPIROLA can be downloaded free from the NIOSH website (https://www.cdc.gov/niosh/topics/spirometry/spirola-software.html). If desired, NIOSH staff are available to assist with setting up and using this software.
4. The medical professional providing surveillance services should periodically provide reports of results aggregated from the entire employee population so that any problems

Page 51Health Hazard Evaluation Report 2012-0055-3337
suggested by health surveillance can be recognized and addressed. These reports should protect individual patient confidentiality consistent with any applicable federal or state requirements. The occurrence of new or worsening respiratory symptoms, excessive declines in lung function, or documentation of new cases of severe lung disease in the workforce should prompt consideration of work-related lung disease and re-evaluation of the potential for exposure to respiratory hazards. The identification of any additional cases of lymphocytic bronchiolitis with extension into alveolar ducts and emphysema or cases of severe lung disease with an unknown cause among the facility’s employees should be reported immediately to the local health department according to state disease reporting rules.
5. Apart from annual surveillance, we recommend encouraging employees to report new or ongoing or worsening respiratory symptoms to their healthcare providers and, if they are willing, to a designated individual at the facility such as the facility nurse.
6. Refer employees with concerning respiratory symptoms, new spirometric abnormalities, or excessive decline in lung function for further evaluation and management by a physician with specialized training in occupational medicine or pulmonary medicine. Assist in implementation of individualized management plans developed by treating physicians. For example, a physician might recommend use of respiratory protection in production areas, or the temporary or permanent reassignment of a production employee to a non-production position with frequent medical follow-up.
Hazard Communication1. Communicating information about unusual occupational health risks can be
challenging, particularly when evaluations are ongoing and information is incomplete. We recommend continued information sharing with employees. NIOSH staff are available to assist with workforce presentations, if desired.

Page 52 Health Hazard Evaluation Report 2012-0055-3337
Appendix A: MethodsJune 2012 analyses of 10 bulk fluid samples by NIOSH
DNA extraction from bulk fluids For each bulk sample, 50 ml of fluid was chilled on ice and then centrifuged at 4500 x g for 10 minutes. The supernatant was then decanted and stored at 4°C. The pellet was washed twice with sterile-distilled water. Genomic DNA was extracted from the washed pellet using the High Pure PCR Template Kit (Roche, Basel, Switzerland). Cells were lysed by bead beating the washed pellet with 350 µl of the kit’s lysis buffer and 300 µg glass beads (Sigma-Aldrich, St. Louis, MO, USA) for 15 seconds. Beads and cell debris were then separated from the lysis buffer (now containing soluble DNA) by centrifuging for two minutes at 21,000 x g. The supernatant was collected and purified according to the manufacturer’s instructions. Once purified, DNA was stored at -20°C.
Mycobaterium spp. quantitative PCRThe 10 bulk samples collected in June 2012 were analyzed for possible contamination by Mycobacterium. Quantitation of Mycobacterium spp. was measured in the DNA samples using Mycobacterium-specific primers [Khan and Yadav, 2004] and SYBR green fluorescent chemistry (Life Technologies, Carlsbad, CA, USA). Quantitative PCR (qPCR) reactions were prepared as described by Khan and Yadav (2004), and run on an Applied Biosystems 7500 FAST qPCR instrument with the thermocycling parameters of 95°C 20 seconds (initial denaturation), 40 cycles of 95°C for 3 seconds and 59°C for 30 seconds, and finished with a melt-curve analysis gradient. A standard curve was generated with genomic DNA collected from M. immunogenum strain MC-779 (ATCC 700505T), which served as the basis for quantifying the amount of M. immunogenum DNA in the fluid samples.
PCR amplification of bacterial rRNA and fungal rRNA/ITS sequences Evaluation for microbial rRNA gene sequences was performed using DNA extracted from bulk fluids. The universal bacterial primer pair p8FPL [Eden et al., 1991] and p806R [Relman et al., 1992] were used to amplify bacterial rRNA gene sequences from fluid samples, following the PCR parameters described by Relman et al. [1992]. The universal fungal primers, Fun18Sf and ITS4 [White et al. 1990; Pitkäranta et al. 2008] were used to amplify fungal rRNA/ITS sequences, following the PCR parameters described by Pitkäranta et al [2008]. Bacterial and fungal PCR amplicons were purified with a PCR purification kit (Qiagen, Valencia, CA, USA). Five µL of this purified product was then run on a 1% agarose gel containing 0.4 µg/ml ethidium bromide and examined for amplicons using an ultraviolet gel doc (Alpha Innotech, Santa Clara, CA, USA).
Cloning, sequencing, and analysis of rRNA/ITS amplicons Bacterial and fungal rRNA/ITS amplicons were cloned into the pDRIVE vector using a PCR cloning kit (Qiagen, Valencia, CA, USA) according to the manufacturer’s instructions. Ligated plasmids were then transformed into TOP10 chemically competent Escherichia coli cells (Invitrogen, Carlsbad, CA, USA) according to manufacturer’s instructions. The transformants were spread onto Luria-Bertani (LB) agar plates containing 100 µg/

Page 53Health Hazard Evaluation Report 2012-0055-3337
mL ampicillin and a top layer of X-gal. The plates were then incubated overnight at 37°C [Sambrook and Russell 2001]. White colonies were selected and cultured in 1.5 ml LB media containing 100 µg/mL ampicillin overnight at 37°C. The following morning, the E. coli cultures were cooled to 4°C and pelleted by centrifugation at 2250 x g for 5 minutes, resuspended in 15% glycerol, and stored at -80°C. Glycerol stocks were then packed on dry ice and sent to Genewiz Inc (South Plainfield, NJ, USA) for plasmid sequencing with the primers T7 and SP6. When ready, DNA sequencing results were downloaded from the Genewiz website. Vector sequence data were trimmed, and forward and reverse sequences were assembled using Geneious Software (Biomatters Ltd, Auckland, New Zealand). Sequence data were then clustered into operational taxonomic units (OTUs) with MOTHUR software [Schloss et al. 2009] using a 97% identity cutoff. Sequences representative of each OTU were then used in a BLAST search against NCBI’s database to determine the closest genus/species to which the sequence belongs.

Page 54 Health Hazard Evaluation Report 2012-0055-3337
Table 1B. Industrial hygiene sampling methods, NIOSH industrial hygiene survey, February 2013
FlowNumber Sample Liters Analyte of Media/Sampler Analytical MethodsType per Samples Minute
Thoracic aerosol and extracted airborne metalworking fluids
Area 40
37-mm, 2-µm, polytetrafluoroethylene (PTFE) filters (SKC, Inc. Eighty Four, PA). + BGI® thoracic cyclone (BGI Incorporated, Waltham, MA).
1.6
Gravimetric followed by extraction NMAM 5524.
Thoracic aerosol and extracted airborne metalworking fluids
Personal 104
37-mm, 2-µm, polytetrafluoroethylene (PTFE) filters (SKC, Inc. Eighty Four, PA). + BGI® thoracic cyclone (BGI Incorporated, Waltham, MA).
1.6
Gravimetric followed by extraction NMAM 5524.
Endotoxin Area 4037-mm A/E Glass Fiber Filter (Pall Corp., Fort Washington, NY), closed-face filter cassette.
3.0
Kinetic chromogenic Limulus amoebocyte lysate (LAL: Associates of Cape Cod, Inc., Falmouth, MA) assay method
Endotoxin Personal 10437-mm A/E Glass Fiber Filter (Pall Corp., Fort Washington, NY), closed-face filter cassette.
3.0
Kinetic chromogenic Limulus amoebocyte lysate (LAL: Associates of Cape Cod, Inc., Falmouth, MA) assay method
Endotoxin Bulk 3437-mm A/E Glass Fiber Filter (Pall Corp., Fort Washington, NY), closed-face filter cassette.
3.0
Kinetic chromogenic Limulus amoebocyte lysate (LAL: Associates of Cape Cod, Inc., Falmouth, MA) assay method
Bioaerosols Area 23SKC Biosampler® + ViaTrap®mineral oil collection media (SKC, Inc. Eighty Four, PA).
12.5 Culturable bacteria and fungi
Airborne metals Area 4037-mm mixed cellulose ester (MCE) Filter (SKC, Inc. Eighty Four, PA), closed-face filter cassette.
2.0 Elements by ICP, NMAM 7303
Airborne total dust Area 40 37-mm, 0.8-µm polychloride (PC) Filter, closed-face filter cassette. 2.0
Polymerase chain reaction (PCR) analysis
Airborne volatile organic compounds
Area 44450-milliliter (mL) evacuated canisters, capillary-based flow controllers.
--
Gas chromatography and mass spectrometry[LeBouf et al. 2012]
Appendix B: Tables

Page 55Health Hazard Evaluation Report 2012-0055-3337
Analyte Sample Type
Number of
SamplesMedia/Sampler
Flow Liters
per Minute
Analytical Methods
Airborne volatile organic compounds
Area 2 ppbRAE (RAE Systems Inc., San Jose, CA). -- Real-time
measurement
Airborne dust Area 2 DustTrak DRX 8533, (Thermo Scientific Corp., Franklin, MA). -- Real-time
measurement
Bulk fluids Bulk 34 Fluid collected in sterile 50-mL polycarbonate conical vials. -- Culturable bacteria
and fungi
Air temperature and % relative humidity
Area 10Extech 44550 Humidity/Temperature Pen® (Extech Instruments, Waltham, MA).
-- Real-time measurement
Note: NIOSH=National Institute for Occupational Safety and Health; NMAM=NIOSH Manual of Analytical Methods
Table 1B (continued). Industrial hygiene sampling methods, NIOSH industrial hygiene survey, February 2013

Page 56 Health Hazard Evaluation Report 2012-0055-3337
Table 2B. Industrial hygiene sampling methods, NIOSH industrial hygiene survey, September 2016
FlowNumber Sample Liters Analyte of Media/Sampler Analytical MethodsType per Samples Minute
Thoracic aerosol and extracted airborne metalworking fluid
Area 90
37-mm, 2-µm, polytetrafluoroethylene (PTFE) filters (SKC, Inc. Eighty Four, PA). + BGI® thoracic cyclone (BGI Incorporated, Waltham, MA)
1.6
Gravimetric followed by extraction NMAM 5524
Endotoxin Area 9037-mm A/E Glass Fiber Filter (Pall Corp., Fort Washington, NY), closed-face filter cassette
3.0
Kinetic chromogenic Limulus amoebocyte lysate (LAL: Associates of Cape Cod, Inc., Falmouth, MA) assay method
Bulk 33 Sterile 50 mL polypropylene centrifuge tube containers --
Airborne total dust Area 180 37-mm, 0.8-µm polychloride (PC) filter, closed-face filter cassette 2.0 Microbiome
analysis
Bulk fluids Bulk 33 Sterile 50 mL polypropylene centrifuge tube containers --
Culturable bacteria and fungi
Bulk fluids Bulk 60 Sterile 50 mL polypropylene centrifuge tube containers -- Microbiome
analysis
Note: NIOSH=National Institute for Occupational Safety and Health; NMAM=NIOSH Manual of Analytical Methods

Page 57Health Hazard Evaluation Report 2012-0055-3337
Tabl
e 3B
. Bul
k flu
id c
ultu
re re
sults
from
NIO
SH w
alkt
hrou
gh, J
une
2012
Myc
obac
teri
aE
ndot
oxin
EU
/mL
CFU
/mL
Fung
iId
entifi
catio
nC
FU/m
L
B
acte
ria
Iden
tifica
tion
Flu
id S
ampl
edM
achi
ne o
r
Sum
p su
cker
P. o
leov
oran
s/ps
eudo
alca
ligen
es
1,40
0,00
0,00
0Fu
sari
um sp
.20
043
,085
ND
Serr
atia
mar
cesc
ens
10,0
00,0
00Ye
ast
2,50
0
Rad
ial d
rill*
(YM
Z T
RE
-200
0D)
P. o
leov
oran
s/ps
eudo
alca
ligen
es27
0,00
0,00
0Fu
sari
um sp
.50
09,
193
ND
Cyl
inde
r gr
inde
r†(T
os B
UC
63A
)P.
ole
ovor
ans/
pseu
doal
calig
enes
16
0,00
0,00
0Sc
edos
pori
um sp
.1,
200
32,7
72N
D
Yers
inia
fred
erik
seni
i60
,000
,000
UM
B-6
*P.
ole
ovor
ans/
pseu
doal
calig
enes
1,00
0,00
0,00
0N
D63
,458
ND
Tacc
hi la
the*
(HD
3)Ps
eudo
mon
as m
endo
cina
780,
000,
000
Yeas
t10
08,
157
ND
Mon
arch
PM
C V
750*
Nov
osph
ingo
bium
subt
erra
neum
430,
000,
000
ND
3,00
1N
D
Oku
ma
MA
-500
*P.
oleo
vora
ns/p
seud
oalc
alig
enes
140,
000,
000
ND
108,
017
ND
Bla
socu
t BC
935*
(U
nuse
d)N
DN
DN
DN
D
Bla
socu
t BC
935*
(Unu
sed/
dilu
ted
with
wat
er)
P.ol
eovo
rans
/pse
udoa
lcal
igen
es1,
900
ND
1,55
5N
D
Gri
ndex
10†
(U
nuse
d)N
DN
D5
ND
Not
e: N
IOSH
=Nat
iona
l Ins
titut
e fo
r O
ccup
atio
nal S
afet
y an
d H
ealth
; CFU
/mL
=Col
ony
form
ing
unit/
mill
ilite
r; E
U/m
L=E
ndot
oxin
uni
t/mill
ilite
r;
ND
=Non
-det
ect;
P. o
leov
oran
s/ps
eudo
alca
ligen
es=P
seud
omon
as o
leov
oran
s/ps
eudo
alca
ligen
es*N
on-p
rese
rved
met
alw
orki
ng fl
uid
†Pre
serv
ed m
etal
wor
king
flui
d

Page 58 Health Hazard Evaluation Report 2012-0055-3337
Table 4B. Bacterial 16S rRNA gene sequencing results from NIOSH June 2012 walkthrough
Sample No/Description Number of Isolates* Closest Hit† Percent Sequence
Identity‡
1 — Sump sucker 1 Corynebacterium lubricantis 991 Dysgonomonas mossii 972 Georgenia ruanii 93
1 Pseudomonas oleovorans/pseudoalcaligenes 99
2 Pseudomonas alcaliphila 9915 Pseudomonas mendocina 994 Vagococcus fluvialis 1001 Atopostipes suicloacalis 954 Wautersiella falsenii 99
2 — Radial drill (YMZ TRE-2000D) 3 Pseudomonas oleovorans/pseudoalcaligenes 95
7 Wautersiella falsenii 991 Comamonas aquatica 9425 Pseudomonas mendocina 99
3 — Cylinder grinder (BUC63A) 2 Acinetobacter baumannii 957 Acinetobacter lwoffii 962 Acinetobacter radioresistens 9512 Alcaligenes faecalis 994 Comamonas testosteroni 1001 Pseudomonas argentinensis 955 Pseudomonas mendocina 99
4 Pseudomonas oleovorans/pseudoalcaligenes 97
4 — UMB-6 2 Atopostipes suicloacalis 9512 Pseudomonas alcaliphila 9922 Pseudomonas mendocina 991 Vagococcus carniphilus 991 Wautersiella falsenii 99
5 — Tacchi Lathe (HD3) 5 Atopostipes suicloacalis 951 Corynebacterium lubricantis 981 Gulosibacter molinativorax 996 Pseudomonas alcaliphila 999 Pseudomonas mendocina 99
2 Pseudomonas oleovorans/pseudoalcaligenes 99
1 Trueperella abortisuis 946 Vagococcus carniphilus 992 Vagococcus fluvialis 1005 Wautersiella falsenii 99

Page 59Health Hazard Evaluation Report 2012-0055-3337
Sample No/Description Number of Isolates* Closest Hit† Percent Sequence
Identity‡
6 — Monarch PMC V750 26 Pseudomonas alcaliphila 991 Trueperella abortisuis 94
2 Pseudomonas oleovorans/pseudoalcaligenes 99
2 Wautersiella falsenii 98
7 — Okuma MA-500 22 Pseudomonas alcaliphila 995 Wautersiella falsenii 995 Vagococcus fluvialis 100
8 — Blasocut BC935 (Unused)§ 24 Pseudomonas alcaliphila 994 Wautersiella falsenii 991 Pseudomonas stutzeri 991 Comamonas aquatica 99
10 — Blasocut BC935§(Unused diluted with water) 29 Pseudomonas alcaliphila 99
1 Sphingomonas oligophenolica 98*Isolates = a specific bacterial gene sequence†Closest Hit = Closest species from NCBI database‡Percent sequence identity = Closeness of match between the isolate and species from NCBI database§Non-preserved metalworking fluid
Table 4B (continued). Bacterial 16S rRNA gene sequencing results from NIOSH June 2012 walkthrough

Page 60 Health Hazard Evaluation Report 2012-0055-3337
Table 5B. Fungal 16S rRNA gene sequencing results from NIOSH June 2012 walkthrough
Sample No/Description Number of Isolates* Closest Hit† Percent Sequence
Identity‡
1 — Sump sucker 2 Saccharomycetales 884 Bullera sakaeratica 891 Epicoccum sp. 1 TMS-2011 1005 Hyphoderma puberum 994 Alternaria sp. MS-2011 1004 Cucurbita lundelliana 975 Aspergillus fumigatus 1002 Epacris microphylla 981 Perenniporia medulla-panis 98
4 — UMB-6 2 Candida parapsilosis 1001 Trichosporon dermatis 1001 Trichosporon pullulans 1001 Polyporales sp. Vega328 994 Bullera sakaeratica 891 Irpex lacteus 1003 Xeromphalina campanella 971 Candida viswanathii 991 Dioscorea alata 991 Datronia scutellata 992 Davidiella macrospora 991 Uncultured fungus clone 9911 Hyphoderma puberum 991 Kabatiella microsticta 1001 Leucosporidiella muscorum 991 Trichosporon ovoides 991 Cryptococcus carnescens 1001 Dothiora cannabinae 99
5 — Tacchi Lathe (HD3) 1 Candida sp. MCCF-101 991 Bullera sakaeratica 891 Pyrenochaetopsis microspora 951 Xeromphalina campanella 971 Cerrena unicolor 992 Phoma medicaginis 991 Spinacia oleracea 991 Davidiella macrospora 9913 Hyphoderma puberum 99
7 — Okuma MA-500 1 Candida keroseneae 991 Sarcinomyces sp. SL-2011 isolate BJ10200 991 Epicoccum sp. 1 TMS-2011 991 Hyphoderma guttuliferum 982 Bullera sakaeratica 891 Candida viswanathii 991 Uncultured soil fungus clone 99

Page 61Health Hazard Evaluation Report 2012-0055-3337
Sample No/Description Number of Isolates* Closest Hit† Percent Sequence
Identity‡
1 Davidiella macrospora 9917 Hyphoderma puberum 991 Solanum lycopersicum 991 Clavispora lusitaniae 99
8 — Blasocut BC935 (Unused)§ 6 Bullera sakaeratica 892 Xeromphalina campanella 971 Plagiostoma petiolophilum 992 Uncultured Basidiomycota 981 Candida haemulonis strain CBS 6590 991 Hohenbuehelia unguicularis 1002 Davidiella macrospora 991 Gloeoporus pannocinctus 1001 Leptosphaeria sp. BYD07-43 1001 Ascochyta sp. PHY-36 991 Leptosphaerulina chartarum 99
10 — Blasocut BC935§(Unused diluted with water) 1 Candida sp. MCCF-101 95
1 Exophiala sp. 991 Hyphoderma guttuliferum 986 Bullera sakaeratica 891 Xeromphalina campanella 971 Cerrena unicolor 991 Davidiella macrospora 992 Tetracladium sp. J3 961 Aspergillus versicolor 99
*Isolates = a specific fungal gene sequence†Closest Hit = Closest species from NCBI database‡Percent sequence identity = Closeness of match between the isolate and species from NCBI database§Non-preserved metalworking fluid
Table 5B (continued). Fungal 16S rRNA gene sequencing results from NIOSH June 2012 walkthrough

Page 62 Health Hazard Evaluation Report 2012-0055-3337
Tabl
e 6B
-1. P
erso
nal a
ir sa
mpl
e re
sults
for m
etal
wor
king
flui
d sa
mpl
es, N
IOSH
indu
stria
l hyg
iene
surv
ey, F
ebru
ary
2013
Loc
atio
nT
hora
cic A
eros
ol (i
n m
g/m
3 )T
hora
cic
MW
F (in
mg/
m3 )
NB
elow
LO
DN
(%)
Geo
met
ric
Mea
n*M
inM
axB
elow
LO
DN
(%)
Geo
met
ric
Mea
n*M
inM
ax
Adm
inis
trativ
e O
ffice
s8
5 (6
3%)
0.03
< 0.
030.
048
(100
%)
—<0
.03
<0.0
4
Jani
toria
l2
0 (0
%)
—0.
090.
140
(0%
)—
0.05
0.09
Expe
dite
r3
0 (0
%)
0.13
0.09
0.18
1 (3
3%)
0.04
<0.0
30.
09
Ass
embl
y26
2 (8
%)
0.09
< 0.
040.
2519
(73%
)—
<0.0
30.
20
Parts
Roo
m2
0 (0
%)
—0.
080.
102
(100
%)
—<0
.041
<0.
043
Deb
urr/P
aint
20
(0%
)—
0.12
0.17
1 (5
0%)
—<0
.05
0.06
Wel
ding
Fab
ricat
ion
20
(0%
)—
0.23
0.84
1 (5
0%)
—<0
.04
0.12
Mac
hine
Sho
ps _
over
all
522
(4%
)0.
15<
0.04
0.38
14 (2
7%)
0.06
< 0.
040.
19
Old
Mac
hine
Sho
p11
1 (9
%)
0.18
< 0.
040.
381
(9%
)0.
08<0
.04
0.15
New
Mac
hine
Sho
p15
0 (0
%)
0.18
0.11
0.31
4 (2
7%)
0.07
<0.0
40.
19
CN
C D
epar
tmen
t23
1 (4
%)
0.12
< 0.
040.
247
(30%
) 0.
06<0
.04
0.16
Shop
Hel
pers
30
(0%
)0.
150.
090.
212
(67%
)0.
03<0
.04
0.07
Mai
nten
ance
40
(0%
)0.
090.
070.
113
(75%
)—
<0.0
30.
05
Hea
vy W
eld
30
(0%
)0.
940.
461.
580
(0%
)0.
150.
100.
32
Not
e: N
IOSH
=Nat
iona
l Ins
titut
e fo
r O
ccup
atio
nal S
afet
y an
d H
ealth
; mg/
m3=
mill
igra
ms p
er c
ubic
met
er; M
WF=
met
alw
orki
ng fl
uid;
N=n
umbe
r of
sa
mpl
es; B
elow
LO
D N
(%) =
num
ber
and
perc
enta
ge o
f sam
ples
bel
ow th
e m
etho
d lim
it of
det
ectio
n; M
in=m
inim
um v
alue
; Max
=max
imum
val
ue; —
G
eom
etri
c m
ean
not r
epor
ted
for
cells
with
less
than
3 sa
mpl
es o
r w
hen
the
perc
enta
ge o
f sam
ples
bel
ow th
e L
OD
was
gre
ater
than
70%
*The
max
imum
like
lihoo
d es
timat
e (M
LE
) met
hod
was
use
d fo
r lo
catio
ns w
here
ther
e w
ere
mor
e th
an tw
o sa
mpl
es a
nd th
e pe
rcen
tage
of s
ampl
es b
elow
the
LO
D w
as le
ss th
an o
r eq
ual t
o 70
%

Page 63Health Hazard Evaluation Report 2012-0055-3337
Tabl
e 6B
-2. P
erso
nal a
ir sa
mpl
e re
sults
for e
ndot
oxin
sam
ples
, NIO
SH in
dust
rial h
ygie
ne su
rvey
, Feb
ruar
y 20
13
Loc
atio
nE
ndot
oxin
(in
EU
/m3 )
NB
elow
LO
DN
(%)
Geo
met
ric
Mea
n*M
inim
umM
axim
um
Adm
inis
trativ
e O
ffice
s8
0 (0
%)
0.74
0.17
3.58
Jani
toria
l2
0 (0
%)
—7.
9313
.93
Expe
dite
r3
0 (0
%)
10.6
35.
7524
.22
Ass
embl
y26
2 (8
%)
1.80
< 0.
048.
20
Parts
Roo
m2
0 (0
%)
—3.
887.
81
Deb
urr/P
aint
1†0
(0%
)ss
ss3.
39
Wel
ding
Fab
ricat
ion
21
(50%
)—
< 0.
040.
23
Mac
hine
Sho
ps _
over
all
510
(0%
)11
.59
0.75
115.
56
Old
Mac
hine
Sho
p11
0 (0
%)
10.0
04.
4955
.89
New
Mac
hine
Sho
p15
0 (0
%)
16.9
71.
8694
.93
CN
C D
epar
tmen
t22
‡0
(0%
)10
.92
0.75
115.
56
Shop
Hel
pers
30
(0%
)4.
601.
0515
.25
Mai
nten
ance
3†0
(0%
)7.
476.
758.
91
Hea
vy W
eld
30
(0%
)0.
800.
431.
09N
ote:
NIO
SH=N
atio
nal I
nstit
ute
for
Occ
upat
iona
l Saf
ety
and
Hea
lth; E
U/m
3=en
doto
xin
units
per
met
er c
ubed
; N
=num
ber
of sa
mpl
es; B
elow
LO
D N
(%) =
num
ber
and
perc
enta
ge o
f sam
ples
bel
ow th
e m
etho
d lim
it of
det
ectio
n;
ss=s
ingl
e sa
mpl
e so
con
cent
ratio
n re
port
ed a
s max
imum
val
ue; —
Geo
met
ric
mea
n no
t rep
orte
d fo
r ce
lls w
ith le
ss th
an 3
sam
ples
or
whe
n th
e pe
rcen
tage
of
sam
ples
bel
ow th
e L
OD
was
gre
ater
than
70%
*The
max
imum
like
lihoo
d es
timat
e (M
LE
) met
hod
was
use
d fo
r lo
catio
ns w
here
ther
e w
ere
mor
e th
an tw
o sa
mpl
es a
nd th
e pe
rcen
tage
of s
ampl
es b
elow
the
LO
D w
as le
ss th
an o
r eq
ual t
o 70
%†
One
sam
ple
was
voi
ded
beca
use
of p
ossi
ble
cont
amin
atio
n or
a d
amag
ed c
asse
tte
‡One
res
ult w
as c
onsi
dere
d in
valid
bec
ause
of t
echn
ical
inte
rfer
ence
s dur
ing
anal
ysis
and
was
exc
lude
d

Page 64 Health Hazard Evaluation Report 2012-0055-3337
Tabl
e 7B
-1. A
rea
air s
ampl
e re
sults
for m
etal
wor
king
flui
d sa
mpl
es, N
IOSH
indu
stria
l hyg
iene
surv
ey, F
ebru
ary
2013
Loc
atio
nT
hora
cic A
eros
ol (i
n m
g/m
3 )T
hora
cic
MW
F (in
mg/
m3 )
NB
elow
LO
DN
(%)
Geo
met
ric
Mea
n*M
inM
axB
elow
LO
DN
(%)
Geo
met
ric
Mea
n*M
inM
ax
Out
door
s2
2 (1
00%
)—
< 0.
04<
0.04
2 (1
00%
)—
< 0.
04<
0.04
Adm
inis
tratio
n4
3 (7
5%)
—<
0.04
0.05
4 (1
00%
)—
< 0.
04<
0.05
Ass
embl
y7
1 (1
4%)
0.06
< 0.
040.
086
(86%
)—
< 0.
020.
04
Parts
Roo
m (S
uper
viso
r’s o
ffice
)1
0 (0
%)
ssss
0.08
0 (0
%)
ssss
0.05
Deb
urr/P
aint
20
(0%
)—
0.05
0.14
2 (1
00%
)—
< 0.
039
< 0.
044
Wel
ding
Fab
ricat
ion
10
(0%
)ss
ss0.
101
(100
%)
ssss
< 0.
04
CN
C D
epar
tmen
t11
1 (9
%)
0.11
0.04
0.19
6 (5
5%)
0.04
< 0.
040.
12
New
Mac
hine
Sho
p6
0 (0
%)
0.15
0.10
0.21
1 (1
7%)
0.07
< 0.
040.
12
Old
Mac
hine
Sho
p5
0 (0
%)
0.18
0.10
0.36
2 (4
0%)
0.05
< 0.
040.
13
Hea
vy W
eld
10
(0%
)ss
ss0.
220
(0%
)ss
ss0.
06N
ote:
NIO
SH=N
atio
nal I
nstit
ute
for
Occ
upat
iona
l Saf
ety
and
Hea
lth; m
g/m
3= m
illig
ram
s per
cub
ic m
eter
; MW
F=m
etal
wor
king
flui
d; N
=num
ber
of
sam
ples
; Bel
ow L
OD
N (%
) = n
umbe
r an
d pe
rcen
tage
of s
ampl
es b
elow
the
met
hod
limit
of d
etec
tion;
Min
=min
imum
val
ue; M
ax=m
axim
um v
alue
; ss
=sin
gle
sam
ple
so c
once
ntra
tion
repo
rted
as m
axim
um v
alue
; — G
eom
etri
c m
ean
not r
epor
ted
for
cells
with
less
than
3 sa
mpl
es o
r w
hen
the
perc
enta
ge o
f sa
mpl
es b
elow
the
LO
D w
as g
reat
er th
an 7
0%*T
he m
axim
um li
kelih
ood
estim
ate
(ML
E) m
etho
d w
as u
sed
for
loca
tions
whe
re th
ere
wer
e m
ore
than
two
sam
ples
and
the
perc
enta
ge o
f sam
ples
bel
ow th
e L
OD
was
less
than
or
equa
l to
70%

Page 65Health Hazard Evaluation Report 2012-0055-3337
Table 7B-2. Area air sample results for endotoxin samples, NIOSH industrial hygiene survey, February 2013
LocationEndotoxin (in EU/m3)
N Below LODN (%)
GeometricMean* Minimum Maximum
Outdoors 2 0 (0%) — 0.03 0.10Administration† 3 1 ( 33% ) 0.16 <0.05 1.25Assembly 7 0 (0%) 2.27 0.77 6.06Parts Room (Supervisor’s office) 1 0 (0%) ss ss 0.97Deburr/Paint 2 0 (0%) — 9.39 10.60CNC Department† 10 0 (0%) 10.63 2.92 61.87New Machine Shop 6 0 (0%) 18.62 7.12 30.57Old Machine Shop 5 0 (0%) 9.25 1.94 82.84Heavy Weld 1 0 (0%) ss ss 4.41
Note: NIOSH=National Institute for Occupational Safety and Health; EU/m3=endotoxin units per meter cubed; N=number of samples; Below LOD N (%)=number and percentage of samples below the method limit of detection; Min=minimum value; Max=maximum value; ss=single sample concentration reported as maximum value; — Geometric mean not reported for cells with less than 3 samples or when the percentage of samples below the LOD was greater than 70%*The maximum likelihood estimate (MLE) method was used for locations where there were more than two samples and the percentage of samples below the LOD was less than or equal to 70% †One sample from administration, welding fabrication, and CNC had invalid result because of technical interferences during analysis and were excluded

Page 66 Health Hazard Evaluation Report 2012-0055-3337
Table 8B. Area air sampling results for metals in microgram per cubic meter (µg/m3), NIOSH industrial hygiene survey, February 2013
Below Analyte Number of GeometricNIOSH REL(µg/m3 Department LOD Min Max)* Samples Mean*N (%)
Aluminum Deburr/Paint 2 1 (50%) — 0.47 4.32
10,000 (total) Heavy Weld 1 0 (0%) ss ss 0.93
5,000 (respirable) New Machine Shop 6 4 (67%) 0.25 <0.50 4.19
Old Machine Shop 5 4 (80%) — <0.48 0.60
Antimony Old Machine Shop 5 4 (80%) — <0.60 0.72
500
Arsenic Administration 4 2 (50%) 0.77 0.68 1.30
2 (15 minute ceiling) Ca. Assembly 7 6 (86%) — 0.61 0.97
Deburr/Paint 2 1 (50%) — <0.80 0.80
Heavy Weld 1 0 (0%) ss ss 1.0
New Machine Shop 6 5 (83%) — <0.71 0.92
Barium Assembly 7 4 (57%) 0.02 <0.02 0.15
500 Deburr/Paint 2 1 (50%) — <0.02 0.02
Heavy Weld 1 0 (0%) ss ss 0.06
New Machine Shop 6 3 (50%) 0.02 <0.02 9.65
Old Machine Shop 5 4 (80%) — <0.02 0.11
Welding Fabrication 1 0 (0%) ss ss 1.16
Beryllium Administration 4 3 (75%) — <0.01 0.01
0.5, Ca. New Machine Shop 6 5 (83%) — <0.01 0.01
Old Machine Shop 5 2 (40%) 0.01 <0.01 0.01
Outdoors 2 1 (50%) — <0.01 0.01
Parts Room 1 0 (0%) ss ss 0.01
Calcium Administration 4 3 (75%) — <0.68 0.93
-- Assembly 7 3 (43%) 0.80 0.68 1.29
CNC Dept 11 7 (64%) 0.69 <0.74 1.29
Deburr/Paint 2 1 (50%) — <0.66 1.09
New Machine Shop 6 4 (67%) 0.55 <0.71 1.78
Old Machine Shop 5 4 (80%) — <0.72 0.84
Parts Room 1 0 (0%) ss ss 0.77
Chromium Administration 4 3 (75%) — <0.31 0.40
500 CNC Dept 11 10 (91%) — <0.31 0.44
Outdoors 2 1 (50%) — <0.31 0.31
Cobalt Old Machine Shop 5 4 (80%) — <0.06 0.12
50

Page 67Health Hazard Evaluation Report 2012-0055-3337
AnalyteNIOSH REL(µg/m3)* Department Number of
Samples
Below LODN (%)
GeometricMean* Min Max
Copper Assembly 7 5 (71%) — <0.06 0.09
1,000 CNC Dept 11 4 (36%) 0.08 <0.06 0.21
Deburr/Paint 2 0 (0%) — 0.10 0.24
Heavy Weld 1 0 (0%) ss ss 1.26
New Machine Shop 6 0 (0%) 0.29 0.14 0.73
Old Machine Shop 5 1 (20%) 0.33 <0.07 1.43
Parts Room 1 0 (0%) ss ss 0.06
Welding Fabrication 1 0 (0%) ss ss 1.16
Iron Administration 4 2 (50%) 0.44 <0.32 1.55
5,000 Assembly 7 0 (0%) 2.83 1.51 4.43
CNC Dept 11 1 (9%) 3.22 <0.33 11.13
Deburr/Paint 2 0 (0%) — 3.60 56.88
Heavy Weld 1 0 (0%) ss ss 115.17
New Machine Shop 6 0 (0%) 12.14 5.98 32.62
Old Machine Shop 5 0 (0%) 17.28 3.82 64.84
Parts Room 1 0 (0%) ss ss 4.37
Welding Fabrication 1 0 (0%) ss ss 70.72
Lanthanum Administration 4 3 (75%) — <0.01 0.01
-- Assembly 7 6 (86%) — <0.01 0.01
CNC Dept 11 7 (64%) 0.01 <0.01 0.02
New Machine Shop 6 3 (50%) 0.01 <0.01 0.02
Outdoors 2 1 (50%) — <0.01 0.01
Lead CNC Dept 11 10 (91%) — <0.31 0.37
50
Magnesium Assembly 7 5 (71%) — <0.17 0.27
-- Heavy Weld 1 0 (0%) ss ss 0.28
New Machine Shop 6 5 (83%) — <0.20 0.77
Old Machine Shop 5 3 (60%) 0.20 <0.20 0.26
Manganese Administration 4 2 (50%) 0.03 <0.03 0.16
1,000 Assembly 7 0 (0%) 0.29 0.11 0.54
CNC Dept 11 1 (9%) 0.12 <0.03 0.22
Deburr/Paint 2 0 (0%) — 0.33 0.66
Heavy Weld 1 0 (0%) ss ss 11.52
Table 8B (continued). Area air sampling results for metals in microgram per cubic meter (µg/m3), NIOSH industrial hygiene survey, February 2013

Page 68 Health Hazard Evaluation Report 2012-0055-3337
AnalyteNIOSH REL(µg/m3)* Department Number of
Samples
Below LODN (%)
GeometricMean* Min Max
New Machine Shop 6 0 (0%) 0.55 0.24 1.35
Old Machine Shop 5 0 (0%) 0.81 0.16 2.86
Parts Room 1 0 (0%) ss ss 0.63
Welding Fabrication 1 0 (0%) ss ss 5.07
Nickel Administration 4 3 (75%) — <0.20 0.27
15, ca. Deburr/Paint 2 1 (50%) — <0.19 0.23
Phosphorus CNC Dept 11 10 (91%) — <0.63 0.76
100 New Machine Shop 6 5 (83%) — <0.61 0.68
Strontium Heavy Weld 1 0 (0%) ss ss 0.01
-- New Machine Shop 6 5 (83%) — <0.01 0.03
Thallium Administration 4 3 (75%) — <0.97 2.39
100
Titanium Assembly 7 5 (71%) — <0.02 0.09
-- CNC Dept 11 9 (81%) — <0.02 0.03
Deburr/Paint 2 0 (0%) — 0.05 0.16
Heavy Weld 1 0 (0%) ss ss 0.13
New Machine Shop 6 2 (33%) 0.02 <0.02 0.13
Old Machine Shop 5 2 (40%) 0.02 <0.02 0.03
Zinc Heavy Weld 1 0 (0%) ss ss 0.40
-- Old Machine Shop 5 4 (80%) — <0.28 0.82
Zirconium Administration 4 3 (75%) — <0.02 0.15
5,000 Assembly 7 5 (71%) — <0.02 0.13
CNC Dept 11 8 (73%) — <0.02 0.11
New Machine Shop 6 5 (83%) — <0.02 0.02
Parts Room 1 0 (0%) ss ss 0.02Note: NIOSH=National Institute for Occupational Safety and Health; REL: Recommended exposure limit; Ca: Carcinogen; Below LOD N (%) = number and percentage of samples below the method limit of detection; Min=minimum value; Max=maximum value; — Geometric mean not reported for cells with less than 3 samples or when the percentage of samples below the LOD was greater than 70%; ss=single sample concentration reported as maximum value*The maximum likelihood estimate (MLE) method was used for locations where there were more than two samples and the percentage of samples below the LOD was less than 75%
Table 8B (continued). Area air sampling results for metals in microgram per cubic meter (µg/m3), NIOSH industrial hygiene survey, February 2013

Page 69Health Hazard Evaluation Report 2012-0055-3337
Tabl
e 9B
. Qua
ntita
tive
vola
tile
orga
nic
com
poun
d re
sults
in p
arts
per
bill
ion
(ppb
) fro
m c
anis
ter w
hole
-air
sam
ples
in a
dmin
istra
tion
area
, N
IOSH
indu
stria
l hyg
iene
surv
ey, F
ebru
ary
2013
of building corner Outdoors — NW
ea ont office ar Fr
engineering Upper
ea office ar floor nd 2
ea areception Main entry to r
Atrium
Loc
atio
n
Sam
ple
ID90
390
851
351
453
388
6U
ndilu
ted
LO
D
(ppb
)
Und
ilute
d L
OQ
(p
pb)
Sam
ple
date
2/11
2/11
2/12
2/13
2/14
2/14
Sam
ple
peri
od (m
inut
es)
358
355
357
354
351
356
Etha
nol
67.5
(7.9
)82
.747
.144
.1--
1.5
5.0
Ace
tone
166.
214
.438
939
.016
.922
.60.
92.
9Is
opro
pyl a
lcoh
ol(6
.2)
(5.1
)(6
.8)
50.5
91.1
(3.1
)1.
03.
2M
ethy
lene
chl
orid
e(1
.6)
--(1
.3)
----
--0.
41.
5H
exan
e--
----
----
--0.
51.
6C
hlor
ofor
m--
----
----
--0.
61.
9B
enze
ne--
----
----
--0.
51.
8M
ethy
l met
hacr
ylat
e--
----
----
--2.
79.
0To
luen
e64
.46.
515
311
.6(4
.4)
7.9
0.6
2.0
Ethy
lben
zene
6.8
--14
.9--
----
0.6
1.9
m,p
-xyl
ene
28.6
(3.2
)65
.28.
2(3
.5)
6.0
0.6
1.9
o-xy
lene
10.1
--23
.2(2
.9)
--(2
.1)
0.6
2.0
Alp
ha-P
inen
e--
----
----
--0.
72.
3Li
mon
ene
----
----
----
1.3
4.4
Dilu
tion
fact
or3.
283.
143.
213.
173.
522.
58--
--N
ote:
NIO
SH=N
atio
nal I
nstit
ute
for
Occ
upat
iona
l Saf
ety
and
Hea
lth; L
OD
=lim
it of
det
ectio
n; L
OQ
=Lim
it of
Qua
ntifi
catio
n; --
=N
ot d
etec
ted
at th
e L
OD
; ()
= v
alue
is b
etw
een
LO
D a
nd L
OQ
.N
o re
cove
ry c
orre
ctio
n w
as p
erfo
rmed
. Mul
tiply
und
ilute
d L
OD
/LO
Q fo
r ea
ch c
ompo
und
by d
ilutio
n fa
ctor
to o
btai
n ac
tual
lim
it fo
r ea
ch sa
mpl
e. A
ll le
vels
w
ere
wel
l bel
ow th
e ap
plic
able
NIO
SH r
ecom
men
ded
expo
sure
lim
its.

Page 70 Health Hazard Evaluation Report 2012-0055-3337
Tabl
e 10
B. Q
uant
itativ
e vo
latil
e or
gani
c co
mpo
und
resu
lts in
par
ts p
er b
illio
n (p
pb) f
rom
can
iste
r who
le-a
ir sa
mpl
es in
ass
embl
y ar
ea,
NIO
SH in
dust
rial h
ygie
ne su
rvey
, Feb
ruar
y 20
13
Kings 2&3 Air between eld fabrication W
s office ’ Supervisoroom Parts r
station paint pickup Deburr
benchom deburr oss fr Acr
Bay 2 middle of bay
right sideBay 3 halfway on
right sideBay 3 halfway on
corner ear Bay 7 r
corner ear Bay 7 r
corner ear Bay 7 r
corner ear Bay 7 r
Loc
atio
n
Sam
ple
ID53
890
089
251
854
051
591
053
787
390
987
4U
ndilu
ted
LO
D
(ppb
)
Und
ilute
d L
OQ
(p
pb)
Sam
ple
date
2/11
2/12
2/13
2/14
2/11
2/13
2/14
2/11
2/13
2/12
2/14
Sam
ple
peri
od
(min
utes
)34
635
236
334
336
034
634
736
033
636
035
8
Etha
nol
41.3
32.7
45.6
26.8
56.1
67.3
39.4
53.9
84.4
50.1
34.4
1.5
5.0
Ace
tone
443.
210
24.4
607.
243
3.7
831.
888
6.1
820.
950
23.0
2542
.111
87.7
483.
30.
92.
9Is
opro
pyl a
lcoh
ol67
.615
.910
.713
.039
.112
.514
.832
.132
.417
.318
.21.
03.
2M
ethy
lene
chl
orid
e19
9.2
(4.6
)(0
.6)
(0.6
)11
2.1
(0.7
)(0
.9)
54.2
(1.7
)5.
2(0
.7)
0.4
1.5
Hex
ane
16.7
----
--7.
6--
--4.
9--
----
0.5
1.6
Chl
orof
orm
----
----
----
----
----
--0.
61.
9B
enze
ne--
----
----
----
----
----
0.5
1.8
Met
hyl
met
hacr
ylat
e--
--(9
.7)
----
(11.
8)(1
0.1)
(12.
8)33
.2--
(8.7
)2.
79.
0
Tolu
ene
176.
436
0.2
185.
612
7.6
353.
829
2.8
296.
819
46.9
791.
347
6.2
119.
80.
62.
0Et
hylb
enze
ne21
.940
.030
.523
.244
.845
.540
.726
3.3
113.
547
.423
.00.
61.
9m
,p-x
ylen
e92
.419
0.6
132.
710
3.8
208.
119
6.1
203.
711
55.4
584.
223
8.1
101.
10.
61.
9o-
xyle
ne34
.761
.751
.039
.972
.673
.767
.442
4.2
215.
973
.339
.10.
62.
0A
lpha
-Pin
ene
8.3
8.6
7.3
9.6
12.0
9.4
10.5
8.4
9.2
10.1
12.3
0.7
2.3
Lim
onen
e--
----
----
----
----
----
1.3
4.4
Dilu
tion
Fac
tor
3.19
3.25
3.13
3.25
3.24
3.06
3.27
2.88
3.10
3.17
3.21
----
Not
e: L
OD
=lim
it of
det
ectio
n; L
OQ
=Lim
it of
Qua
ntifi
catio
n; --
=N
ot d
etec
ted
at th
e L
OD
; () =
val
ue is
bet
wee
n L
OD
and
LO
Q.
No
reco
very
cor
rect
ion
was
per
form
ed. M
ultip
ly u
ndilu
ted
LO
D/L
OQ
for
each
com
poun
d by
dilu
tion
fact
or to
obt
ain
actu
al li
mit
for
each
sam
ple.
All
leve
ls
wer
e w
ell b
elow
the
appl
icab
le N
IOSH
rec
omm
ende
d ex
posu
re li
mits
.

Page 71Health Hazard Evaluation Report 2012-0055-3337
Tabl
e 11
B. Q
uant
itativ
e vo
latil
e or
gani
c co
mpo
und
resu
lts in
par
ts p
er b
illio
n (p
pb) f
rom
can
iste
r who
le-a
ir sa
mpl
es in
CN
C sh
op a
rea,
oom rogrammers CNC Pr
105DX KBT1 OF om OP Fr 5’
ACCHI T Near
ACCHI T Near
ont of DMU 210P Fr
MA800 OKUMA Near
ACCHI T Near
, Feb
ruar
y 20
13
SNK RB6 Near
Serra mill Near
MB5000H
NIO
SH in
dust
rial h
ygie
ne su
rvey
Backside of OKUMA
ACCHI Tont of all in fr W
Loc
atio
n
Sam
ple
ID54
288
489
087
554
553
453
687
687
852
089
5U
ndilu
ted
LO
D
(ppb
)
Und
ilute
d L
OQ
(p
pb)
Sam
ple
date
2/11
2/11
2/11
2/12
2/12
2/12
2/13
2/13
2/14
2/14
2/14
Sam
ple
peri
od (m
inut
es)
364
360
360
360
352
360
360
368
360
353
355
Etha
nol
50.2
43.8
29.5
64.9
74.5
54.6
49.7
110.
654
.839
.854
.41.
55.
0A
ceto
ne25
4717
87.6
1599
1667
1820
.321
19.9
992.
110
81.1
1003
.089
0.2
468.
910.
92.
9Is
opro
pyl a
lcoh
ol14
.214
.110
.912
.815
.710
.715
.015
.720
.517
.3(9
.4)
1.0
3.2
Met
hyle
ne c
hlor
ide
20.1
20.5
20.5
(3.0
)(2
.7)
(2.2
)(0
.6)
(0.6
)(0
.6)
(0.7
)(0
.3)
0.4
1.5
Hex
ane
(1.7
)(1
.7)
(1.5
)--
----
----
----
--0.
51.
6C
hlor
ofor
m--
----
----
----
----
----
0.6
1.9
Ben
zene
----
----
----
----
----
--0.
51.
8M
ethy
l met
hacr
ylat
e--
----
----
--11
.513
.710
.1--
--2.
79.
0To
luen
e12
0683
4.0
676
715
705.
484
2.1
329.
335
7.2
386.
235
3.2
163.
740.
62.
0Et
hylb
enze
ne15
090
.581
.567
.970
.177
.547
.752
.051
.543
.219
.50.
61.
9m
,p-x
ylen
e66
444
9.4
401
338
327.
938
1.8
222.
823
9.0
225.
520
2.1
87.2
0.6
1.9
o-xy
lene
239
160.
612
6.8
101.
110
4.9
115.
077
.383
.881
.770
.431
.90.
62.
0A
lpha
-Pin
ene
7.9
(6.8
)(4
.5)
(5.7
)(5
.4)
(3.6
)(4
.5)
(5.4
)(5
.3)
(3.1
)--
0.7
2.3
Lim
onen
e--
----
----
----
----
----
1.3
4.4
Dilu
tion
fact
or3.
233.
173.
243.
133.
403.
253.
273.
213.
143.
283.
17--
--N
ote:
LO
D=L
imit
of D
etec
tion;
LO
Q=L
imit
of Q
uant
ifica
tion;
-- =
Not
det
ecte
d at
the
LO
D; (
) = v
alue
is b
etw
een
LO
D a
nd L
OQ
.N
o re
cove
ry c
orre
ctio
n w
as p
erfo
rmed
. Mul
tiply
und
ilute
d L
OD
/LO
Q fo
r ea
ch c
ompo
und
by d
ilutio
n fa
ctor
to o
btai
n ac
tual
lim
it fo
r ea
ch sa
mpl
e. A
ll le
vels
w
ere
wel
l bel
ow th
e ap
plic
able
NIO
SH r
ecom
men
ded
expo
sure
lim
its.

Page 72 Health Hazard Evaluation Report 2012-0055-3337
Tabl
e 12
B. Q
uant
itativ
e vo
latil
e or
gani
c co
mpo
und
resu
lts in
par
ts p
er b
illio
n (p
pb) f
rom
can
iste
r who
le-a
ir sa
mpl
es in
new
mac
hine
shop
ar
ea, N
IOSH
indu
stria
l hyg
iene
surv
ey, F
ebru
ary
2013
mill #3 converteront of manual In fr
om waterjet tank fr 10’
Bridgeport EZpath Near
Left of Mori Seki SL603
ea hob ar of gear Rear
ea Back of HAAS ar
Loc
atio
n
Sam
ple
ID89
891
352
388
753
551
1U
ndilu
ted
LO
D
(ppb
)
Und
ilute
d L
OQ
(p
pb)
Sam
ple
date
2/11
2/12
2/12
2/13
2/13
2/14
Sam
ple
peri
od (m
inut
es)
356
351
350
353
347
355
Etha
nol
51.5
75.6
65.9
67.5
48.1
87.1
1.5
5.0
Ace
tone
1208
.214
31.4
1050
.069
1.23
472.
668
3.2
0.9
2.9
Isop
ropy
l alc
ohol
14.6
12.2
11.0
18.4
13.8
13.1
1.0
3.2
Met
hyle
ne c
hlor
ide
12.8
(1.6
)(1
.3)
(0.3
)--
(0.4
)0.
41.
5H
exan
e--
----
----
--0.
51.
6C
hlor
ofor
m--
----
----
--0.
61.
9B
enze
ne--
----
----
--0.
51.
8M
ethy
l met
hacr
ylat
e--
----
----
--2.
79.
0To
luen
e54
8.3
570.
743
7.5
245.
1816
8.1
319.
20.
62.
0Et
hylb
enze
ne65
.558
.744
.930
.922
.438
.90.
61.
9m
,p-x
ylen
e30
2.7
278.
621
1.4
153.
8898
.317
7.6
0.6
1.9
o-xy
lene
101.
089
.468
.351
.536
.363
.50.
62.
0A
lpha
-Pin
ene
(3.9
)(2
.7)
----
----
0.7
2.3
Lim
onen
e--
----
----
--1.
34.
4D
ilutio
n fa
ctor
3.29
3.26
3.26
3.19
3.33
3.19
----
Not
e: L
OD
=Lim
it of
Det
ectio
n; L
OQ
=Lim
it of
Qua
ntifi
catio
n; --
=N
ot d
etec
ted
at th
e L
OD
; () =
val
ue is
bet
wee
n L
OD
and
LO
QN
o re
cove
ry c
orre
ctio
n w
as p
erfo
rmed
. Mul
tiply
und
ilute
d L
OD
/LO
Q fo
r ea
ch c
ompo
und
by d
ilutio
n fa
ctor
to o
btai
n ac
tual
lim
it fo
r ea
ch sa
mpl
e.A
ll le
vels
wer
e w
ell b
elow
the
appl
icab
le N
IOSH
rec
omm
ende
d ex
posu
re li
mits
.

Page 73Health Hazard Evaluation Report 2012-0055-3337
Tabl
e 13
B. Q
uant
itativ
e vo
latil
e or
gani
c co
mpo
und
resu
lts in
par
ts p
er b
illio
n (p
pb) f
rom
can
iste
r who
le-a
ir sa
mpl
es in
old
mac
hine
shop
ar
ea, N
IOSH
indu
stria
l hyg
iene
surv
ey, F
ebru
ary
2013
V8A and A Between 3V
post center eld near W Heavy
BUC63a grinder Cylinder Near
120EXont of Okamoto 31- In fr
Plasma left back corner
BUC63a grinder Cylinder Near
Loc
atio
n
Sam
ple
ID88
089
688
387
789
951
2U
ndilu
ted
LO
D
(ppb
)
Und
ilute
d L
OQ
(p
pb)
Sam
ple
date
2/11
2/12
2/12
2/13
2/13
2/14
Sam
ple
peri
od (m
inut
es)
357
344
347
362
354
353
Etha
nol
55.8
64.5
75.2
61.9
43.5
92.9
1.5
5.0
Ace
tone
1184
.310
88.1
1444
736.
749
4.9
618.
70.
92.
9Is
opro
pyl a
lcoh
ol18
.0(8
.9)
11.9
21.2
30.9
12.7
1.0
3.2
Met
hyle
ne c
hlor
ide
12.3
(1.3
)(1
.6)
(0.4
)(0
.4)
(0.3
)0.
41.
5H
exan
e--
----
----
--0.
51.
6C
hlor
ofor
m--
----
----
--0.
61.
9B
enze
ne--
----
----
--0.
51.
8M
ethy
l met
hacr
ylat
e--
----
----
--2.
79.
0To
luen
e47
1.4
455.
364
324
6.4
166.
724
5.2
0.6
2.0
Ethy
lben
zene
55.9
46.9
67.0
34.6
23.5
33.4
0.6
1.9
m,p
-xyl
ene
261.
822
1.2
310
154.
010
5.1
149.
00.
61.
9o-
xyle
ne85
.771
.210
1.5
56.3
38.8
54.1
0.6
2.0
Alp
ha-P
inen
e(3
.5)
--(2
.6)
(2.4
)--
--0.
72.
3Li
mon
ene
----
----
----
1.3
4.4
Dilu
tion
fact
or3.
323.
293.
203.
213.
203.
13--
--N
ote:
LO
D=L
imit
of D
etec
tion;
LO
Q=L
imit
of Q
uant
ifica
tion;
-- =
Not
det
ecte
d at
the
LO
D; (
) = v
alue
is b
etw
een
LO
D a
nd L
OQ
N
o re
cove
ry c
orre
ctio
n w
as p
erfo
rmed
. M
ultip
ly u
ndilu
ted
LO
D/L
OQ
for
each
com
poun
d by
dilu
tion
fact
or to
obt
ain
actu
al li
mit
for
each
sam
ple.
All
leve
ls w
ere
wel
l bel
ow th
e ap
plic
able
NIO
SH r
ecom
men
ded
expo
sure
lim
its.

Page 74 Health Hazard Evaluation Report 2012-0055-3337
Tabl
e 14
B. M
icro
bial
spec
ies a
nd e
ndot
oxin
con
cent
ratio
n in
bul
k pr
oces
s flui
d sa
mpl
es c
olle
cted
, NIO
SH in
dust
rial h
ygie
ne su
rvey
, Fe
brua
ry 2
013
Mac
hine
or
Flui
dSa
mpl
ed*
Bac
teri
aC
FU/m
LFu
ngi
CFU
/mL
End
otox
in
EU
/mL
Dat
e of
last
flui
d ch
ange
¶U
nuse
d flu
ids
Bla
socu
t BC
935
(Nea
t)N
DN
Din
valid
NA
Bla
socu
t BC
935
(Dilu
ted)
Pseu
dom
onas
ole
ovor
ans/
pseu
doal
calig
enes
450
ND
6.94
NA
Grin
dex
10 (N
eat)†
ND
ND
ND
NA
Mun
icip
al w
ater
†N
DN
D0.
16N
AO
ld M
achi
ne S
hop
Cyl
inde
r grin
der
(Tos
BU
C63
A)†
Cur
toba
cter
ium
lute
um90
ND
349
2/8/
2013
Rad
ial d
rill
(YM
Z TR
E-20
00D
)Ps
eudo
mon
as lu
teol
a70
ND
1,16
42/
9/20
13
ESA
B P
lasm
a je
t‡Bu
rkho
lder
ia g
lath
ei1,
400,
000
Fusa
rium
sp.
Fusa
rium
oxy
spor
ium
Yeas
ts, o
ther
50 10 202,
185
12/2
012
Bio
cide
,ru
st in
hibi
tor a
dded
Oku
ma
3VA
Pseu
dom
onas
lute
ola
Cor
yneb
acte
rium
var
iabi
le50
,000
580,
000
ND
45,2
6201
/26/
2013
Taku
mi S
eki 8
VAPs
eudo
mon
as o
leov
oran
s/ps
eudo
alca
ligen
es1,
400,
000
ND
80,0
5912
/07/
2012
Dai
to sa
w Q
A40
0Ps
eudo
mon
as o
leov
oran
s/ps
eudo
alca
ligen
es1,
100,
000
ND
15,4
4610
/27/
2012
Spar
tan
saw
Pseu
dom
onas
ole
ovor
ans/
pseu
doal
calig
enes
7,00
0N
D30
,173
Oka
mot
o 12
4N†
Alca
ligen
es fa
ecal
is1,
200,
000
Fusa
rium
oxy
spor
ium
6034
,812
12/2
2/20
12
New
Mac
hine
Sho
p
Brid
gepo
rt EZ
Pat
hPs
eudo
mon
as lu
teol
a2,
000,
000
Fusa
rium
sp.
1077
,987
12/2
2/20
12
Maz
ak Q
TS 2
00Sp
hing
opyx
is m
acro
golta
bida
2,20
0,00
0N
D25
,226
02/0
2/20
13
Fello
w G
ear H
ob§
ND
ND
inva
lid

Page 75Health Hazard Evaluation Report 2012-0055-3337
Tabl
e 14
B (c
ontin
ued)
. Mic
robi
al sp
ecie
s and
end
otox
in c
once
ntra
tion
in b
ulk
proc
ess fl
uid
sam
ples
col
lect
ed, N
IOSH
indu
stria
l hyg
iene
su
rvey
, Feb
ruar
y 20
13D
ate
of la
st fl
uid
chan
ge¶
End
otox
in
EU
/mL
CFU
/mL
Fung
iC
FU/m
LB
acte
ria
Flu
idd
Mac
hine
or
Sam
ple
HA
AS
VF2
, #2
Brev
undi
mon
as v
esic
ular
is6,
700,
000
Yeas
ts, o
ther
Aure
obas
idiu
m
pullu
lans
4200
100
234,
449
11/0
2/20
12
HA
AS
VF2
, #4
Pseu
dom
onas
ole
ovor
ans/
pseu
doal
calig
enes
7,30
0,00
0Fu
sari
um sp
.10
82,8
7612
/04/
2012
Mor
i Sek
i NL3
000
Pseu
dom
onas
ole
ovor
ans/
pseu
doal
calig
enes
18,0
00,0
00Fu
sari
um sp
.20
62,9
8609
/08/
2012
Oku
ma
V60
RPs
eudo
mon
as o
leov
oran
s/ps
eudo
alca
ligen
es
21,0
00,0
00Fu
sari
um sp
.60
390,
633
01/0
5/20
13
TRA
K T
RM
Pseu
dom
onas
ole
ovor
ans/
pseu
doal
calig
enes
4,40
0,00
0Fu
sari
um sp
.20
29,8
70
Wat
erje
t (Le
ft)‡
Nov
osph
ingo
bium
ar
omat
iciv
oran
s1,
900,
000
ND
338
Wat
erje
t (R
ight
)‡H
erba
spir
illiu
m h
uttie
nse
1,20
0,00
0N
D1,
255
CN
C
DM
G D
MU
210
PPs
eudo
mon
as o
leov
oran
s/ps
eudo
alca
ligen
es3,
000,
000
ND
22,7
3110
/02/
2012
Tacc
hi la
the
Pseu
dom
onas
ole
ovor
ans/
pseu
doal
calig
enes
50,0
00,0
00N
D26
,046
2/13
/201
2
Mon
arch
PM
C V
750
Pseu
dom
onas
ole
ovor
ans/
pseu
doal
calig
enes
44,0
00,0
00N
D25
,509
8/9/
2012
Mon
arch
VM
C-1
60Ps
eudo
mon
as o
leov
oran
s/ps
eudo
alca
ligen
es18
,000
,000
ND
61,5
0105
/02/
2012
Oku
ma
MA
500
Pseu
dom
onas
ole
ovor
ans/
pseu
doal
calig
enes
20,0
00,0
00Fu
sari
um sp
.10
96,3
544/
30/2
012
Oku
ma
MA
800
Pseu
dom
onas
ole
ovor
ans/
pseu
doal
calig
enes
16,0
00,0
00Au
reob
asid
ium
pu
llula
nsFu
sari
um sp
.
20 5055
,431
10/1
6/20
12
Oku
ma
MA
400H
ASp
hing
omon
as y
anoi
kuya
e11
,000
,000
Fusa
rium
sp.
3016
6,11
708
/08/
2012
Oku
ma
MB
5000
HPs
eudo
mon
as o
leov
oran
s/ps
eudo
alca
ligen
es20
,000
,000
Fusa
rium
sp.
2047
,516
11/0
7/20
12

Page 76 Health Hazard Evaluation Report 2012-0055-3337
Tabl
e 14
B (c
ontin
ued)
. Mic
robi
al sp
ecie
s and
end
otox
in c
once
ntra
tion
in b
ulk
proc
ess fl
uid
sam
ples
col
lect
ed, N
IOSH
indu
stria
l hyg
iene
su
rvey
, Feb
ruar
y 20
13D
ate
of la
st fl
uid
chan
ge¶
End
otox
in
EU
/mL
CFU
/mL
Fung
iC
FU/m
LB
acte
ria
Flu
idM
achi
ne o
rSa
mpl
ed
KB
T 11
05D
XPs
eudo
mon
as o
leov
oran
s/ps
eudo
alca
ligen
es
Aero
cocc
us v
irid
ans
480,
000
620,
000
Fusa
rium
sp.
Aure
obas
idiu
m
pullu
lans
10 5043
,847
02/2
1/20
12
UM
B 6
Pseu
dom
onas
ole
ovor
ans/
pseu
doal
calig
enes
57,0
00,0
00N
D22
,345
1/10
/201
2
Sera
mill
Pseu
dom
onas
ole
ovor
ans/
pseu
doal
calig
enes
2,40
0,00
0N
D21
,620
SNK
RB
6VM
Pseu
dom
onas
ole
ovor
ans/
pseu
doal
calig
enes
14,0
00,0
00N
D32
,066
10/0
9/20
12
Not
e: C
FU/m
L =
Col
ony
form
ing
unit/
mill
ilite
r; E
U/m
L =
End
otox
in u
nits
/mill
ilite
r; N
D =
Not
det
ecte
d.*A
ll flu
ids s
ampl
ed w
ere
non-
pres
erve
d m
etal
wor
king
flui
d ex
cept
: †Pr
eser
ved
met
alw
orki
ng fl
uid,
‡w
ater
, §oi
l.¶W
e di
d no
t col
lect
dat
e in
form
atio
n fo
r w
hen
the
fluid
in th
e m
achi
ne su
mps
was
filte
red.

Page 77Health Hazard Evaluation Report 2012-0055-3337
Tabl
e 15
B. Q
uant
itativ
e vo
latil
e or
gani
c co
mpo
und
resu
lts in
par
ts p
er b
illio
n (p
pb) f
rom
can
iste
r who
le-a
ir sa
mpl
es d
urin
g va
cuum
pum
p op
erat
ions
in a
ssem
bly
area
, NIO
SH in
dust
rial h
ygie
ne su
rvey
, Feb
ruar
y 20
13
pump in bay 6Nash vacuum
operation of the During
in bay 6vacuum pump
of the Nash e operation Befor
in bay 4vacuum pump CN5 Robusschi
operation of During
in bay 4vacuum pump CN5 Robuschi
operation of e Befor
Loc
atio
n
Sam
ple
ID52
191
252
690
2U
ndilu
ted
LO
D(p
pb)
Und
ilute
d L
OQ
(p
pb)
Sam
ple
date
2/13
2/13
2/13
2/13
Sam
ple
peri
od (m
inut
es)
1415
1515
Etha
nol
36.3
35.9
58.2
37.1
1.5
5.0
Ace
tone
538.
752
1.7
678.
156
5.1
0.9
2.9
Isop
ropy
l alc
ohol
12.1
11.8
14.9
13.5
1.0
3.2
Met
hyle
ne c
hlor
ide
(0.5
)(0
.6)
(0.7
)(0
.6)
0.4
1.5
Hex
ane
----
----
0.5
1.6
Chl
orof
orm
----
--(1
.7)
0.6
1.9
Ben
zene
----
----
0.5
1.8
Met
hyl m
etha
cryl
ate
(10.
0)(1
0.2)
(15.
4)(1
1.9)
2.7
9.0
Tolu
ene
160.
115
7.6
191.
317
3.6
0.6
2.0
Ethy
lben
zene
29.8
37.5
32.6
26.7
0.6
1.9
m,p
-xyl
ene
147.
318
8.5
142.
713
0.8
0.6
1.9
o-xy
lene
48.7
63.6
52.5
42.7
0.6
2.0
Alp
ha-P
inen
e(6
.0)
(6.2
)8.
26.
80.
72.
3Li
mon
ene
----
--3.
81.
34.
4D
ilutio
n F
acto
r2.
873.
142.
952.
93--
-- N
ote:
LO
D=L
imit
of D
etec
tion;
LO
Q=L
imit
of Q
uant
ifica
tion;
-- =
Not
det
ecte
d at
the
LO
D; (
) = v
alue
is b
etw
een
LO
D a
nd L
OQ
.
No
reco
very
cor
rect
ion
was
per
form
ed. M
ultip
ly u
ndilu
ted
LO
D/L
OQ
for
each
com
poun
d by
dilu
tion
fact
or to
obt
ain
actu
al li
mit
for
each
sam
ple.
All
leve
ls w
ere
wel
l bel
ow th
e ap
plic
able
NIO
SH r
ecom
men
ded
expo
sure
lim
its.

Page 78 Health Hazard Evaluation Report 2012-0055-3337
Table 16B. Demographic characteristics of 2013 (N=388) and 2016 (N=307) medical survey
Characteristic 2013 value 2016 valueAge, years, mean (range) 42 (19–65) 44 (20–6
participants
5)Male, number (%) 353 (91) 285 (93)Race, number (%) White 370 (95) 306 (100)Smoking status, number (%) Current 34 (9) 35 (11) Former 89 (23) 77 (25) Never 265 (68) 195 (64)
Note: N=number of participants
Table 17B. Work history characteristics of 2013 (N=388) and 2016 (N=307) medical survey participants
Characteristic 2013 value 2016 valueTenure, years, mean (range) Current job 10 (<1–35) 12 (0.1–38) Total 15 (1–40) 18 (0.2–43)Work in administration, n (%) Current 145 (37) 110 (36) Ever 162 (42) 128 (42)Work in assembly, n (%) Current 110 (28) 92 (30) Ever 139 (36) 116 (38)Work in machine shop, n (%) Current 133 (34) 105 (34) Ever 163 (42) 130 (42)
Note: N=number of participants

Page 79Health Hazard Evaluation Report 2012-0055-3337
Table 18B. Symptoms and self-reported diagnoses of 2013 (N=388) and 2016 (N=307) medical survey participants
2013 Medical Survey
Overall, Work-related, Start after Symptom n (%) n (%)* hire, n (%)†Shortness of breath On level ground With people own age At own pace
49 (13)20 (5)7 (2)
17 (4)——
34 (9)——
Usual cough 47 (12) 21 (5) 34 (9)Wheeze‡ 129 (33) 33 (9) 107 (27)Asthma-like symptoms§ 150 (39) 38 (10) —Flu-like illness‡ 39 (10) 15 (4) 39 (10)Nasal symptoms‡ 276 (71) 54 (14) —Eye symptoms‡ 123 (32) 31 (8) —Rash‡ 47 (12) 9 (2) —
Diagnosis Diagnosis after hire, n (%)†
Hay fever, ever 80 (21) — 29 (8)Sinusitis, ever 134 (35) — 65 (17)Eczema, ever 49 (13) — 25 (6)Pneumonia, ever 63 (16) — 26 (7)Asthma Ever Current
36 (9)23 (6)
——
11 (3)—
2016 Medical Survey
Symptom Overall,N (%)
Work-related,N (%)*
Start after hire,n (%)†
Shortness of breath On level ground With people own age At own pace
21 (7) 11 (4) 5 (2)
4 (1)——
14 (5)——
Usual cough 29 (9) 7 (2) 20 (7)Wheeze‡ 58 (19) 10 (3) 48 (16)Asthma-like symptoms‡ 74 (24) 14 (5) —Flu-like illness‡ 29 (9) 8 (3) 27 (9)Nasal symptoms‡ 154 (50) 29 (9) —Eye symptoms‡ 102 (33) 17 (6) —Rash‡ 33 (11) 5 (2) —
Diagnosis (physician-diagnosed) Diagnosis after hire, n (%)†
Hay fever, ever 62 (20) — 22 (7)Sinusitis, ever 101 (33) — 36 (12)Eczema, ever 30 (10) — 14 (5)Pneumonia, ever 45 (15) — 20 (7)Asthma Ever Current
27 (9) 16 (5)
—— 6 (2)
—Note: N=number of participants*Work-related symptoms were defined as symptoms that improved away from the facility.

Page 80 Health Hazard Evaluation Report 2012-0055-3337
†Only those participants with reported onset dates were included in the analysis; “—“ indicates symptom or diagnosis occurring after hire was not calculated ‡In the last 12 months.§Asthma-like symptoms were defined as current use of asthma medicine and/or one or more of the following symptoms in the last 12 months: wheezing or whistling in the chest, awakening with a feeling of chest tightness, or attack of asthma.
Table 19B. Adjusted* comparison of symptoms and self-reported diagnoses among 2013 (N=388) and 2016 (N=306†) medical survey participants with U.S. adult population by current department category
Symptom or Diagnosis Comparative population Observed Number
Expected Number
SMR(95% CI)‡
2013 Medical SurveyAll employees (N=388†) Shortness of breath on exertion NHANES III 49 53.7 0.9 (0.69–1.21) Wheeze last 12 months NHANES 2007–2012 129 39.8 3.2 (2.73–3.85) Hay fever, ever (physician-diagnosed) NHANES III 80 54.0 1.5 (1.19–1.84) Watery, itchy eyes last 12 months NHANES III 123 150.4 0.82 (0.69–0.98) Stuffy, itchy, or runny nose last 12 months NHANES III 276 219.2 1.3 (1.12–1.42) Ever asthma (physician-diagnosed) NHANES 2007–2012 36 50.0 0.7 (0.52–1.0) Current asthma (physician-diagnosed) NHANES 2007–2012 23 24.2 1.0 (0.63–1.43) Chronic bronchitis (physician-diagnosed) NHANES III 4 13.9 0.3 (0.11–0.74)
Administration (N=145) Shortness of breath on exertion NHANES III 13 21.5 0.6 (0.35–1.03) Wheeze last 12 months NHANES 2007–2012 39 15.0 2.6 (1.90–3.55) Hay fever, ever (physician-diagnosed) NHANES III 39 20.4 1.9 (1.40–2.61) Watery, itchy eyes last 12 months NHANES III 41 56.8 0.7 (0.53–0.98) Stuffy, itchy, or runny nose last 12 months NHANES III 100 81.4 1.2 (1.00–1.49) Ever asthma (physician-diagnosed) NHANES 2007–2012 13 18.9 0.69 (0.40–1.17) Current asthma (physician-diagnosed) NHANES 2007–2012 10 9.6 1.0 (0.57–1.92) Chronic bronchitis (physician-diagnosed) NHANES III 3 5.9 0.5 (0.17–1.50)
Assembly (N=109) Shortness of breath on exertion NHANES III 15 15.5 1.0 (0.58–1.59) Wheeze last 12 months NHANES 2007–2012 42 12.0 3.5 (2.59–4.73) Hay fever, ever (physician-diagnosed) NHANES III 18 14.7 1.2 (0.78–1.94) Watery, itchy eyes last 12 months NHANES III 28 41.1 0.7 (0.47–0.98) Stuffy, itchy, or runny nose last 12 months NHANES III 76 60.6 1.3 (1.00–1.57) Ever asthma (physician-diagnosed) NHANES 2007–2012 15 13.9 1.1 (0.65–1.78) Current asthma (physician-diagnosed) NHANES 2007–2012 8 6.7 1.2 (0.60–2.34) Chronic bronchitis (physician-diagnosed) NHANES III 1 3.9 0.23 (0.05–1.47)
Machine shop (N=134‡) Shortness of breath on exertion NHANES III 21 16.6 1.3 (0.83–1.93)

Page 81Health Hazard Evaluation Report 2012-0055-3337
Symptom or Diagnosis Comparative population Observed Number
Expected Number
SMR(95% CI)‡
Wheeze last 12 months NHANES 2007–2012 48 12.7 3.8 (2.84–4.99) Hay fever, ever (physician-diagnosed) NHANES III 23 19.0 1.2 (0.81–1.82) Watery, itchy eyes last 12 months NHANES III 54 52.4 1.0 (0.79–1.34) Stuffy, itchy, or runny nose last 12 months NHANES III 100 77.3 1.3 (1.06–1.57) Ever asthma (physician-diagnosed) NHANES 2007–2012 8 17.1 0.5 (0.24–0.92) Current asthma (physician-diagnosed) NHANES 2007–2012 5 7.8 0.6 (0.27–1.49) Chronic bronchitis (physician-diagnosed) NHANES III 0 4.1 0 (0–0.93)
2016 Medical Survey
All employees (N=306†) Shortness of breath on exertion NHANES III 21 45.8 0.5 (0.3–0.7) Wheeze last 12 months NHANES 2007–2012 58 33.3 1.7 (1.3-2.3) Hay fever, ever (physician-diagnosed) NHANES III 62 42.0 1.5 (1.2–1.9) Watery, itchy eyes last 12 months NHANES III 102 117.0 0.9 (0.7–1.1) Stuffy, itchy, or runny nose last 12 months NHANES III 153 170.2 0.9 (0.8–1.1) Ever asthma (physician-diagnosed) NHANES 2007–2012 27 39.1 0.7 (0.5–1.0) Current asthma (physician-diagnosed) NHANES 2007–2012 16 19.3 0.8 (0.5–1.3) Chronic bronchitis (physician-diagnosed) NHANES III 8 11.8 0.7 (0.3–1.3)
Administration (N=110) Shortness of breath on exertion NHANES III 3 16.0 0.2 (0.1–0.6) Wheeze last 12 months NHANES 2007–2012 18 10.7 1.7 (1.1–2.7) Hay fever, ever (physician-diagnosed) NHANES III 27 15.6 1.7 (1.2–2.5) Watery, itchy eyes last 12 months NHANES III 34 42.9 0.8 (0.6–1.1) Stuffy, itchy, or runny nose last 12 months NHANES III 49 61.4 0.8 (0.6–1.1) Ever asthma (physician-diagnosed) NHANES 2007–2012 7 14.2 0.5 (0.2–1.0) Current asthma (physician-diagnosed) NHANES 2007–2012 4 7.2 0.6 (0.2–1.4) Chronic bronchitis (physician-diagnosed) NHANES III 3 4.5 0.7 (0.2–2.0)
Assembly (N=92) Shortness of breath on exertion NHANES III 11 14.6 0.8 (0.4–1.4) Wheeze last 12 months NHANES 2007–2012 20 11.1 1.8 (1.2–2.8) Hay fever, ever (physician-diagnosed) NHANES III 21 12.2 1.7 (1.1–2.6) Watery, itchy eyes last 12 months NHANES III 27 34.5 0.8 (0.5–1.1) Stuffy, itchy, or runny nose last 12 months NHANES III 46 50.7 0.9 (0.7–1.2) Ever asthma (physician-diagnosed) NHANES 2007–2012 13 11.6 1.1 (0.7–1.9) Current asthma (physician-diagnosed) NHANES 2007–2012 9 5.7 1.6 (0.8–3.0) Chronic bronchitis (physician-diagnosed) NHANES III 2 3.5 0.6 (0.2–2.1)
Table 19B (continued). Adjusted* comparison of symptoms and self-reported diagnoses among 2013 (N=388) and 2016 (N=306†) medical survey participants with U.S. adult population by current department category

Page 82 Health Hazard Evaluation Report 2012-0055-3337
Symptom or Diagnosis Comparative population Observed Number
Expected Number
SMR(95% CI)‡
Machine shop (N=104†) Shortness of breath on exertion NHANES III 7 15.2 0.5 (0.2–1.0) Wheeze last 12 months NHANES 2007–2012 20 11.5 1.7 (1.1–2.7) Hay fever, ever (physician-diagnosed) NHANES III 14 14.2 1.0 (0.6–1.7) Watery, itchy eyes last 12 months NHANES III 41 39.6 1.0 (0.8–1.4) Stuffy, itchy, or runny nose last 12 months NHANES III 58 58.1 1.0 (0.8–1.3) Ever asthma (physician-diagnosed) NHANES 2007–2012 7 13.3 0.5 (0.3–1.1) Current asthma (physician-diagnosed) NHANES 2007–2012 3 6.4 0.5 (0.2–1.4) Chronic bronchitis (physician-diagnosed) NHANES III 3 3.9 0.8 (0.3–2.3)
Note: N=number of participants; CI=confidence interval; NHANES=National Health and Nutrition Examination Survey; SMR=standardized morbidity ratio.*Adjusted for gender, race, age, and smoking categories. †One employee not included in NHANES comparison because of demographic characteristics.‡95% CIs that exclude one are statistically significantly different from comparison with U.S. adult population and are displayed in bold.
Table 19B (continued). Adjusted* comparison of symptoms and self-reported diagnoses among 2013 (N=388) and 2016 (N=306†) medical survey participants with U.S. adult population by current department category

Page 83Health Hazard Evaluation Report 2012-0055-3337
Table 20B. Symptoms and self-reported diagnoses of 2013 (N=388) and 2016 (N=307) medical survey participants by current department category
2013 Medical Survey
Department Administration Assembly Machine ShopSymptom, n (%)* (N=145) (N=110) (N=133)
Shortness of breath On level ground With people own age At own pace
13 (9)3 (2)1 (1)
15 (14)8 (7)4 (4)
21 (16)9 (7)2 (2)
WR shortness of breath 2 (1) 7 (6) 8 (6)Usual cough 11 (8) 18 (16) 18 (14)WR usual cough 2 (1) 8 (7) 11 (8)Wheeze† 39 (27) 42 (38) 48 (36)WR wheeze† 2 (1) 12 (11) 19 (14)Asthma-like symptoms‡ 43 (30) 50 (45) 57 (43)WR asthma-like symptoms‡ 4 (3) 14 (13) 20 (15)Flu-like illness† 12 (8) 8 (7) 19 (14)WR flu-like illness† 2 (1) 3 (3) 10 (8)Nasal symptoms† 100 (69) 77 (70) 99 (74)WR nasal symptoms† 7 (5) 14 (13) 33 (25)Eye symptoms† 41 (28) 29 (26) 53 (40)WR eye symptoms† 6 (4) 9 (8) 16 (12)Rash† 14 (10) 13 (12) 20 (15)WR rash† 1 (1) 0 8 (6)
Diagnosis, n (%)Hay fever, ever 39 (27) 18 (16) 23 (17)Sinusitis, ever 50 (34) 41 (37) 43 (32)Eczema, ever 23 (16) 13 (12) 13 (10)Pneumonia, ever 30 (21) 19 (17) 14 (11)
Asthma Ever Current
13 (9)10 (7)
15 (14)8 (7)
8 (6)5 (4)
2016 Medical Survey
Department
Administration Assembly Machine Shop(N=110) (N=92) (N=105)Symptom, n (%)*
Shortness of breath On level ground With people own age At own pace
3 (3)2 (2)1 (1)
11 (12)5 (5)3 (3)
7 (7)4 (4)1 (1)
WR shortness of breath 1 (1) 3 (3) 0 (0)Usual cough 5 (5) 15 (16) 9 (9)WR usual cough 0 (0) 3 (3) 4 (4)

Page 84 Health Hazard Evaluation Report 2012-0055-3337
2016 Medical Survey
Department
Symptom, n (%)* Administration(N=110)
Assembly(N=92)
Machine Shop(N=105)
Wheeze† 18 (16) 20 (22) 20 (19)WR wheeze† 2 (2) 4 (4) 4 (4)Asthma-like symptoms‡ 20 (18) 28 (30) 26 (25)WR asthma-like symptoms‡ 2 (2) 5 (5) 7 (7)Flu-like illness† 8 (7) 12 (13) 9 (9)WR flu-like illness† 3 (3) 3 (3) 2 (2)Nasal symptoms† 49 (45) 46 (50) 59 (56)WR nasal symptoms† 6 (6) 10 (11) 13 (12)Eye symptoms† 34 (31) 27 (29) 41 (39)WR eye symptoms† 3 (3) 6 (7) 8 (8)Rash† 10 (9) 13 (14) 10 (10)WR rash† 1 (1) 0 (0) 4 (4)
Diagnosis (physician-diagnosed), N (%)Hay fever, ever 27 (25) 21 (23) 14 (13)Sinusitis, ever 40 (36) 31 (34) 30 (29)Eczema, ever 19 (17) 4 (4) 7 (7)Pneumonia, ever 17 (15) 9 (10) 19 (18)Asthma Ever Current
7 (6)4 (4)
13 (14)9 (10)
7 (7)3 (3)
Note: WR=work-related; Statistically significant values (p<.05) are in bold.*Work-related symptoms were defined as symptoms that improved away from the facility.†In the last 12 months.‡Asthma-like symptoms were defined as current use of asthma medicine and/or one or more of the following symptoms in the last 12 months: wheezing or whistling in the chest, awakening with a feeling of chest tightness, or attack of asthma.
Table 20B (continued). Symptoms and self-reported diagnoses of 2013 (N=388) and 2016 (N=307) medical survey participants by current department category

Page 85Health Hazard Evaluation Report 2012-0055-3337
Table 21B. Symptoms and self-reported diagnoses of 2013 medical survey participants by tertiles of mean endotoxin exposure
Symptom, n (%) Mean endotoxin exposure
1st tertile 2nd tertile 3rd tertile(< 1.3 EU/m3) (1.3-7.5 EU/m3) (> 7.5 EU/m3)
Shortness of breath On level ground With people own age At own pace
10 (7)4 (3)1 (1)
15 (13)7 (6)4 (3)
24 (19)9 (7)2 (2)
WR shortness of breath* 1 (1) 6 (5) 10 (8)Usual cough 10 (7) 18 (16) 19 (15)WR usual cough* 3 (2) 7 (6) 11 (9)Wheeze† 40 (27) 44 (38) 45 (36)WR wheeze*† 3 (2) 13 (11) 17 (14)Asthma-like symptoms‡ 45 (30) 52 (45) 53 (42)WR asthma-like symptoms*‡ 4 (3) 15 (13) 19 (15)Flu-like illness† 7 (5) 11 (10) 21 (17)WR flu-like illness*† 0 4 (3) 11 (9)Nasal symptoms† 103 (70) 79 (69) 94 (75)WR nasal symptoms*† 9 (6) 14 (12) 31 (25)Eye symptoms† 44 (30) 30 (26) 49 (39)WR eye symptoms*† 7 (5) 9 (8) 15 (12)Rash† 11 (7) 15 (13) 21 (17)WR rash*† 0 0 9 (7)
Diagnosis, n (%)Hay fever, ever 39 (26) 20 (17) 21 (17)Sinusitis, ever 50 (34) 45 (39) 39 (31)Eczema, ever 22 (15) 14 (12) 13 (10)Pneumonia, ever 28 (19) 22 (19) 13 (10)
Asthma Ever Current
15 (10)10 (7)
14 (12)9 (8)
7 (6)4 (3)
Note: WR=work-related; EU/m3=endotoxin units per meter cubedStatistically significant Cochran-Armitage One-Sided Trends Test (p<.05) in bold.*Work-related symptoms were defined as symptoms that improved away from the facility.†In the last 12 months.‡Asthma-like symptoms were defined as current use of asthma medicine and/or one or more of the following symptoms in the last 12 months: wheezing or whistling in the chest, awakening with a feeling of chest tightness, or attack of asthma.

Page 86 Health Hazard Evaluation Report 2012-0055-3337
Tabl
e 22
B. S
elf-
repo
rted
activ
ities
and
exp
osur
es o
utsi
de o
f wor
k* a
mon
g 20
13 (N
=388
) and
201
6 (N
=307
) med
ical
surv
ey p
artic
ipan
ts
by c
urre
nt d
epar
tmen
t
Mac
hine
Sho
p(N
=134
)
Dep
artm
ent,
num
ber (
%)
Ass
embl
y(N
=109
)
y20
13 M
edic
al S
urve
Adm
inis
tratio
n(N
=145
)A
ctiv
ity o
r exp
osur
e
Farm
ing
activ
ities
38 (2
6)37
(34)
52 (3
9)
Expo
sure
to d
ust,
smok
e, w
eldi
ng fu
mes
, gas
es, o
r che
mic
al v
apor
s72
(50)
64 (
59)
70 (5
2)
Wat
er d
amag
e to
hom
e or
its c
onte
nts
29 (2
0)9
(8)
15 (1
1)
Mol
d/m
ildew
on
any
surf
aces
(oth
er th
an fo
od) a
t hom
e30
(21)
13 (1
2)21
(16)
Expo
sure
to a
ny c
hem
ical
/sub
stan
ce th
at a
ffect
ed b
reat
hing
7 (5
)4
(4)
3 (2
)
2016
Med
ical
Sur
vey
Dep
artm
ent,
num
ber (
%)
Act
ivity
or e
xpos
ure
Adm
inis
tratio
n(N
=110
)A
ssem
bly
(N=9
2)M
achi
ne S
hop
(N=1
05)
Farm
ing
activ
ities
23 (2
1)24
(26)
46 (4
4)
Expo
sure
to d
ust,
smok
e, w
eldi
ng fu
mes
, gas
es, o
r che
mic
al v
apor
s47
(43)
51 (5
5)59
(56)
Wat
er d
amag
e to
hom
e or
its c
onte
nts
32 (2
9)14
(15)
22 (2
1)
Mol
d/m
ildew
on
any
surf
aces
(oth
er th
an fo
od) a
t hom
e35
(32)
10 (1
1)21
(20)
Expo
sure
to a
ny c
hem
ical
/sub
stan
ce th
at a
ffect
ed b
reat
hing
11 (1
0)5
(5)
3 (3
)
Not
e: N
=num
ber
of p
artic
ipan
tsSt
atis
tical
ly si
gnifi
cant
res
ults
in b
old.
*Sin
ce st
artin
g em
ploy
men
t at t
he fa
cilit
y

Page 87Health Hazard Evaluation Report 2012-0055-3337
Table 23B. Results of lung function tests of 2013 and 2016 medical survey participants2013 Spirometry (N=375)*
Obstruction, n (%) 5 (1)Restriction, n (%) 6 (2)Mixed, n (%) 3 (1)Any abnormality, n (%)† 14 (4)FEV1 % predicted, mean (range) 102 (46–147)FVC % predicted, mean (range) 104 (65–139)FEV1/FVC %, mean (range) 78 (41–96)
2013 Bronchodilator (N=38)FEV1 response, overall, n/N (%) 7/38 (18)FEV1 response, baseline normal, n/N (%) 5/27 (19)FEV1 response, baseline obstruction, n/N (%) 1/5 (20)FEV1 response, baseline restriction, n/N (%) 0/4 (0)FEV1 response, baseline mixed, n/N (%) 1/2 (50)FEV1 response, baseline any abnormality, n/N (%) 2/11 (18)
2016 Spirometry (N=299)*Obstruction, n (%) 7 (2)Restriction, n (%) 4 (1)Mixed, n (%) 3 (1)Any abnormality, n (%)† 14 (5)FEV1 % predicted, mean (range) 101 (33–149)FVC % predicted, mean (range) 103 (55–137)FEV1/FVC %, mean (range) 78 (34–98)
Change in Spirometry from 2013 to 2016 (N=250)‡**Decline in FEV1 ≥10% to <15% (%) 8 (4)Decline in FEV1 ≥15% (%) 3 (1)Decline in FVC ≥10% to <15% (%) 4 (2)Decline in FVC ≥15% (%) 4 (2)
2016 Impulse Oscillometry (N=306)Normal 241 (79)Small airways abnormality 30 (10)Large airways abnormality 23 (8)Small and large airways abnormality 12 (4)R5Hz % predicted mean (range) 118 (63–314)R20Hz % predicted mean (range) 121 (67–276)X5, mean, kPa/(L/s) -0.1R5-R20, mean (range) 14 (0–88)
Note: N=number of participants; FEV1=forced expiratory volume in one second; FVC=forced vital capacity. *For the 2013 survey, 376 participants had spirometry testing, and one test was not interpretable and excluded from analyses; for the 2016 survey, 302 participants had spirometry testing. †Any abnormality includes obstruction, restriction, or mixed pattern. ‡Participants who underwent spirometry testing in both 2013 and 2016.**Declines calculated using American College of Occupational and Environmental Medicine method [Townsend 2005], which accounts for normal aging.

Page 88 Health Hazard Evaluation Report 2012-0055-3337
Table 24B. Adjusted* comparisons of spirometric abnormalities among 2013 and 2016 medical survey participants with U.S. adult population (NHANES III)
2013 Medical Survey
Observed (n)Abnormality Expected (n) PR 95% CIObstruction 5 12 0.4 0.2–1.0Obstruction including mixed 8 16 0.5 0.3–1.0Restriction 6 26 0.2 0.1–0.5
2016 Medical Survey
Obstruction 7 10 0.7 0.3–1.4Obstruction including mixed 10 14 0.7 0.4–1.3Restriction 4 21 0.2 0.1–0.5
Note: NHANES III=Third National Health and Nutrition Examination Survey; n=number; PR=prevalence ratio; CI=confidence interval.Statistically significant prevalence ratios and confidence intervals are in bold.*Adjusted for race, sex, age, and smoking status.

Page 89Health Hazard Evaluation Report 2012-0055-3337
Tabl
e 25
B. A
rea
air r
esul
ts fo
r pai
red
met
alw
orki
ng fl
uid
and
endo
toxi
n sa
mpl
es b
y de
partm
ent a
nd m
achi
ne, N
IOSH
indu
stria
l hyg
iene
su
rvey
, Sep
tem
ber 2
016
Met
alw
orki
ng fl
uid
(MW
F) in
mg/
m3
Endo
toxi
n in
EU
/m3
Dep
artm
ent/L
ocat
ion/
Mac
hine
Sam
ple
1M
inut
es
Sam
ple
1Th
orac
ic
aero
sol
Sam
ple
1Th
orac
ic
MW
F
Sam
ple
2M
inut
es
Sam
ple
2Th
orac
ic
aero
sol
Sam
ple
2Th
orac
ic
MW
F
Sam
ple
1M
inut
esEn
doto
xin
Sam
ple
2M
inut
esEn
doto
xin
Adm
inis
tratio
n Lo
wer
Eng
inee
ring
802
<<
963
<<
802
0.04
963
0.42
Atri
um80
6<
<95
2[.0
3]<
806
0.10
952
0.43
Fron
t Offi
ces
809
<<
956
<<
809
0.05
956
0.40
Foye
r-Rec
eptio
n81
5<
<96
1<
<81
50.
2693
80.
312nd
Flo
or S
ales
830
<<
973
<<
830
0.29
973
0.68
Upp
er E
ngin
eerin
g83
2<
<96
5<
<83
20.
1296
50.
60A
ssem
bly
Rol
l Tab
le80
4<
<91
4<
<80
40.
4391
41.
912nd
Flo
or O
ffice
s80
3<
<96
6<
<80
30.
3896
70.
48B
ay 7
- Rea
r Cor
ner
807
<<
973
<<
807
0.43
973
0.87
Mid
dle
of B
ay 6
810
<<
969
<<
810
0.52
969
0.57
Bet
wee
n B
ays 3
& 4
814
<<
970
<<
814
0.53
970
1.30
Bay
1- P
ost a
long
wal
l81
7<
<97
4<
<81
70.
2497
41.
36C
NC
Dep
artm
ent
Sera
mill
817
[.03]
<95
5[.0
3][.0
4]81
77.
5395
57.
53U
MB
681
7[.0
3]<
952
[.03]
[.06]
817
4.64
952
5.94
Oku
ma
MA
800/
DM
G D
MU
210P
817
[.03]
<94
2[.0
3][.0
4]81
710
.23
942
4.54
DM
G D
MF3
60/M
azak
HC
N50
00
815
[.03]
<94
3<
<81
53.
3194
35.
61K
urak
i KB
T-11
0581
5[.0
4]<
941
[.03]
[.04]
650
1.91
941
19.0
3O
kum
a M
A50
0/O
kum
a M
A40
081
8[.0
5]<
937
[.04]
[.06]
818
9.39
937
20.0
9O
kum
a M
B50
00H
/Toy
oda
MG
530
821
[.04]
<92
9[.0
4][.0
4]81
35.
0992
99.
42C
NC
Pro
gram
mer
s Offi
ce81
3<
<93
2<
<81
33.
4793
22.
38SN
K R
B6/
Mon
arch
240
814
[.03]
<93
1[.0
5]<
762
4.82
931
15.1
0C
laus
ing
17”/
Mon
arch
PM
CV
750
804
<<
927
[.03]
[.04]
804
2.61
927
17.2
7Ta
cchi
HD
3-10
5L80
9<
<92
3[.0
5][.0
5]80
91.
4992
342
.92
Deb
urr/P
aint
Pa
rts W
ashe
r81
3<
[.04]
920
[.03]
<81
30.
6392
03.
71A
dd/P
icku
p St
atio
n81
2<
<66
5<
<81
20.
9591
73.
94H
eavy
Wel
d 59
5[.0
3]<
1008
.28
[.06]
595
0.35
517
0.86
New
Mac
hine
Sho
p H
aas V
F-2/
TL-2
Mill
s81
5[.0
5]<
1003
[.04]
<81
51.
3910
044.
12M
ori S
eiki
SL6
03/O
kum
a LT
300M
Y/O
kum
a V
60R
815
[.08]
<97
8[.0
4][.0
3]81
53.
3997
80.
86
Mor
i Sei
ki N
L300
0Y81
6[.0
4]<
974
[.03]
<81
63.
5997
40.
94

Page 90 Health Hazard Evaluation Report 2012-0055-3337
Met
alw
orki
ng fl
uid
(MW
F) in
mg/
m3
Endo
toxi
n in
EU
/m3
Dep
artm
ent/L
ocat
ion/
Mac
hine
Sam
ple
1M
inut
es
Sam
ple
1Th
orac
ic
aero
sol
Sam
ple
1Th
orac
ic
MW
F
Sam
ple
2M
inut
es
Sam
ple
2Th
orac
ic
aero
sol
Sam
ple
2Th
orac
ic
MW
F
Sam
ple
1M
inut
esEn
doto
xin
Sam
ple
2M
inut
esEn
doto
xin
Tacc
hi H
D/3
-90L
819
[.06]
<98
5[.0
5][.0
5]81
95.
3198
55.
55M
itsub
ishi
GA
-40/
Sigm
a TO
S 07
1/Fe
llow
s Sha
per
817
<<
991
<[.0
6]81
76.
7699
15.
20
Cla
usin
g 18
”/M
azak
Rex
/TR
M81
8[.0
3]<
979
[.05]
[.06]
818
4.25
979
7.19
Trak
DPM
/Maz
ak Q
TS 2
0081
9[.0
5]<
980
[.06]
[.05]
819
9.04
980
16.3
2W
ater
jet
817
<<
1007
[.04]
<81
73.
8410
070.
85O
ld M
achi
ne S
hop
ESA
B P
lasm
a81
3<
<10
10[.0
3]<
813
1.20
1010
1.37
Spar
tan
Saw
/Hem
Saw
/Dai
to
GA
400
816
<<
1014
[.03]
<81
60.
8710
143.
25
Sigm
a TO
S B
UC
63A
-300
081
7<
<10
15[.0
3]<
817
3.44
1015
2.52
Tom
inag
a TR
E-20
00D
824
[.05]
<10
150.
10[.0
5]82
42.
5810
153.
55O
kam
oto
12-2
4DX
/Acc
ugar
12
4N/3
2-12
0-EX
814
[.07]
<10
12.0
9[.0
7]81
31.
2410
122.
16
Taku
mi 8
VA/T
akum
i 11V
A/O
kum
a 3V
A81
5[.0
5]<
1009
[.06]
[.04]
815
1.37
1009
2.84
Parts
Roo
m
803
<<
917
<<
803
0.46
917
1.54
Wel
ding
Fab
ricat
ion
805
[.04]
<95
8.0
8<
805
0.39
958
0.72
Out
side
Pa
rkin
g Lo
t80
7<
<99
8<
<80
70.
4299
80.
92R
ecei
ving
Bay
Doo
r81
2<
<96
3<
<81
20.
2596
30.
55O
utsi
de E
xit 1
65-O
MS
792
<<
918
<<
792
0.49
918
0.62
NIO
SH R
ecom
men
ded
Expo
sure
Lim
it fo
r tot
al th
orac
ic a
eros
ol is
0.4
mg/
m3
Not
e: M
WF=
met
alw
orki
ng fl
uid;
NIO
SH=N
atio
nal I
nstit
ute
for
Occ
upat
iona
l Saf
ety
and
Hea
lth; m
g/m
3=m
illig
ram
per
cub
ic m
eter
; EU
/m3=
endo
toxi
n un
it pe
r cu
bic
met
er; <
=bel
ow th
e an
alyt
ical
met
hod
limit
of d
etec
tion
(LO
D);
[ ]=
conc
entr
atio
n w
as b
etw
een
the
limit
of d
etec
tion
and
the
limit
of
quan
titat
ion
Tabl
e 25
B (c
ontin
ued)
. Are
a ai
r res
ults
for p
aire
d m
etal
wor
king
flui
d an
d en
doto
xin
sam
ples
by
depa
rtmen
t and
mac
hine
, NIO
SH
indu
stria
l hyg
iene
surv
ey, S
epte
mbe
r 201
6

Page 91Health Hazard Evaluation Report 2012-0055-3337
Table 26B. Microbial species and endotoxin concentration in 33 bulk fluid samples, NIOSH industrial hygiene survey, September 2016
Machine or FluidSampled*
Bacteria(Classification) CFU/mL Fungi
(Classification)CFU/mL
EndotoxinEU/mL§
Date of last fluid change
Unused fluids
Grindex† (Diluted) None detected None detected 0.34 N/A
Blasocut BC 935 (Diluted) Pseudomonas oleovorans/pseudoalcaligenes 710 None detected < LOD N/A
Municipal Water‡ None detected None detected 5 N/A
Old Machine Shop
Hem Saw Pseudomonas oleovorans/pseudoalcaligenes 30,000,000 None detected 767 07/16/2016
Daito GA400 Pseudomonas oleovorans/pseudoalcaligenes 30,000,000 None detected 284 07/09/2016
Spartan Saw Pseudomonas oleovorans/pseudoalcaligenes 30,000,000 None detected 407 08/13/2016
Sigma Tos BUC63A† None detected None detected 21 08/20/2016
Tominaga TRE-2000D Pseudomonas oleovorans/pseudoalcaligenes 1,000,000 Trichoderma harzianum 10 35 09/10/2016
Okamoto Accugar 124N† None detected None detected 96 08/27/2016
Takumi 8VABacillus spp.Pseudomonas oleovorans/pseudoalcaligenes
260370 None detected 89 09/10/2016
Okuma 3VAActinomyces hyovaginalisCellulomonas spp.Cornybacterium auris
4,100,0003,500,0009,700,000
Aureobasidium pullulans 10 10,059 03/05/2016
ESAB Plasma‡Pseudomonas oleovorans/pseudoalcaligenes Staphylococcus gallinarum
6,900,0002,600,000 Fusarium solani 230 3,462 N/A
New Machine Shop
Waterjet – Left tank‡ Actinomyces hyovaginalisCorynebacterium spp.
830,000370,000 None detected 1,421 N/A
Waterjet – Right tank‡ Actinomyces hyovaginalisCorynebacterium spp.
590,000290,000 None detected 156 N/A
Haas VF2 #4 Pseudomonas oleovorans/pseudoalcaligenes 19,000,000 Fusarium solani 30 429 03/01/2016
Haas VF2 #2 Pseudomonas oleovorans/pseudoalcaligenes
> 30,000,000 Fusarium solani 30 92 03/01/2016
Okuma V60RActinomyces hyovaginalisPseudomonas oleovorans/pseudoalcaligenes
2,800,00013,000,000
Fusarium solaniYeasts, other
2020 559 04/23/2016
Trak TRM Pseudomonas oleovorans/pseudoalcaligenes 3,000,000 None detected 15 08/27/2016
Mazak QTS200 Pseudomonas oleovorans/pseudoalcaligenes 1,900,000 Non-sporulating fungi 10 435 05/04/2016
Mori Seiki NL3000Y Pseudomonas oleovorans/pseudoalcaligenes
> 30,000,000
Fusarium solaniYeasts, other
40370 1363 03/03/2016

Page 92 Health Hazard Evaluation Report 2012-0055-3337
Machine or FluidSampled*
Bacteria(Classification) CFU/mL Fungi
(Classification)CFU/mL
EndotoxinEU/mL§
Date of last fluid change
CNC
Seramill Pseudomonas oleovorans/pseudoalcaligenes 30,000,000 None detected 81 06/15/2016
UMB6 Pseudomonas oleovorans/pseudoalcaligenes 30,000,000 None detected 108 05/28/2016
Okuma MA800HB Pseudomonas oleovorans/pseudoalcaligenes 15,000,000
Fusarium solaniNon-sporulating fungiYeasts, other
402020
490 06/29/2016
DMG DMU210P Pseudomonas oleovorans/pseudoalcaligenes 30,000,000 None detected 926 02/10/2016
Kuraki KBT1105 Bacillus spp. 30 Fusarium solani 30 Invalid 09/03/2016
Okuma MA500 Pseudomonas oleovorans/pseudoalcaligenes 30,000,000
Fusarium solaniNon-sporulating fungiYeasts, other
201010
2,055 06/25/2016
Okuma MA400 Pseudomonas oleovorans/pseudoalcaligenes 25,000,000
Fusarium solaniNon-sporulating fungiYeasts, other
2020100
3,026 01/30/2016
Okuma MB5000H Pseudomonas oleovorans/pseudoalcaligenes 30,000,000 None detected 81 02/05/2016
SNK RB6Corynebacterium aurisPseudomonas oleovorans/pseudoalcaligenes
900,00024,000,000 None detected 201 05/11/2016
Monarch PMC V750 Pseudomonas oleovorans/pseudoalcaligenes 18,000,000 None detected 47 10/28/2015
Tacchi HD3-105LCorynebacterium aurisPseudomonas oleovorans/pseudoalcaligenes
2,200,00030,000,000
Fusarium solaniYeasts, other
1020 1,298 12/05/2015
Bridgeport EZPath Pseudomonas oleovorans/pseudoalcaligenes 560,000 None detected 3 08/13/2016
Monarch VMC-160 Pseudomonas oleovorans/pseudoalcaligenes 6,300,000 None detected 39 09/03/2016
Note: NIOSH=National Institute for Occupational Safety and Health; CFU/mL – Colony forming unit/milliliter; EU/mL – Endotoxin unit/milliliter; ND – Non-detect; N/A= not applicable.*All fluids sampled were non-preserved metalworking fluid except: †preserved metalworking fluid, ‡water. §Endotoxin samples with results below the limit of detection (LOD) and invalid samples were not included in the concentration calculations.
Table 26B (continued). Microbial species and endotoxin concentration in 33 bulk fluid samples, NIOSH industrial hygiene survey, September 2016

Page 93Health Hazard Evaluation Report 2012-0055-3337
Table 27B. Clinical characteristics of employees (n=5) with lung biopsy specimens described as lymphocytic bronchiolitis with extension into alveolar ducts and emphysema
Characteristic Value
Current department at diagnosis (%) Administration 0 (0) Assembly or machine shop 5 (100)
Smoking status (%) Never smoker 5 (100) Current smoker 0 (0) Former smoker 0 (0)
Symptoms during disease course (%) Sinus congestion 5 (100) Cough 5 (100) Wheeze 5 (100) Shortness of breath on exertion 5 (100) Rash 1 (20) ≥1 work-related chest symptom 4 (80)
Pulmonary function Mean FVC, % predicted* (range) 85 (63–102) Mean FEV1, % predicted* (range) 44 (38–56) Mean FEV1/FVC, %* (range) 54 (37–76) Mean TLC, % predicted†§ (range) 116 (100–134) Mean RV, % predicted†§ (range) 205 (144–252) Mean DLCO, % predicted†§ (range) 60 (48–80)
HRCT features (%) Emphysema 5 (100) Bronchial wall thickening 2 (40) Centrilobular nodules 0 (0) Air trapping 1 (20) Ground glass opacities 0 (0) Bronchiectasis 3 (60)
Outcome Chronic shortness of breath on exertion 4 (80) Lung transplantation 1 (20)
Note: FVC = functional vital capacity; FEV1 = forced expiratory volume in 1 second; TLC total lung capacity; RV = residual volume; DLCO = diffusing capacity of the lung for carbon monoxide; HRCT = high-resolution computed tomography.*First available spirometry test completed during NIOSH medical surveys following employee onset of shortness of breath on exertion (2013 survey = 4; 2016 survey = 1). †First available pulmonary function testing completed by healthcare provider.§Pulmonary function test not available for one employee.

Page 94 Health Hazard Evaluation Report 2012-0055-3337
Table 28B. Characteristics from 2013 and 2016 medical surveys among participants with declines of ≥ 10% in forced expiratory volume in 1 second (FEV1) or forced vital capacity (FVC) since 2013 medical survey (n=12)
Characteristic 2013 2016
Department, n (%) Administration 2 (17) 2 (17) Assembly 6 (50) 6 (50) Machine shop 4 (33) 4 (33)
Smoking status, n (%) Never 9 (75) 9 (75)
Symptom, n (%) Shortness of breath on level ground 2 (17) 6 (50) WR shortness of breath* 1 (8) 1 (8) Usual cough 2 (17) 4 (33) WR usual cough* 1 (8) 1 (8) Wheeze† 7 (58) 6 (50) WR wheeze*† 3 (25) 2 (17) Asthma-like symptoms‡ 7 (58) 7 (58) WR asthma-like symptoms*‡ 3 (25) 3 (25)
Spirometry Normal 9 (75) 5 (42) Abnormal 3 (25) 7 (58) Mild abnormality 1 (8) 3 (25) Moderately severe abnormality 1 (8) 0 (0) Severe abnormality 1 (8) 3 (25) Very severe abnormality 0 (0) 1 (8)
Note: ≥=greater than or equal to; n=number of participants; WR=work-related*Work-related symptoms were defined as symptoms that improved away from the facility.†In the last 12 months.‡Asthma-like symptoms were defined as current use of asthma medicine and/or one or more of the following symptoms in the last 12 months: wheezing or whistling in the chest, awakening with a feeling of chest tightness, or attack of asthma.

Page 95Health Hazard Evaluation Report 2012-0055-3337
During the evaluation, two tracer gas releases were conducted; one in the old and new machine shop area and one in the CNC area. In both cases, the target concentration of sulfur hexafluoride (SF6) in the area of the release (after mixing) was 50 parts per million (ppm), which is below the Occupational Safety and Health Administration (OSHA) permissible exposure limit of 1000 ppm [29 CFR 1910.1000]. The releases were made by filling 39-gallon plastic bags approximately 75% full with 99.8% SF6 gas from a standard CP200 cylinder (AirGas USA, Independence, OH) using a CGA 590 regulator with a short section of copper tubing attached to facilitate filling the bags. The bags were filled with tracer gas outside the facility away from any outdoor air intakes. Once the bags were filled, they were brought into the facility directly to the release point and ripped open to simultaneously release all of the gas as rapidly as possible. Additional data on the two tracer gas releases are displayed in Table C1 below.
Table C1. SF6 tracer gas instrument placement and release information for the tests conducted during industrial hygiene survey, February 2013
Instrument Test 1 — February 13, 2013 Test 2 — February 14, 2013
B&K B
Beside the cylinder grinder on the near ramp between the Old and New Machine Shops (NOTE: This instrument was closest to the release.)
Beside the cylinder grinder on the near ramp between the Old and New Machine Shops
B&K COn the shelf across the walkway from the KBT-1105 machine in the CNC Dept
On the shelf across the walkway from the DMU-210P machine in the CNC Dept (NOTE: This instrument was closest to the release.)
SapphIRe 1 Beside the drying oven in the Paint/Deburr area
On far ramp between Old and New Machine Shops
SapphIRe 2Far corner of Assembly Bay 7 (NOTE: This instrument was furthest from the release.)
Far corner of Assembly Bay 7 (NOTE: This instrument was furthest from the release.)
SF6 release locationBoth sides of the far ramp between the old and new machine shops (toward heavy weld)
Beside the SNK RB-6VM machine in the CNC Dept
Time of tracer gas release 18:18 18:36
To monitor the spread of SF6, two types of instruments were placed throughout the facility. Two B&K (Brüel and Kjær) Model 1302 Photoacoustic Multigas monitors (Brüel & Kjær Sound & Vibration Measurement A/S, Nærum, Denmark) were used to measure tracer gas concentrations closest to the releases. In addition, two MIRAN SapphIRe Portable Ambient Analyzers (Thermo Fisher Scientific Inc., Waltham, Massachusetts) were used to collect tracer gas measurements further from the releases, where lower concentrations were expected.
Appendix C: Tracer Gas Testing

Page 96 Health Hazard Evaluation Report 2012-0055-3337
The B&K monitors were calibrated specifically against SF6 at NIOSH before shipping. The calibration standards were produced from 99.8% certified SF6 gas standard, (Scott Specialty Gases, Inc., Plumsteadville, PA). An Entech Model 4600 Dynamic Dilution System (Entech Instruments, Inc., Simi Valley, CA) was used to generate the calibration standards in 6-liter silanized, stainless steel canisters. The Entech diluter prepares analytical standards by mixing small injections of the certified gas standard together with ultra-pure nitrogen under equilibrium conditions with computerized mass-flow controllers. This dilution system has also been used to generate calibration standards for laboratory-based sample analysis. Standards for a six point calibration curve of 0 (ultrapure nitrogen), 10, 20, 30, 40, and 50 ppm SF6 were prepared for calibrating the B&K monitors.
To calibrate the B&K monitors, the standards from the 6-liter canisters were emptied into separate 10-liter Tedlar bags (SKC Inc., Eighty Four, PA) equipped with a short piece of Teflon tubing attached to the sample inlet on the instruments. Three samples were pulled from each bag, and the average instrument response plotted against the standard concentrations. The calibration curves for the two B&K monitors are displayed in Figure 1C below.
Figure 1C. Pre-shipment calibration curves for the B&K Instruments used for SF6 tracer gas testing.

Page 97Health Hazard Evaluation Report 2012-0055-3337
The SapphIRe analyzers were calibrated by the manufacturer and come equipped with a 120-gas library of settings for analyzing specific gases. SF6 is included in the library, and the correct library settings were utilized for the tracer gas testing.
All of the tracer gas monitors were allowed to warm up for at least 30 minutes before initiating data collection. Data collection was started on each monitor several minutes before the actual tracer gas releases.
Locations of tracer gas release points and monitoring stations during test #1 are illustrated in Figure 2C, and the results from the test are highlighted in Figure 3C below. The top graph in Figure 3C illustrates the immediate large spike in SF6 concentration measured by the B&K B monitor, which was the instrument closest to the actual release. The gas was detected inside the CNC Department roughly 10 minutes later as the tracer gas spread from the machine shops into the adjacent space. The bottom graph in Figure 3C depicts the same results focused around lower SF6 concentrations. Here, the increased SF6 concentrations in the Deburr/Paint area and eventually in the furthest corner of Assembly Bay 7 are evident.
Figure 2C. Map of tracer gas test #1 release points and monitoring stations.

Page 98 Health Hazard Evaluation Report 2012-0055-3337
Figure 3C. Results from tracer gas test #1. The top graph illustrates the complete scale of results. The bottom graph demonstrates the same results focused at lower SF6 concentrations.
Figure 4C below highlights locations of tracer gas release points and monitoring stations during test #2. Results from the test are demonstrated in Figure 5C. The concentration spiked shortly after the release as evident from the results collected by the B&K C monitor, which was closest to the release. Figure 5C illustrates the tracer gas eventually reached the far corner of Assembly Bay #7, as recorded by the SapphIRe 2 monitor. Little tracer gas traveled into the machine shops during this release (NOTE: Results for the B&K B monitor are near or below the limit of detection (LOD) of the instrument and might not represent a true concentration of SF6 at that location). Given the machine shops were supplied with fresh, outdoor air without significant air being exhausted from the space, the area was under some positive pressure. Thus, the lack of tracer gas in the machine shops was expected.

Page 99Health Hazard Evaluation Report 2012-0055-3337
Figure 4C. Map of tracer gas test #2 release points and monitoring stations.
Figure 5C. Results from tracer gas test #2.

Page 100 Health Hazard Evaluation Report 2012-0055-3337
METHODS2013 Microbiome AnalysesExamination of lung tissue previously collected for clinical purposes from some employees at this facility revealed abnormalities characterized, in part, by lymphocytic proliferation and bronchiolitis. Each person’s lung has a microbiome or bacterial community. If the lung disease in the employees was related to inhalation of microorganisms or microbial products aerosolized from the facility’s metalworking fluid, then we might find bacteria similar to that found in the facility’s air and metalworking fluid in their lung microbiomes. Therefore, we compared the lung microbiomes of employees with the bacterial populations in the air and metalworking fluid at the facility. We also examined the lung microbiomes of people who did not work at the facility and the bacterial populations of the air and metalworking fluids at other facilities.
Lung tissue specimensLung tissue specimens consisted of paraffin-embedded lung tissue collected for clinical purposes from five male employees aged 33 years–62 years at the time of transthoracic (n=1), transbronchial (n=1), or surgical (n=3) biopsy (2005–2013). Four of these specimens were from employees with advanced lung disease, and one was from an employee who did not have advanced lung disease but underwent lung biopsy for another reason and had a normal result.
Control lung tissue consisted of paraffin-embedded lung tissue collected for clinical purposes from 10 male and 10 female patients who did not work at the facility and who underwent surgical biopsy for other conditions at the same hospital as the four employees with advanced lung disease. For each of the five employees, four controls were selected as follows: two with lung cancer other than lymphoma or metastatic disease, one with interstitial lung disease other than hypersensitivity pneumonitis or sarcoidosis, and one with normal lung. The controls were matched to the employees to the degree possible on age at time of biopsy (within five years) and biopsy date (within 12 months). Four controls were more than five years older than the matched employee (range: 6 years–16 years). Three controls had biopsy dates more than 12 months from the biopsy date of the matched employee (range: 15 months–17 months).
Environmental samplesEnvironmental samples consisted of 77 air samples and 44 bulk process fluid samples collected at the facility in June 2012 and February 2013 (Table 1D below). The air samples were collected from areas throughout the facility. The air samples included 50, 37-millimeter (mm) polycarbonate filters, and 27 liquid impinger samples containing mineral oil. The filters were stored frozen at -20°C until analysis. The bulk fluid samples were collected from machines in the old machine shop, the new machine shop, and CNC machines. For each machine sampled, approximately 50 milliliter (mL) of fluid was collected into a 50
Appendix D: Microbiome Analyses

Page 101Health Hazard Evaluation Report 2012-0055-3337
mL polypropylene centrifuge tube container. To avoid contamination, a new pair of nitrile gloves and a sterile pipette were used during the collection of each sample. In addition to the machine process fluids, samples of both preserved and non-preserved unused (neat) metalworking fluids, one sample of non-preserved diluted unused fluid, and a municipal water sample were collected. The bulk samples were initially refrigerated and then stored frozen at -20°C until analysis.
Control environmental samples consisted of 38 air samples and 54 bulk fluid samples collected at other facilities not known to have cases of lung disease (Table 1D). The air samples were area samples collected as part of a Canadian study of 25 facilities in the province of Quebec from 2006–2008 [Duchaine et al. 2012]. They consisted of 38 pelleted samples prepared by centrifuging solubilized gelatin filters. The bulk fluid samples included 43 pelleted samples from the same Canadian study. Neither the air samples nor the bulk samples from the Canadian study were cultured before preparation. We also included 10 bulk fluid samples from an automotive parts manufacturing facility [NIOSH 2016] and one sample from the NIOSH facility maintenance department. The Canadian facilities used a variety of metalworking fluids including the preserved and non-preserved metalworking fluid products. The automotive facility used Metalloid Syn Sol 7000. The NIOSH facility maintenance department used Blasocut 2000 Universal ART 870. All samples were stored frozen at -20°C until analysis.
AnalysesThe analyses of the lung tissue and environmental samples focused on a piece of deoxyribonucleic acid (DNA) called the 16S ribosomal RNA (rRNA) gene. The 16S rRNA gene is found in bacteria but not in more complex organisms such as fungi, plants, animals, or humans. This gene’s sequence, or unique combination of DNA building blocks, can be used to identify the types of bacteria present in a sample and to compare the bacterial populations of different samples. This process involves two main steps. The first step takes place in a laboratory, where the 16S rRNA gene sequence is decoded. One sample might have multiple types of bacteria and, therefore, multiple different sequences for this gene. The second step involves a computer, which uses the 16S rRNA gene sequence to classify and compare the types of bacteria within and across samples. The computer program classifies bacteria into operational taxonomic units, which are comparable with bacterial species. Below we provide more detailed information on the analyses.
All lung tissue and environmental samples were shipped overnight to Dr. Segal in December 2013. All analyses were performed by Dr. Segal at the New York University Genome Technology Center. For lung tissue, DNA extraction was performed using BiOstic® FFPE Tissue DNA Isolation Kit (MoBio, Carlsbad, CA) following the manufacturer’s instructions. For environmental samples, DNA extraction was performed using DNeasy®Plant Mini Kit (Qiagen, Dusseldorf, Germany) for air filters and QIAamp®DNA Mini Kit (Qiagen, Dusseldorf, Germany) for the rest following manufacturer’s instructions. All extracted DNA underwent 16S rRNA gene amplification, purification, and pyro-sequencing using the MiSeq platform (Illumina, San Diego, CA). Once the 16S rRNA gene sequences were determined, the sequences were analyzed using the Quantitative Insights into Microbial Ecology (QIIME)

Page 102 Health Hazard Evaluation Report 2012-0055-3337
pipeline for analysis of community sequence data [Caporaso et al. 2010a]. Processing consists of the following steps: 1) de-multiplexing and filtering of short (<150 nucleotides) and low quality reads; 2) de novo clustering of the sequences into operational taxonomic units with UCLUST; 3) taxonomical assignment of each operational taxonomic unit (RDP Classifier); 4) alignment of representative sequences using PyNAST with the Greengenes core set alignment template [DeSantis et al. 2006; Caporaso et al. 2010b]; 5) phylogenetic tree reconstruction (FASSTTREE); and 6) UniFrac distance calculations [Lozupone et al. 2011].
For each sample, the proportions of reads at the operational taxonomic unit or genus levels were used as a measure of the relative abundance of each type of bacteria. Weighted UniFrac was used to measure beta diversity and to perform principal coordinate analysis (PCoA) using ade4 package in R. Hierarchical clustering was used to establish distinct microbiomes. For classification of species, sequences were aligned using online Blast tool. To evaluate differences in sequence data between groups we calculated linear discriminant analysis (LDA) Effect Size (LEfSe) [Segata et al. 2011].
Helicobacter was found increased in the environmental samples. The manufacturer of the metalworking fluid noted that Helicobacter previously had not been found in samples of the company’s metalworking fluids. Given this information and the plausibility of contamination because of sample processing in a laboratory specializing in Helicobacter pylori, Dr. Segal repeated sample processing and sequencing in another laboratory for 13 environmental samples: seven with high and six with low relative abundance of Helicobacter in the prior testing. Single sided outlier plots illustrated that Helicobacter was an outlier. Therefore, sequences assigned to this operational taxonomic unit were removed upstream.
In vitro AnalysisCell Isolation and PurificationSplenic B-cells were obtained from C57BL/6 8-10 week old female mice (Jackson Laboratory, Bar Harbor, Maine). The spleen tissue was mechanically disrupted and strained using a 40 μm filter. B-cells were isolated using the Dynabeads mouse CD43 isolation kit (ThermoFisher, Waltham, MA). Cells were labeled with cell trace violet proliferation dye (ThermoFisher, Waltham, MA).
Metalworking Fluid ExposureAll metalworking fluid used in the in vitro analysis was collected at the facility in June 2012 and February 2013. Samples included neat (never used) preserved metalworking fluid, neat non-preserved metalworking fluid, in-use preserved metalworking fluid, and in-use non-preserved metalworking fluid. In-use samples were collected from individual machines. Samples of in-use preserved metalworking fluid collected from different machines were combined. Similarly, samples of in-use non-preserved metalworking fluid from different machines collected were combined. The combination fluids were then aliquoted and kept in -20°C conditions until used for the experiments.
Metalworking fluids were sterilized using sequential filtration with a 40 μm filter followed by

Page 103Health Hazard Evaluation Report 2012-0055-3337
a 20 μm filter (Millipore, Bedford, MA). One-half million purified B-cells were then plated in 0.5 mL activation media (RPMI; Corning, Corning, NY) containing 15% FBS, Hepes, L-Glu, non-essential amino acids, sodium pyruvate, Pen/Strep and β-mercaptoethanol. Cells were then cultured with either phosphate-buffered saline (PBS) as a negative control; 200 nanograms per milliliter (ng/mL) of B-cell activating factor (BAFF) (R&D Systems, Minneapolis, MN) as a positive control that promotes B-cell survival but not proliferation; 20µg/ml of lipopolysaccharide (LPS, a component of endotoxin; Sigma-Aldrich, St. Louis, MO) as a positive control that promotes B-cell survival and proliferation; or 25 µl of 1:40 dilution of filter-sterilized metalworking fluid. On day 2, 0.5 mL of media with an appropriate concentration of PBS, BAFF, LPS, or metalworking fluid was added.
Microscopy and Flow CytometryOn day 4, bright-field images were recorded using a 40X objective on the EVOS™ FL Cell Imaging System (ThermoFisher, Waltham, MA) and flow cytometry was performed on a BD LSRFortessa Cell Analyzer (BD Biosciences, East Rutherford, NJ). Cells were stained with the following antibodies before flow cytometry: IgM FITC (Jackson ImmunoResearch, West Grove, PA), IgG1 PE, B220 PerCPCy5-5, CD19 PeCy7 (eBioscience, San Diego, CA), and CD138 APC (BD Biosciences, East Rutherford, NJ). The Pacific blue channel was used to visualize the cell trace violet proliferation dye (ThermoFisher, Waltham, MA). Presence of terminally differentiated B-cells (plasma cells) was assessed in the in vitro cultures using CD138 (Syndican 1) (BD Biosciences, San Jose, CA) staining and forward scatter (FSC).
2016 Microbiome Analyses
Each person has a microbiome or bacterial community on their skin and on internal mucosal surfaces, including the respiratory tract. To address whether exposure to the environmental microbiota within the facility influenced the microbiome of employees, we compared the microbiome on the skin and within upper airways of employees with the bacterial populations in the air and within the process fluids used at the facility.
Human airway and skin samplesWe collected samples from employees for microbiome analyses including: a) oropharyngeal samples by asking employees to gargle and spit 10 mL of sterile water into a sterile container; b) skin samples from the outer cheek area using a sterile swab to collect skin cells; and c) nasal samples using a nasopharyngeal swab to collect a sample from the posterior nasopharynx. At the time samples were collected, participants were asked questions specific to antibiotic, nasal spray, or inhaler use in the last four weeks, symptoms lasting at least eight weeks when they did not have a cold or influenza, and time in hours they had been present at work on the day of sample collection. Samples were placed into a -20ºC freezer immediately following collection and shipped overnight to New York University Medical Center for processing, and were included in the total microbiome analysis.
Environmental samples Both bulk fluid and air samples were submitted for microbiome analyses. The 60 bulk fluid samples were collected in 50 mL sterile polypropylene centrifuge tubes. To avoid

Page 104 Health Hazard Evaluation Report 2012-0055-3337
contamination, a new pair of sterile, latex surgical gloves and a sterile pipette were used during each sample collection. Samples included unused (neat) and unused diluted samples of both preserved and non-preserved metalworking fluids, municipal water, and in-use process fluid samples from 48 machines. There were 180 air samples collected on 37-mm, 0.8-micrometer (µm) polychloride closed-face filter cassettes. Twenty additional filter cassettes and sterile polypropylene centrifuge tubes were provided as media blanks. All samples were initially refrigerated and then stored at -20°C until shipment. Samples were shipped overnight to New York University Medical Center for processing and were included in the total microbiome analysis. AnalysesThe analyses of the human and environmental samples focused on the 16S rRNA gene as described above.
All analyses were performed by Dr. Segal at the New York University Genome Technology Center. For skin, nasal, and oral samples, DNA extraction was performed using DNeasy Powersoil HTP DNA Isolation Kit (MoBio, Carlsbad, CA) following the manufacturer’s instructions. For environmental samples, DNA extraction was performed using DNeasy®Plant Mini Kit (Qiagen, Dusseldorf, Germany) for air filters and QIAamp®DNA Mini Kit (Qiagen, Dusseldorf, Germany) for the rest following manufacturer’s instructions.
High-throughput sequencing of bacterial 16S rRNA gene amplicons (V4 region) was performed as 150bp reads with a paired-end protocol using the MiSeq platform 1. Reagent controlled samples and mock mixed microbial DNA were sequenced and analyzed in parallel. Each unique barcoded amplicon was generated in pairs of 25 microliter (μl) reactions with the following reaction conditions: 11 μl PCR-grade water, 10 μl Hot MasterMix (5 Prime Cat# 2200410), 2 μl of forward and reversed barcoded primer (5μM) and 2 μl template DNA. Reactions were run on a C1000 Touch Thermal Cycler (Bio-Rad) with the following cycling conditions: initial denaturing at 94°C for 3 minutes followed by 35 cycles of denaturation at 94°C for 45 seconds, annealing at 58°C for one minute, and extension at 72°C for 90 seconds, with a final extension of 10 minutes at 72°C. Amplicons were quantified using the Agilent 2200 TapeStation system and pooled. Purification was then performed using Ampure XT (Beckman Coulter Cat# A63882) per the manufacturer’s instructions.
The obtained 16S rRNA gene sequences were analyzed using the Quantitative Insights Into Microbial Ecology (QIIME) 1.9.1 package 2. Reads were de-multiplexed and quality filtered with default parameters. We required greater than 1,000 reads in any sample, a threshold achieved with all skin and airway samples obtained. Sequences were then clustered into operational taxonomic units using a 97% similarity threshold with UCLUST 3 and the Greengenes 16S rRNA gene reference dataset and taxonomy 4. For each sample, the proportion of reads at the genus level was used as a measure of the taxonomic relative abundance in a specimen. PERMANOVA (adonis) testing was used to compare the β-diversity of groups. To decrease the number of features, we only focused on major taxa and operational taxonomic units, defined as those having a relative abundance greater than 1% in at least one sample. No operational taxonomic units were removed from the analysis.
Page 105Health Hazard Evaluation Report 2012-0055-3337
We used the ade4 package in R to construct Principal Coordinate Analysis (PCoA) plots, based on the Bray Curtis Dissimilarity index 5. For comparisons of β diversity, or taxonomy between groups, non-parametric tests were used (PERMANOVA and Mann-Whitney). To evaluate differences between groups of transcriptome and 16S rRNA gene sequencing data, we used linear discriminant analysis (LDA) Effect Size (LEfSe) 6. Features significantly discriminating among groups with LDA score >2.0 were represented as a cladogram, as produced by LEfSe with default parameters.
RESULTS2013 Microbiome AnalysisFor almost all samples, the number of reads per sample was greater than 1000, which is a marker of high quality testing and assures sufficient sequence depth for taxonomic representation in each sample.
For both lung tissue samples and environmental samples, no significant differences existed in alpha-diversity between facility samples and the control samples collected in other facilities (Figure 1D). Alpha-diversity is a measure of the number of different species in a sample. The graphs in Figure 1D displays the number of observed operational taxonomic units (OTUs) on the vertical axis and the number of sequences per sample on the horizontal axis. For metalworking fluid samples on the left, air samples in the middle, and tissue samples on the right, there were no significant differences between the facility samples and control samples (other facilities). Therefore, the facility samples and the control samples had similar numbers of species detected.
There were differences among the facility samples and control samples in beta-diversity (Figure 2D). Beta-diversity is a measure of how similar the microbial compositions of two different samples are. The graphs in Figure 2D indicate Principal Component Analysis (PCoA), which allows 3-dimensional comparisons of the distributions of the bacterial species found in the samples. The closer two dots are, the more closely related their bacterial species. Circles represent the 95% confidence interval for the distribution of the samples belonging to one group (e.g. tissue case, tissue control). On the left, case tissue samples from employees at the facility are shown in red and control tissue samples (from other persons) are displayed in green. In the middle, tissue samples are displayed with facility metalworking fluid samples in purple and control metalworking fluid samples in blue. On the right, tissue samples are shown along with case air samples in yellow and control air samples in gray.
Beta-diversity can be measured in UniFrac distance. The larger the UniFrac distance, the more the microbial compositions of two different samples differ. As seen in Figure 3D, the graph on the upper left illustrates the UniFrac distances for comparisons of tissue samples. For each comparison, the boxes represent the median (line through the middle of the box) and interquartile range (top and bottom of the box). The lines extending from the box represent the 5% and 95% confidence interval values. Dots above and below these lines represent values for UniFrac Distances between samples that fall below or above the 5%

Page 106 Health Hazard Evaluation Report 2012-0055-3337
and 95% confidence intervals, respectively. There were no significant differences in UniFrac distance among tissue samples.
The graph in the upper middle of Figure 3D shows the UniFrac distances for comparisons among metalworking fluid samples. There were no significant differences in UniFrac distance among metalworking fluid samples. The graph on the upper right illustrates the UniFrac distances for comparisons among air samples. There were no significant differences in UniFrac distance among air samples. These findings mean that within a sample type (tissue, metalworking fluid, or air), the case and control samples had similar beta-diversity. The graph on the lower left of Figure 3D depicts the UniFrac distances for comparisons of metalworking fluid and tissue samples. The UniFrac distance for case metalworking fluid and tissue samples was significantly lower than the UniFrac distance for control metalworking fluid and tissue samples. The graph on the lower right displays the UniFrac distance for comparisons of air and tissue samples. The UniFrac distance for case air and tissue samples was significantly lower than the UniFrac distance for control air and tissue samples. These findings mean across sample types (tissue, metalworking fluid, and air), case samples had lower beta-diversity than did control samples, indicating case tissue and environmental samples were more closely related to one another than were control tissue and environmental samples.
Facility environmental samples and control environmental samples differed in the types of bacteria detected. For each bacterial genus detected, Dr. Segal examined whether that genus was relatively more abundant (“enriched”) in the facility samples or the control samples. Facility environmental samples were enriched with different types of bacteria than the control environmental samples (Figures 4D and 5D). In Figures 4D and 5D, bacteria enriched in the facility samples are in red and bacteria enriched in the control samples are in green. The length of the red or green bar indicates the degree of the difference, with longer bars demonstrating larger differences between the samples. Previously, we reported the results of bacterial culture of facility bulk fluids. These cultures primarily grew Pseudomonas. However, Pseudomonas was not the predominant genus detected in facility bulk fluid samples using 16S rRNA gene analysis. This means that although Pseudomonas was present and could be cultured, other types of bacteria that could not be cultured (grown) were actually more common in these samples than Pseudomonas. Similarly, for facility air samples, Micrococcus predominated in culture but not in the analyses based on the 16S rRNA gene.
Employee lung tissue samples also were enriched with different types of bacteria than the control lung tissue samples (Figure 6D). As can be seen by the red bar at the top, the greatest difference was for Pseudomonas, which was enriched in the employee lung tissue samples compared with the control lung tissue samples. This same pattern was evident in sensitivity analyses in which the employee lung tissue samples were limited to those with B-cell bronchiolitis-alveolar ductitis and emphysema (n=4), and was driven by two of the employee lung tissue samples in particular (Figure 7D). The sequence of the Pseudomonas with high abundance in the employee lung tissue samples most closely aligned with Pseudomonas andersonii.

Page 107Health Hazard Evaluation Report 2012-0055-3337
In vitro AnalysisThe second row of Figure 8D demonstrates the results of flow cytometry. These graphs illustrate forward scatter that measures the size of the cells on the horizontal axis and side scatter that measures the internal content of the cells on the vertical axis. In the left lower portion of the graph are cells that are smaller, fragmented, and mostly dead. In the upper right portion of the graph are cells that are bigger and alive. The number in the upper right illustrates the percent of living cells. Compared with PBS, BAFF leads to improved survival of the cells. B-cells exposed to LPS include a large sub-population to the right of the diagonal line with cells that are bigger, meaning they underwent activation and proliferation. Cells exposed to the in-use metalworking fluids also have a sub-population to the right of the diagonal line; whereas, cells exposed to the neat metalworking fluids do not. These flow cytometry results confirm the qualitative findings from the microscopy, namely that in-use metalworking fluids caused B-cell activation and proliferation.
The third row of Figure 8D illustrates additional results of flow cytometry using a fluorescent dye (CellTrace™ Violet) that becomes incorporated in the plasma membrane of the labeled cells and is diluted as the cells proliferate (as the membrane is divided between daughter cells). These histograms demonstrate the fluorescence intensity on the horizontal axis with the percent of the population on the vertical axis. As the cells divide, the amount of dye per cell decreases by half and the fluorescence intensity falls. Cells exposed to PBS did not survive. Cells exposed to BAFF had peak counts towards the right of the histogram, where fluorescence intensity is highest (for reference, displayed in gray in all graphs). Cells exposed to LPS were more abundant and had peak counts towards the left of the histogram, indicating cell division had occurred. Like cells exposed to PBS (the negative control), cells exposed to the neat metalworking fluid did not survive. Cells exposed to the in-use metalworking fluid had a pattern similar to LPS (the positive control). Further examination of the B-cells exposed to in-use metalworking fluid found the fluid also caused a portion of the cells to undergo differentiation.
This set of experiments demonstrates that in-use metalworking fluid collected at the facility in 2012 and 2013 stimulated B-cells isolated from mice. Neat metalworking fluid did not stimulate the B-cells. This difference strongly indicates the presence of constituents able to cause B-cell activation and proliferation in the in-use metalworking fluid but not the neat metalworking fluid.
2016 Microbiome AnalysisFor almost all samples, the number of reads per sample was greater than 5,000, which is a marker of high quality testing and assures sufficient sequence depth for taxonomic representation in each sample.
Microbiological description of bulk fluid samples Significant differences were noted in alpha-diversity among bulk fluid samples (Figure 9D). Alpha-diversity is a measure of the number of different species in a sample. Non-preserved metalworking fluid had lower alpha diversity illustrating dominance by few taxa as illustrated in graph A of Figure 9D.

Page 108 Health Hazard Evaluation Report 2012-0055-3337
Beta-diversity analysis also highlighted significant differences among bulk fluid samples (graph B in Figure 9D). Beta-diversity is a measure of the similarity between the microbial compositions of two different samples. It can be measured based on Bray Curtis dissimilarity index. The larger the Bray Curtis dissimilarity index, the greater the difference between the microbial compositions of two different samples. In general, the in-use metalworking fluids (both preserved and non-preserved) had significant differential clustering compared with neat (unused) fluid or water controls. Subanalysis of in-use metalworking fluids demonstrated significant differences in microbial composition between preserved versus non-preserved metalworking fluids (graph C in Figure 9D).
Preserved and non-preserved metalworking fluid samples differed in the types of bacteria detected. For each bacterial genus detected, Dr. Segal examined whether the genus was relatively more abundant (“enriched”) in the preserved or non-preserved metalworking fluid samples (Figure 10D). Preserved metalworking fluid samples (indicated by red in graphs A and B) were enriched with different types of bacteria, including Brevundinomonas, Alcaligenaceae (u.g.), and Sphingobacterium. In contrast, non-preserved metalworking fluid samples (indicated in green) were predominantly enriched with Pseudomonas.
Microbiological description of air samples The alpha-diversity of air samples was not significantly different between samples from administration, assembly, or the machine shop (graph A in Figure 11D). Similarly, beta-diversity for air samples was not significantly different among locations (graph B). Taxonomic analysis also demonstrated few differences among bacterial genera (graph C in Figure 11D).
Comparison of microbial community between metalworking fluid and air samplesWe then compared the degree of similarity between metalworking fluid and air samples using the Bray Curtis dissimilarity index between pairs of samples. Figure 12D illustrates that the degree of similarity between the air in assembly and metalworking fluids (both preserved and non-preserved) was greater than similarity between the air in administration and metalworking fluids. Similar results were discovered when comparing the air in the machine shop and metalworking fluids (both preserved and non-preserved) with the air in administration and metalworking fluids. These data are consistent with air samples from the assembly and machine shop areas being influenced by metalworking fluids.
Microbiological description of human samples We then evaluated the microbiota composition of skin, nasal, and oral wash samples. Alpha-diversity was lower in nasal samples and higher in oral wash samples (graph A in Figure 13D). Beta-diversity analysis also illustrated significant differences between sample types (graph B). No differences were noted in alpha-diversity among skin samples from employees in different locations (Figure 14D graph A), but compositional taxonomic differences were noted based on the beta-diversity analysis (graph B). Within nasal swab samples, alpha-diversity was lower among assembly (graph C) employees but no statistically significant differences were noted in beta-diversity of the nasal samples (graph D). For oral wash samples, no statistically significant differences were noted in alpha- or beta-diversity (graphs E and F).

Page 109Health Hazard Evaluation Report 2012-0055-3337
We then compared the degree of similarity between the metalworking fluid and human samples using the Bray Curtis dissimilarity index between pairs of samples. Figure 15D highlights the degree of similarity between the metalworking fluids (both preserved and non-preserved) and types of human samples (graphs A, B, and C). Non-preserved metalworking fluid had greater similarity to human skin, nasal, and oral wash samples from employees in the machine shop compared with the similarity between non-preserved metalworking fluid and human samples from employees in administration. A similar trend was noted among preserved metalworking fluid and skin samples, where similarity was greater for employees in the machine shop. Comparison of similarity between air and human samples demonstrated greater overall similarity across locations and no statistically significant differences were noted (data not displayed). These data are consistent with the samples obtained from employees in the machine shop area being influenced by the microbial composition of metalworking fluid.
LEfSe analysis identified top differential taxa enriched in the samples from employees working in different locations (Figure 16D). Pseudomonas was consistently enriched in the skin (graph A), nasal (graph B), and oral wash samples (graph C) among employees in the machine shop area (illustrated in red) compared with samples from employees in the administration (blue) or assembly areas (green).
We then explored which operational taxonomic unit was among the most differentially enriched taxa. The most abundant operational taxonomic unit differentially enriched in the metalworking fluid and employee samples was annotated to the genus Pseudomonas (OTU=Pseudomonas_813945, Figure 17D).

Page 110 Health Hazard Evaluation Report 2012-0055-3337
Table 1D. Environmental samples used in microbiome analyses
No. Sample type Description Date collectedsamples
Air sample Filter 50 February 2013
Air sample Biosampler — Mineral Oil 27 February 2013Bulk fluids Blasocut BC935/Grindex 10
Municipal water/in-use fluids10 June 2012
34 February 2013Air sample Pelleted sample 38 October 2006–April 2008
Metalworking fluid
Pelleted samples:Cimstar 60CVegetoilBlasocut 2000XUnicoolCimtech 410CChromac 2215Hocut 795FDOracoupValcool VP700WS-5050Solumag 1000B-Cool 655Cimstar 700Blasocut BC40NFVasco 1000Trim C270Blasocut 4000strongChemcool 2000S500
43 October 2006–April 2008
Metalworking fluid Metalloid Syn Sol 7000 10 March 2013
NIOSH facility
Metalworking fluid Blasocut 2000 Universal ART 870 1 November 2013

Page 111Health Hazard Evaluation Report 2012-0055-3337
Figure 1D. Number of observed operational taxonomic units for metalworking fluid, air, and tissue samples for cases and controls.
Figure 2D. Principal Component Analysis (PCoA) for tissue, metalworking fluid, and air samples.
Note: MWF = metalworking fluid. Tissue (left) — case tissue red, control tissue green. Tissue + MWF (middle) — facility metalworking fluid samples purple, control metalworking fluid samples blue. Tissue + Air (right) — case air samples yellow, control air samples gray.
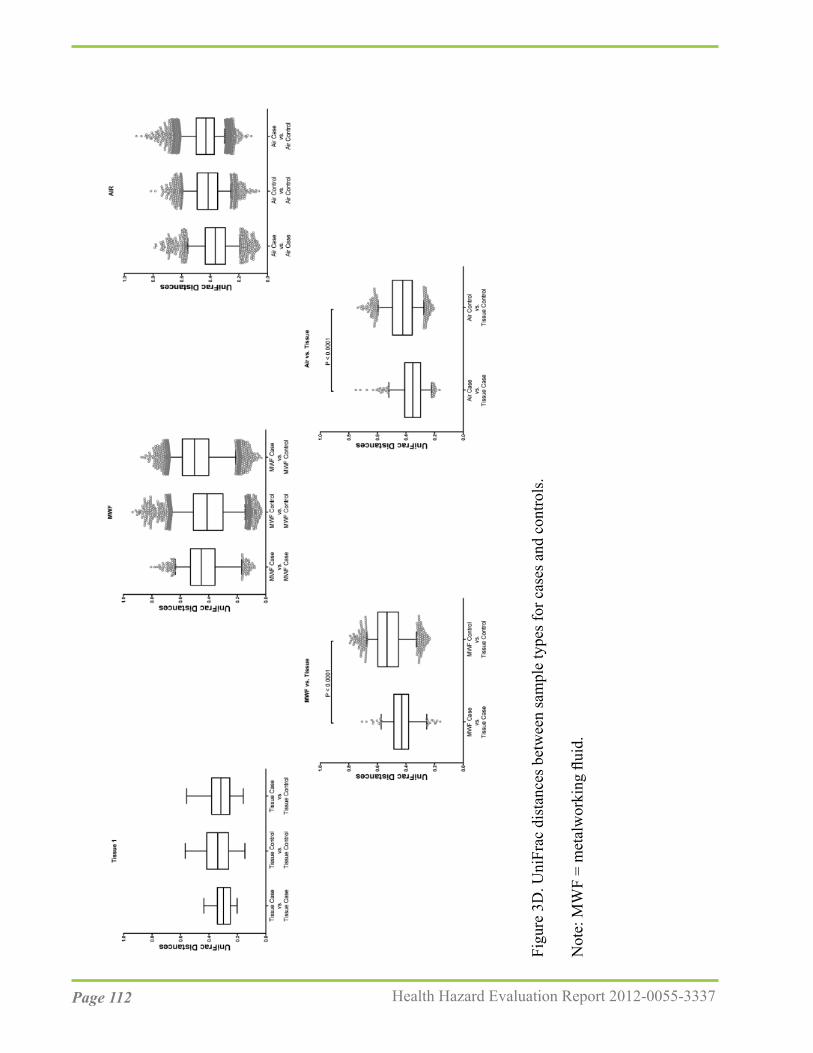
Page 112 Health Hazard Evaluation Report 2012-0055-3337
Figu
re 3
D. U
niFr
ac d
ista
nces
bet
wee
n sa
mpl
e ty
pes f
or c
ases
and
con
trols
.
Not
e: M
WF
= m
etal
wor
king
flui
d.

Page 113Health Hazard Evaluation Report 2012-0055-3337
Figure 4D. Bacterial genera enriched in case and control metalworking fluid samples.
Note: LDA = linear discriminant analysis; MWF = metalworking fluid.

Page 114 Health Hazard Evaluation Report 2012-0055-3337
Figure 5D. Bacterial genera enriched in case and control air samples.
Note: LDA = linear discriminant analysis; MWF = metalworking fluid.

Page 115Health Hazard Evaluation Report 2012-0055-3337
Figure 6 D. Bacterial genera enriched in case and control tissue samples.
Note: LDA = linear discriminant analysis; MWF = metalworking fluid.

Page 116 Health Hazard Evaluation Report 2012-0055-3337
Figu
re 7
D. R
elat
ive
abun
danc
e of
sele
cted
bac
teria
. A. R
elat
ive
abun
danc
e of
four
sele
cted
bac
teria
(by
genu
s) in
con
trol t
issu
e sa
mpl
es
com
pare
d w
ith c
ase
tissu
e sa
mpl
es. B
. Rel
ativ
e ab
unda
nce
and
num
ber o
f rea
ds o
f tw
o Ps
eudo
mon
as su
btyp
es in
con
trol t
issu
e sa
mpl
es
com
pare
d w
ith c
ase
tissu
e sa
mpl
es.

Page 117Health Hazard Evaluation Report 2012-0055-3337
Figu
re 8
D. M
ouse
B-c
ell r
espo
nse
to e
xpos
ure
to m
etal
wor
king
flui
d sa
mpl
es. T
he to
p ro
w il
lust
rate
s mic
rosc
opy,
the
rem
aini
ng ro
ws
illus
trate
s flow
cyt
omet
ry re
sults
.
Not
e: B
AFF
= B
-cel
l act
ivat
ing
fact
or; F
SC =
forw
ard
scat
ter;
LPS
= lip
opol
ysac
char
ide;
MW
F =
met
alw
orki
ng fl
uid;
PB
S =
phos
phat
e-bu
ffere
d sa
line;
SSC
= si
de sc
atte
r.

Page 118 Health Hazard Evaluation Report 2012-0055-3337
Figure 9D. Differences in microbial community among different types of fluids. A. Alpha diversity calculated based on Shannon Index and represented for each fluid sample. B. Principal Component Analysis (PCoA) based on Bray Curtis Dissimilarity Index. C. Subanalysis of the in-use metalworking fluid.
Note: MWF.NP = non-preserved metalworking fluid; MWF.P = preserved metalworking fluid.

Page 119Health Hazard Evaluation Report 2012-0055-3337
Figure 10D. Taxonomic differences between preserved and non-preserved metalworking fluids. LEfSe analysis explored for taxa enriched in preserved as compared with non-preserved metalworking fluid.
Note: LDA = linear discriminant analysis; MWF = metalworking fluid.

Page 120 Health Hazard Evaluation Report 2012-0055-3337
Figure 11D. Differences in air samples. A. Differences in alpha-diversity based on Shannon Index between air samples obtained from administration, assembly, and machine shop. B. Beta-diversity analysis based on Bray Curtis dissimilarity Index. C. LEfSe analysis explored for taxa enriched in different air samples.
Note: LDA = linear discriminant analysis.

Page 121Health Hazard Evaluation Report 2012-0055-3337
Figure 12D. Degree of similarity between metalworking fluid and air samples.
Note: MWF = metalworking fluid.

Page 122 Health Hazard Evaluation Report 2012-0055-3337
Figure 13D. Differences in microbiota composition of human samples. A. Alpha-diversity based on Shannon Index. B. Principal Component Analysis (PCoA) based on Bray Curtis Dissimilarity Index.

Page 123Health Hazard Evaluation Report 2012-0055-3337
Figure 14D. Differences in microbiota composition within different types of human samples. Differences in alpha- and beta-diversity were explored in skin samples (A and B), nasal swabs (C and D) and oral wash samples (E and F).

Page 124 Health Hazard Evaluation Report 2012-0055-3337
Figure 15D. Degree of similarity between metalworking fluid and human samples. Microbiota similarities based on Bray Curtis Dissimilarity Index were explored for metalworking fluid (both preserved and non-preserved) and skin samples (A), nasal swab samples (B) and oral wash samples (C).
Note: MWF = metalworking fluid.

Page 125Health Hazard Evaluation Report 2012-0055-3337
Figu
re 1
6D. T
axon
omic
diff
eren
ces b
etw
een
hum
an sa
mpl
es o
btai
ned
in d
iffer
ent l
ocat
ions
. LEf
Se a
naly
sis e
xplo
red
for t
axa
enric
hed
in
pres
erve
d co
mpa
red
with
non
-pre
serv
ed m
etal
wor
king
flui
d.
Not
e: L
DA
= li
near
dis
crim
inan
t ana
lysi
s; M
WF
= m
etal
wor
king
flui
d.

Page 126 Health Hazard Evaluation Report 2012-0055-3337
Figure 17D. Relative abundance of most differentially enriched operational taxonomic units. An operational taxonomic unit annotated to Pseudomonas (Pseudomonas_813945) was identified based on LEfSe.

Page 127Health Hazard Evaluation Report 2012-0055-3337
ReferencesAllen TC. Pathology of small airways disease [2010]. Arch Pathol Lab Med 134(5):702-718.
Beckett W, Kallay M, Sood A, Zuo Z, Milton D [2005]. Hypersensitivity pneumonitis associated with environmental mycobacteria. Environ Health Perspect 113(6):767-770.
Broadwater K, de Perio MA, Roberts J, Burton NC, Lemons AR, Green BJ, Brueck SE [2016]. Investigating a persistent odor at an aircraft seat manufacturer. J Occup Env Hyg 13(10):D159-D165.
Burge PS. Hypersensitivity pneumonitis due to metalworking fluid aerosols [2016]. Curr Allergy Asthma Rep 16(8):59.0
Burton CM, Crook B, Scaife H, Evans GS, Barber CM [2012]. Systematic review of respiratory outbreaks associated with exposure to water-based metalworking fluids. Ann Occup Hyg 56(4):374-388.
Caporaso JG, Kuczynski J, Stombaugh J, Bittinger K, Bushman FD, Costello EK, Fierer N, Peña AG, Goodrich JK, Gordon JI, Huttley GA, Kelley ST, Knights D, Koenig JE, Ley RE, Lozupone CA, McDonald D, Muegge BD, Pirrung M, Reeder J, Sevinsky JR, Turnbaugh PJ, Walters WA, Widmann J, Yatsunenko T, Zaneveld J, Knight R [2010a]. QIIME allows analysis of highthroughput community sequencing data. Nat Methods 7(5):335-336.
Caporaso JG, Bittinger K, Bushman FD, DeSantis TZ, Andersen GL, Knight R [2010b].PyNAST: a flexible tool for aligning sequences to a template alignment. Bioinformatics26(2):266-267.
CDC (Centers for Disease Control and Prevention) [1996]. Third National Health and Nutrition Examination Survey, 1988–1994, NHANES III Examination Data File [CDROM]. Hyattsville, Maryland: U.S. Department of Health and Human Services, Centers for Disease Control and Prevention. (Public use data file documentation No. 76300).
CDC [2017]. National Center for Health Statistics. National Health and Nutrition Examination Survey Data. Hyattsville, MD: U.S. Department of Health and Human Services, Centers for Disease Control and Prevention, [2007-2012] [https://wwwn.cdc.gov/nchs/nhanes/default.aspx].Date accessed: February 2019.
CFR. Code of Federal Regulations. Washington, DC: U.S. Government Printing Office, Office of the Federal Register.
Cullinan P [2012]. Occupation and chronic obstructive pulmonary disease (COPD). Br Med Bull 104:143-161.

Page 128 Health Hazard Evaluation Report 2012-0055-3337
DeSantis TZ, Hugenholtz P, Larsen N, Rojas M, Brodie EL, Keller K, Huber T, Dalevi D, Hu P, Andersen GL [2006]. Greengenes, a chimera-checked 16S rRNA gene database and workbench compatible with ARB. Appl Environ Microbiol 72(7):5069-5072.
Dutch Expert Committee on Occupational Safety (DECOS) [2010]. Endotoxins: health-based recommended occupational exposure limit. The Hague: Health Council of the Netherlands, Dutch Expert Committee on Occupational Safety. publication no. 2010/04OSH. [https://www.healthcouncil.nl/documents/advisory-reports/2010/07/15/endotoxins-health-based-recommended-occupational-exposure-limit]. Date accessed: February 2019.
Dilger S, Fluir A, Sonntag HG [2005]. Bacterial contamination of preserved and non-preserved metalworking fluids. Int J Hyg Environ Health 208(6):467-476.
Duchaine C, Yvon C, Gilbert Y, Veillette M, Lavoie J, Mériaux A, Touzel C, Sasseville D, Poulin Y [2012]. Workers exposed to metalworking fluids (MWF) — Evaluation of bioaerosol exposure and effects on respiratory and skin health. Montréal, Québec: Robert-Sauvé en santé et en sécurité du travail (IRSST), Report R-745 (English version) [http://www.irsst.qc.ca/media/documents/PubIRSST/R-745.pdf]. Date accessed: February 2019.
Eden PA, Schmidt TM, Blakemore RP, Pace NR [1991]. Phylogenetic analysis of Aquaspirillum magnetotacticum using polymerase chain reaction-amplified 16S rRNA-specific DNA. Int J Sys Bacteriol 41(2):324-325.
Eisner MD, Anthonisen N, Coultas D, Kuenzli N, Perez-Padilla R, Postma D, Romieu I, Silverman ED, Balms JR, Environmental and Occupational Health Assembly Committee on Nonsmoking COPD [2010]. An official American Thoracic Society public policy statement: novel risk factors and the global burden of chronic obstructive pulmonary disease. Am J Respir Crit Care Med 182;693-718.
Eschenbacher WL, Kreiss K, Loucheed MD, Pransky GS, Day B, Castellna RM [1999]. Nylon flock-associated interstitial lung disease. Am J Respir Crit Care Med 159(6):2003-2008.
Ferris BG [1978]. Epidemiology standardization project (American Thoracic Society). Am Rev Respir Dis 118(6 Pt 2):1–120.
Grassi M, Rezzani C, Biino G, Marinoni A [2003]. Asthma-like symptoms assessment through ECRHS screening questionnaire scoring. J Clin Epidemiol 56(3):238–247.
Hankinson JL, Odencrantz JR, Fedan KB [1999]. Spirometric reference values from a sample of the general U.S. population. Am J Respir Crit Care Med 159(1):179–187.

Page 129Health Hazard Evaluation Report 2012-0055-3337
Han XY, Pham AS, Nguyen KU, Smythe WR, Ordonez NG, Jacobson KL, Tarrand JJ [2001].Pulmonary granuloma caused by Pseudomonas andersonii sp nov. Am J Clin Pathol 116(3):347-353.
Health and Safety Executive (HSE) [2006]. Bacterial contamination. [http://www.hse.gov.uk/metalworking/bacterial.htm]. Date accessed: February 2019.
Hewett P, Ganser GH [2007]. A comparison of several methods for analyzing censored data. Ann Occup Hyg.; 51(7):611-32.
Jaakkola MS, Suuronen K, Luukkonen R, Jarvela M, Tuomi T, Alanko K, Makela EA, Jolanki R [2009]. Respiratory symptoms and conditions related to occupational exposures in machine shops. Scand J Work Environ Health 35(1):64-73.
Kern DG, Kuhn C 3rd, Ely EW, Pransky GS, Mello CJ, Fraire AE, Müller J [2000]. Flock worker’s lung: broadening the spectrum of clinicopathology, narrowing the spectrum of suspected etiologies. Chest 117(1):251-259.
Khan IUH, Yadav JS [2004]. Real-time PCR assays for genus-specific detection and quantification of culturable and non-culturable mycobacteria and pseudomonads in metalworking fluids. Molecular and Cellular Probes 18:67-73.
King MS, Eisenberg R, Newman JH, Tolle JJ, Harrell FE Jr, Nian H, Ninan M, Lambright ES, Sheller JR, Johnson JE, Miller RF [2011]. Constrictive bronchiolitis in soldiers returning from Iraq and Afghanistan. N Engl J Med 365(3):222–230.
Kreiss K, Cox-Ganser J [1997]. Metalworking fluid-associated hypersensitivity pneumonitis: a workshop summary. Am J Ind Med 32(4):423-432.
Kreiss K [2013]. Occupational causes of constrictive bronchiolitis. Curr Opin Allergy Clin Immunol 13(2):167-172.
Kuenzi P, Rufenact A, Di MaiutaN, Weber P [2014]. Microbiology in bio-concept metalworking. Abstract in Proceedings of the Society ofTribologists and Lubrication Engineers 2014 Annual Meeting and Exhibition. [http://www.stle.org/Shared_Content/Extended_Abstracts/EA_AM2014/Metalworking_Fluids/Microbiology%20in%20Bio-Concept%20Metalworking%20Fluids.aspx]. Date accessed: February 2019.
LeBouf RF, Stefaniak AB, Virji MA [2012]. Validation of evacuated canisters for sampling volatile organic compounds in healthcare settings. J Environ Monit 14(3):977–983.
Leslie KO, Wick MR [2017]. Practical pulmonary pathology: a diagnostic approach, 3rd Ed. New York: Elsevier.

Page 130 Health Hazard Evaluation Report 2012-0055-3337
Leung CC, Yu IT, Chen W [2012]. Silicosis. Lancet 379(9830):2008-2018.
Lillienberg L, Andersson EM, Järvholm B, Torén K [2010]. Respiratory symptoms and exposure response relations in workers exposed to metalworking fluid aerosols. Ann Occup Hyg 54(4):403-411.
Lozupone C, Lladser ME, Knights D, Stombaugh J, Knight R [2011]. UniFrac: an effectivedistance metric for microbial community comparison. ISME J 5(2):169-172.
Lubin JH, Colt JS, Camann D, Davis S, Cerhan JR, Severson RK, et al [2004]. Epidemiologic evaluation of measurement data in the presence of detection limits. Environ Health Perspect 112:1691-6.
Lytras T, Kogevinas M, Kromhout H, Carsin AE, Antó JM, Bentouhami H, Weyler J, Heinrich J, Nowak D, Urrutia I, Martinez-Moratalla J, Gullón JA, Pereira-Vega A, Raherison-Semjen C, Pin I, Demoly P, Leynaert B, Villani S, Gislason T, Svanes C, Holm M, Forsberg B, Norbäck D, Mehta AJ, Probst-Hensch N, Benke G, Jogi R, Torén K, Sigsgaard T, Schlünssen V, Olivieri M, Blanc PD, Vermeulen R, Garcia-Aymerich J, Jarvis D, Zock JP [2018]. Occupational exposures and 20-year incidence of COPD: the European Community Respiratory Health Survey. Thorax 73(11):1008-1015.
Miller MR, Hankinson J, Brusasco V, Burgos F, Casaburi R, Coates A, Crapo R, Enright P, van der Grinten CP, Gustafsson P, Jensen R, Johnson DC, MacIntyre N, McKay R, Navajas D, Pedersen OF, Pellegrino R, Viegi G, Wanger J; ATS/ERS Task Force [2005]. Standardisation of spirometry. Eur Respir J 26(2):319–338.
Milton DK, Feldman HA, Neuberg DS, Bruckner RJ, Greaves IA [1992]. Environmental endotoxin measurement: The kinetic Limulus assay with resistant-parallel-line estimation. Environmental Research 57:212-230.
Milton DK, Johnson DK, Park JH [1997]. Environmental endotoxin measurement: Interference and sources of variation in the Limulus assay of house dust. Am Ind Hyg Assoc J. 58(12):861-867.
Mizutani RF, Terra-Filho M, Lima E, Freitas CS, Chate RC, Kairalla RA, Carvalho-Oliveira R, Santos UP [2016]. Hard metal lung disease: a case series. J Bras Pneumol 42(6):447-452.
Mulhausen JR, Damiano J. [1998]. A strategy for assessing and managing occupational exposures. Fairfax: American Industrial Hygiene Association Press.
National Institute for Occupational Safety and Health (NIOSH) [1998]. Criteria for a recommended standard: Occupational exposure to metalworking fluids. Cincinnati, OH: U.S. Department of Health and Human Services, Centers for Disease Control and Prevention, National Institute for Occupational Safety and Health, DHHS (NIOSH) Publication No. 98-102.

Page 131Health Hazard Evaluation Report 2012-0055-3337
NIOSH [2003]. In: Schlecht P, O’Connor P, eds. Manual of Analytical Methods (NMAM), 4th ed., Third Supplement. Cincinnati, OH: U.S. Department of Health and Human Services, DHHS (NIOSH) Publication No. 2003-154 [http://www.cdc.gov/niosh/docs/2003-154/method-i.html]. Date accessed: February 2019.
NIOSH [2011]. OSHA - NIOSH Info Sheet: Maximize your spirometry screening and surveillance resources. Morgantown, WV: U.S. Department of Health and Human Services, Centers for Disease Control and Prevention, DHHS (NIOSH) Publication No. 2011-133 [http://www.cdc.gov/niosh/docs/2011-133/]. Date accessed: February 2019.
NIOSH [2012]. Spirometry quality assurance: Common errors and their impact on test results. Morgantown, OH: U.S. Department of Health and Human Services, Centers for Disease Control and Prevention, National Institute for Occupational Safety and Health. DHHS (NIOSH) Publication No. 2012-116 [http://www.cdc.gov/niosh/docs/2012-116/]. Date accessed: February 2019.
NIOSH [2016]. NIOSH pocket guide to chemical hazards. Cincinnati, OH: U.S. Department of Health and Human Services, Centers for Disease Control and Prevention, National Institute for Occupational Safety and Health [https://www.cdc.gov/niosh/npg/default.html] Date accessed: February 2019.
NIOSH [2015]. Evaluation of an unpleasant odor at an aircraft ejection seat manufacturer. By Broadwater K, de Perio MA, Brueck SE, Burton NC, Lemons AR, Green BJ. Cincinnati, OH: U.S. Department of Health and Human Services, Centers for Disease Control and Prevention, National Institute for Occupational Safety and Health, NIOSH Health Hazard Evaluation Report 2014-0050-3234.
NIOSH [2016]. Evaluation of metalworking fluid exposure and dermatitis among rifle barrel manufacturing employees. By Tapp LC, Broadwater K, Mueller CA. Cincinnati, OH: U.S. Department of Health and Human Services, Centers for Disease Control and Prevention, National Institute for Occupational Safety and Health, NIOSH Health Hazard Evaluation Report 2014-0170-3263.
NIOSH [2016]. Investigation of dermal and respiratory exposures to metalworking fluids at an automotive parts manufacturer. By Harney JM, Tapp L. Cincinnati, OH: U.S. Department of Health and Human Services, Centers for Disease Control and Prevention, National Institute for Occupational Safety and Health, NIOSH Health Hazard Evaluation Report 2013-0075-3264.
NIOSH [2017]. NIOSH manual of analytical methods (NMAM®). 5th ed. O’Connor PF, Ashley K, eds. Cincinnati, OH: U.S. Department of Health and Human Services, Centers for Disease Control and Prevention, National Institute for Occupational Safety and Health, DHHS (NIOSH) Publication No. 2014-151 [http://www.cdc.gov/niosh/nmam/]. Date accessed: February 2019.

Page 132 Health Hazard Evaluation Report 2012-0055-3337
Occupational Safety and Health Administration [2013]. Spirometry testing in occupational health programs: best practices for healthcare professionals. [http://www.osha.gov/Publications/OSHA3637.pdf]. Date accessed: February 2019.
Oppenheimer BW, Goldring RM, Herberg ME, Hofer IS, Reyfman PA, Liautaud S, Rom WN, Reibman J, Berger KI [2007]. Distal airway function in symptomatic subjects with normal spirometry following World Trade Center dust exposure. Chest 132(4):1275–1282.
Park DU, Jin KW, Koh DH, Kim BK, Kim KS, Park DY [2008]. Association between use of synthetic metalworking fluid and risk of developing rhinitis-related symptoms in an automotive ring manufacturing plant. J Occup Health 50(2):212-220.
Pellegrino R, Viegi G, Brusasco V, Crapo RO, Burgos F, Casaburi R, Coates A, van der Grinten CP, Gustafsson P, Hankinson J, Jensen R, Johnson DC, MacIntyre N, McKay R, Miller MR, Pitkäranta M, Meklin T, Hyvärinen A, Paulin L, Auvinen, P, Nevalainen, Rintala H [2008]. Analysis of fungal flora in indoor dust by ribosomal DNA sequence analysis, quantitative PCR, and culture. Appl Environ Microbiol 74(1):233-244.
Poletti V, Casoni G, Chilosi M, Zompatori M. Diffuse panbronchiolitis [2006]. Eur Resp J 28(4):862-871.
Redlich CA, Tarlo SM, Hankinson JL, Townsend MC, Eschenbacher WL, Von Essen SG, Sigsgaard T, Weissman DN, on behalf of the American Thoracic Society Committee on Spirometry in the Occupational Setting [2014]. Official American Thoracic Society technical standards: spirometry in the occupational setting. Am J Respir Crit Care Med 189(8):983-993.
Reed CE, Milton DK [2001]. Endotoxin-stimulated innate immunity: a contributing factor for asthma. J Allergy Clin Immunol 108(2):157-166.
Relman DA, Schmidt TM, MacDermott RP, Falkow S [1992]. Identification of the uncultured Bacillus of Whipple’s disease. New Engl J Med 327(5):293-301.
Rosenman KD [2009]. Asthma, hypersensitivity pneumonitis and other respiratory diseases caused by metalworking fluids. Curr Opin Allergy Clin Immunol 9:97-102.
Sambrook, J, Russell, DW [2001]. Molecular Cloning: A Laboratory Manual. 3rd Ed. Cold Spring Harbor Laboratory Press, Cold Spring Harbor, New York.
Schloss PD, Westcott SL, Ryabin T, Hall JR, Harmann M, Hollister EB, Lesniewski RA, Oakley BB, Parks DH, Robinson CJ, Sahl JW, Stres B, Thallinger GG, Van Horn DJ, Weber CF [2009]. Introducing mother: open-source, platform-independent, community-supported software for describing and comparing microbial communities. Applied and Environmental Microbiology 75:7537-7541.

Page 133Health Hazard Evaluation Report 2012-0055-3337
Segata N, Izard J, Waldron L, Gevers D, Miropolsky L, Garrett WS, Huttenhower C [2011].Metagenomic biomarker discovery and explanation. Genome Biol 12(6):R60.
Simpson AT, Stear M, Groves JA, Piney M, Bradley SD, Stagg S, Crook B [2003]. Occupational exposures to metalworking fluid mist and sump fluid contaminants. Ann Occup Hyg 47(1):17-30.
Simmon KE, Fang DC, Tesic V, Khot PD, Giangeruso E, Bolesta ES, Wagner-Reiss KM, Fisher MA, Petti CA, Han XY, She RC [2011]. Isolation and characterization of “Pseudomonas andersonii” from four cases of pulmonary granulomas and emended species description. J Clin Microbiol 49(4):1518-1523.
Smith HJ, Reinhold P, Goldman MD [2005]. Forced oscillation technique and impulse oscillometry. In:Gosselink R, Stam H, eds. European Respiratory Monograph 31: Lung Function Testing. Vol. 10. Wakefield, UK: European Respiratory Society Journals, pp. 72–105.
Suuronen K, Henriks-Eckerman ML, Riala R, Tuomi T [2008]. Respiratory exposure to components of water-miscible metalworking fluids. Ann Occup Hyg 52:607-614.
Thorne PS, DeKoster JA, Subramanian P [1996]. Environmental assessment of aerosols, bioaerosols, and airborne endotoxin in a machining plant. Am Ind Hyg Assoc J 57:1163-1167.
Tomashefski JF [2008]. Dail and Hammar’s Pulmonary Pathology, 3rd ed. New York, NY: Springer Sciences, pp. 375−405.
Townsend MC, Occupational and Environmental Lung Disorder Committee [2005]. Evaluating pulmonary function change over time in the occupational setting. J Occup Environ Med 47:1307-1316.
Townsend MC, Occupational and Environmental Lung Disorder Committee [2011]. Spirometry in the occupational health setting — 2011 update. J Occup Environ Med 53(5):569-584.
Veillette M, Thorne PS, Gordon T, Duchaine C [2004]. Six month tracking of microbial growth in a metalworking fluid after system cleaning and recharging. Ann Occup Hyg 48(6):541-546.
Visscher DW, Myers JL [2006]. Bronchiolitis: the pathologist’s perspective. Proc Am Thorac Soc 3(1):41-47.
Vogel J, Smidt U [1994] Impulse oscillometry. analysis of lung mechanics in general practice and clinic, epidemiological and experimental research.1st ed. Frankfurt: PMI-Verlagsgruppe.

Page 134 Health Hazard Evaluation Report 2012-0055-3337
Wang ML, Avashia BH, Petsonk EL [2006]. Interpreting periodic lung function tests inindividuals: the relationship between 1- to 5-year and long-term FEV1 changes. Chest130(2):493-499.
Weiland DA, Lynch DA, Jensen SP, Newell JD, Miller DE, Crausman RS, Kuhn C 3rd, Kern DG [2003]. Radiology 227(1):222-31.
White TJ, Bruns TD, Lee S, Taylor JW [1990]. PCR protocols: a guide to methods and applications.. In Innis MA, Gelfand DH, Sninsky JJ, White TJ, eds Academic Press Inc., New York, NY, Editon ed, pp. 315-324.
Zacharisen MC, Kadambi AR, Schlueter DP, Kurup VP, Shack JB, Fox JL, Anderson HA, Fink JN [1998]. The spectrum of respiratory disease associated with exposure to metalworking fluids. J Occup Environ Med 40:640-647.

Page 135Health Hazard Evaluation Report 2012-0055-3337
This page left intentionally blank

Page 136 Health Hazard Evaluation Report 2012-0055-3337
Keywords: NAICS 333291(paper industry machinery manufacturing), Wisconsin, chemicals, endotoxin, metalworking fluid (MWF), respiratory, B-cell bronchiolitis-alveolar ductitis, emphysema, microbiome

Page 137Health Hazard Evaluation Report 2012-0055-3337
The Health Hazard Evaluation Program investigates possible health hazards in the workplace under the authority of the Occupational Safety and Health Act of 1970 (29 U.S.C. § 669(a)(6)). The Health Hazard Evaluation Program also provides, upon request, technical assistance to federal, state, and local agencies to invest igate occupational health hazards and to prevent occupational disease or injury. Regulations guiding the Program can be found in Title 42, Code of Federal Regulations, Part 85; Requests for Health Hazard Evaluations (42 CPR Part 85).
Disclaimer The recommendations in this report are made on the basis of the findings at the workplace evaluated and may not be applicable to other workplaces.
Mention of any company or product in this report does not constitute endorsement by the National Institute for Occupational Safety and Health (NIOSH).
Citations to Web sites external to NIOSH do not constitute NIOSH endorsement of the sponsoring organizations or their programs or products. NIOSH is not responsible for the content of these Web sites. All Web addresses referenced in this document were accessible as of the publication date.
AcknowledgmentsDesktop Publisher: Tia McClellandData Analysis Support: Nicole Edwards, Kathleen Fedan, Brian Tift, Abbas Virji NIOSH Laboratory Assistance: Dru Burns, Ryan Lebouf, Ju-Hyeong Park, Yeonmi Park Sit Visit Team Members: Penelope Baughman, Mike Beaty, Randy Boylstein, Kristin Cummings, Ethan Fechter-Leggett, Nicole Edwards, Kathy Fedan, Diana Freeland, Cara Halldin, Michael Humann, Tia McClelland, Steve Martin, Randall Nett, Chris Piacitelli, Michele Tennant, Marcia Stanton, Brian Tift, Suzanne Tomasi, Sandy White
Availability of ReportCopies of this report have been sent to the employer, employees, and union at the facility. The state and local health department and the Occupational Safety and Health Administration Regional Office have also received a copy. This report is not copyrighted and may be freely reproduced.
This report is available at http://www.cdc.gov/niosh/hhe/reports/pdfs/2012-0055-3337.pdf.
All other HHE Reports may be found at http://www2a.cdc.gov/hhe/search.asp
Recommended citation for this report:NIOSH [2019]. Health hazard evaluation report: Evaluation of exposures and respiratory health concerns in a paper converting equipment manufacturing facility. By Stanton ML, Nett RJ. Morgantown, WV: U.S. Department of Health and Human Services, Centers for Disease Control and Prevention, National Institute for Occupational Safety and Health, NIOSH HHE Report No. 2012-0055-3337.

To receive documents or other information aboutoccupational safety and health topics, contact NIOSH
Telephone: 1-800-CDC-INFO (1-800-232-4636)TTY: 1-888-232-6348email: [email protected] visit the NIOSH website at http://www.cdc.gov/niosh
Delivering on the Nation’s promise:Safety and health at work for all people through research and prevention