HFIN Economic Impacts of Fiscal Options - draft conclusions (ISER 2.25.2016)
57
1 Economic Impacts of Alaska Fiscal Options Overview of Draft Conclusions Gunnar Knapp Director and Professor of Economics Institute of Social and Economic Research University of Alaska Anchorage [email protected] February 25, 2016 ISER publications and presentations are solely the work of individual authors and should be attributed to them, not to ISER, the University of Alaska Anchorage, or the research sponsors.
-
Upload
brad-keithley -
Category
News & Politics
-
view
540 -
download
1
Transcript of HFIN Economic Impacts of Fiscal Options - draft conclusions (ISER 2.25.2016)

1
Economic Impacts of Alaska Fiscal Options
Overview of Draft Conclusions
Gunnar KnappDirector and Professor of Economics
Institute of Social and Economic ResearchUniversity of Alaska [email protected]
February 25, 2016
ISER publications and presentations are solely the work of individual authors and should be
attributed to them, not to ISER, the University of Alaska Anchorage, or the research sponsors.

Outline
• Summary
• Details
– Study background
– Relative contributions of non-residents & the federal government
– Relative impacts of fiscal options on different income groups
– Relative impacts of fiscal options on the Alaska economy
– Total impacts of deficit reduction on the Alaska economy
– Other impacts
2

Summary . . .
• Studied economic impacts of ten fiscal options:
– Spending cuts (four kinds)
– Taxes (four kinds)
– Dividend cuts
– Saving less
• Not advocating for or against any option
3

4
Option Direct economic impacts
Spending cut: workers Reduce government jobs & pay
Spending cut: broad-basedReduce government jobs & pay
Reduce other government purchases
Spending cut: capital Reduce government capital spending
Spending cut: pay Reduce government employee pay
Income tax: progressive
Income tax: flat rate
Sales tax: more exclusions
Sales tax: fewer exclusions
Dividend cutReduce Alaskans' income
Partly offset by lower federal tax
Saving less No short-term impacts
Fiscal Options We Studed
Reduce Alaskans' disposable income
Partly paid by non-residents
Partly offset by federal tax deductions
Summary . . .

5
Option Direct economic impacts
Spending cut: workers Government workers
Spending cut: broad-basedGovernment workers
Government contractors & their workers
Spending cut: capital Construction industry & their workers
Spending cut: pay Government workers
Income tax: progressive
Income tax: flat rate
Sales tax: more exclusions
Sales tax: fewer exclusions
Dividend cut Lower income Alaskans
Saving less Future Alaskans
Who is most affected?
Higher income Alaskans
Higher & medium income Alaskans
Summary . . .

6
Income
($ millions) FTE jobs
Spending cut: workers 138 1677
Spending cut: broad-based 115 1260
Spending cut: capital 64 931
Spending cut: pay 143 727
Income tax: progressive 138 776
Income tax: flat rate 138 796
Sales tax: more exclusions 132 771
Sales tax: fewer exclusions 135 793
Dividend cut 150 898
Saving less 0 0
Short-Run Economic Impacts per $100 Million of Deficit Reduction
Summary . . .

Summary . . .
• Saving less has no short-term impacts
• All other options affect the economy:
– Spending cuts
– Taxes
– Dividend cuts
• They vary in:
– Who is most affected
– Relative magnitude of impacts
7

Summary . . .
How fast should we reduce the deficit?
• We will have to greatly reduce the deficit soon
• We can’t avoid economic impacts
• The smoothest transition is a significant start this year
• Not making major progress this year would have a big impact
– Further credit rating downgrades
– Loss of business confidence
– Reduced private investment
• Fully closing the deficit this year would have a big impact
– Economy is already-weakened
• Neither extreme is best
– Doing nothing this year
– Doing everything this year
8

Study background
9

Study status . . .
• Presentation summarizes draft results
• Draft full report available soon
• Further analysis planned over next month, to address
– Comments
– Questions
• Final report in March
10

What we studied
• Relative contributions to fiscal options of non-residents & the federal
government
• Relative impacts of fiscal options on different income groups
• Relative impacts of fiscal options on the Alaska economy
• Total impacts of deficit reduction on the Alaska economy
• Other impacts:
– Many, varied and important
– Described but not analyzed
11

What we didn’t study
Options with complex effects which are difficult to predict,
including potential changes to:
• oil taxes
• oil tax credits
• cuts to specific programs
• how the state delivers services
– K12 education, University of Alaska, Medicaid, etc.
• “re-plumbing” of state finances (SB114, SB128, etc.)
12

Relative contributions
of non-residents &
the federal government
13

Non-residents would pay about 7-11% of sales taxes
and about 7% of income taxes
14

The federal government would help “pay” for taxes and dividend cuts—
because our federal income taxes would be lower.
Higher-income households who pay higher tax rates would benefit most.

Relative impacts of
fiscal options on
different income groups
16

We estimated effects of taxes and dividend cuts for 10 groups of Alaska households,
grouped by their per-capita income in 2013, from the lowest 10 percent to the highest 10 percent
17

The three lowest-income groups had average household incomes of less than $45,000.
The highest-income group had an average household income of more than $200,000.

The share of the highest income group in total income (21%)
was almost as high as the shares of the bottom five groups combined (22%).

How options affect different groups:
income reduction per person

Dividend cuts cost lower-income households more
--because less of their dividends go to federal taxes.

How options affect different groups:
percentage income reduction per person
22

Combinations of options would have intermediate effects
on households of different income levels.
23

Combinations of options would have intermediate effects
on households of different income levels.
24

Income distribution varies for different regions of Alaska

Relative impacts of
fiscal options on the
Alaska economy
26

Saving less (and using the money to fund government)
would have no short-run economic impacts on the Alaska economy.
• Options for saving less include:
– Reducing inflation-proofing transfers to PF principal
– Adding less to the PF earnings reserve
• Saving less would not:
– take any money out of the economy
– have any short-run impacts on jobs or income
• But it would reduce:
– our future investment earnings
– how much savings we leave for future Alaskans
27

From 2010 to 2015, we saved an average of $1.4 billion annually
of Permanent Fund realized earnings
28

29
All our other fiscal options—
cutting spending, cutting dividends, and increasing revenues—
would have significant short-run economic impacts.
They would all take significant amounts of money out of the economy.
But they would do so in different ways,
with different impacts on different Alaskans
and different relative impacts on public and private employment.

How we compared relative impacts of other fiscal options
• Standard “economic impact analysis” using IMPLAN model
• Impacts per $100 million of deficit reduction
30

Calculating economic impacts:
direct income impacts
TaxesSpending cut Dividend cut
Lower payments
to businesses
Lower business
worker incomes
Lower state
worker incomes
DIRECT INCOME IMPACTS
Effective
tax rates
Taxes paid by
non-residents
Tax payments
by Alaskans
MAJOR
ASSUMPTIONS

32
Option
Direct
earned
income
($ millions)
Direct
other
income
($ millions)
Why the direct income impact is
less than $100 million
Spending cut: workers 95 Not all of the cut is to worker pay
Spending cut: broad-based 67 "
Spending cut: capital 42 "
Spending cut: pay 100
Income tax: progressive 93 Non-residents pay part of the tax
Income tax: flat rate 93 "
Sales tax: more exclusions 89 "
Sales tax: fewer exclusions 90 "
Dividend cut 99 Some dividend recipients leave
Saving less 0
Short-Run Economic Impacts per $100 Million of Deficit Reduction
Calculating economic impacts:
direct income impacts

Calculating economic impacts:
multiplier income impacts
TaxesSpending cut Dividend cut
Changes in
business spending
Lower payments
to businesses
Changes in
household spending
Lower business
worker incomes
Lower state
worker incomes
DIRECT INCOME IMPACTS
Effective
tax rates
Taxes paid by
non-residents
Tax payments
by Alaskans
Federal
tax rates
Savings
rates
MULTIPLIER INCOME IMPACTS
IMPLAN
model
assumptions
MAJOR
ASSUMPTIONS

Direct
earned
Direct
other
Multi-
plier Total
Spending cut: workers 95 43 138
Spending cut: broad-based 67 48 115
Spending cut: capital 42 22 64
Spending cut: pay 100 43 143
Income tax: progressive 93 45 138
Income tax: flat rate 93 46 138
Sales tax: more exclusions 89 44 132
Sales tax: fewer exclusions 90 45 135
Dividend cut 99 51 150
Saving less 0
Short-Run Economic Impacts per $100 Million of Deficit Reduction
Option
Income Impacts
(millions of $ of income)
Calculating economic impacts:
multiplier income impacts
Pay cuts have a smaller multiplier impact than dividend cuts
because more of pay goes to federal taxes and savings

35
Direct
Multi-
plier Total
Spending cut: workers 962 715 1677
Spending cut: broad-based 504 754 1260
Spending cut: capital 506 425 931
Spending cut: pay 727 727
Income tax: progressive 776 776
Income tax: flat rate 796 796
Sales tax: more exclusions 771 771
Sales tax: fewer exclusions 793 793
Dividend cut 898 898
Saving less 0
Short-Run Economic Impacts
per $100 Million of Deficit Reduction
Option
Job Impacts
(FTE jobs)
Job impacts are
biggest for cutting
government workers
because they include
direct losses of
government jobs
Taxes and
dividend cuts
have only multiplier
impacts on jobs.
Calculating economic impacts:
job impacts

Direct
earned
Direct
other
Multi-
plier Total Direct
Multi-
plier Total
Spending cut: workers 95 43 138 962 715 1677
Spending cut: broad-based 67 48 115 504 754 1260
Spending cut: capital 42 22 64 506 425 931
Spending cut: pay 100 43 143 727 727
Income tax: progressive 93 45 138 776 776
Income tax: flat rate 93 46 138 796 796
Sales tax: more exclusions 89 44 132 771 771
Sales tax: fewer exclusions 90 45 135 793 793
Dividend cut 99 51 150 898 898
Saving less 0 0
Short-Run Economic Impacts per $100 Million of Deficit Reduction
Option
Income Impacts
(millions of $ of income)
Job Impacts
(FTE jobs)

The economic impacts of reducing the deficit will depend on
what combination of options we use.
Income
($ millions) FTE jobs
% of deficit
reduction
Income
($ millions)
FTE
jobs
Spending cut: workers 138 1677
Spending cut: broad-based 115 1260 25% 29 315
Spending cut: capital 64 931
Spending cut: pay 143 727
Income tax: progressive 138 776 25% 34 194
Income tax: flat rate 138 796
Sales tax: more exclusions 132 771
Sales tax: fewer exclusions 135 793
Dividend cut 150 898 25% 37 225
Saving less 0 0 25% 0 0
Combination of options 0 0 101 734
Total impacts of
each option
Impacts of a
combination of options
Short-Run Economic Impacts per $100 Million of Deficit Reduction

Economic impacts of spending cuts depend on what is cut
What is cut affects:
• Direct impacts on workers’ incomes and jobs
• Government workers
• Contractor workers
• Impacts on contractor sales and spending
• Impacts of reductions in state services
– Instructure development and maintenance
– Resource management (fish catches, mine permitting)
– Transportation (Marine Highway service, road plowing, etc.)
– Quality of social services (schools, health care, parks, etc.)
38
You can’t generalize about economic impacts of spending cuts.

Regional economic impacts of spending cuts would depend on how
important government jobs and income are in the regional economy.
Some regions are much more dependent than others.
39

Total impacts
of deficit reduction
on the Alaska economy
40

41
How fast should we reduce the deficit?
What can we do to reduce the economic impacts?

Regardless of what we do,
we will experience impacts of spending cuts we’ve already made
• Impacts of past capital budget cuts on construction industry
– Delayed because capital projects take several years
– Actual capital spending will decline as money from past large
capital budgets runs out
42

We can’t avoid significant further impacts.
We have lost billions of dollars of oil revenue
which used to pay for most of state government.
We will have to adjust to having much lower oil revenues.
Adjusting will significantly impact Alaska’s economy
—regardless of how we do it.

Our options for reducing the deficit are some combination of:
Spending cuts
New taxes on households or businesses
Dividend cuts
Saving less

Potential short-run impacts of reducing the deficit by $1, $2 and $3 billion
45
Option
Spending cut: workers 100%
Spending cut: broad-based 100% 50% 50% 33% 25%
Income tax: progressive 50% 33% 25%
Dividend cut 50% 33% 25%
Saving less 25%
Total job impacts of
reducing deficit by:
$1.0 billion 17,000 13,000 10,000 11,000 10,000 7,000
$2.0 billion 34,000 25,000 20,000 22,000 20,000 15,000
$3.0 billion 50,000 38,000 31,000 32,000 29,000 22,000
Total income impacts ($ millions)
of reducing deficit by:
$1.0 billion 1,400 1,200 1,300 1,300 1,300 1,000
$2.0 billion 2,800 2,300 2,500 2,700 2,700 2,000
$3.0 billion 4,100 3,500 3,800 4,000 4,000 3,000
Potential Total Short-Run Economic Impacts of Deficit Reduction
Share of option in deficit reduction
In 2014, there were about 367,000 full and part-time jobs in Alaska.
Total income was about $40 billion. Total wage income was about $27 billion.

46
We will have a smoother economic adjustment to lower oil revenues
if we make significant progress this year.

Negative economic consequences of
not making significant progress this year
• Further draining of reserve funds
– Lower future investment earnings
– Future Alaskans are paying for our deficits
• Business and consumer uncertainty, resulting in:
– Reduced business and consumer confidence
– Reduced investment
• Downgrading of Alaska’s credit rating
• Delay in when we could receive new tax revenues
– Time lag from when taxes are adopted to when they collect revenue
47

Running deficits rather than adjusting to lower revenues
can reduce economic impacts
if the reasons for lower revenues are temporary.
If the reasons for the deficit aren’t temporary,
running deficits only delays economic impacts—
and has other negative consequences.
Government can temporarily support an economy by running deficits.
Government can’t permanently support an economy by running deficits.
48

Other impacts
of fiscal options
49

All of our fiscal options have many other potential impacts
beyond those that we studied
• Indirect
• Longer-term
• Harder to estimate
• Potentially much more important to Alaska’s future
50
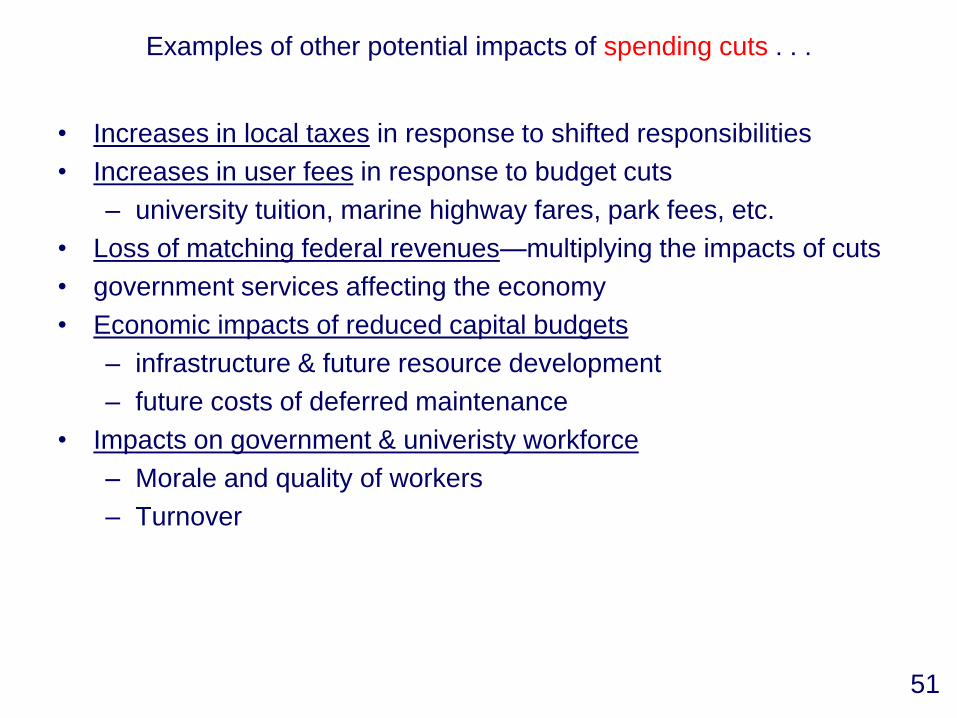
Examples of other potential impacts of spending cuts . . .
• Increases in local taxes in response to shifted responsibilities
• Increases in user fees in response to budget cuts
– university tuition, marine highway fares, park fees, etc.
• Loss of matching federal revenues—multiplying the impacts of cuts
• government services affecting the economy
• Economic impacts of reduced capital budgets
– infrastructure & future resource development
– future costs of deferred maintenance
• Impacts on government & univeristy workforce
– Morale and quality of workers
– Turnover
51

Examples of other potential impacts of spending cuts . . .
• Economic impacts of reduced services
– Reduced tourist travel on Marine Highway
– Reduced ADFG research on fisheries management leading to
more conservative management & lower catches
– Higher transportation costs and times due to reduced snow-
plowing and road maintenance
– labor markets
– Whether young Alaskans stay in Alaska to attend college
– Effects on “quality of life” and how hard it is to find and keep
good employees
– Migration from rural villages if schools are closed
– Higher potential future costs
• Of education if early childhood services are cut?
• Of crime and corrections if education is cut?
• Of health care if primary health care services are cut?
• Of social service costs if people leave villages 52

Examples of other potential impacts of income taxes . . .
• Incentives for
– businesses to invest
– Individuals to invest
• Wage rates needed to attract workers
– Costs of fish processing labor
– Impacts on fish prices & fishermen
53

Examples of other potential impacts of sales taxes . . .
• Administrative costs
• Impacts on local government sales tax collections
• Higher impacts in higher-cost rural communities
• Impacts on visitor spending
54

Example of other potential impacts of dividend cuts . . .
• Wages people need to earn to live in Alaska
– Effects on wage rates
• Ability of Alaskans to
– Purchase gear needed for subsistence
– Accumulate wealth
• Incentives for people to move to or leave Alaska
– Particularly larger or poorer families
55

Examples of other potential impacts of fiscal choices . . .
• Effects on labor markets
• Effects on Alaska population
– Effects on costs of providing government services
• Effects on real estate markets
• Effects on the type of people who want to live in Alaska
• Effects on equity of Alaska income distribution
• Extent to which Alaskans have “skin in the game” and interest in
restraining state spending
• Extent to which Alaskans support preserving and growing the
Permanent Fund
56

57
Alaska’s fiscal choices will significantly affect
Alaska’s future economy and society.
We should think not only about their short-term economic impacts
but also about their longer-term economic and social impacts.