HFCL Limited B - NSE
28
B HFC L GROUP January 21, 2020 The BSE Ltd. HFCL Limited (formerly Himachal Futuristic Communications Ltd.) 8, Commercial Complex, Masjid Moth, Greater Kailash - II, New Delhi - 110048, India Tel : (+9111) 3088 2624, 3088 2626, Fax: (+9111) 3068 9013 Web : www.hfcl.com Email [email protected] 1 st Floor, New Trading Wing, Rotunda Building Phiroze Jeejeebhoy Towers, Dalal Street, Fort Mumbai- 400001 corp [email protected] The National Stock Exchange of India Ltd. Exchange Plaza, 5 th Floor, C - 1, Block G Sandra - Kurla Complex, Sandra (E) Mumbai - 400051 [email protected] Security Code No.: 500183 Security Code No.: HFCL RE: Disclosures under Regulation 30 of the Securities and Exchange Board of India (Listing Obligations and Disclosure Requirements) Regulations, 2015 ("SEBI Listing Regulations"). Subject: Earnings' Presentation. Dear Sir(s)/ Madam, This is further to our earlier intimation dated January 20, 2020. In terms of Regulation 30 read with Para A of Part A of Schedule III to the SEBI Listing Regulations, we hereby submit a copy of the Earnings' Presentation on, inter-a/ia, the Un-audited Financial Results of the Company for the 3 rd quarter and nine months ended December 31, 2019 of the Financial Year 2019-20, both on Standalone and Consolidated basis, to be discussed during the Earnings' Call scheduled to be held today, i.e. on January 21, 2020 at 04:00 p.m. It may be noted that the Board of Directors of the Company has, considered and approved the aforesaid Financial Results of the Company, in its meeting held on January 20, 2020. You are requested to take the above information on records and disseminate the same on your respective websites. Thanking you. Yours faithfully, For HFCL Limited (Formerly Himachal Futuristic Communications Limited) L (Manoj Baid) Vice-President (Corporate) & Company Secretary Encl: Earnings' Presentation. Regd. Office & Works: 8, Electronics Complex, Chambaghat, Solan-173 213 (H.P.) Tel.: (01792) 230644, 230645, 230647, Fax: (01792) 231902 Corporate Identity Number: L64200HP1987PLC007466
Transcript of HFCL Limited B - NSE
B HFCL GROUP
January 21, 2020
The BSE Ltd.
HFCL Limited (formerly Himachal Futuristic Communications Ltd.)
8, Commercial Complex, Masjid Moth, Greater Kailash - II, New Delhi - 110048, India Tel : (+9111) 3088 2624, 3088 2626, Fax: (+9111) 3068 9013 Web : www.hfcl.com Email
1st Floor, New Trading Wing, Rotunda Building Phiroze Jeejeebhoy Towers, Dalal Street, Fort Mumbai- 400001 [email protected]
The National Stock Exchange of India Ltd. Exchange Plaza, 5th Floor, C - 1, Block G Sandra - Kurla Complex, Sandra (E) Mumbai - 400051 [email protected]
Security Code No.: 500183 Security Code No.: HFCL
RE: Disclosures under Regulation 30 of the Securities and Exchange Board of India (Listing Obligations and Disclosure Requirements) Regulations, 2015 ("SEBI Listing Regulations").
Subject: Earnings' Presentation.
Dear Sir(s)/ Madam,
This is further to our earlier intimation dated January 20, 2020.
In terms of Regulation 30 read with Para A of Part A of Schedule III to the SEBI Listing Regulations, we hereby submit a copy of the Earnings' Presentation on, inter-a/ia, the Un-audited Financial Results of the Company for the 3rd quarter and nine months ended December 31, 2019 of the Financial Year 2019-20, both on Standalone and Consolidated basis, to be discussed during the Earnings' Call scheduled to be held today, i.e. on January 21, 2020 at 04:00 p.m.
It may be noted that the Board of Directors of the Company has, considered and approved the aforesaid Financial Results of the Company, in its meeting held on January 20, 2020.
You are requested to take the above information on records and disseminate the same on your respective websites.
Thanking you.
Yours faithfully, For HFCL Limited (Formerly Himachal Futuristic Communications Limited)
L (Manoj Baid) Vice-President (Corporate) & Company Secretary
Encl: Earnings' Presentation.
Regd. Office & Works: 8, Electronics Complex, Chambaghat, Solan-173 213 (H.P.) Tel.: (01792) 230644, 230645, 230647, Fax: (01792) 231902 Corporate Identity Number: L64200HP1987PLC007466

HFCL LIMITED
INVESTOR PRESENTATION
9M/Q3-FY2020
2
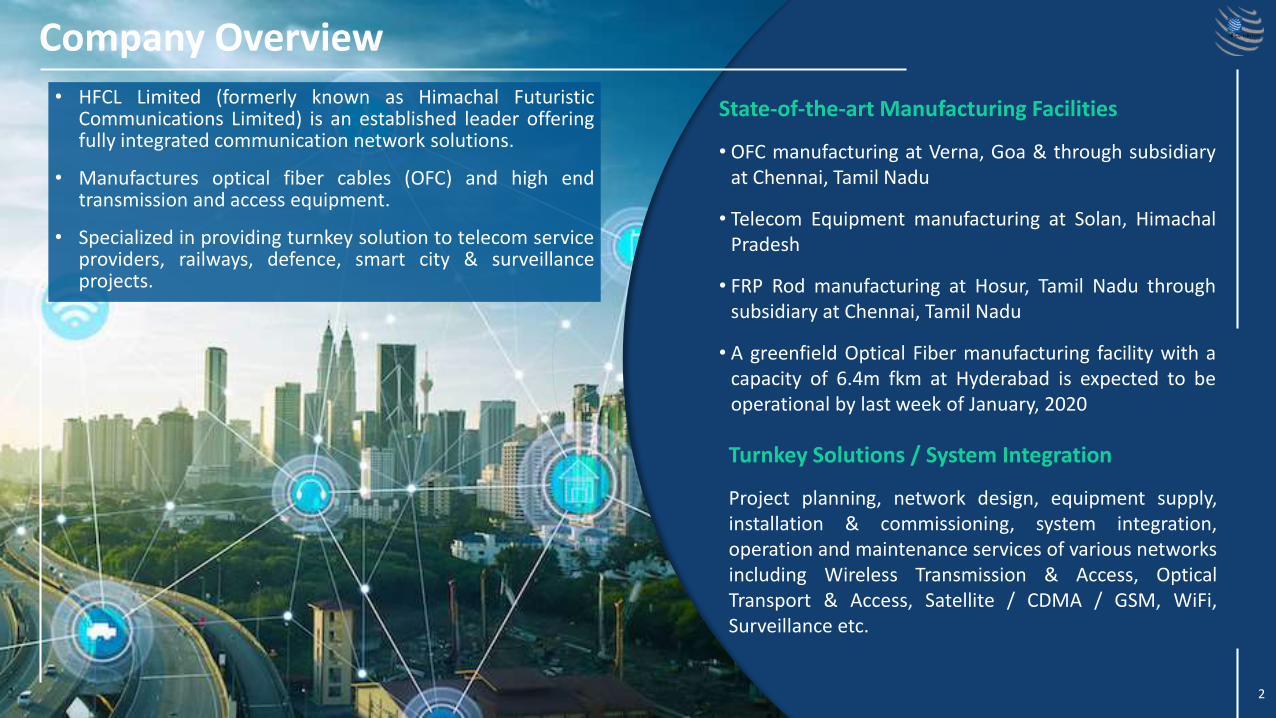
• HFCL Limited (formerly known as Himachal FuturisticCommunications Limited) is an established leader offeringfully integrated communication network solutions.
• Manufactures optical fiber cables (OFC) and high endtransmission and access equipment.
• Specialized in providing turnkey solution to telecom serviceproviders, railways, defence, smart city & surveillanceprojects.
2
State-of-the-art Manufacturing Facilities
• OFC manufacturing at Verna, Goa & through subsidiaryat Chennai, Tamil Nadu
• Telecom Equipment manufacturing at Solan, HimachalPradesh
• FRP Rod manufacturing at Hosur, Tamil Nadu throughsubsidiary at Chennai, Tamil Nadu
• A greenfield Optical Fiber manufacturing facility with acapacity of 6.4m fkm at Hyderabad is expected to beoperational by last week of January, 2020
Company Overview
Turnkey Solutions / System Integration
Project planning, network design, equipment supply,installation & commissioning, system integration,operation and maintenance services of various networksincluding Wireless Transmission & Access, OpticalTransport & Access, Satellite / CDMA / GSM, WiFi,Surveillance etc.
3
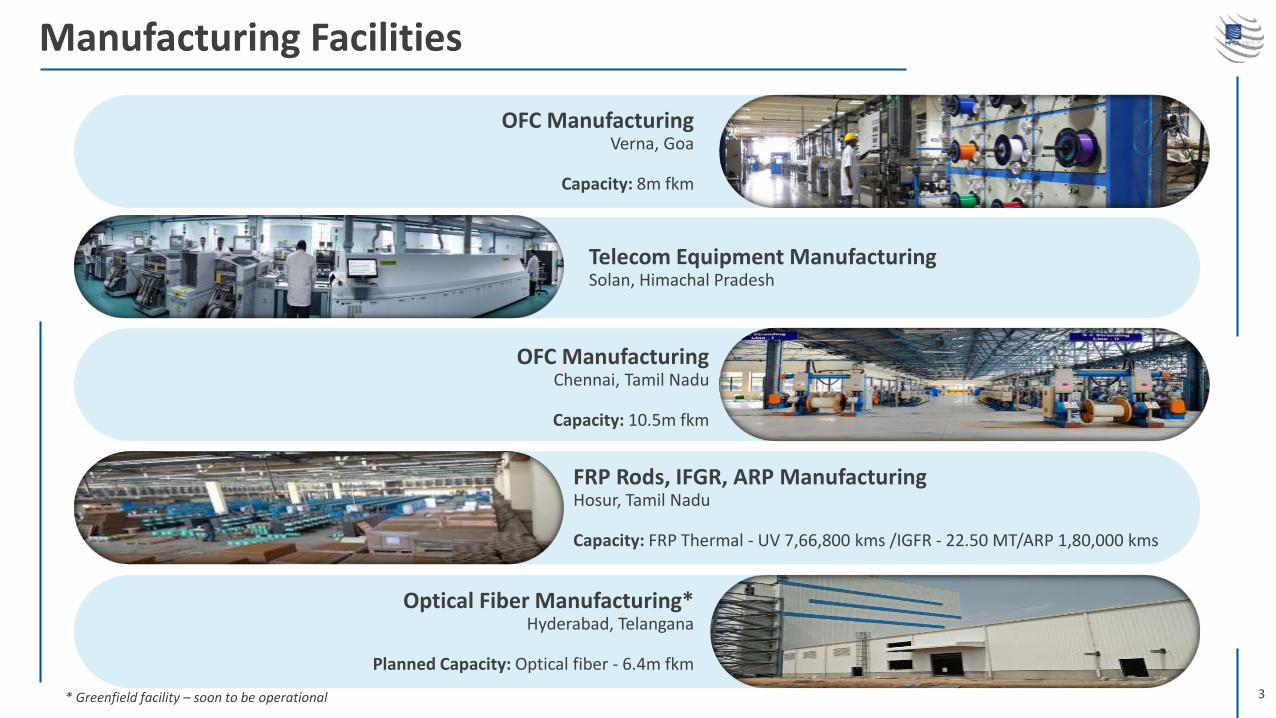
FRP Rods, IFGR, ARP Manufacturing Hosur, Tamil Nadu
Capacity: FRP Thermal - UV 7,66,800 kms /IGFR - 22.50 MT/ARP 1,80,000 kms
Telecom Equipment ManufacturingSolan, Himachal Pradesh
OFC ManufacturingVerna, Goa
Capacity: 8m fkm
OFC ManufacturingChennai, Tamil Nadu
Capacity: 10.5m fkm
Optical Fiber Manufacturing*Hyderabad, Telangana
Planned Capacity: Optical fiber - 6.4m fkm
Manufacturing Facilities
* Greenfield facility – soon to be operational
4
Research & Development Capabilities
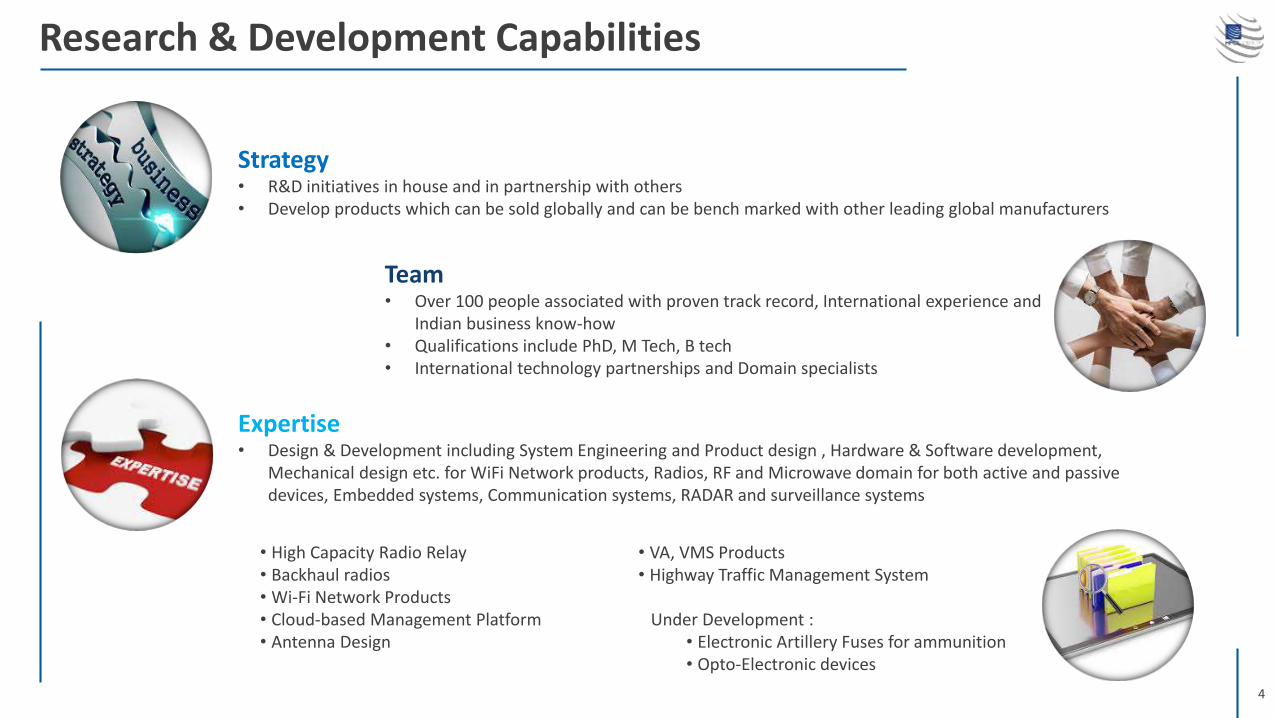
Strategy• R&D initiatives in house and in partnership with others• Develop products which can be sold globally and can be bench marked with other leading global manufacturers
Expertise• Design & Development including System Engineering and Product design , Hardware & Software development,
Mechanical design etc. for WiFi Network products, Radios, RF and Microwave domain for both active and passive devices, Embedded systems, Communication systems, RADAR and surveillance systems
Team• Over 100 people associated with proven track record, International experience and
Indian business know-how• Qualifications include PhD, M Tech, B tech• International technology partnerships and Domain specialists
• High Capacity Radio Relay• Backhaul radios• Wi-Fi Network Products• Cloud-based Management Platform• Antenna Design
• VA, VMS Products• Highway Traffic Management System
Under Development :• Electronic Artillery Fuses for ammunition• Opto-Electronic devices
5
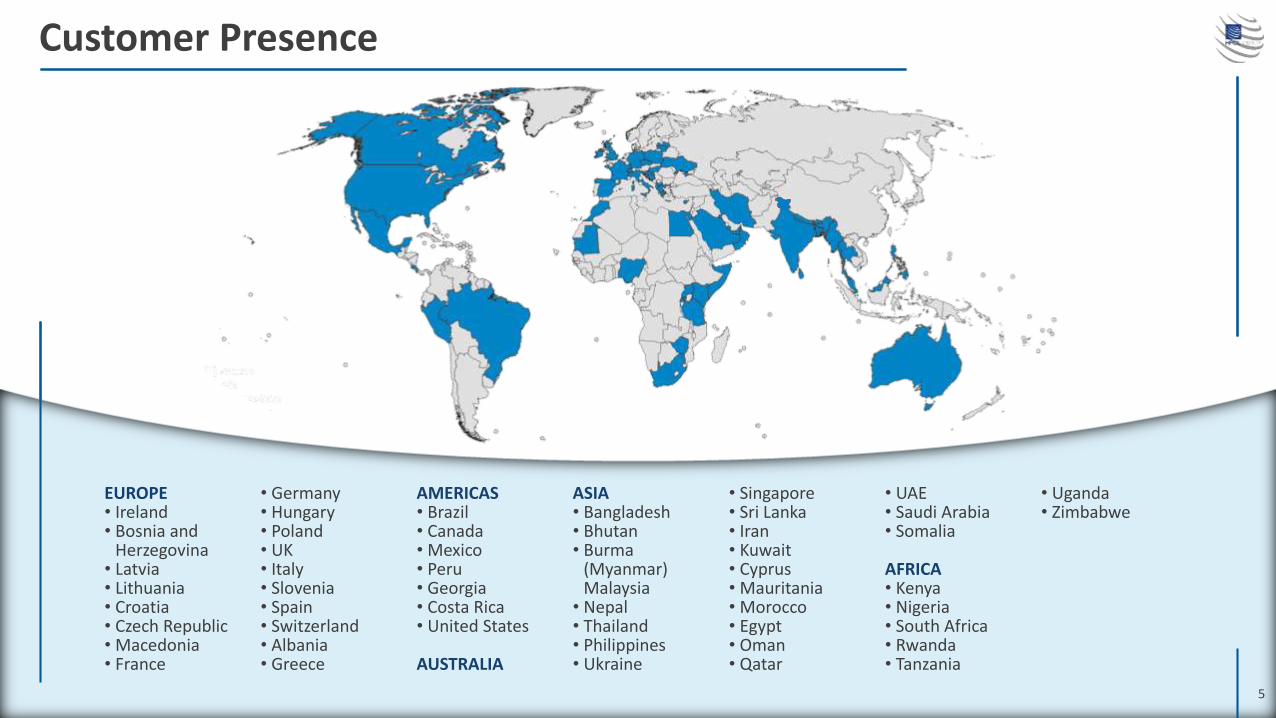
Customer Presence
EUROPE• Ireland• Bosnia and
Herzegovina• Latvia • Lithuania • Croatia• Czech Republic • Macedonia • France
• Germany • Hungary • Poland• UK• Italy • Slovenia • Spain • Switzerland • Albania• Greece
AMERICAS• Brazil • Canada• Mexico• Peru• Georgia• Costa Rica • United States
AUSTRALIA
ASIA• Bangladesh• Bhutan• Burma
(Myanmar) Malaysia
• Nepal• Thailand • Philippines • Ukraine
• Singapore • Sri Lanka • Iran• Kuwait• Cyprus • Mauritania• Morocco • Egypt• Oman• Qatar
• UAE• Saudi Arabia • Somalia
AFRICA• Kenya• Nigeria • South Africa • Rwanda• Tanzania
• Uganda• Zimbabwe
5
6
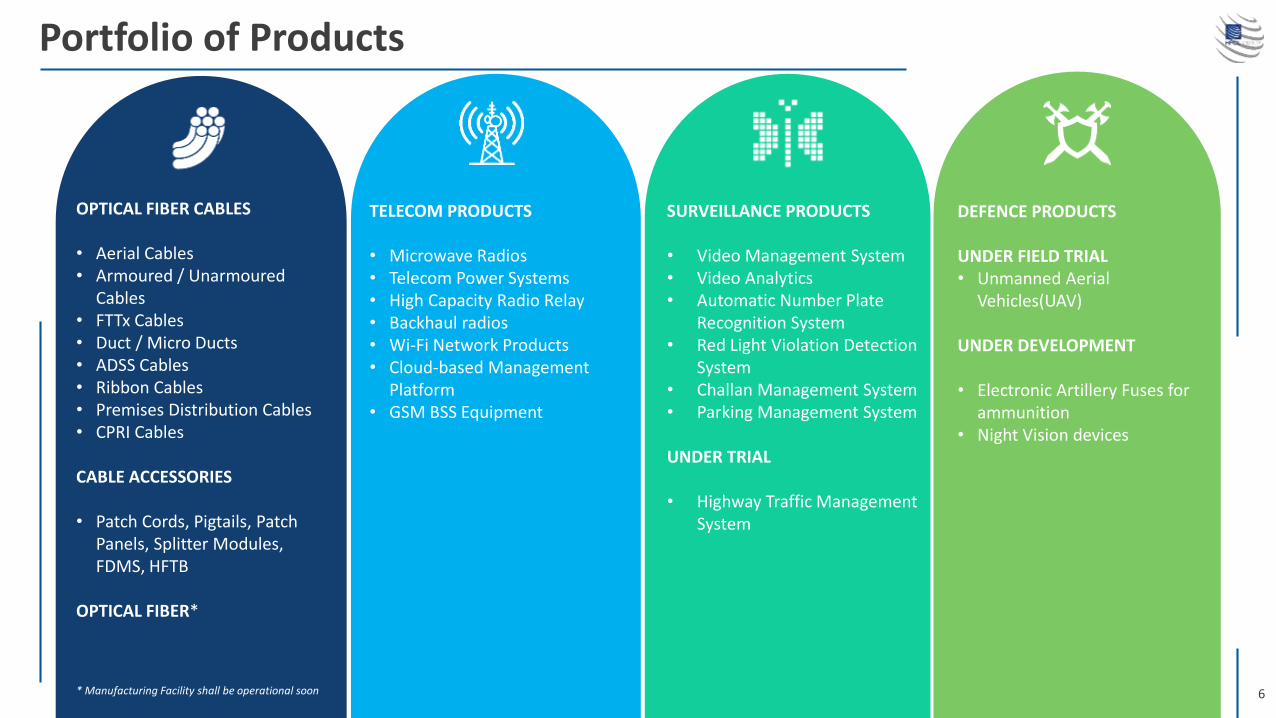
Portfolio of Products
OPTICAL FIBER CABLES
• Aerial Cables• Armoured / Unarmoured
Cables• FTTx Cables• Duct / Micro Ducts• ADSS Cables• Ribbon Cables• Premises Distribution Cables• CPRI Cables
CABLE ACCESSORIES
• Patch Cords, Pigtails, Patch Panels, Splitter Modules, FDMS, HFTB
OPTICAL FIBER*
TELECOM PRODUCTS
• Microwave Radios• Telecom Power Systems• High Capacity Radio Relay• Backhaul radios• Wi-Fi Network Products• Cloud-based Management
Platform• GSM BSS Equipment
SURVEILLANCE PRODUCTS
• Video Management System• Video Analytics• Automatic Number Plate
Recognition System• Red Light Violation Detection
System• Challan Management System• Parking Management System
UNDER TRIAL
• Highway Traffic Management System
DEFENCE PRODUCTS
UNDER FIELD TRIAL• Unmanned Aerial
Vehicles(UAV)
UNDER DEVELOPMENT
• Electronic Artillery Fuses for ammunition
• Night Vision devices
* Manufacturing Facility shall be operational soon
7
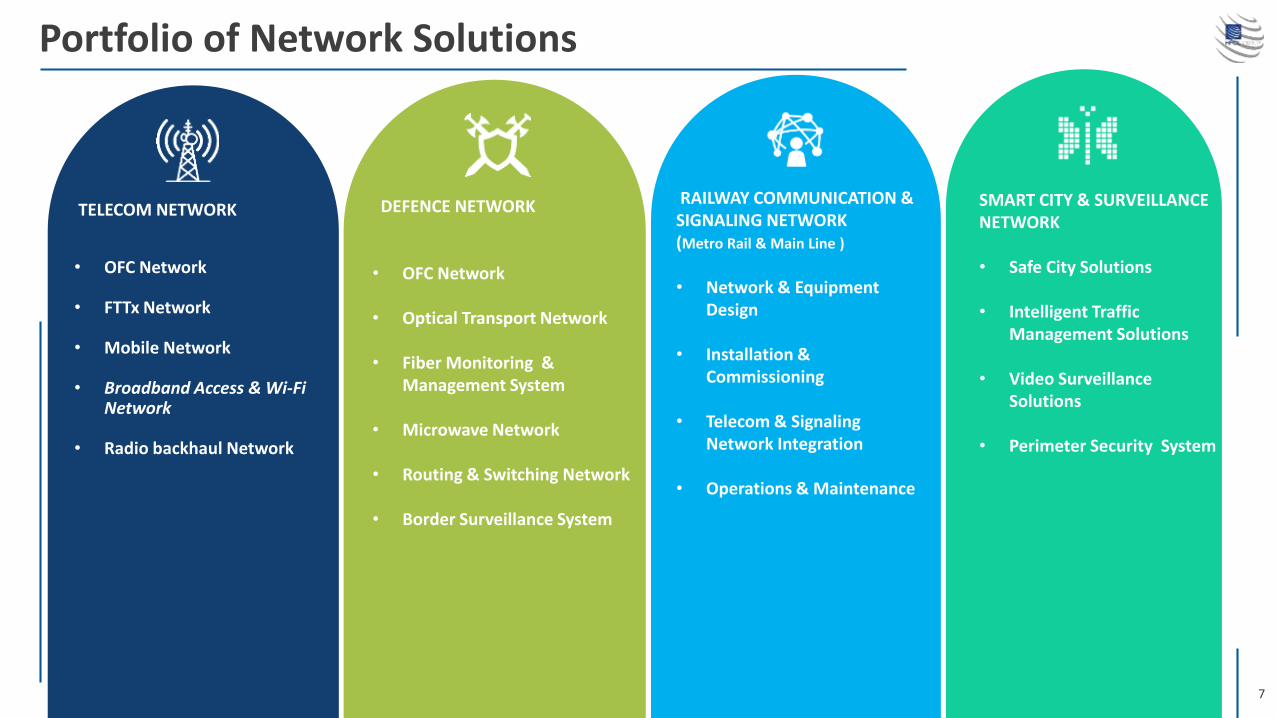
Portfolio of Network Solutions
DEFENCE NETWORK
• OFC Network
• Optical Transport Network
• Fiber Monitoring & Management System
• Microwave Network
• Routing & Switching Network
• Border Surveillance System
TELECOM NETWORK
• OFC Network
• FTTx Network
• Mobile Network
• Broadband Access & Wi-Fi Network
• Radio backhaul Network
RAILWAY COMMUNICATION & SIGNALING NETWORK(Metro Rail & Main Line )
• Network & Equipment Design
• Installation & Commissioning
• Telecom & Signaling Network Integration
• Operations & Maintenance
SMART CITY & SURVEILLANCE NETWORK
• Safe City Solutions
• Intelligent Traffic Management Solutions
• Video Surveillance Solutions
• Perimeter Security System
8
FINANCIAL OVERVIEW
9M/Q3-FY2020
9
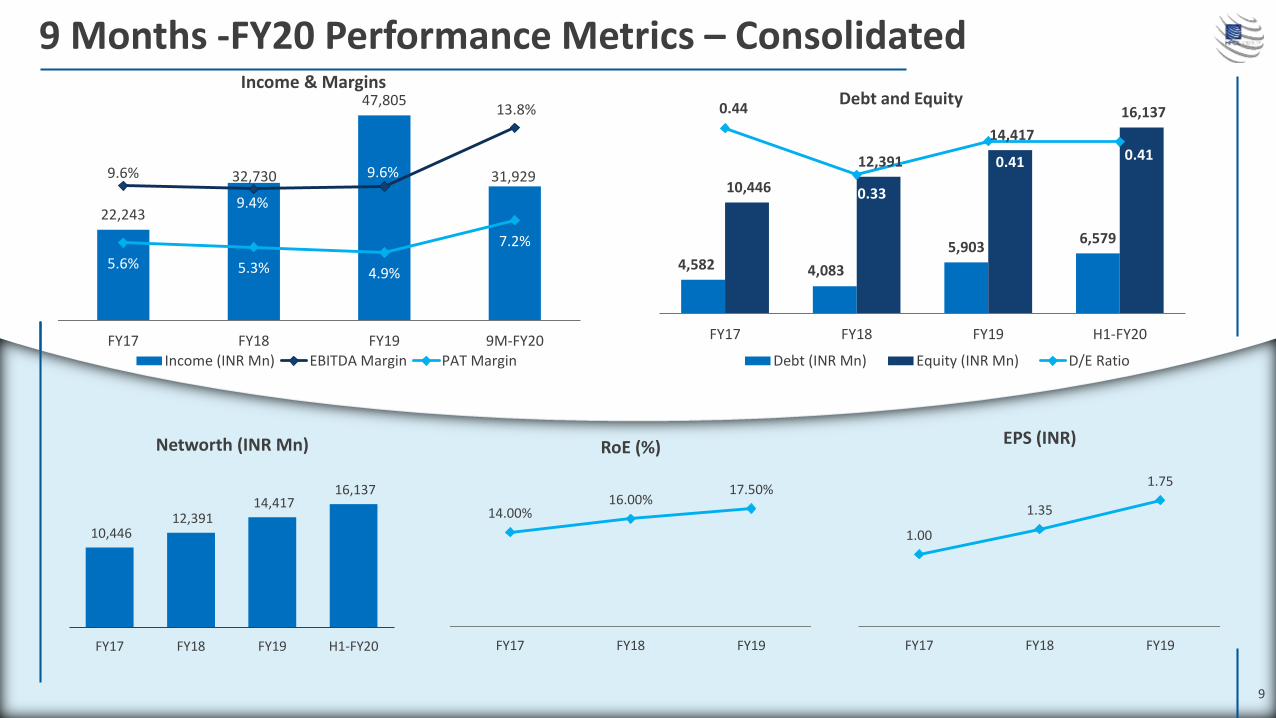
9 Months -FY20 Performance Metrics – Consolidated
9
22,243
32,730
47,805
31,9299.6%
9.4%
9.6%
13.8%
5.6% 5.3% 4.9%
7.2%
0.0%
2.0%
4.0%
6.0%
8.0%
10.0%
12.0%
14.0%
16.0%
FY17 FY18 FY19 9M-FY20
Income & Margins
Income (INR Mn) EBITDA Margin PAT Margin
1.00
1.35
1.75
FY17 FY18 FY19
EPS (INR)
10,446 12,391
14,417 16,137
FY17 FY18 FY19 H1-FY20
Networth (INR Mn)
14.00%16.00%
17.50%
FY17 FY18 FY19
RoE (%)
4,582 4,083
5,9036,579
10,446
12,391
14,417
16,137 0.44
0.33
0.41 0.41
-
0.10
0.20
0.30
0.40
0.50
FY17 FY18 FY19 H1-FY20
Debt and Equity
Debt (INR Mn) Equity (INR Mn) D/E Ratio
1010
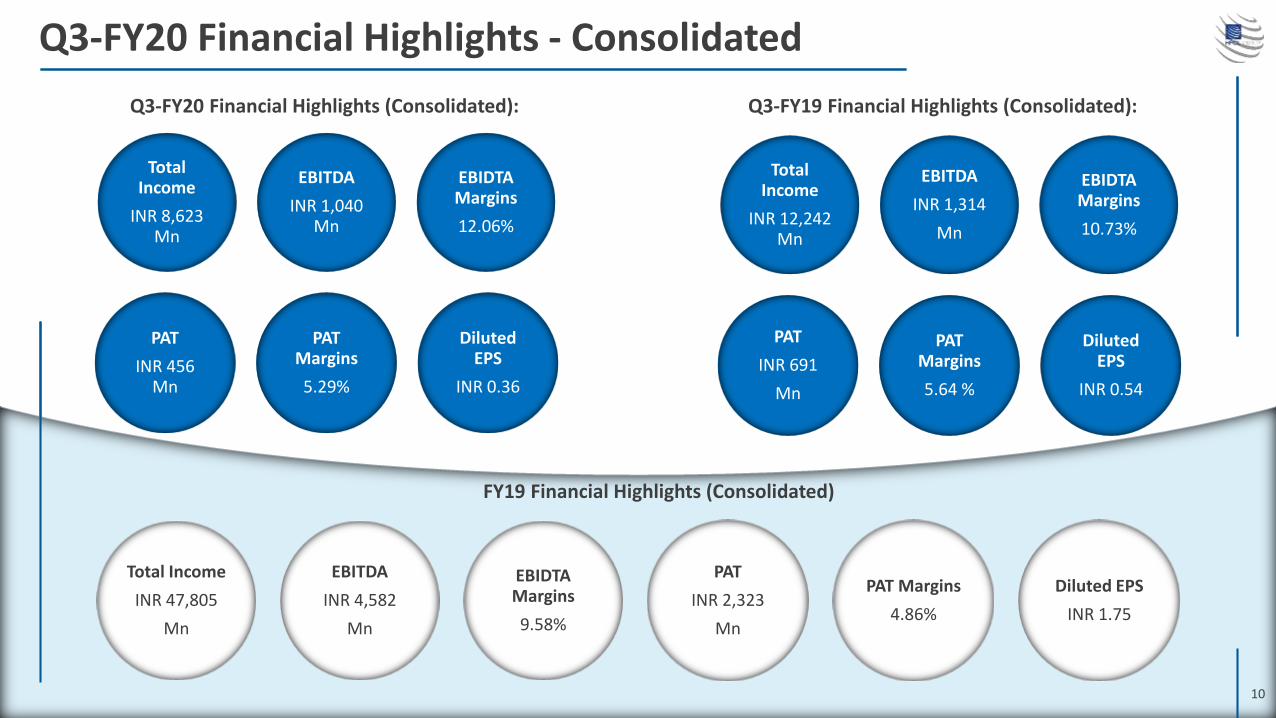
Q3-FY20 Financial Highlights - Consolidated
Q3-FY20 Financial Highlights (Consolidated):
FY19 Financial Highlights (Consolidated)
Total Income
INR 47,805
Mn
EBITDA
INR 4,582
Mn
EBIDTA Margins
9.58%
PAT
INR 2,323
Mn
PAT Margins
4.86%
Diluted EPS
INR 1.75
Total Income
INR 8,623 Mn
EBITDA
INR 1,040 Mn
EBIDTA Margins
12.06%
PAT
INR 456 Mn
PAT Margins
5.29%
Diluted EPS
INR 0.36
Total Income
INR 12,242 Mn
EBITDA
INR 1,314
Mn
EBIDTA Margins
10.73%
PAT
INR 691
Mn
PAT Margins
5.64 %
Diluted EPS
INR 0.54
Q3-FY19 Financial Highlights (Consolidated):
1111
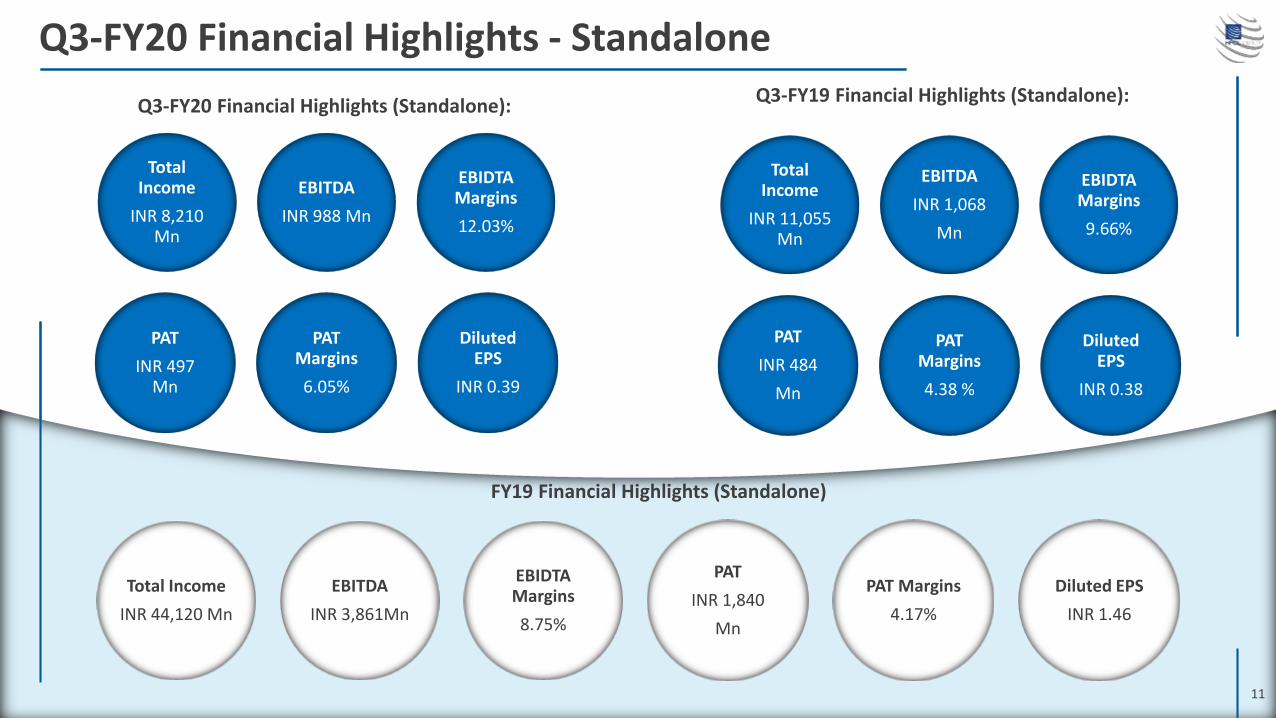
Q3-FY20 Financial Highlights - Standalone
Q3-FY20 Financial Highlights (Standalone):
Total Income
INR 11,055 Mn
EBITDA
INR 1,068
Mn
EBIDTA Margins
9.66%
PAT
INR 484
Mn
PAT Margins
4.38 %
Diluted EPS
INR 0.38
Q3-FY19 Financial Highlights (Standalone):
FY19 Financial Highlights (Standalone)
Total Income
INR 44,120 Mn
EBITDA
INR 3,861Mn
EBIDTA Margins
8.75%
PAT
INR 1,840
Mn
PAT Margins
4.17%
Diluted EPS
INR 1.46
Total Income
INR 8,210 Mn
EBITDA
INR 988 Mn
EBIDTA Margins
12.03%
PAT
INR 497 Mn
PAT Margins
6.05%
Diluted EPS
INR 0.39
1212
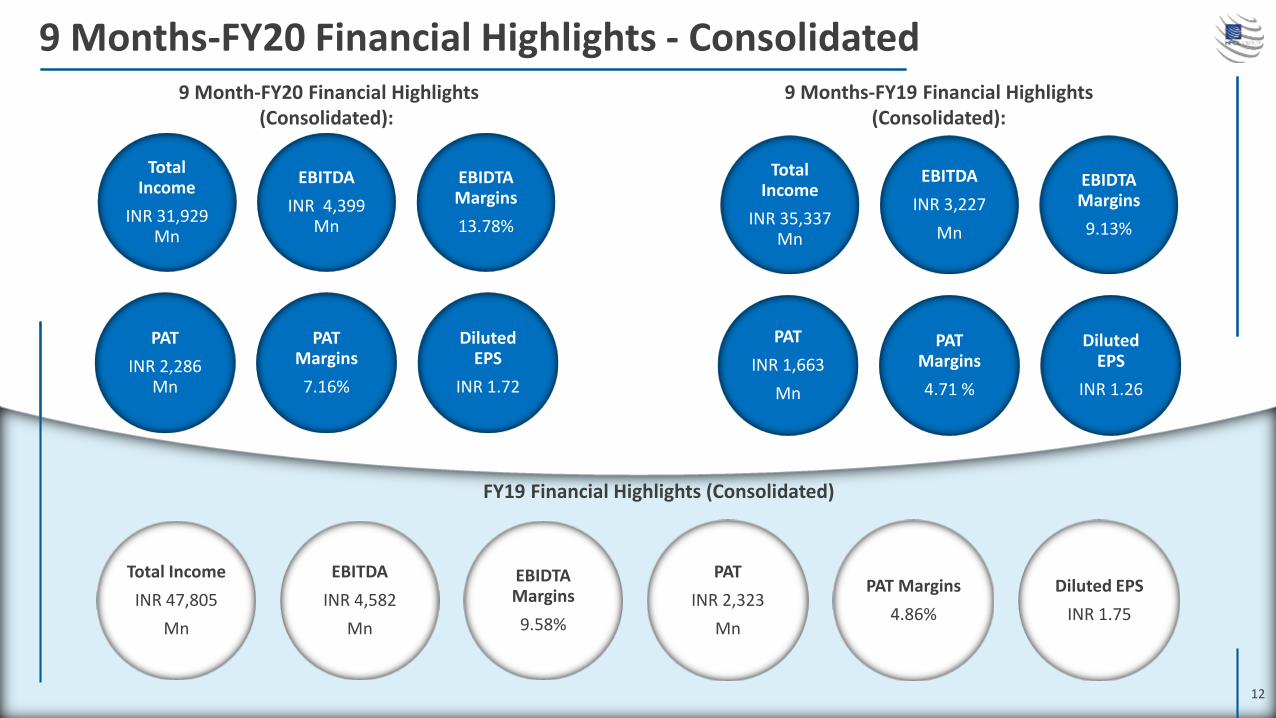
9 Months-FY20 Financial Highlights - Consolidated9 Month-FY20 Financial Highlights
(Consolidated):
FY19 Financial Highlights (Consolidated)
Total Income
INR 47,805
Mn
EBITDA
INR 4,582
Mn
EBIDTA Margins
9.58%
PAT
INR 2,323
Mn
PAT Margins
4.86%
Diluted EPS
INR 1.75
Total Income
INR 31,929 Mn
EBITDA
INR 4,399 Mn
EBIDTA Margins
13.78%
PAT
INR 2,286 Mn
PAT Margins
7.16%
Diluted EPS
INR 1.72
Total Income
INR 35,337 Mn
EBITDA
INR 3,227
Mn
EBIDTA Margins
9.13%
PAT
INR 1,663
Mn
PAT Margins
4.71 %
Diluted EPS
INR 1.26
9 Months-FY19 Financial Highlights (Consolidated):
1313
9 Months-FY20 Financial Highlights - Standalone
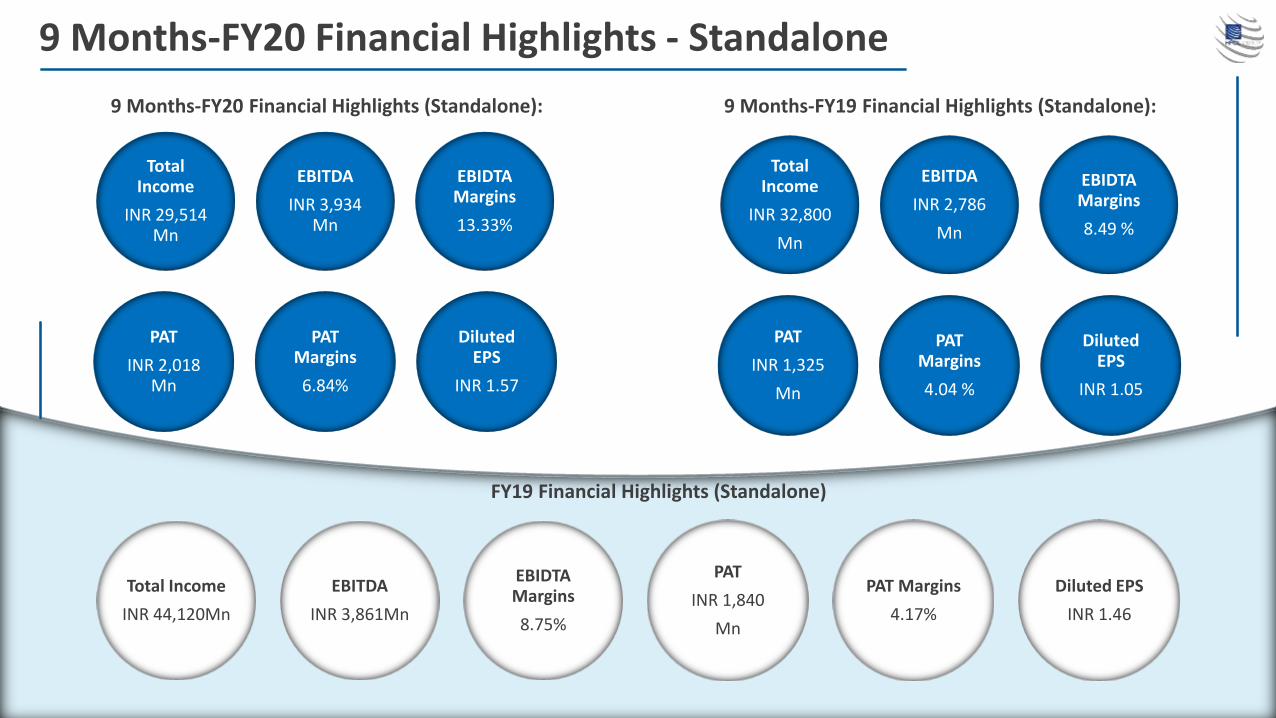
9 Months-FY20 Financial Highlights (Standalone):
FY19 Financial Highlights (Consolidated)
Total Income
INR 47,848
Mn
EBITDA
INR 4,582
Mn
EBIDTA Margins
9.58%
Net Profit
INR 2,323
Mn
PAT Margins
4.85%
Diluted EPS
INR 1.75
Total Income
INR 29,514 Mn
EBITDA
INR 3,934 Mn
EBIDTA Margins
13.33%
PAT
INR 2,018 Mn
PAT Margins
6.84%
Diluted EPS
INR 1.57
Total Income
INR 32,800
Mn
EBITDA
INR 2,786
Mn
EBIDTA Margins
8.49 %
PAT
INR 1,325
Mn
PAT Margins
4.04 %
Diluted EPS
INR 1.05
9 Months-FY19 Financial Highlights (Standalone):
FY19 Financial Highlights (Standalone)
Total Income
INR 44,120Mn
EBITDA
INR 3,861Mn
EBIDTA Margins
8.75%
PAT
INR 1,840
Mn
PAT Margins
4.17%
Diluted EPS
INR 1.46
14
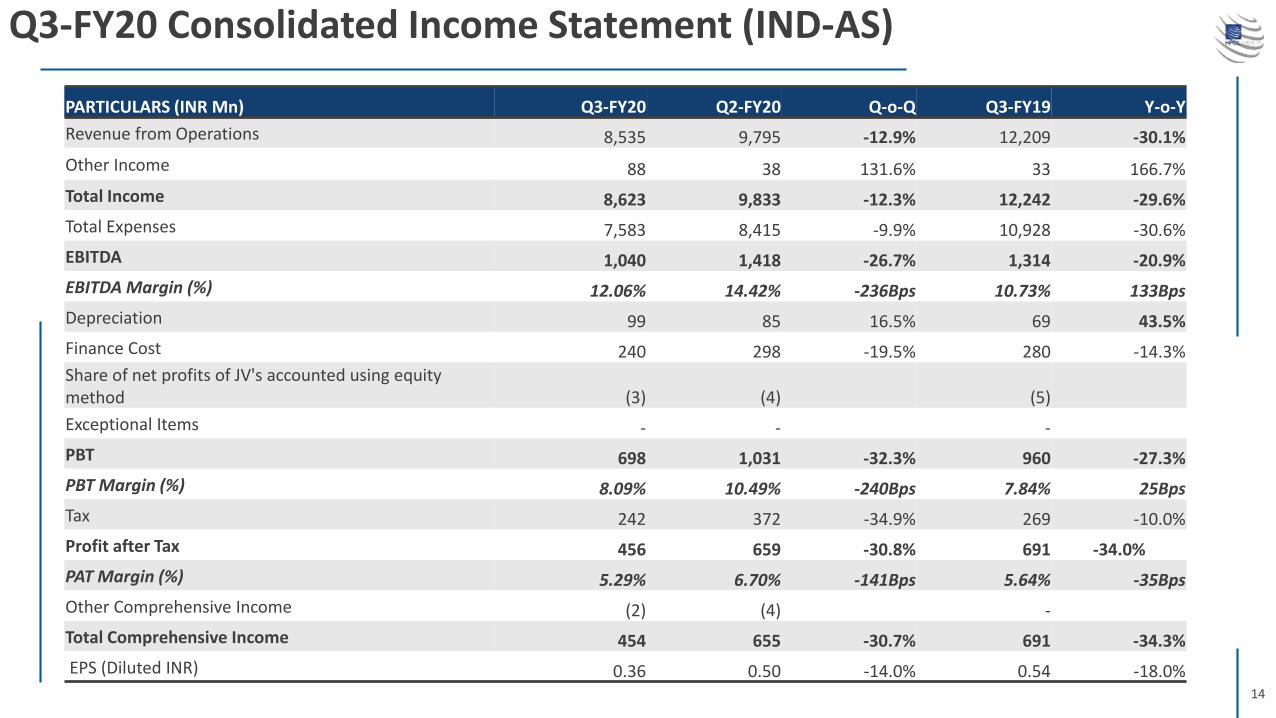
Q3-FY20 Consolidated Income Statement (IND-AS)
PARTICULARS (INR Mn) Q3-FY20 Q2-FY20 Q-o-Q Q3-FY19 Y-o-Y
Revenue from Operations 8,535 9,795 -12.9% 12,209 -30.1%
Other Income 88 38 131.6% 33 166.7%
Total Income 8,623 9,833 -12.3% 12,242 -29.6%
Total Expenses 7,583 8,415 -9.9% 10,928 -30.6%
EBITDA 1,040 1,418 -26.7% 1,314 -20.9%
EBITDA Margin (%) 12.06% 14.42% -236Bps 10.73% 133Bps
Depreciation 99 85 16.5% 69 43.5%
Finance Cost 240 298 -19.5% 280 -14.3%Share of net profits of JV's accounted using equity method (3) (4) (5)
Exceptional Items - - -
PBT 698 1,031 -32.3% 960 -27.3%
PBT Margin (%) 8.09% 10.49% -240Bps 7.84% 25Bps
Tax 242 372 -34.9% 269 -10.0%
Profit after Tax 456 659 -30.8% 691 -34.0%
PAT Margin (%) 5.29% 6.70% -141Bps 5.64% -35Bps
Other Comprehensive Income (2) (4) -
Total Comprehensive Income 454 655 -30.7% 691 -34.3%
EPS (Diluted INR) 0.36 0.50 -14.0% 0.54 -18.0%
15
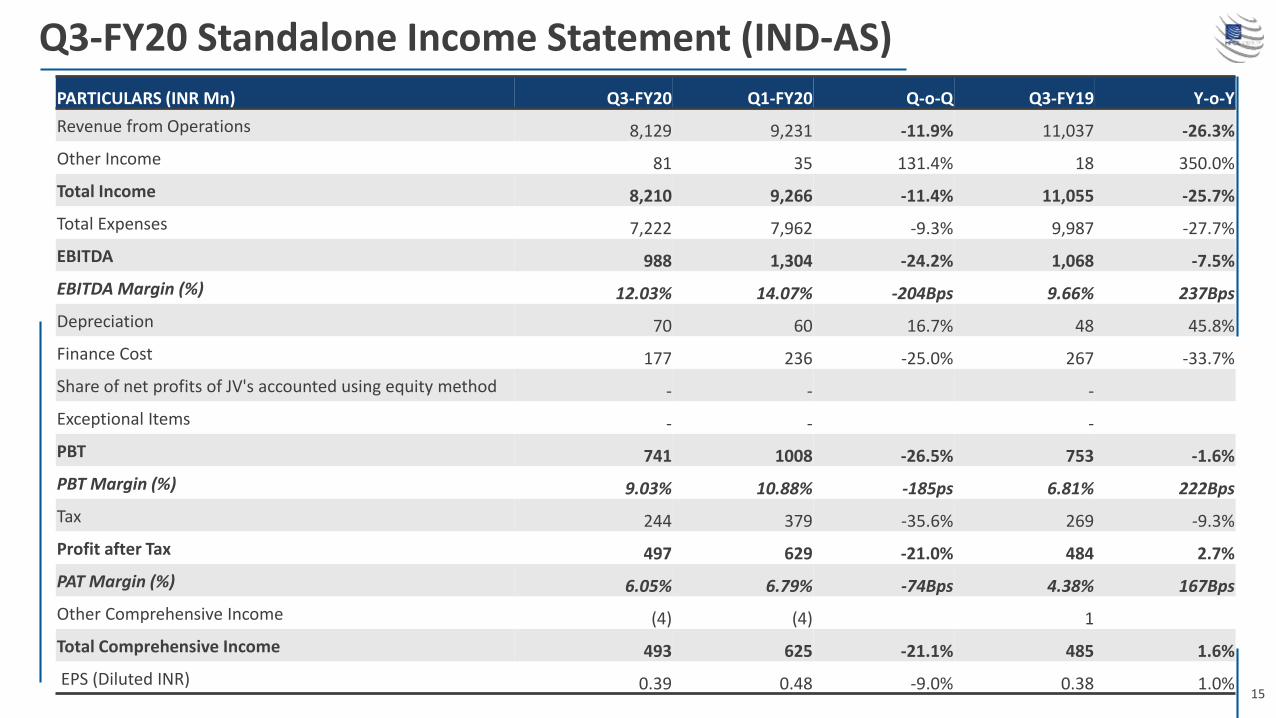
Q3-FY20 Standalone Income Statement (IND-AS)
PARTICULARS (INR Mn) Q3-FY20 Q1-FY20 Q-o-Q Q3-FY19 Y-o-Y
Revenue from Operations 8,129 9,231 -11.9% 11,037 -26.3%
Other Income 81 35 131.4% 18 350.0%
Total Income 8,210 9,266 -11.4% 11,055 -25.7%
Total Expenses 7,222 7,962 -9.3% 9,987 -27.7%
EBITDA 988 1,304 -24.2% 1,068 -7.5%
EBITDA Margin (%) 12.03% 14.07% -204Bps 9.66% 237Bps
Depreciation 70 60 16.7% 48 45.8%
Finance Cost 177 236 -25.0% 267 -33.7%
Share of net profits of JV's accounted using equity method - - -
Exceptional Items - - -
PBT 741 1008 -26.5% 753 -1.6%
PBT Margin (%) 9.03% 10.88% -185ps 6.81% 222Bps
Tax 244 379 -35.6% 269 -9.3%
Profit after Tax 497 629 -21.0% 484 2.7%
PAT Margin (%) 6.05% 6.79% -74Bps 4.38% 167Bps
Other Comprehensive Income (4) (4) 1
Total Comprehensive Income 493 625 -21.1% 485 1.6%
EPS (Diluted INR) 0.39 0.48 -9.0% 0.38 1.0%
16
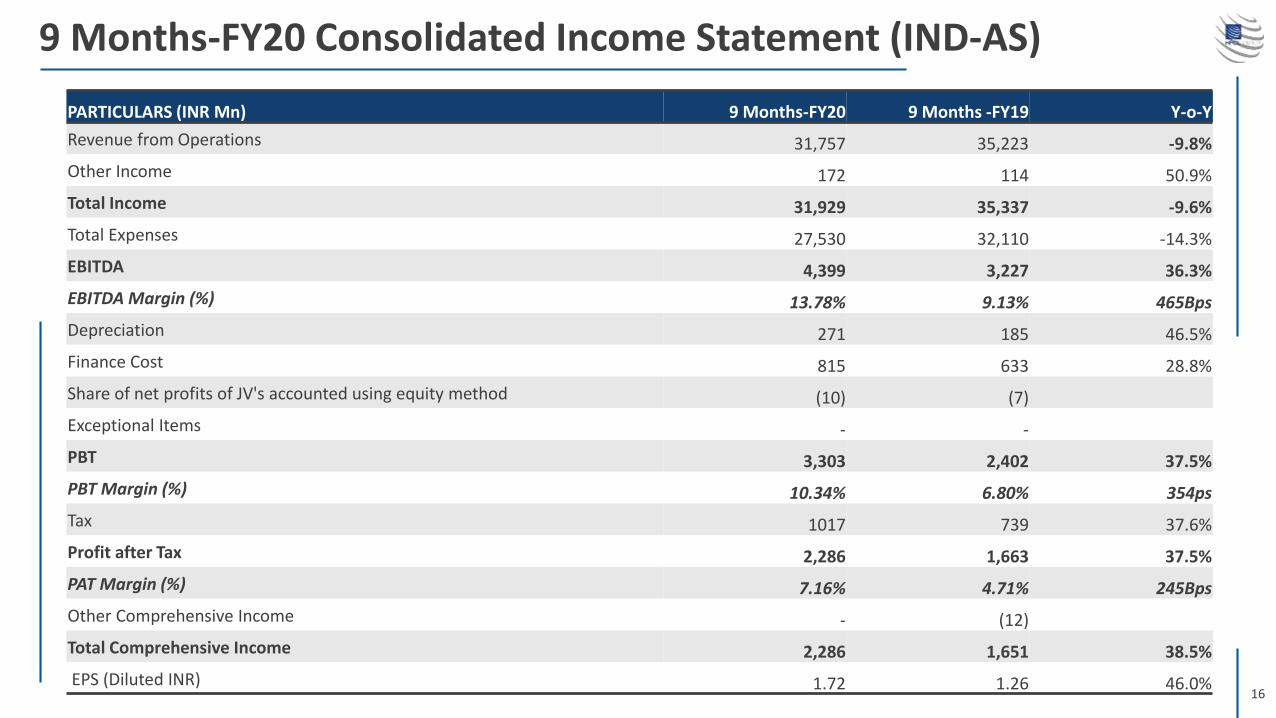
9 Months-FY20 Consolidated Income Statement (IND-AS)
PARTICULARS (INR Mn) 9 Months-FY20 9 Months -FY19 Y-o-Y
Revenue from Operations 31,757 35,223 -9.8%
Other Income 172 114 50.9%
Total Income 31,929 35,337 -9.6%
Total Expenses 27,530 32,110 -14.3%
EBITDA 4,399 3,227 36.3%
EBITDA Margin (%) 13.78% 9.13% 465Bps
Depreciation 271 185 46.5%
Finance Cost 815 633 28.8%
Share of net profits of JV's accounted using equity method (10) (7)
Exceptional Items - -
PBT 3,303 2,402 37.5%
PBT Margin (%) 10.34% 6.80% 354ps
Tax 1017 739 37.6%
Profit after Tax 2,286 1,663 37.5%
PAT Margin (%) 7.16% 4.71% 245Bps
Other Comprehensive Income - (12)
Total Comprehensive Income 2,286 1,651 38.5%
EPS (Diluted INR) 1.72 1.26 46.0%
17
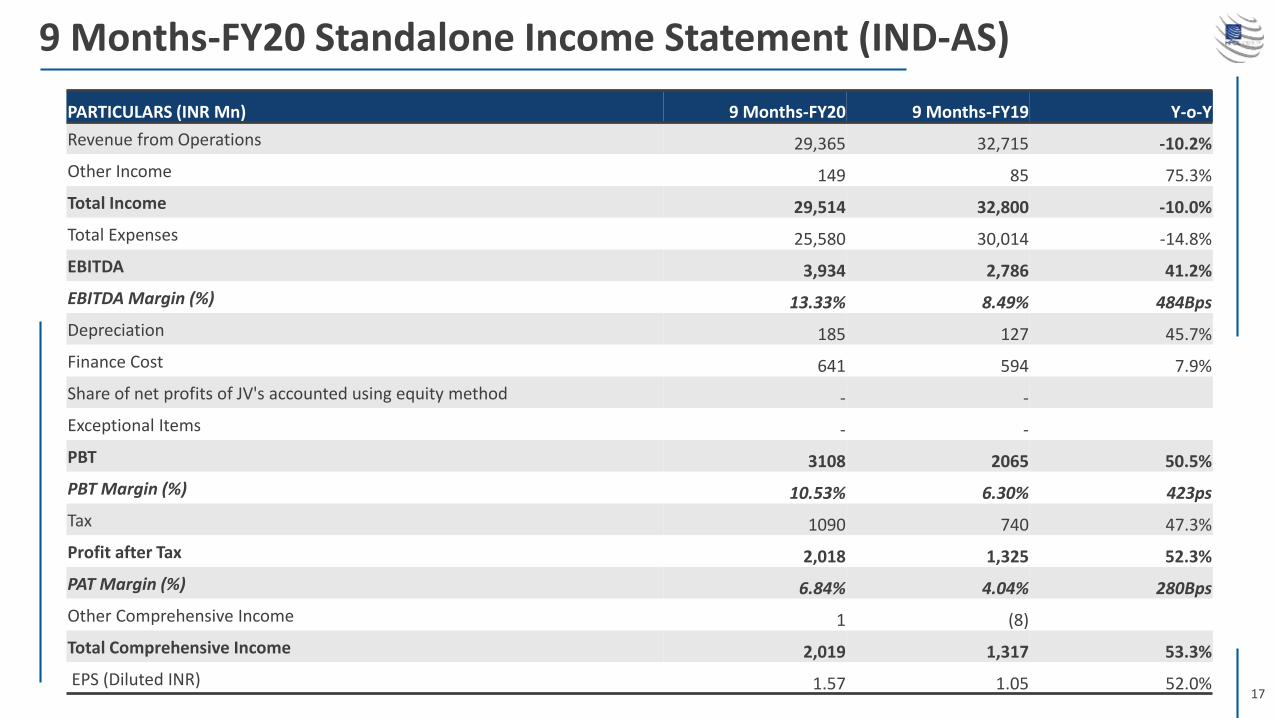
9 Months-FY20 Standalone Income Statement (IND-AS)
PARTICULARS (INR Mn) 9 Months-FY20 9 Months-FY19 Y-o-Y
Revenue from Operations 29,365 32,715 -10.2%
Other Income 149 85 75.3%
Total Income 29,514 32,800 -10.0%
Total Expenses 25,580 30,014 -14.8%
EBITDA 3,934 2,786 41.2%
EBITDA Margin (%) 13.33% 8.49% 484Bps
Depreciation 185 127 45.7%
Finance Cost 641 594 7.9%
Share of net profits of JV's accounted using equity method - -
Exceptional Items - -
PBT 3108 2065 50.5%
PBT Margin (%) 10.53% 6.30% 423ps
Tax 1090 740 47.3%
Profit after Tax 2,018 1,325 52.3%
PAT Margin (%) 6.84% 4.04% 280Bps
Other Comprehensive Income 1 (8)
Total Comprehensive Income 2,019 1,317 53.3%
EPS (Diluted INR) 1.57 1.05 52.0%
18
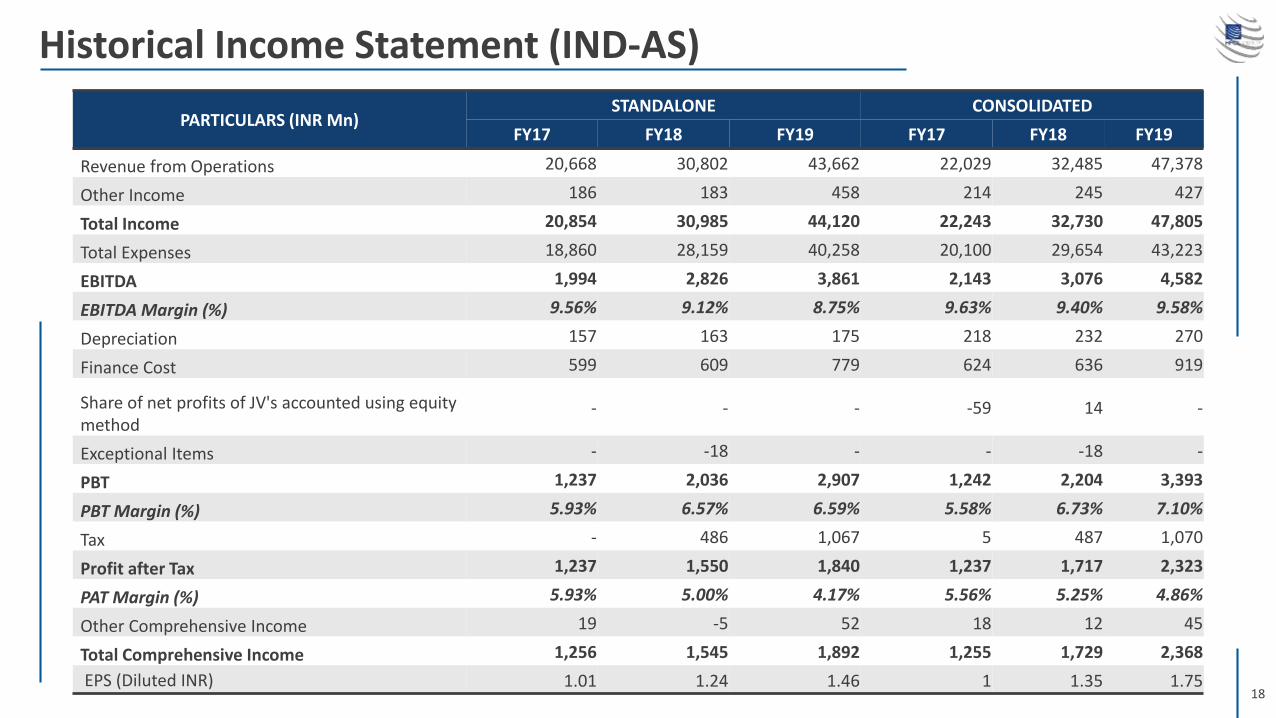
Historical Income Statement (IND-AS)
PARTICULARS (INR Mn)STANDALONE CONSOLIDATED
FY17 FY18 FY19 FY17 FY18 FY19
Revenue from Operations 20,668 30,802 43,662 22,029 32,485 47,378
Other Income 186 183 458 214 245 427
Total Income 20,854 30,985 44,120 22,243 32,730 47,805
Total Expenses 18,860 28,159 40,258 20,100 29,654 43,223
EBITDA 1,994 2,826 3,861 2,143 3,076 4,582
EBITDA Margin (%) 9.56% 9.12% 8.75% 9.63% 9.40% 9.58%
Depreciation 157 163 175 218 232 270
Finance Cost 599 609 779 624 636 919
Share of net profits of JV's accounted using equity method
- - - -59 14 -
Exceptional Items - -18 - - -18 -
PBT 1,237 2,036 2,907 1,242 2,204 3,393
PBT Margin (%) 5.93% 6.57% 6.59% 5.58% 6.73% 7.10%
Tax - 486 1,067 5 487 1,070
Profit after Tax 1,237 1,550 1,840 1,237 1,717 2,323
PAT Margin (%) 5.93% 5.00% 4.17% 5.56% 5.25% 4.86%
Other Comprehensive Income 19 -5 52 18 12 45
Total Comprehensive Income 1,256 1,545 1,892 1,255 1,729 2,368
EPS (Diluted INR) 1.01 1.24 1.46 1 1.35 1.75
19
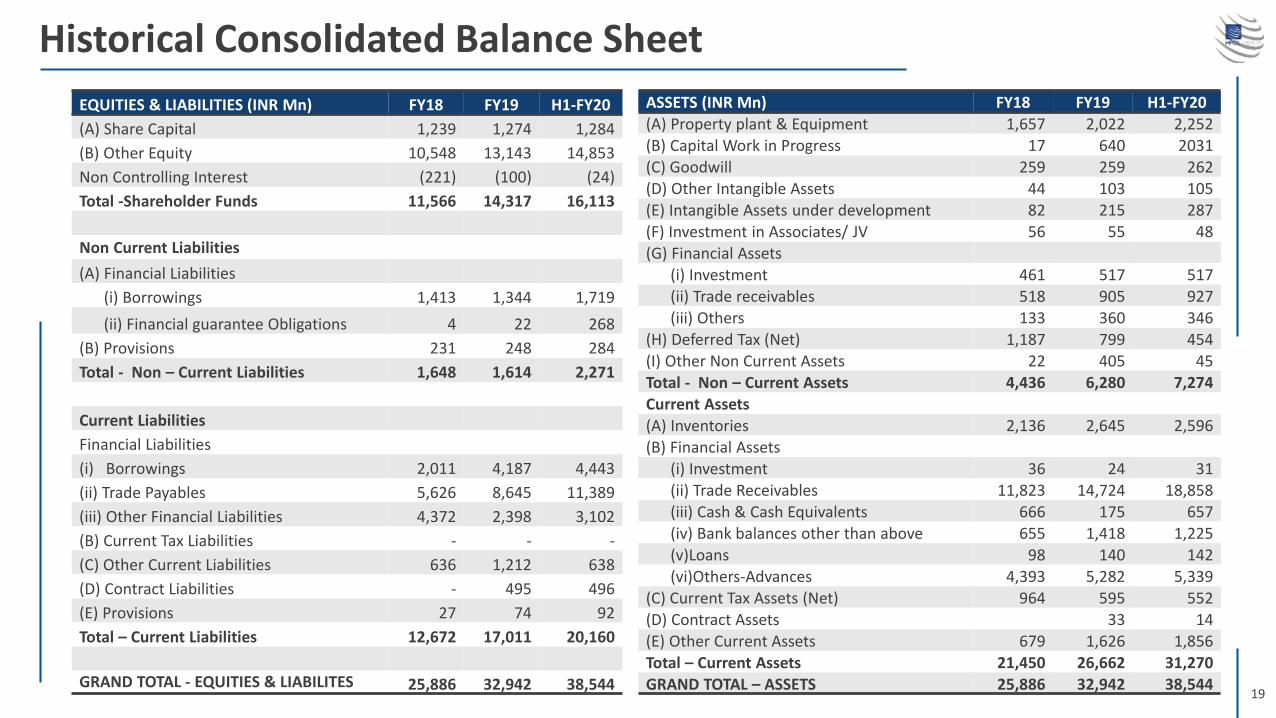
Historical Consolidated Balance Sheet
EQUITIES & LIABILITIES (INR Mn) FY18 FY19 H1-FY20
(A) Share Capital 1,239 1,274 1,284
(B) Other Equity 10,548 13,143 14,853
Non Controlling Interest (221) (100) (24)
Total -Shareholder Funds 11,566 14,317 16,113
Non Current Liabilities
(A) Financial Liabilities
(i) Borrowings 1,413 1,344 1,719
(ii) Financial guarantee Obligations 4 22 268
(B) Provisions 231 248 284
Total - Non – Current Liabilities 1,648 1,614 2,271
Current Liabilities
Financial Liabilities
(i) Borrowings 2,011 4,187 4,443
(ii) Trade Payables 5,626 8,645 11,389
(iii) Other Financial Liabilities 4,372 2,398 3,102
(B) Current Tax Liabilities - - -
(C) Other Current Liabilities 636 1,212 638
(D) Contract Liabilities - 495 496
(E) Provisions 27 74 92
Total – Current Liabilities 12,672 17,011 20,160
GRAND TOTAL - EQUITIES & LIABILITES 25,886 32,942 38,544
ASSETS (INR Mn) FY18 FY19 H1-FY20
(A) Property plant & Equipment 1,657 2,022 2,252(B) Capital Work in Progress 17 640 2031
(C) Goodwill 259 259 262(D) Other Intangible Assets 44 103 105
(E) Intangible Assets under development 82 215 287
(F) Investment in Associates/ JV 56 55 48(G) Financial Assets
(i) Investment 461 517 517
(ii) Trade receivables 518 905 927(iii) Others 133 360 346
(H) Deferred Tax (Net) 1,187 799 454
(I) Other Non Current Assets 22 405 45Total - Non – Current Assets 4,436 6,280 7,274
Current Assets
(A) Inventories 2,136 2,645 2,596
(B) Financial Assets(i) Investment 36 24 31(ii) Trade Receivables 11,823 14,724 18,858
(iii) Cash & Cash Equivalents 666 175 657
(iv) Bank balances other than above 655 1,418 1,225(v)Loans 98 140 142
(vi)Others-Advances 4,393 5,282 5,339(C) Current Tax Assets (Net) 964 595 552
(D) Contract Assets 33 14(E) Other Current Assets 679 1,626 1,856
Total – Current Assets 21,450 26,662 31,270
GRAND TOTAL – ASSETS 25,886 32,942 38,544
20
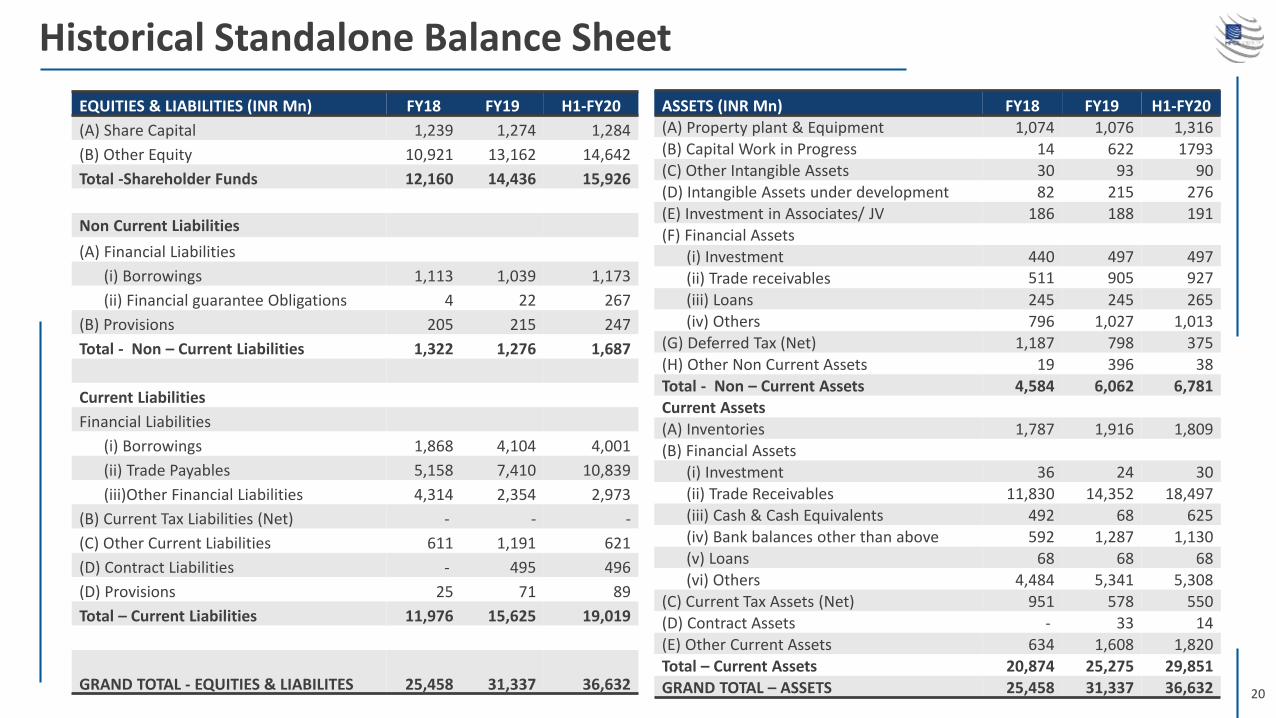
Historical Standalone Balance Sheet
EQUITIES & LIABILITIES (INR Mn) FY18 FY19 H1-FY20
(A) Share Capital 1,239 1,274 1,284
(B) Other Equity 10,921 13,162 14,642
Total -Shareholder Funds 12,160 14,436 15,926
Non Current Liabilities
(A) Financial Liabilities
(i) Borrowings 1,113 1,039 1,173
(ii) Financial guarantee Obligations 4 22 267
(B) Provisions 205 215 247
Total - Non – Current Liabilities 1,322 1,276 1,687
Current Liabilities
Financial Liabilities
(i) Borrowings 1,868 4,104 4,001
(ii) Trade Payables 5,158 7,410 10,839
(iii)Other Financial Liabilities 4,314 2,354 2,973
(B) Current Tax Liabilities (Net) - - -
(C) Other Current Liabilities 611 1,191 621
(D) Contract Liabilities - 495 496
(D) Provisions 25 71 89
Total – Current Liabilities 11,976 15,625 19,019
GRAND TOTAL - EQUITIES & LIABILITES 25,458 31,337 36,632
ASSETS (INR Mn) FY18 FY19 H1-FY20
(A) Property plant & Equipment 1,074 1,076 1,316
(B) Capital Work in Progress 14 622 1793(C) Other Intangible Assets 30 93 90
(D) Intangible Assets under development 82 215 276(E) Investment in Associates/ JV 186 188 191
(F) Financial Assets
(i) Investment 440 497 497(ii) Trade receivables 511 905 927
(iii) Loans 245 245 265(iv) Others 796 1,027 1,013
(G) Deferred Tax (Net) 1,187 798 375
(H) Other Non Current Assets 19 396 38
Total - Non – Current Assets 4,584 6,062 6,781Current Assets(A) Inventories 1,787 1,916 1,809
(B) Financial Assets
(i) Investment 36 24 30
(ii) Trade Receivables 11,830 14,352 18,497(iii) Cash & Cash Equivalents 492 68 625(iv) Bank balances other than above 592 1,287 1,130
(v) Loans 68 68 68(vi) Others 4,484 5,341 5,308
(C) Current Tax Assets (Net) 951 578 550
(D) Contract Assets - 33 14(E) Other Current Assets 634 1,608 1,820
Total – Current Assets 20,874 25,275 29,851GRAND TOTAL – ASSETS 25,458 31,337 36,632
21
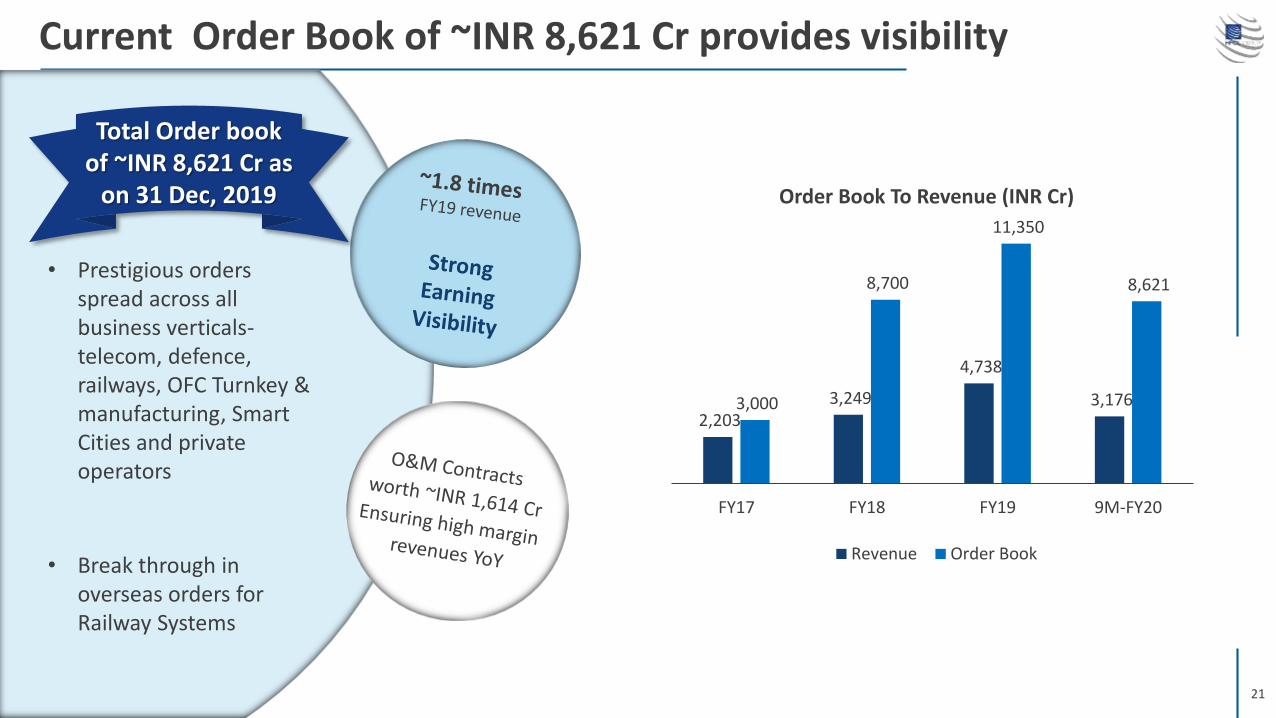
Current Order Book of ~INR 8,621 Cr provides visibility
• Prestigious orders spread across all business verticals-telecom, defence, railways, OFC Turnkey & manufacturing, Smart Cities and private operators
• Break through in overseas orders for Railway Systems
Total Order book of ~INR 8,621 Cr as
on 31 Dec, 2019
2,203 3,249
4,738
3,176 3,000
8,700
11,350
8,621
FY17 FY18 FY19 9M-FY20
Order Book To Revenue (INR Cr)
Revenue Order Book
22
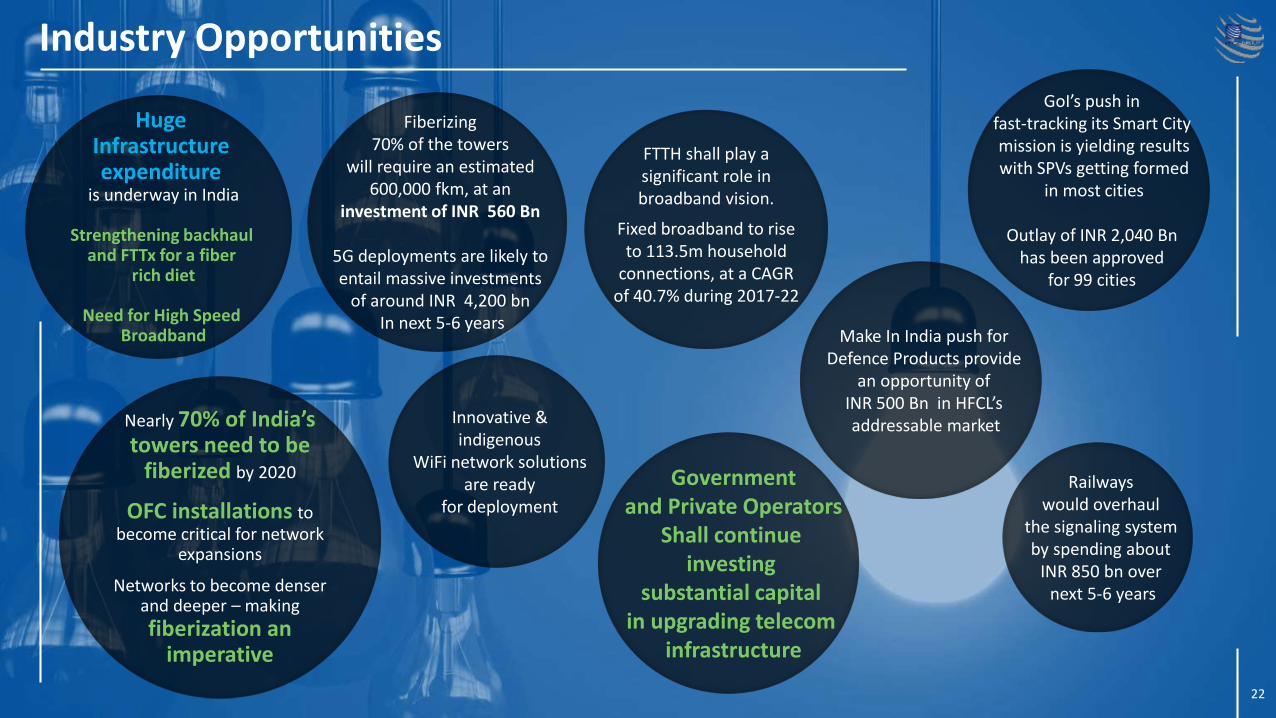
Huge Infrastructure expenditure
is underway in India
Strengthening backhaul and FTTx for a fiber
rich diet
Need for High Speed Broadband
Nearly 70% of India’s towers need to be
fiberized by 2020
OFC installations to become critical for network
expansions
Networks to become denser and deeper – making
fiberization an imperative
Railways would overhaul
the signaling system by spending about
INR 850 bn over next 5-6 years
Fiberizing 70% of the towers
will require an estimated 600,000 fkm, at an
investment of INR 560 Bn
5G deployments are likely to entail massive investments
of around INR 4,200 bnIn next 5-6 years
Make In India push for Defence Products provide
an opportunity of INR 500 Bn in HFCL’s addressable market
Governmentand Private Operators
Shall continue investing
substantial capital in upgrading telecom
infrastructure
Innovative & indigenous
WiFi network solutions are ready
for deployment
GoI’s push in fast-tracking its Smart City mission is yielding resultswith SPVs getting formed
in most cities
Outlay of INR 2,040 Bn has been approved
for 99 cities
Industry Opportunities
FTTH shall play a significant role in broadband vision.
Fixed broadband to rise to 113.5m household
connections, at a CAGRof 40.7% during 2017-22
22
23
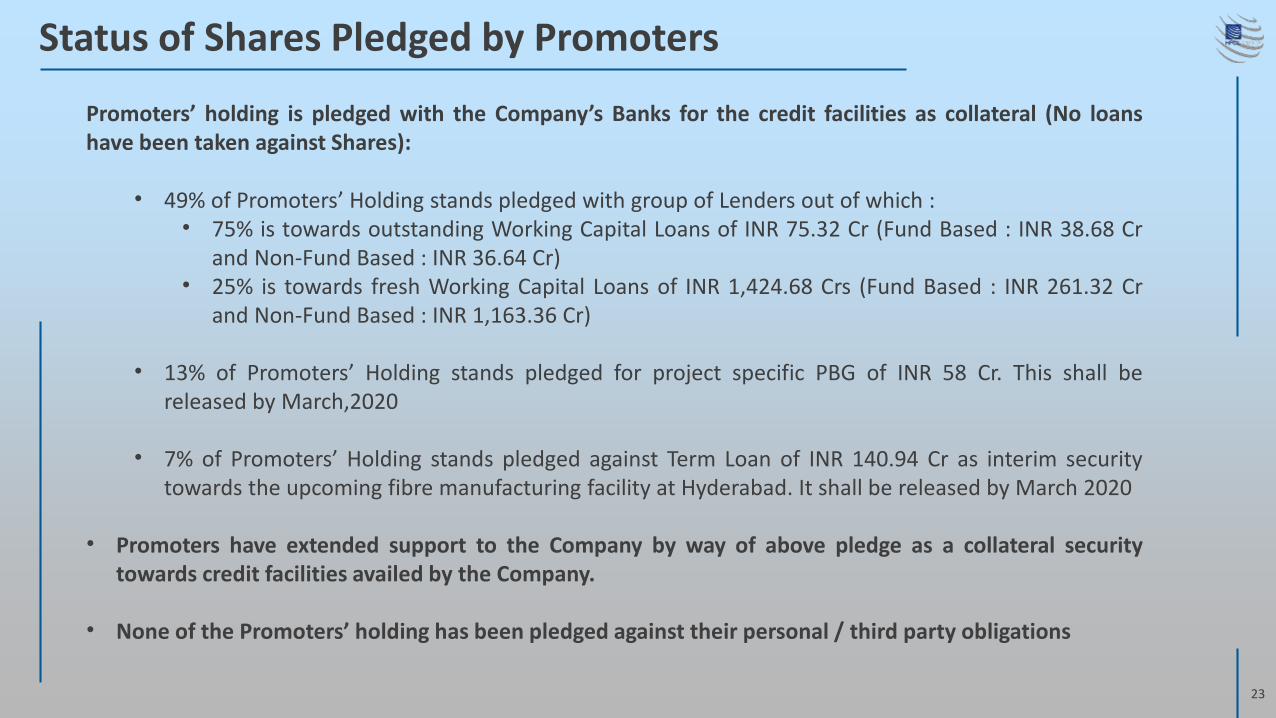
Status of Shares Pledged by Promoters
Promoters’ holding is pledged with the Company’s Banks for the credit facilities as collateral (No loanshave been taken against Shares):
• 49% of Promoters’ Holding stands pledged with group of Lenders out of which :• 75% is towards outstanding Working Capital Loans of INR 75.32 Cr (Fund Based : INR 38.68 Cr
and Non-Fund Based : INR 36.64 Cr)• 25% is towards fresh Working Capital Loans of INR 1,424.68 Crs (Fund Based : INR 261.32 Cr
and Non-Fund Based : INR 1,163.36 Cr)
• 13% of Promoters’ Holding stands pledged for project specific PBG of INR 58 Cr. This shall bereleased by March,2020
• 7% of Promoters’ Holding stands pledged against Term Loan of INR 140.94 Cr as interim securitytowards the upcoming fibre manufacturing facility at Hyderabad. It shall be released by March 2020
• Promoters have extended support to the Company by way of above pledge as a collateral securitytowards credit facilities availed by the Company.
• None of the Promoters’ holding has been pledged against their personal / third party obligations
24
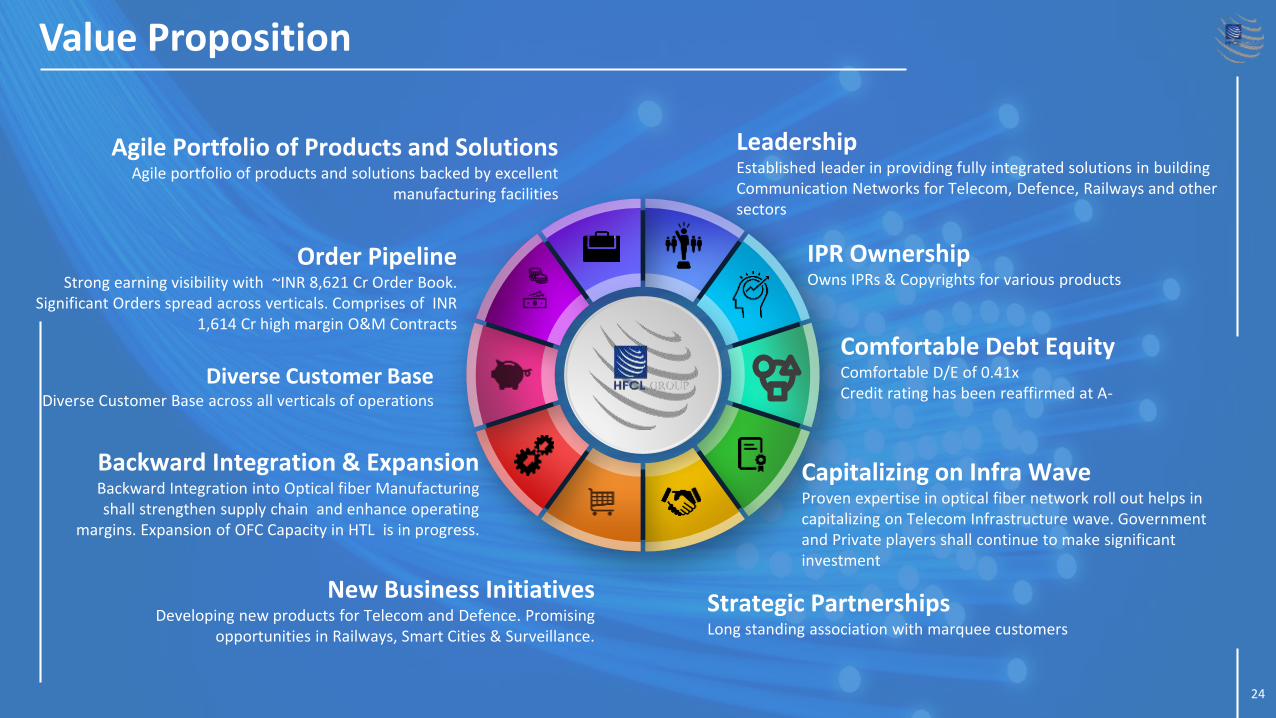
IPR OwnershipOwns IPRs & Copyrights for various products
Diverse Customer BaseDiverse Customer Base across all verticals of operations
Capitalizing on Infra WaveProven expertise in optical fiber network roll out helps in capitalizing on Telecom Infrastructure wave. Government and Private players shall continue to make significant investment
Strategic PartnershipsLong standing association with marquee customers
Backward Integration & ExpansionBackward Integration into Optical fiber Manufacturing shall strengthen supply chain and enhance operating
margins. Expansion of OFC Capacity in HTL is in progress.
New Business InitiativesDeveloping new products for Telecom and Defence. Promising
opportunities in Railways, Smart Cities & Surveillance.
Comfortable Debt EquityComfortable D/E of 0.41x Credit rating has been reaffirmed at A-
Order PipelineStrong earning visibility with ~INR 8,621 Cr Order Book.
Significant Orders spread across verticals. Comprises of INR 1,614 Cr high margin O&M Contracts
Agile Portfolio of Products and SolutionsAgile portfolio of products and solutions backed by excellent
manufacturing facilities
Value Proposition
24
LeadershipEstablished leader in providing fully integrated solutions in building Communication Networks for Telecom, Defence, Railways and other sectors
25
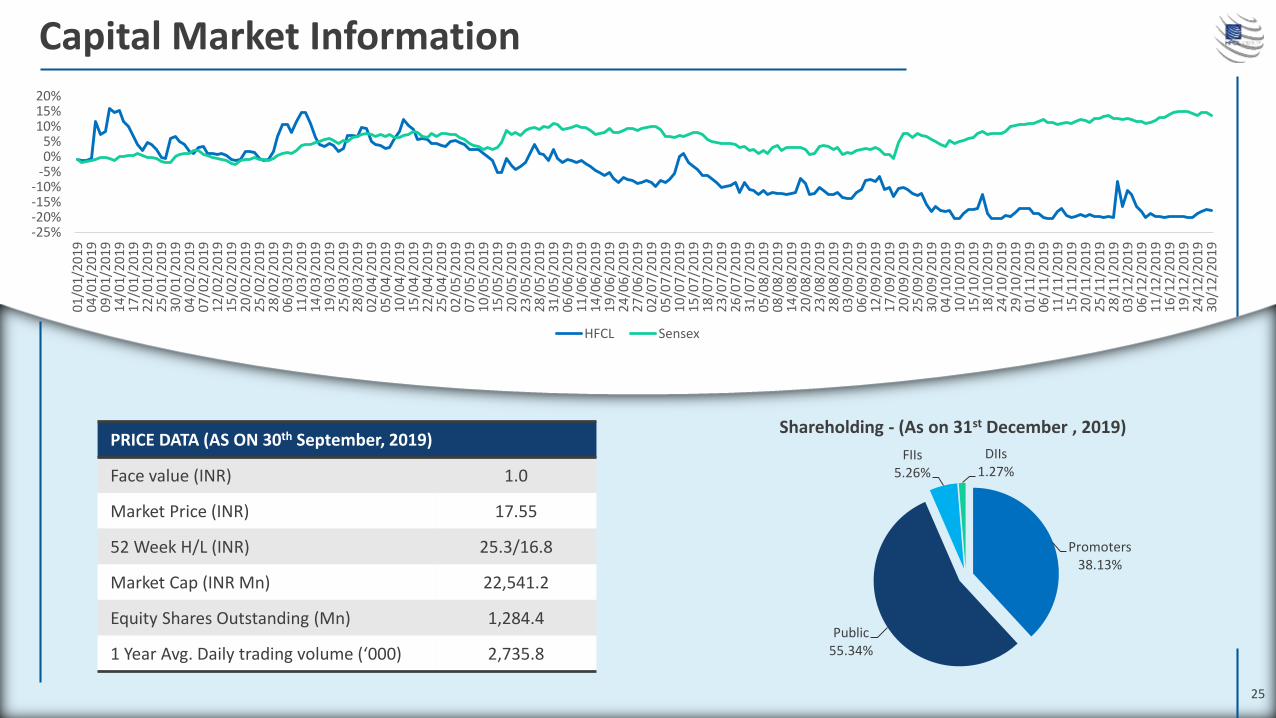
Capital Market Information
PRICE DATA (AS ON 30th September, 2019)
Face value (INR) 1.0
Market Price (INR) 17.55
52 Week H/L (INR) 25.3/16.8
Market Cap (INR Mn) 22,541.2
Equity Shares Outstanding (Mn) 1,284.4
1 Year Avg. Daily trading volume (‘000) 2,735.8
25
Promoters38.13%
Public55.34%
FIIs5.26%
DIIs1.27%
Shareholding - (As on 31st December , 2019)
-25%-20%-15%-10%
-5%0%5%
10%15%20%
01
/01
/20
19
04
/01
/20
19
09
/01
/20
19
14
/01
/20
19
17
/01
/20
19
22
/01
/20
19
25
/01
/20
19
30
/01
/20
19
04
/02
/20
19
07
/02
/20
19
12
/02
/20
19
15
/02
/20
19
20
/02
/20
19
25
/02
/20
19
28
/02
/20
19
06
/03
/20
19
11
/03
/20
19
14
/03
/20
19
19
/03
/20
19
25
/03
/20
19
28
/03
/20
19
02
/04
/20
19
05
/04
/20
19
10
/04
/20
19
15
/04
/20
19
22
/04
/20
19
25
/04
/20
19
02
/05
/20
19
07
/05
/20
19
10
/05
/20
19
15
/05
/20
19
20
/05
/20
19
23
/05
/20
19
28
/05
/20
19
31
/05
/20
19
06
/06
/20
19
11
/06
/20
19
14
/06
/20
19
19
/06
/20
19
24
/06
/20
19
27
/06
/20
19
02
/07
/20
19
05
/07
/20
19
10
/07
/20
19
15
/07
/20
19
18
/07
/20
19
23
/07
/20
19
26
/07
/20
19
31
/07
/20
19
05
/08
/20
19
08
/08
/20
19
14
/08
/20
19
20
/08
/20
19
23
/08
/20
19
28
/08
/20
19
03
/09
/20
19
06
/09
/20
19
12
/09
/20
19
17
/09
/20
19
20
/09
/20
19
25
/09
/20
19
30
/09
/20
19
04
/10
/20
19
10
/10
/20
19
15
/10
/20
19
18
/10
/20
19
24
/10
/20
19
29
/10
/20
19
01
/11
/20
19
06
/11
/20
19
11
/11
/20
19
15
/11
/20
19
20
/11
/20
19
25
/11
/20
19
28
/11
/20
19
03
/12
/20
19
06
/12
/20
19
11
/12
/20
19
16
/12
/20
19
19
/12
/20
19
24
/12
/20
19
30
/12
/20
19
HFCL Sensex
26
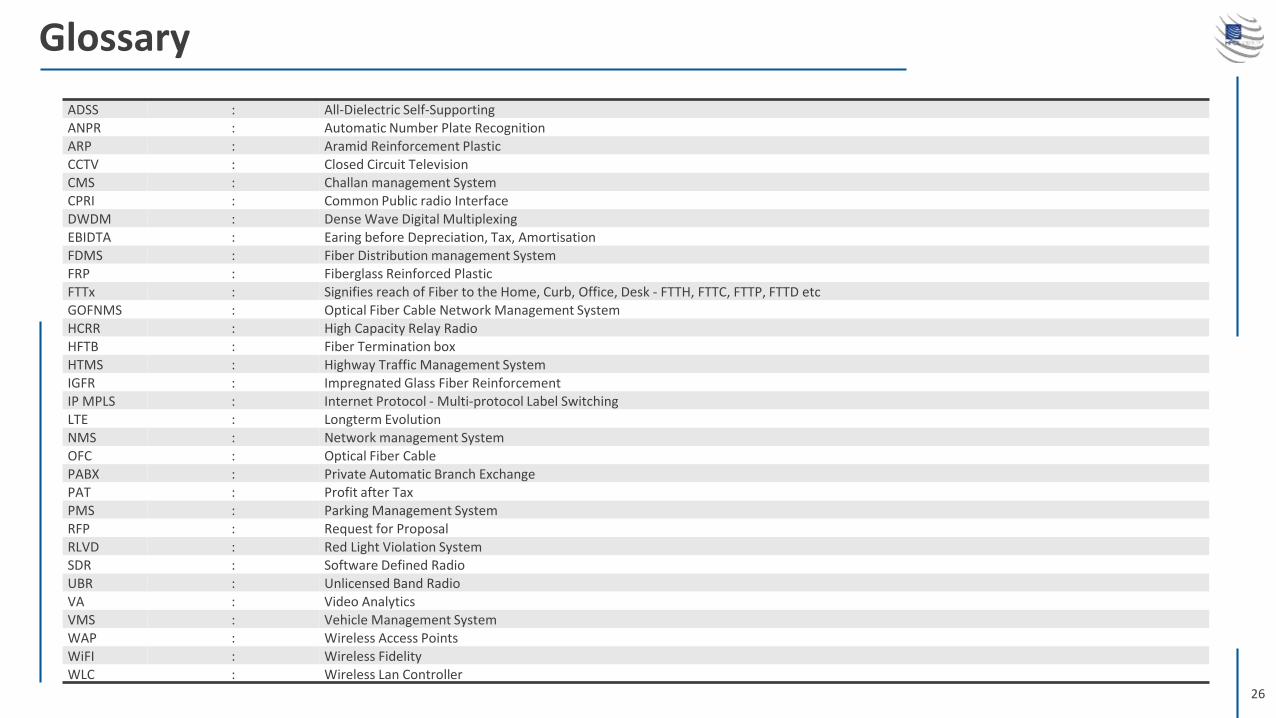
Glossary
ADSS : All-Dielectric Self-SupportingANPR : Automatic Number Plate RecognitionARP : Aramid Reinforcement PlasticCCTV : Closed Circuit TelevisionCMS : Challan management SystemCPRI : Common Public radio InterfaceDWDM : Dense Wave Digital MultiplexingEBIDTA : Earing before Depreciation, Tax, AmortisationFDMS : Fiber Distribution management SystemFRP : Fiberglass Reinforced PlasticFTTx : Signifies reach of Fiber to the Home, Curb, Office, Desk - FTTH, FTTC, FTTP, FTTD etcGOFNMS : Optical Fiber Cable Network Management SystemHCRR : High Capacity Relay RadioHFTB : Fiber Termination boxHTMS : Highway Traffic Management SystemIGFR : Impregnated Glass Fiber ReinforcementIP MPLS : Internet Protocol - Multi-protocol Label SwitchingLTE : Longterm EvolutionNMS : Network management SystemOFC : Optical Fiber CablePABX : Private Automatic Branch ExchangePAT : Profit after TaxPMS : Parking Management SystemRFP : Request for ProposalRLVD : Red Light Violation SystemSDR : Software Defined RadioUBR : Unlicensed Band RadioVA : Video AnalyticsVMS : Vehicle Management SystemWAP : Wireless Access PointsWiFI : Wireless FidelityWLC : Wireless Lan Controller
27
DisclaimerHFCL Limited
No representation or warranty, express or implied, is made as to, and no reliance should be placed on, the fairness, accuracy, completeness or correctness of the information or opinions contained in this presentation.Such information and opinions are in all events not current after the date of this presentation. Certain statements made in this presentation may not be based on historical information or facts and may be "forwardlooking statements" based on the currently held beliefs and assumptions of the management of HFCL Limited, which are expressed in good faith and in their opinion reasonable, including those relating to theCompany’s general businessplans and strategy, its future financial condition and growth prospects and futuredevelopments in its industry and its competitive and regulatory environment.Forward-looking statements involve known and unknown risks, uncertainties and other factors, which may cause the actual results, financial condition, performance or achievements of the Company or industryresults to differ materially from the results, financial condition, performance or achievements expressed or implied by such forward-looking statements, including future changes or developments in the Company’sbusiness, its competitive environment and political, economic, legal and social conditions. Further, past performance is not necessarily indicative of future results. Given these risks, uncertainties and other factors,viewers of this presentation are cautioned not to place undue reliance on these forward-looking statements. The Company disclaims any obligation to update these forward-looking statements to reflect future eventsor developments.This presentation is for general information purposes only, without regard to any specific objectives, financial situations or informational needs of any particular person. This presentation does not constitute an offeror invitation to purchase or subscribe for any securities in any jurisdiction, including the United States. No part of it should form the basis of or be relied upon in connection with any investment decision or any contractor commitment to purchase or subscribe for any securities. None of our securities may be offered or sold in the United States, without registration under the U.S. Securities Act of 1933, as amended, or pursuant to anexemption from registration there from.
This presentation is confidential and may not be copied or disseminated, in whole or in part, and in any manner.
Valorem Advisors Disclaimer:
Valorem Advisors is an Independent Investor Relations Management Service company. This Presentation has been prepared by Valorem Advisors based on information and data which the Company considersreliable, but Valorem Advisors and the Company makes no representation or warranty, express or implied, whatsoever, and no reliance shall be placed on, the truth, accuracy, completeness, fairness andreasonableness of the contents of this Presentation. This Presentation may not be all inclusive and may not contain all of the information that you may consider material. Any liability in respect of the contents of, orany omission from, this Presentation is expresslyexcluded.Valorem Advisors also herebycertifies that the directorsor employees of Valorem Advisors do not own any stock in personalor company capacity of the Company under review.
For further details, please feel free to contact our Investor Relations Representatives:
Mr. Anuj SonpalValorem AdvisorsTel: +91-22-4903 9500Email: [email protected]
Mr. Manoj Baid HFCL LimitedTel: +91-11-30886529Email: [email protected]