HENRIK EHRNROOTH, PRESIDENT&CEO SEPTEMBER 28, 2016 … · H1/2016 growth rates at historical...
35
KONE CMD 2016 Performing through accelerated differentiation HENRIK EHRNROOTH, PRESIDENT&CEO SEPTEMBER 28, 2016
Transcript of HENRIK EHRNROOTH, PRESIDENT&CEO SEPTEMBER 28, 2016 … · H1/2016 growth rates at historical...

KONE CMD 2016
Performing through accelerated differentiationHENRIK EHRNROOTH, PRESIDENT&CEO
SEPTEMBER 28, 2016

Agenda
Strong progress on manyfronts
Changing market dynamicsglobally
Developing KONE in a changing industry

Winning
with
customers

Strong progress on many fronts

Our profitable growth continued duringthe first half of the year
1–6/2016 1–6/2015Historical
changeComparable
change
Orders received MEUR 4,010.1 4,247.3 -5.6% -3.1%
Order book MEUR 8,763.6 8,627.4 1.6% 5.5%
Sales MEUR 4,020.9 3,901.2 3.1% 5.2%
Operating income (EBIT) MEUR 570.0 537.1 6.1%
Operating income (EBIT) % 14.2 13.8
Cash flow fromoperations
(before financing
items and taxes)
MEUR 699.0 638.2
Basic earnings per share EUR 0.90 0.80
5 September 28, 2016 Henrik Ehrnrooth | Capital Markets Day 2016 | © KONE Corporation
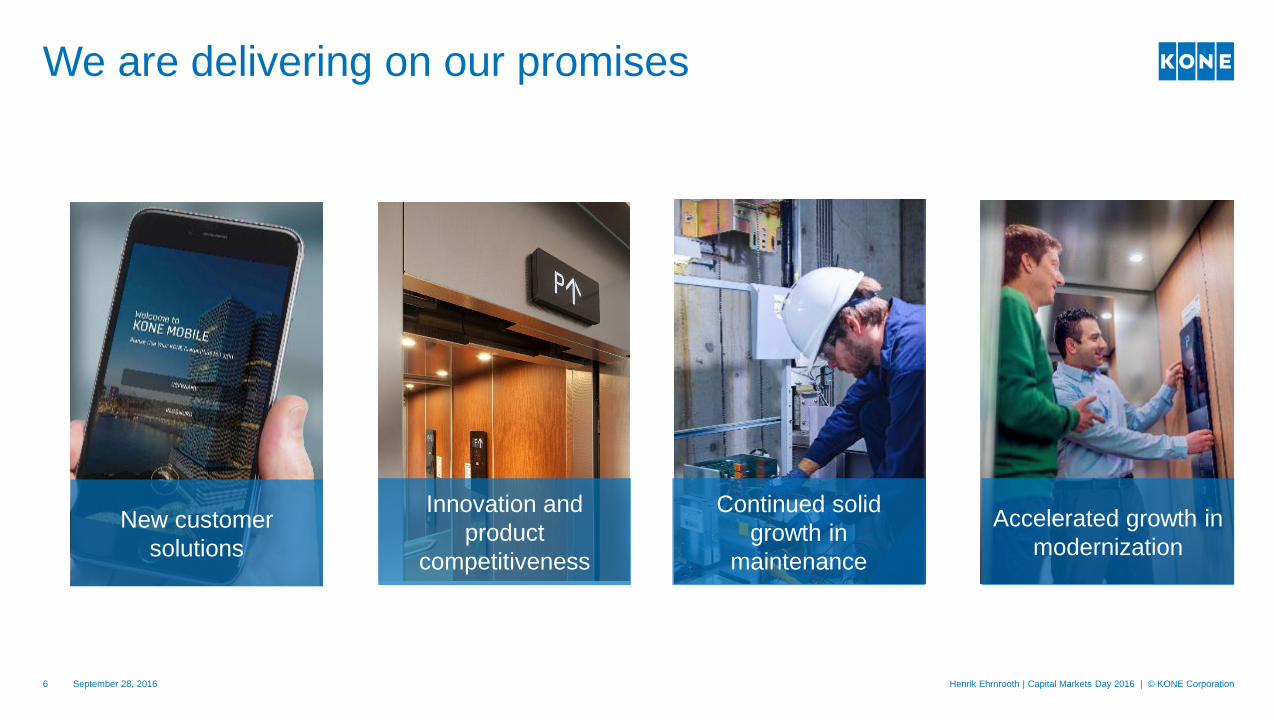
Continued solid
growth in
maintenance
Accelerated growth in
modernizationNew customer
solutions
Innovation and
product
competitiveness
We are delivering on our promises
September 28, 2016 Henrik Ehrnrooth | Capital Markets Day 2016 | © KONE Corporation6

Our proactive and systematic development has enabled a continuous strong performance
September 28, 2016 Henrik Ehrnrooth | Capital Markets Day 2016 | © KONE Corporation7
SALES EBIT AND CASH FLOW
570
725
699820
0
1,600
1,200
800
400
1,474
1,241
2014201320122011 2015
Cash flow before financing itemsEBIT
8,000
6,000
4,000
2,000
0
+15.5%
4,010
2015
7,959
2014201320122011
4,465
2,000
0
4,000
6,000
8,000
10,000
2011
5,225
4,021
2015
8,647
201420132012
13.4%
Orders received do not
include maintenance contracts.
ORDERS RECEIVED
MEURMEURMEUR
H1/2016 H1/2016 H1/2016
EBIT
CAGR
CAGR
CAGR
14.4%
15.8%
Cash Flow
CAGR
+3.1%
-5.6%
6.1%
H1/2016 growth rates at historical exchange rates

We have grown in all regions and businesses
September 28, 20168
6,000
4,000
2,000
0
10,000
8,000
55%
2015
8,647
44%
17%
39%
2011
5,225
18%
26%
Asia-PacificAmericasEMEA
CAGR, %
13.4%
3.9%
11.5%
28.8%
Henrik Ehrnrooth | Capital Markets Day 2016 | © KONE Corporation
4,000
6,000
10,000
8,000
2,000
0
46%
2015
8,647
31%
12%
57%
2011
5,225
37%
17%
ModernizationNew equipment Maintenance
CAGR, %
13.4%
4.9%
8.0%
19.8%
SALES BY REGION SALES BY BUSINESSMEUR MEUR

Most loyal
customers
Great place
to work
Faster
than
market
growth
Best
financial
developmentLeader in
sustainability
September 28, 2016 Henrik Ehrnrooth | Capital Markets Day 2016 | © KONE Corporation9
Clear progress towards our strategic targets
Increase in
customer loyalty
Higher employee
engagement
Continued new
equipment market
share growth
Continued margin
expansion
Decrease in relative
carbon footprint*
business
* tCO2 / MEUR sales
2011 2013 2015 2011 2013 2015 2011 2013 20152011 201520132013 20162011

Our development programs have contributed to the strong performance
September 28, 2016 Henrik Ehrnrooth | Capital Markets Day 2016 | © KONE Corporation10
First in Customer Loyalty
A Winning Team of
True Professionals
The Most Competitive
People Flow® Solutions
Preferred Maintenance Partner
Top Modernization Provider
HIGHLIGHTS OF THE DEVELOPMENT PROGRAMS
Communication and interactions based on customer needs led to improved
customer loyalty
More structured approach to people development is helping
our people perform at their best
New solutions responding to customer needs have driven market share growth
Continued good growth and increased investments in new value-adding services
Acceleration in growth enabled by better sales management
2014-2016

0.90
1.40
1.30
1.20
1.10
1.00
0
0.80
0.70
0.60
0.50
0.40
0.30
0.20
0.10
CAGR +15%
2015
1.40
2014
1.20
2013
1.00
2012
0.88
20
11
0.70
2010
0.45
2009
2008
2007
0.33
2006
2005
2004
2003
0.252002
0.192001
0.092000
0.06
1999
0.04
1998
1997
1996
1995
1994
1993
1992
1991
1990
1989
0.02
1988
0.02
1987
0.01
1986
1985
1984
1983
1982
1981
1980
0.01
Split-adjusted dividend per class B share, EUR,1980–2015
Note: Includes the basic dividend. Adjusted for share splits in 1999 (1:3), 2002 (1:3), 2005 (1:2), 2008 (1:2) and 2013 (1:2). 1 EUR= 5.9 FIM; not adjusted to constant exchange rate.
Additional extraordinary dividends: for 2009, a double dividend was paid; for 2011, an extraordinary dividend of EUR 0.75 was paid and for 2012, an extraordinary dividend of EUR 0.65 was paid.
September 28, 201611 Henrik Ehrnrooth | Capital Markets Day 2016 | © KONE Corporation
Our strong financial development has enableda steadily increasing dividend

Market outlook in 2016 (unchanged)
September 28, 2016 Henrik Ehrnrooth | Capital Markets Day 2016 | © KONE Corporation12
Asia-Pacific: The market in China is expected to decline by 5–10% in units ordered
and also the price competition to continue intense. In the rest of Asia-Pacific, the
market is expected to see some growth.
Europe, Middle East and Africa: the market is expected to grow slightly with growth
in Central and North Europe and a more stable development in South Europe and
the Middle East.
North America: the market is expected to see some growth.
The maintenance markets are expected to see the strongest growth rate in Asia-
Pacific, and to develop rather well also in other regions.
NEW EQUIPMENT MARKETS
MAINTENANCE MARKETS
The modernization market is expected to grow slightly in Europe, to continue to grow in
North America, and to develop strongly in Asia-Pacific.
MODERNIZATION MARKETS

Business outlook in 2016 (unchanged)
KONE’s net sales is estimated to grow by 2–6% at
comparable exchange rates as compared to 2015.
September 28, 2016 Henrik Ehrnrooth | Capital Markets Day 2016 | © KONE Corporation13
The operating income (EBIT) is expected to be in the range
of EUR 1,250–1,330 million, assuming that translation
exchange rates would remain at approximately the average
level of January–June 2016.
SALES
OPERATING INCOME

Henrik Ehrnrooth | Capital Markets Day 2016 | © KONE Corporation14
Going into 2017, there will be both headwinds and tailwinds impacting our result
Improvements in product
competitiveness
Strong operating performance
on a broad basis
Acceleration of growth in
maintenance and modernization
globally
Increasing investments
into long-term competitiveness
Slowing market and price
competition in China
Less favorable translation
exchange rates
Boosting our performance Burdening our result
September 28, 2016

Our long-term financial targets remain intact
September 28, 2016 Henrik Ehrnrooth | Capital Markets Day 2016 | © KONE Corporation15
Growth
Profitability
Cash flow
Faster than market growth
16% EBIT margin
Improved working capital rotation

Changing market dynamics globally

The market dynamics have changed with North America and EMEA now showing the most positive development
17
ASIA-PACIFICEMEA NORTH AMERICA
GLOBAL
Henrik Ehrnrooth Capital Markets Day 2016 | © KONE Corporation
New
equipmentServices
Maintenance Modernization
New
equipmentServices
Maintenance Modernization
New
equipmentServices
Maintenance ModernizationChina Ex-China
New
equipmentServices
Maintenance Modernization
September 28, 2016
18
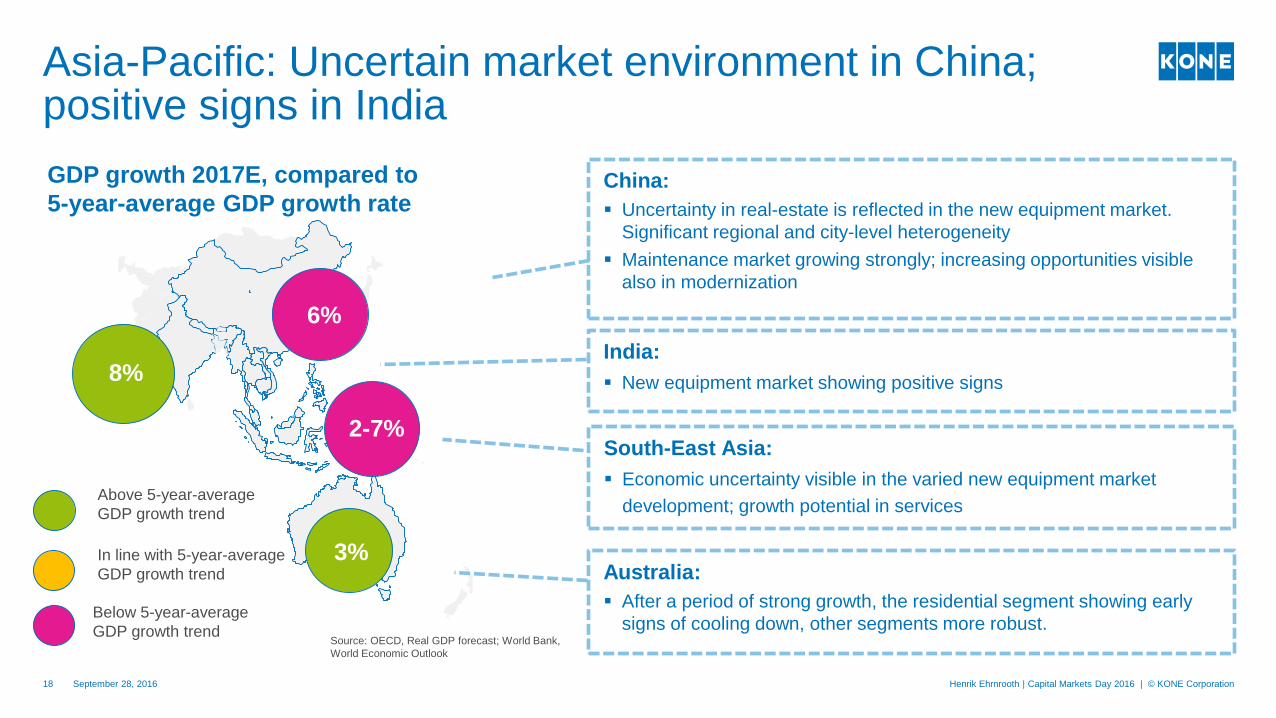
Asia-Pacific: Uncertain market environment in China; positive signs in India
September 28, 2016 Henrik Ehrnrooth | Capital Markets Day 2016 | © KONE Corporation
GDP growth 2017E, compared to
5-year-average GDP growth rateChina:
Uncertainty in real-estate is reflected in the new equipment market.
Significant regional and city-level heterogeneity
Maintenance market growing strongly; increasing opportunities visible
also in modernization
India:
New equipment market showing positive signs
South-East Asia:
Economic uncertainty visible in the varied new equipment market
development; growth potential in services
Australia:
After a period of strong growth, the residential segment showing early
signs of cooling down, other segments more robust.
2-7%
3%
8%
6%
Below 5-year-average
GDP growth trend
Above 5-year-average
GDP growth trend
Source: OECD, Real GDP forecast; World Bank,
World Economic Outlook
In line with 5-year-average
GDP growth trend
19
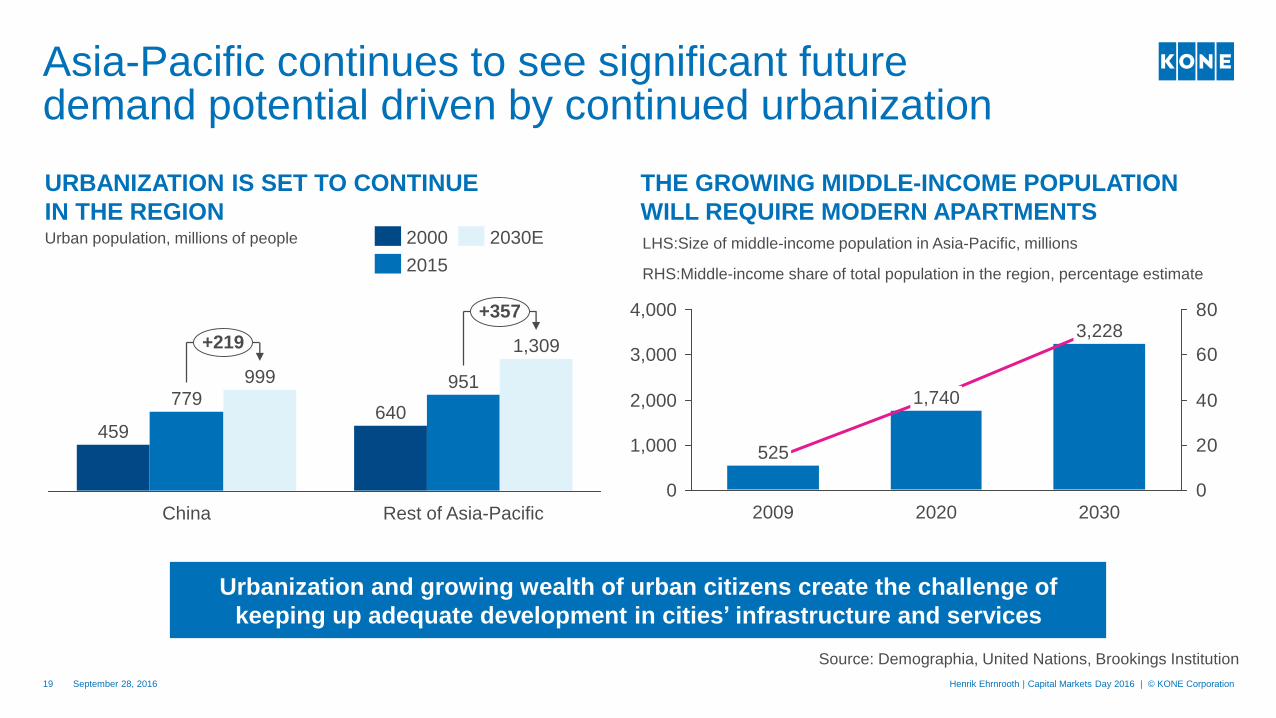
Asia-Pacific continues to see significant futuredemand potential driven by continued urbanization
September 28, 2016 Henrik Ehrnrooth | Capital Markets Day 2016 | © KONE Corporation
URBANIZATION IS SET TO CONTINUE
IN THE REGIONUrban population, millions of people
THE GROWING MIDDLE-INCOME POPULATION
WILL REQUIRE MODERN APARTMENTS
Urbanization and growing wealth of urban citizens create the challenge of
keeping up adequate development in cities’ infrastructure and services
Source: Demographia, United Nations, Brookings Institution
+357
+219
Rest of Asia-Pacific
1,309
951
640
China
999
779
459
2015
2030E2000 LHS:Size of middle-income population in Asia-Pacific, millions
0
20
40
60
80
3,000
2,000
1,000
4,000
0
1,740
2020
525
2009 2030
3,228
RHS:Middle-income share of total population in the region, percentage estimate
20
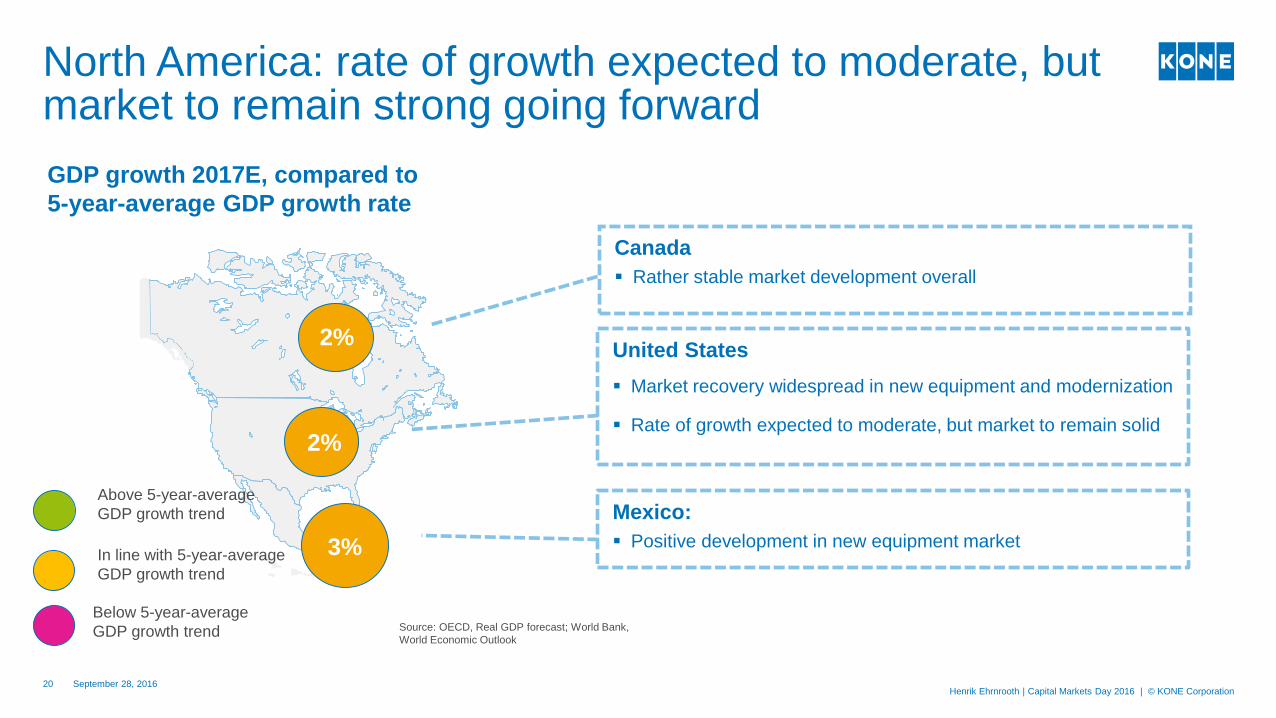
North America: rate of growth expected to moderate, butmarket to remain strong going forward
September 28, 2016Henrik Ehrnrooth | Capital Markets Day 2016 | © KONE Corporation
United States
Market recovery widespread in new equipment and modernization
Rate of growth expected to moderate, but market to remain solid
Mexico:
Positive development in new equipment market
Canada
Rather stable market development overall
2%
2%
3%
GDP growth 2017E, compared to
5-year-average GDP growth rate
Source: OECD, Real GDP forecast; World Bank,
World Economic Outlook
Below 5-year-average
GDP growth trend
Above 5-year-average
GDP growth trend
In line with 5-year-average
GDP growth trend

21
EMEA: European markets are on averagemore positive than a year ago
September 28, 2016 Henrik Ehrnrooth | Capital Markets Day 2016 | © KONE Corporation
Central and North Europe:
Pick-up in new equipment and modernization demand
Market sentiment broadly neutral or upbeat
South Europe:
Stabilization and recovery from low levels both in new
equipment and modernization
The Middle East:
Market sentiment affected by uncertainty in the region; overall
development still rather stable at a good level2-4%
Markets in Africa
Small markets in the near-term; in the long-term increasingly
interesting opportunities
Source: OECD, Real GDP forecast; World Bank,
World Economic Outlook
GDP growth 2017E, compared to
5-year-average GDP growth rate
1-3%
1-2%
Below 5-year-average
GDP growth trend
Above 5-year-average
GDP growth trend
In line with 5-year-average
GDP growth trend

22
Europe and North America: evolving demographics and changing living preferences
September 28, 2016 Henrik Ehrnrooth | Capital Markets Day 2016 | © KONE Corporation
NUMBER OF HOUSEHOLDS
INCREASING
CORE CITIES ARE GROWING BUILDINGS ARE AGING
%-share of single-person households
2014 and 2030E
949
1,278
London
1,039
Paris New
York
1,294
Los
Angeles
Absolute population growth
2014-2030E, thousands
35%
46%41%
Netherlands
29%
39%
United
Kingdom
France
37%
2014 2030E
Age of European residential dwellings
20
40
60
0
27-37 47-7017-27 >70<17
years
37-47
Millions of dwelling units
Source; UN,OECD, Eurostat, Entranze
Affordability of apartments and aging infrastructure key concerns in urban areas
September 28, 2016 Henrik Ehrnrooth | Capital Markets Day 2016 | © KONE Corporation23
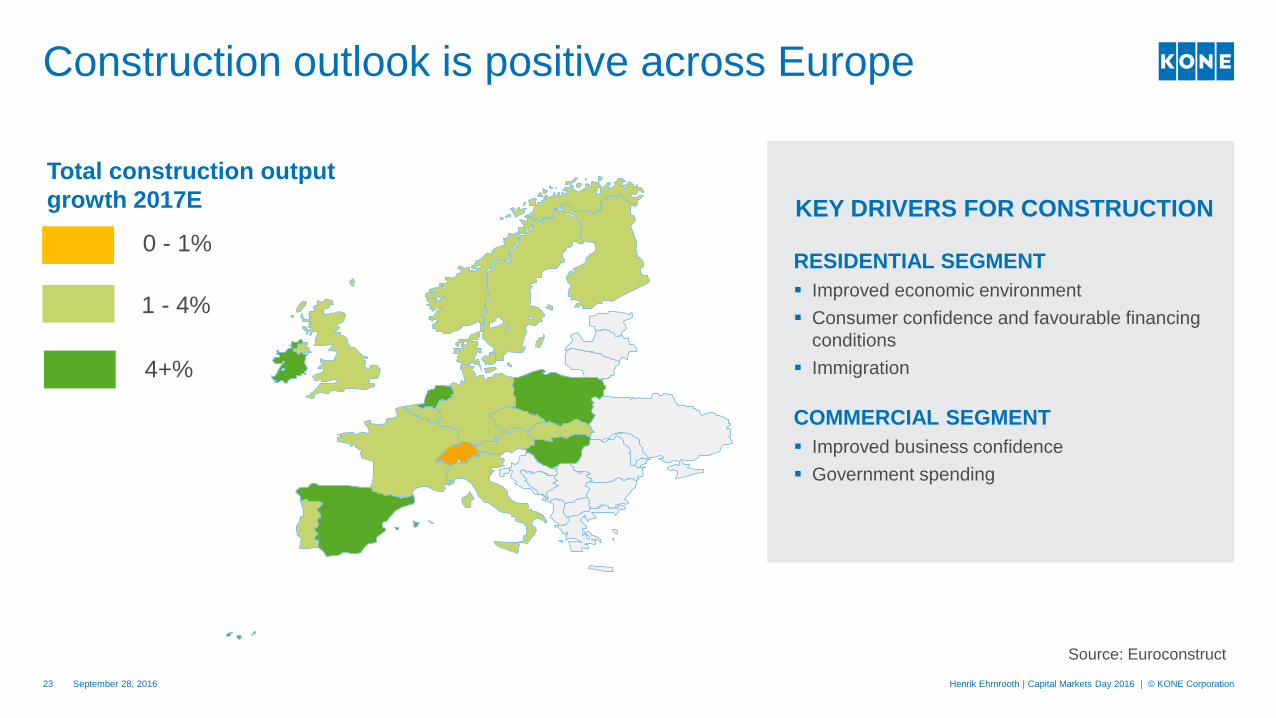
Construction outlook is positive across Europe
0 - 1%
1 - 4%
4+%
Total construction output
growth 2017E
Source: Euroconstruct
KEY DRIVERS FOR CONSTRUCTION
RESIDENTIAL SEGMENT
Improved economic environment
Consumer confidence and favourable financing
conditions
Immigration
COMMERCIAL SEGMENT
Improved business confidence
Government spending

September 28, 2016 Henrik Ehrnrooth | Capital Markets Day 2016 | © KONE Corporation24
The majority of our business has a growth outlook
Two thirds of our business has
a growth outlook GROWTH MARKETS
Maintenance: increasing service opportunity in Asia-Pacific, in
China in particular. Solid maintenance business in the more mature
markets
Modernization: mature markets showing positive signs in demand;
increasing opportunities in Asia-Pacific
New equipment outside China: many regional opportunities,
Europe and North America in particular showing improving demand
NON-GROWTH MARKETS
China new equipment: market declining; long-term drivers remain
solid
Maintenance
Modernization
New equipment
ex-China
China new
equipment

Developing KONE in a changing industry

Urbanization drives growth
Technological disruption
drives need for change

Needs for urban livingWE ADDRESS THESE NEEDS TO CREATE MORE VALUE
September 28, 201627
Well being
and
happiness
Growing
building
intelligence
Eco-
efficiency and
sustainability
Improving
living
standards and
convenience
Safe,
reliable,
efficient
infrastructure
Affordable
vertical
housing

September 28, 2016 Henrik Ehrnrooth | Capital Markets Day 2016 | © KONE Corporation28
We understand People Flow in and between
buildings, making people’s journeys safe,
convenient and reliable
We make cities better places to live
At KONE, our mission is to improve the flowof urban life
OUR MISSION
KONE delivers the best People Flow
®
experience
We provide Ease, Effectiveness and
Experiences to users and customers, over
the full life cycle of buildings
OUR VISION

Our strong market position provides a good starting point for future development, in services in particular
September 28, 2016 Henrik Ehrnrooth | Capital Markets Day 2016 | © KONE Corporation29
2015 market position,
KONE’s estimate
EMEANorth
AmericaChina
Rest of Asia-Pacific
New equipment#2
shared
#3 #1 #1
Maintenance#3 #4
shared
#1 #2

September 28, 2016 Henrik Ehrnrooth | Capital Markets Day 2016 | © KONE Corporation30
In modernization, we have improved growth by moreproactive work with our customers
2011 20132012 H1/20162014
+4.9%
2015
Offer better value for the customer
Faster customer response and better cost
efficiency
Creating demand and targeting the right
opportunities
Sales development in modernization What have we done
Consultative sales management approach
CAGR
+17.7% vs.
H1/2015*
* At historical currencies

We have gained a deeper insight into our customerneeds which helps us differentiate further in services
September 28, 2016 Henrik Ehrnrooth | Capital Markets Day 2016 | © KONE Corporation31
Understand customer needs
and competition
Define our unique promise to
all customers
Deliver on the promiseto our customers
Show our customers that we
have delivered on our promise
High loyalty
and premium
value
Significant innovation in technological enablers to deliver on our promise

Ease, Effectiveness and Experiences to users and customers
Better communication:
KONE Mobile & Online
Customer productivity:
Architect toolbox
Connected customers
Increased business value
Uptime: condition-based
maintenance
Faster resolution times:
remote diagnostics
Connected equipment
Efficient People Flow
Mobility tools for field
collaboration and
productivity
Connected employees
Collaboration & efficiency
Personalized
experience: RemoteCall,
People Flow
Intelligence solutions
Connected users
Personalized experience
Henrik Ehrnrooth | Capital Markets Day 2016 | © KONE Corporation32
We continue to invest in connectivity and mobility to enable the delivery of new and better services
Technological enablers: Connectivity, IoT cloud and cognitive analytics
Connecting an additional >1m equipment to the cloud
September 28, 2016

In new equipment, we are taking a more holistic approachto working with our customers to deliver added value
September 28, 2016 Henrik Ehrnrooth | Capital Markets Day 2016 | © KONE Corporation33
ECONOMIES OF SCALE
DIFFERENTIATED AND
COMPETITIVE PRODUCT
OFFERING
STRONGER SUPPORT IN
PLANNING AND
DELIVERY
Continue actions on
product competitiveness
Best support for our
customers throughout
planning and construction
Differentiate further by
offering solutions based on
specific customer needs
We will focus on continued service acceleration and newequipment leadership
Accelerated investments to bring new solutions faster to our
customers and users
Stronger differentiation by providing services and solutions
tailored to our customers’ needs
Strong performance on a broad basis
Good growth opportunities in multiple geographies