Henelius, Andreas; Torniainen, Jari MIDAS
7
This is an electronic reprint of the original article. This reprint may differ from the original in pagination and typographic detail. Powered by TCPDF (www.tcpdf.org) This material is protected by copyright and other intellectual property rights, and duplication or sale of all or part of any of the repository collections is not permitted, except that material may be duplicated by you for your research use or educational purposes in electronic or print form. You must obtain permission for any other use. Electronic or print copies may not be offered, whether for sale or otherwise to anyone who is not an authorised user. Henelius, Andreas; Torniainen, Jari MIDAS Published in: SoftwareX DOI: 10.1016/j.softx.2018.04.004 Published: 01/01/2018 Document Version Publisher's PDF, also known as Version of record Published under the following license: CC BY Please cite the original version: Henelius, A., & Torniainen, J. (2018). MIDAS: Open-source framework for distributed online analysis of data streams. SoftwareX, 7, 156-161. https://doi.org/10.1016/j.softx.2018.04.004
Transcript of Henelius, Andreas; Torniainen, Jari MIDAS

This is an electronic reprint of the original article.This reprint may differ from the original in pagination and typographic detail.
Powered by TCPDF (www.tcpdf.org)
This material is protected by copyright and other intellectual property rights, and duplication or sale of all or part of any of the repository collections is not permitted, except that material may be duplicated by you for your research use or educational purposes in electronic or print form. You must obtain permission for any other use. Electronic or print copies may not be offered, whether for sale or otherwise to anyone who is not an authorised user.
Henelius, Andreas; Torniainen, JariMIDAS
Published in:SoftwareX
DOI:10.1016/j.softx.2018.04.004
Published: 01/01/2018
Document VersionPublisher's PDF, also known as Version of record
Published under the following license:CC BY
Please cite the original version:Henelius, A., & Torniainen, J. (2018). MIDAS: Open-source framework for distributed online analysis of datastreams. SoftwareX, 7, 156-161. https://doi.org/10.1016/j.softx.2018.04.004
SoftwareX 7 (2018) 156–161
Contents lists available at ScienceDirect
SoftwareX
journal homepage: www.elsevier.com/locate/softx
Original software publication
MIDAS: Open-source framework for distributed online analysis ofdata streamsAndreas Henelius a,b,*, Jari Torniainen a,c
a Finnish Institute of Occupational Health, Helsinki, Finlandb Department of Computer Science, Aalto University, Helsinki, Finlandc Department of Applied Physics, University of Eastern Finland, Kuopio, Finland
a r t i c l e i n f o
Article history:Received 11 January 2016Received in revised form 12 April 2018Accepted 16 April 2018
Keywords:Data streamsOnline analysisDistributed systemsMachine learning
a b s t r a c t
Data streams are pervasive but implementing online analysis of streaming data is often nontrivial asdata streams can have different, domain-specific formats. Regardless of the stream, the analysis task isessentially the same: features are extracted from the stream, e.g., to employ machine learning and dataminingmethods.Wepresent theModular IntegratedDistributedAnalysis System (midas) for constructingdistributed online stream processing systems for heterogeneous data. The midas framework makes itpossible to process raw data streams, extract features, perform machine learning and make the resultsavailable through anHTTPAPI for easy integrationwith various applications.midas is agnosticwith regardto the type of data stream and is suitable for multiple domains.
© 2018 The Authors. Published by Elsevier B.V. This is an open access article under the CC BY license(http://creativecommons.org/licenses/by/4.0/).
Code metadata
Current code version v1.1.0Permanent link to code/repository used of this code version https://github.com/ElsevierSoftwareX/SOFTX-D-16-00010Legal Code License MIT (http://opensource.org/licenses/MIT)Code versioning system used gitSoftware code languages, tools, and services used Python3.4+Compilation requirements, operating environments & dependencies &Compilers:
Operating systems: Linux, Windows, OS X. Python modules: Bottle,PyZMQ, Waitress, PyLSL
If available Link to developer documentation/manual https://github.com/bwrc/midas/wikiSupport email for questions [email protected], [email protected]
1. Introduction and significance
Devices in the Internet of Things (IoT) are found in various fields,e.g., in healthcare [1] or in environmental and agricultural applica-tions [2]. IoT is also relevant in Human–Computer Interaction (HCI)(e.g., biosignals for controlling user interfaces).
Many IoT data streams are time series signals with a volumeranging from one channel sampled at 1 Hz (e.g., a temperaturesensor) to 16 channels of electroencephalographic (EEG) datasampled at 500 Hz. Time series must be processed sequentiallysample-by-sample in contrast to batch processing of data, wherethe processing order of data items is less important. Regardless
* Corresponding author at: Department of Computer Science, Aalto University,Helsinki, Finland.
E-mail addresses: [email protected] (A. Henelius),[email protected] (J. Torniainen).
of the source of data streams, potentially important informationcan be extracted from them. Data streams in different domainshave varying properties, but the data processing task is essentiallyidentical: features of interest are extracted from the streams andused in decisionmaking. There is hence a need for streamprocessingsystems for online extraction and analysis of streaming signals,that can handle various data formats and high data rates. Since atypical task is to simultaneously collect data frommultiple sensorsthis suggests a distributed system for balancing the computationalload.
Current stream processing systems are either domain-specific(e.g., Brain–Computer Interface (BCI) frameworks such as BCI2000[3], OpenViBE [4] or BCILAB [5]) or automation systems (e.g., QIVI-CON (https://www.qivicon.com/) or EPICS (http://www.aps.anl.gov/epics/)). Such systems are monolithic and optimised for pro-cessing a small number of parallel data streams arriving at a high
https://doi.org/10.1016/j.softx.2018.04.0042352-7110/© 2018 The Authors. Published by Elsevier B.V. This is an open access article under the CC BY license (http://creativecommons.org/licenses/by/4.0/).
A. Henelius, J. Torniainen / SoftwareX 7 (2018) 156–161 157
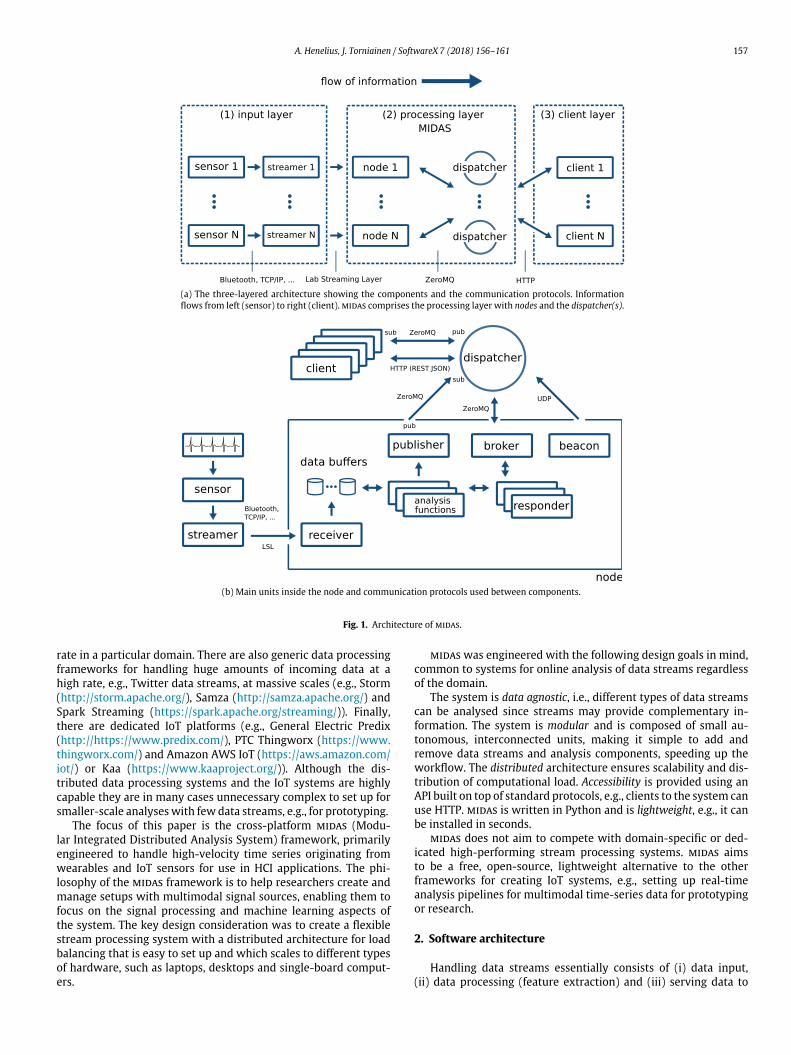
(a) The three-layered architecture showing the components and the communication protocols. Informationflows from left (sensor) to right (client).midas comprises the processing layer with nodes and the dispatcher(s).
(b) Main units inside the node and communication protocols used between components.
Fig. 1. Architecture of midas.
rate in a particular domain. There are also generic data processingframeworks for handling huge amounts of incoming data at ahigh rate, e.g., Twitter data streams, at massive scales (e.g., Storm(http://storm.apache.org/), Samza (http://samza.apache.org/) andSpark Streaming (https://spark.apache.org/streaming/)). Finally,there are dedicated IoT platforms (e.g., General Electric Predix(http://https://www.predix.com/), PTC Thingworx (https://www.thingworx.com/) and Amazon AWS IoT (https://aws.amazon.com/iot/) or Kaa (https://www.kaaproject.org/)). Although the dis-tributed data processing systems and the IoT systems are highlycapable they are in many cases unnecessary complex to set up forsmaller-scale analyseswith few data streams, e.g., for prototyping.
The focus of this paper is the cross-platform midas (Modu-lar Integrated Distributed Analysis System) framework, primarilyengineered to handle high-velocity time series originating fromwearables and IoT sensors for use in HCI applications. The phi-losophy of the midas framework is to help researchers create andmanage setups with multimodal signal sources, enabling them tofocus on the signal processing and machine learning aspects ofthe system. The key design consideration was to create a flexiblestream processing system with a distributed architecture for loadbalancing that is easy to set up and which scales to different typesof hardware, such as laptops, desktops and single-board comput-ers.
midaswas engineered with the following design goals in mind,common to systems for online analysis of data streams regardlessof the domain.
The system is data agnostic, i.e., different types of data streamscan be analysed since streams may provide complementary in-formation. The system is modular and is composed of small au-tonomous, interconnected units, making it simple to add andremove data streams and analysis components, speeding up theworkflow. The distributed architecture ensures scalability and dis-tribution of computational load. Accessibility is provided using anAPI built on top of standard protocols, e.g., clients to the system canuse HTTP. midas is written in Python and is lightweight, e.g., it canbe installed in seconds.
midas does not aim to compete with domain-specific or ded-icated high-performing stream processing systems. midas aimsto be a free, open-source, lightweight alternative to the otherframeworks for creating IoT systems, e.g., setting up real-timeanalysis pipelines for multimodal time-series data for prototypingor research.
2. Software architecture
Handling data streams essentially consists of (i) data input,(ii) data processing (feature extraction) and (iii) serving data to
158 A. Henelius, J. Torniainen / SoftwareX 7 (2018) 156–161
clients. Offloading these stages on multiple instances benefits theefficiency and flexibility of the system. This naturally suggests athree-layered design for the high-level architecture of the system(Fig. 1(a)); the input, processing and client layers. The flow ofinformation is from producers on the left to consumers on theright. midas comprises the middle processing layer connectingproducers and clients.
midas consists of nodes and dispatchers. The nodes are theprocessing units for the data streams and contain the signal pro-cessing, feature extraction and machine learning functionalities.Nodes process incoming data into metrics i.e., quantities derivedfrom one or several data streams. Data streams can be processedcontinuously or the node can produce results when requested bya client. Automatic broadcasting of results is also supported. Thedispatcher coordinates the communication between clients andnodes.
2.1. The input layer
The input layer consists of sensors and streamers. Sensors ac-quire signals and transmit them using an often vendor-specificprotocol over, e.g., Bluetooth, USB, or TCP/IP. Signals must be de-coupled from vendor-specific protocols before entering midas sogeneric analysis methods can be applied to the data.
The Lab Streaming Layer (LSL, https://github.com/sccn/labstreaminglayer) is a networked cross-platform protocol for trans-mission of time series. The LSL allows time synchronisation anddiscovery of the streams and is the primary data input format fromsensors to midas.
2.2. The processing layer
2.2.1. NodeThe nodes receive incoming data streams and perform high-
level operations on the data. A node is the main processing unitinmidas and the most complex component with multiple internalunits. All nodes share the architecture of Fig. 1(b).
Nodes can be of two main types, depending on their inputs:
• Primary nodes operate on raw signals and receive their datafrom sensors. Primary nodes are intended for preprocessingsignals and feature extraction from data streams.
• Secondary nodes utilise the processed information from pri-mary nodes and perform, e.g., machine learning tasks. Sec-ondary nodes may internally gather the data used for analy-sis, e.g., from user interface events in which case they do notdepend on external data streams.
The units inside the node are next described in greater detail.The receiver receives incoming data. For primary nodes, the
data is typically an LSL stream, whereas secondary nodes requestdata from primary nodes through the dispatcher. The incomingsignal is stored in a data container.
Data containers hold a set amount of incoming and processeddata, allowing calculations from a time window comprising thepast n seconds. Nodes can have two kinds of data containers:primary buffers for incoming raw signal data and secondary buffersfor arbitrary refined data, e.g., metrics calculated from data in theprimary data buffers. The containers are implemented as multi-channel circular bufferswith individually configurable parameters.
The broker receives messages from clients and performs load-balancing and routes incoming requests to an available responderallowing for concurrency.
A responder receives incoming requests and performs differ-ent tasks depending on the type of the message. The messaging
protocol is described in the midas API (https://github.com/bwrc/midas/wiki/API).
Each node has a UDP beacon broadcasting status information(IP address, port etc.) for initiating communication with the dis-patcher. The dispatcher listens for node beacons and uses theinformation in the messages to automatically add, remove andreconnect nodes.
The analysis functions represent the functional part of thenode, e.g., preprocessing, feature extraction and classification. Theanalysis functions are task-specific and must be implemented bythe user. The key design philosophy behind midas is to enable thedevelopment of analysis methods with minimal effort. The onlyrequirement is that the user must follow the defined format forhow data is passed to the analysis function, and it is therefore easyto use existing analysis functions inmidas. Analysis functions havethree modes of operation: (i) metric, (ii) process and (iii) publish.These are described in more detail below.
Metric functions are triggered by a request–reply pattern initi-ated by the client. Analysis functions receive the input data as afunction parameter and return a value passed back to the client.The API supports passing arguments to metric functions.
Process functions run continuously and typically read from pri-mary data buffers, process the data and push processed valuesinto secondary data buffers. Process functions are optimal forcontinuous computation of a specific variable, e.g., continuouslyextracting features from incoming data streams. This can be usefulif computations are slow, in which case the node may return thelast computed metric to the client reducing wait-time.
Publishing functions are similar to process functions and broad-cast messages using ZeroMQ (http://zeromq.org/). These functionscan also act as ‘‘watchdogs’’, publishing messages if certain condi-tions are met, e.g., if a metric exceeds a set threshold. The broad-casting is realised using a publisher–subscriber model, describednext.
The publisher–subscriber messaging model in midas canbroadcast a message, e.g., if the heart rate of the subject exceeds150 beats perminute (the contingent case) or broadcast the averageheart rate every five seconds (the continuous case). Clients can thenreceive data without requests but this requires client support forZeroMQ. All messages published by nodes are routed to clientsthrough the dispatcher.
2.2.2. DispatcherA distributed system is defined as a collection of multiple inde-
pendent computers that appears as one from the perspective of theuser [6]. midas follows a client–server architecture in which thedispatcher handles the bi-directional messaging between nodesand clients. The role of the dispatcher in midas is to simplify thecommunication patterns between components in the system, suchas node–node or node–client messaging. Hence, althoughmidas isdistributed it appears to client applications as one system, sinceall communication between clients and nodes goes through one(or more) dispatcher. Clients only need to communicate with adispatcher, which simplifies the configuration process since clientsonly need to be set up with the dispatcher address and can ignorethe full network topology. Multiple dispatchers can be used con-currently without inconsistency problems since a message from aclient to a node and back is routed through the same dispatcher.The added benefit of a multi-dispatcher topology is increasedrobustness, load balancing and redundancy against a single-point-of-failure.
Communication between clients and nodes takes place througha request–reply messaging pattern over HTTP initiated by theclient. The communication between the nodes and a dispatcheris realised using an internal messaging protocol implemented on
A. Henelius, J. Torniainen / SoftwareX 7 (2018) 156–161 159
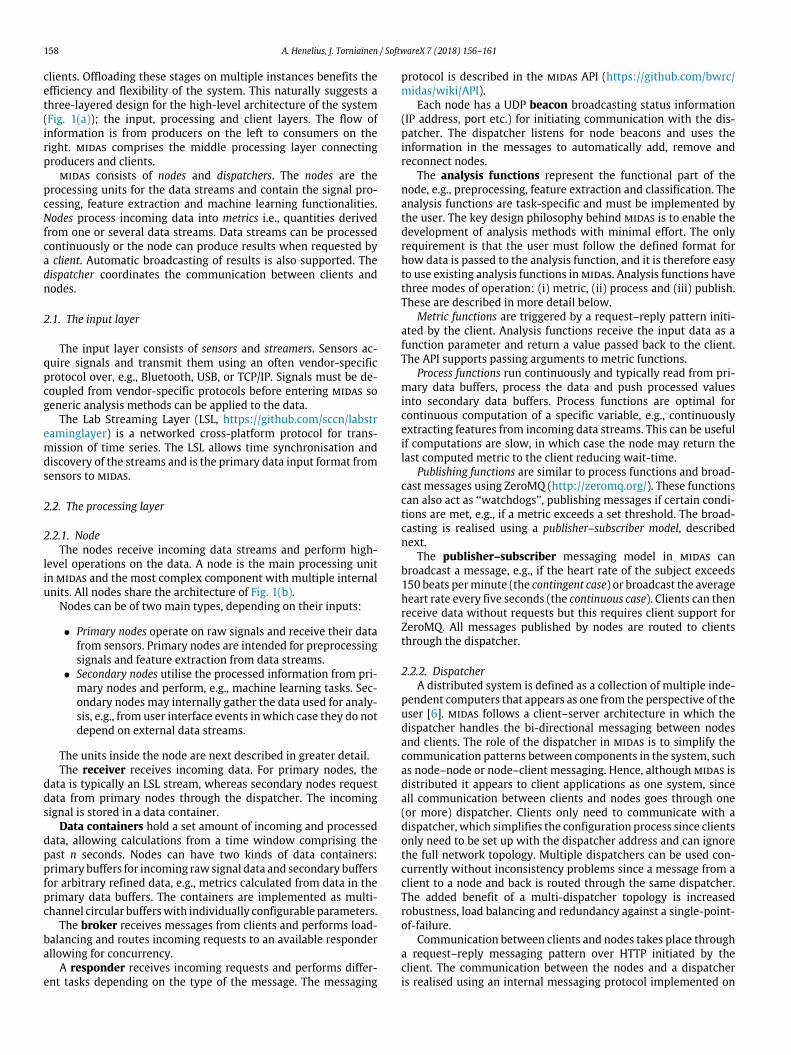
Fig. 2. Distribution of RTTs in amulti-clientmidas network using one (blue) and two (lilac) dispatchers. Upper and lower hinges in the Tukey-style box plot denote quantiles1 and 3 with themedian in themiddle. Whiskers denote the range of points within 3/2 times the interquartile range from the corresponding hinge. Outliers are marked withcircles. (For interpretation of the references to colour in this figure legend, the reader is referred to the web version of this article.)
top of ZeroMQ. These network communication protocols allowa distributed architecture where all midas components (nodes,clients and dispatchers), can be run on different computers.
2.2.3. Discovery of system topology and fault toleranceThe discovery of the system topology in midas is automatic
and based on the node beacons. Nodes can be added and removedduring run-time without reconfiguring the system. Automateddiscovery also adds reliability as the connection to a node in anoffline state can be automatically restored once the node becomesonline. The dispatcher can be configured to only communicatewith a subset of nodes, which can be used to partition nodes intomultiple midas networks, each with their own dispatchers.
Redundant and load-balanced system topologies where severalnodes perform identical tasks can be built using midas. A clientmay then request a metric from one of several nodes yielding thesame result. Running multiple dispatchers further increases thereliability, redundancy and balances the load.
2.2.4. Synchronisation and time accuracy of data streamsSynchronisation of data streams is especially important for
analyses utilising shared information between different datastreams. One way of accounting for network-related latencies isthe round-trip time (RTT) metric describing the network latencybetween the components and the time required to process therequest. In the LSL protocol each sample is time-stamped at thesource and the LSL can constantly measure the RTT between thestreamer and the receiving node. Network latencies calculatedfrom the RTT can then be used to synchronise data streams fromdifferent streamers. midas provides methods for determining theRTT between nodes and the dispatcher.
2.3. The client layer
The client layer interfaces with midas using an HTTP API, mak-ing it easy and flexible to request data from the midas network.Both requests and responses are in the JSON format.
3. System performance
The performance of stream processing systems, such as midas,is in general difficult to evaluate since performance is affectedby factors such as network topology, configuration of individualcomponents and the type and amount of data being processed.These factors all contribute to the overall latency of the system.
The latency of each request can roughly be attributed to the timefor routing the request and reply between the client and the targetnode, and to the processing time of the node.
To evaluate the performance of midas under normal operationconditions, we investigated the extreme case where a single nodereceives requests frommultiple clients: 1, 5, 25, 125, 250 and 500.We limit our investigation to the network latency of a ‘‘dummy’’node with ten responders and no processing capabilities. The per-formance test was performed using (i) one dispatcher and (ii) twodispatchers. The node and the dispatchers use ten responders andthreads for incoming queries, respectively. Each client contactsthe node in 100 ms intervals over a time period of 200 s. Thedistribution of round-trip-times (RTTs) was calculated from thelast 100 requests. The network used for testing consisted of fourcomputers (one for the node, two for the dispatchers and one forthe clients) connected using wired gigabit Ethernet. The testingsetup allowed determination of the network latency which canbe considered additive to the actual computational load of thenodes.
The results are displayed in Fig. 2. The medianRTTusing a singledispatcher is around 3mswhen the number of clients is 250. At 500clientswith onedispatcher, themedianRTT and standarddeviationincreases. Adding a second dispatcher balances the load and themedian RTTs remain stable.
4. An illustrative example
We demonstrate the typical usage of midas using a systemfor online determination of mental workload. The source code isomitted here for brevity, but the full source code for this andother examples can be found in the supplementarymaterial repos-itory (https://github.com/bwrc/midas-softwarex/). We use syn-thetically generated data (https://github.com/bwrc/lsltools) withone electrocardiogram (ECG) channel and two EEG channels. Thedata from about t = 20 s–70 s and t = 120 s–275 s (see Fig. 3(b))has a higher average heart rate and a higher brainbeat index [7].The decision rule for mental workload fuses average heart rateand the brainbeat index: if both metrics exceed a set level theworkload is ‘‘high’’, otherwise ‘‘low’’. As thresholds for the decisionruleweused 1.5 for brainbeat and 65 for the average heart rate. Thearchitecture is shown in Fig. 3(a). The signals are streamed fromthe sensors to primary processing nodes. The ECG node extractsaverage heart rate from the ECG signal and the EEG node calculatesthe brainbeat index. The client requests the average heart rate and

160 A. Henelius, J. Torniainen / SoftwareX 7 (2018) 156–161
(a) System architecture.
(b) The brainbeat index and average heart rate calculated by the node. The level of mental workload isshown in colour; lilac denotes ‘‘high’’ and white ‘‘low’’ workload.
Fig. 3. Mental workload calculation usingmidas. (For interpretation of the references to colour in this figure legend, the reader is referred to the web version of this article.)
brainbeat index from the past 5 s and outputs themental workloadclass (‘‘high’’ or ‘‘low’’). The result is shown in Fig. 3(b).
5. Impact
midas has been used in several projects for integrating onlinesignal analysis into different applications. midas has been usedto process EEG signals1 (refer to [8] for a demonstration of thisproject predating midas) and is a supported input protocol foreye data in an eye-tracking application [9]. midas was used todevelop a prototype showcasing adaptation of an informationseeking system based on psychophysiological metrics.2 midaswasdiscussed in a review of psychophysiological methods for HCI [10,Section 3.12]. Section 3.12 in that paperwaswritten by the presentauthors and discusses solutions for online signal processing. Amidas tutorial on online analysis of psychophysiological signalswas held in conjunction with the 4th International Workshop onSymbiotic Interaction.3 In 2015 midas was demonstrated at abooth in the Upgraded Life Festival in Helsinki. The Finnish In-stitute of Occupational Health participates in the Finnish DefenseForce’s Research Programme 2017–2020. The plan is to monitorphysiological activity online using midas on wearable computers.
We encourage users of midas to share their processing nodesby issuing pull requests to the repository https://github.com/bwrc/midas-nodes, so users working on similar research tasks can ben-efit from the open source nature of this project.
1 https://github.com/brains-on-art/brain-poetry.2 https://youtu.be/fYL2LlH5bcU.3 https://github.com/bwrc/midas-symbiotic2015.
6. Conclusions
midas is a modular and generic framework for online dis-tributed analysis of data streams, agnostic with regard to thetype of data streams. The system is suitable for multiple domains,i.e., midas has a high generic applicability. This, together with thelightweight and modular nature of midas allows rapid develop-ment of distributed applications.
midas provides a high-level abstraction allowing the user tofocus on implementing analysis functions without having to con-sider, e.g., communication patterns and data handling. midas iswell suited for research use, e.g., in human–computer interaction.
Acknowledgements
Thisworkwas supported by the Revolution of KnowledgeWorkproject, funded by Tekes (grants 40228/13 and 5159/31/2014) andby the Academy of Finland (decision 313513).
References
[1] Islam SR, Kwak D, Kabir MH, Hossain M, Kwak K-S. The internet of things forhealth care: A comprehensive survey. IEEE Access 2015;3:678–708.
[2] Meola A. Why IoT, big data & smart farming are the future of agriculture,Business Insider; 2016. http://www.businessinsider.com/internet-of-things-smart-agriculture-2016-10. [Accessed 20 May 2017].
[3] Schalk G, McFarland DJ, Hinterberger T, Birbaumer N, Wolpaw JR. BCI2000:a general-purpose brain-computer interface (BCI) system. IEEE Trans BiomedEng 2004;51(6):1034–43.
[4] Renard Y, Lotte F, Gibert G, Congedo M, Maby E, Delannoy V, Bertrand O,Lécuyer A. OpenViBE: an open-source software platform to design, test, anduse brain-computer interfaces in real and virtual environments. Presence:Teleoperators Virtual Environ. 2010;19(1):35–53.
[5] Kothe CA, Makeig S. BCILAB: a platform for brain–computer interface develop-ment. J Neural Eng 2013;10(5):056014.

A. Henelius, J. Torniainen / SoftwareX 7 (2018) 156–161 161
[6] TanenbaumAS, Van SteenM.Distributed systems: Principles and paradigms (2nded.). Prentice Hall.
[7] Holm A, Lukander K, Korpela J, Sallinen M, Müller KM. Estimating brain loadfrom the EEG. Sci World J 2009;9:639–51.
[8] Mäki-Reinikka K, Toivanen J, Alafuzoff A, Kotkanen H, Torniainen J. BrainPoetry; 2013. URL https://tuhat.helsinki.fi/portal/en/publications/brains-on-art-brain(c1d0ec58-5a66-4c07-811d-9c74e193f39d).html.
[9] Filetti M, Tavakoli HR, Ravaja N, Jacucci G. PeyeDF: an eye-tracking applicationfor reading and self-indexing research. Manuscript in preparation. https://github.com/HIIT/PeyeDF.
[10] Cowley B, Filetti M, Lukander K, Torniainen J, Henelius A, Ahonen L, Barral O,Kosunen I, Valtonen T, Huotilainen M, Ravaja N, Jacucci G. The psychophysiol-ogy primer: a guide to methods and a broad review with a focus on human–computer interaction. Found Trends Hum-Comput Interact 2016;9(3–4):151–308.


![midas DShop Auto-drafting Module for midas Gen 01 02admin.midasuser.com/UploadFiles2/84/Dshop_catalog.pdf · Auto-drafting Module for midas Gen [midas Gen Design Results] [midas DShop](https://static.fdocuments.us/doc/165x107/5ade06cd7f8b9a9a768db6e7/midas-dshop-auto-drafting-module-for-midas-gen-01-module-for-midas-gen-midas-gen.jpg)