
Hemstrom et al. State and Transition Models in the - Ecoshare
14
UNCORRECTED PROOF Please cite this article in press as: Hemstrom, M.A. et al., Integrated analysis of landscape management scenarios using state and transition models in the upper Grande Ronde River Subbasin, Oregon, USA, Landscape Urban Planning (2006), doi:10.1016/j.landurbplan.2006.10.004 ARTICLE IN PRESS +Model LAND 1405 1–14 Landscape and Urban Planning xxx (2006) xxx–xxx Integrated analysis of landscape management scenarios using state and transition models in the upper Grande Ronde River Subbasin, Oregon, USA 3 4 5 Miles A. Hemstrom a,∗ , James Merzenich b , Allison Reger c , Barbara Wales d 6 a USDA Forest Service, Pacific Northwest Research Station, Forestry Sciences Laboratory, P.O. Box 3890, Portland, OR 97208-3890, USA 7 b USDA Forest Service, Pacific Northwest Region, P.O. Box 3623, Portland, OR 97208-3623, USA 8 c USDA Forest Service, Willamette National Forest, Federal Building, 211 East 7th Avenue, P.O. Box 10607, Eugene, OR 97440, USA 9 d USDA Forest Service, Pacific Northwest Research Station, Forestry Sciences Laboratory, 1401 Gekeler Lane, LaGrande, OR 97850, USA 10 11 Abstract 12 We modeled the integrated effects of natural disturbances and management activities for three disturbance scenarios on a 178,000 ha landscape in the upper Grande Ronde Subbasin of northeast Oregon. The landscape included three forest environments (warm-dry, cool-moist, and cold) as well as a mixture of publicly and privately owned lands. Our models were state and transition formulations that treat vegetation change as probabilistic transitions among structure and cover types. We simulated background natural disturbance (i.e., historical), active fuel treatment, and fire suppression only disturbance scenarios for 200 or 500 years, depending on scenario. Several interesting landscape hypotheses emerge from our scenario simulations: (1) changes in management approach in landscapes the size of our study area may take decades to play out owing to the time required to grow large trees and the feedback loops among disturbances, (2) the current landscape is considerably different from that which might exist under a natural disturbance regime, (3) fire suppression alone does not mimic background natural disturbances and does not produce abundant large tree structure, and (4) dense, multi-layered large tree forests may be particularly difficult to maintain in abundance in this and similar landscapes owing to wildfire and insect disturbances. 13 14 15 16 17 18 19 20 21 22 © 2006 Published by Elsevier B.V. 23 Keywords: Landscape models; Landscape ecology; Historical range of variability; Forest structure; Forest disturbance; Pacific northwest; Interior northwest landscape analysis system 24 25 26 1. Introduction 1 Many questions regarding the management of diverse land- 2 scapes in the interior Pacific Northwest involve the combined 3 effects of natural disturbances and management activities on nat- 4 ural resource conditions. For example, how will fuel treatment 5 activities change wildfire occurrence and severity across large 6 landscapes, and what effect will these treatments have on other 7 resources? Are current vegetative conditions and associated 8 wildlife habitat characteristics sustainable? If existing vegeta- 9 tion were allowed to develop with either no management, or with 10 ∗ Corresponding author. Tel.: +1 503 808 2006; fax: +1 503 808 2020. E-mail addresses: [email protected] (M.A. Hemstrom), [email protected] (J. Merzenich), [email protected] (A. Reger), [email protected] (B. Wales). fire suppression only, how would this compare with historical 11 conditions? When considering management alternatives for a 12 particular landscape, what are the long-term effects of each 13 alternative on the vegetation? 14 Landscape simulation models address questions regarding 15 the reaction of large landscapes to various management and 16 policy scenarios (Bettinger et al., 1997, 1998; Hann et al., 1997; 17 Mladenoff and He, 1999; Graetz, 2000; USDA and USDI, 2000). 18 Advances in modeling techniques, computer technology, and 19 geographic information systems (GIS) have made it possible to 20 model large landscapes at increasingly finer scales of spatial 21 and temporal resolution (Barrett, 2001). In the past, resource 22 planning models have focused primarily on conifer succession 23 and management while representing other ecosystem elements 24 as byproducts (e.g., Johnson et al., 1986; Alig et al., 2000). 25 Although progress has been made in the formulation of multi- 26 objective goals in landscape simulations (e.g., Sessions et al., 27 1 0169-2046/$ – see front matter © 2006 Published by Elsevier B.V. 2 doi:10.1016/j.landurbplan.2006.10.004
Transcript of Hemstrom et al. State and Transition Models in the - Ecoshare

L
3
4
5
6
7
8
9
10
11
A12
iapfiotmal
13
14
15
16
17
18
19
20
21
22
©23
Ka
24
25
26
11
2
s3
e4
u5
a6
l7
r8
w9
t10
jb
1 02 d
D P
RO
OF
ARTICLE IN PRESS+ModelAND 1405 1–14
Landscape and Urban Planning xxx (2006) xxx–xxx
Integrated analysis of landscape management scenariosusing state and transition models in the upperGrande Ronde River Subbasin, Oregon, USA
Miles A. Hemstrom a,∗, James Merzenich b, Allison Reger c, Barbara Wales d
a USDA Forest Service, Pacific Northwest Research Station, Forestry Sciences Laboratory, P.O. Box 3890, Portland, OR 97208-3890, USAb USDA Forest Service, Pacific Northwest Region, P.O. Box 3623, Portland, OR 97208-3623, USA
c USDA Forest Service, Willamette National Forest, Federal Building, 211 East 7th Avenue, P.O. Box 10607, Eugene, OR 97440, USAd USDA Forest Service, Pacific Northwest Research Station, Forestry Sciences Laboratory, 1401 Gekeler Lane, LaGrande, OR 97850, USA
bstract
We modeled the integrated effects of natural disturbances and management activities for three disturbance scenarios on a 178,000 ha landscapen the upper Grande Ronde Subbasin of northeast Oregon. The landscape included three forest environments (warm-dry, cool-moist, and cold)s well as a mixture of publicly and privately owned lands. Our models were state and transition formulations that treat vegetation change asrobabilistic transitions among structure and cover types. We simulated background natural disturbance (i.e., historical), active fuel treatment, andre suppression only disturbance scenarios for 200 or 500 years, depending on scenario. Several interesting landscape hypotheses emerge fromur scenario simulations: (1) changes in management approach in landscapes the size of our study area may take decades to play out owing to theime required to grow large trees and the feedback loops among disturbances, (2) the current landscape is considerably different from that which
ight exist under a natural disturbance regime, (3) fire suppression alone does not mimic background natural disturbances and does not produce
TE
bundant large tree structure, and (4) dense, multi-layered large tree forests may be particularly difficult to maintain in abundance in this and similarandscapes owing to wildfire and insect disturbances.
2006 Published by Elsevier B.V.
eywords: Landscape models; Landscape ecology; Historical range of variability; Forest structure; Forest disturbance; Pacific northwest; Interior northwest landscape
fi 11
c 12
p 13
a 14
15
t 16
p 17
M 18
RR
ECnalysis system
. Introduction
Many questions regarding the management of diverse land-capes in the interior Pacific Northwest involve the combinedffects of natural disturbances and management activities on nat-ral resource conditions. For example, how will fuel treatmentctivities change wildfire occurrence and severity across largeandscapes, and what effect will these treatments have on other
UN
CO
Please cite this article in press as: Hemstrom, M.A. et al., Integrated anamodels in the upper Grande Ronde River Subbasin, Oregon, USA, Landsc
esources? Are current vegetative conditions and associatedildlife habitat characteristics sustainable? If existing vegeta-
ion were allowed to develop with either no management, or with
∗ Corresponding author. Tel.: +1 503 808 2006; fax: +1 503 808 2020.E-mail addresses: [email protected] (M.A. Hemstrom),
[email protected] (J. Merzenich), [email protected] (A. Reger),[email protected] (B. Wales).
A 19
g 20
m 21
a 22
p 23
aaAo
169-2046/$ – see front matter © 2006 Published by Elsevier B.V.oi:10.1016/j.landurbplan.2006.10.004
re suppression only, how would this compare with historicalonditions? When considering management alternatives for aarticular landscape, what are the long-term effects of eachlternative on the vegetation?
Landscape simulation models address questions regardinghe reaction of large landscapes to various management andolicy scenarios (Bettinger et al., 1997, 1998; Hann et al., 1997;ladenoff and He, 1999; Graetz, 2000; USDA and USDI, 2000).dvances in modeling techniques, computer technology, andeographic information systems (GIS) have made it possible toodel large landscapes at increasingly finer scales of spatial
nd temporal resolution (Barrett, 2001). In the past, resourcelanning models have focused primarily on conifer succession
lysis of landscape management scenarios using state and transitionape Urban Planning (2006), doi:10.1016/j.landurbplan.2006.10.004
nd management while representing other ecosystem elements 24
s byproducts (e.g., Johnson et al., 1986; Alig et al., 2000). 25
lthough progress has been made in the formulation of multi- 26
bjective goals in landscape simulations (e.g., Sessions et al., 27

IN+ModelL
2 nd U
128
l29
d30
p31
d32
a33
fi34
a35
v36
n37
t38
a39
240
41
142
o43
(44
t45
o46
(47
(48
d49
a50
f 51
e 52
s 53
f 54
55
w 56
b 57
i 58
( 59
a 60
t 61
D 62
d 63
2 64
i 65
t 66
t 67
68
h 69
u 70
c 71
ARTICLEAND 1405 1–14
M.A. Hemstrom et al. / Landscape a
999; Wedin, 1999), there remain many challenges to buildingandscape planning models that include all of the importantisturbance processes that influence change. For example,revious efforts have often not included widespread, chronicisturbances such as ungulate herbivory. Of particular interestre the net, synergistic effects of various disturbances (e.g.,re, insects, management activities, and large herbivores) acrosslarge ecologically diverse landscape. Our approach treats
egetation as discrete types and management activities andatural disturbance as transitions among those types to projecthe long-term net effects of alternative management scenarioscross a large landscape.
. Study area
The upper Grande Ronde Subbasin occupies approximately78,000 ha of mixed forest and rangelands on the eastern flankf the Blue Mountains southwest of La Grande, Oregon, USAFig. 1). The majority of the area (122,114 ha) is managed byhe USDA Forest Service with the remaining land in mixedwnerships. Most of the remaining land is in private ownership
UN
CO
RR
EC
TED
Please cite this article in press as: Hemstrom, M.A. et al., Integrated anamodels in the upper Grande Ronde River Subbasin, Oregon, USA, Landsc
53,551 ha), with smaller amounts of tribal (1373 ha), and state885 ha) lands. The topography is varied and complex, witheeply dissected drainages feeding into the Grande Ronde Rivers it runs north through the center of the area. Vegetation ranges
beoS
Fig. 1. The upper Grande Ronde Subbasin
OO
F
PRESSrban Planning xxx (2006) xxx–xxx
rom dry bunchgrass-dominated communities at the lower, northnd of the drainage, to high-elevation conifer forests at theouthern end (Johnson and Clausnitzer, 1992). Elevations rangerom 360 to over 2100 m.
The current disturbance regime is driven by occasional largeildfires, insect outbreaks, and recent land management. A num-er of wildfires burned about 16,000 ha (9% of the watershed)n the last 10 years. Outbreaks of western spruce budwormChoristoneura occidentalis), bark beetles (Dendroctonus spp.),nd Douglas-fir tussock moth (Orgyia pseudotsugata) overhe last several decades have caused extensive mortality toouglas-fir (Pseudotsuga menziesii) and grand fir (Abies gran-is) (USDA Forest Service, 1980–2000; Hayes and Daterman,001; Torgersen, 2001). Extensive timber harvest has occurredn much of the area, including clearcut, shelterwood, selec-ion, commercial thinning, precommercial thinning, and fuelreatments.
The upper Grande Ronde Subbasin potentially containsabitat for three wildlife listed as threatened or endangerednder the Endangered Species Act: the Canada lynx (Lynxanadensis), the gray wolf (Canis lupis), and the American
PR
lysis of landscape management scenarios using state and transitionape Urban Planning (2006), doi:10.1016/j.landurbplan.2006.10.004
ald eagle (Haliaeetus leucocephalus). In addition, Wisdom 72
t al. (2000) identified 40 additional terrestrial vertebrates 73
f concern likely to occur in the upper Grande Ronde 74
ubbasin. There are also several threatened or endangered 75
study area in northeast Oregon, USA.

IN+ModelL
nd U
a76
277
78
(79
w80
a81
a82
p83
b84
385
86
a87
t88
a89
b90
v91
(92
m93
o94
H95
W96
e97
b98
o99
w100
p 101
a 102
B 103
c 104
v 105
e 106
107
( 108
e 109
t 110
s 111
m 112
S 113
a 114
m 115
A 116
3 117
118
W 119
k 120
B 121
ARTICLEAND 1405 1–14
M.A. Hemstrom et al. / Landscape a
quatic species at risk within the area (USDA and USDI,000).
Forest Service management in the area includes wildernessno active management), riparian areas (managed to protectater quality and aquatic habitat), lynx habitat management
reas, and general forest (managed for a variety of goodsnd services). Private lands tend to be managed for timberroduction and livestock forage, though this varies considerablyy ownership.
. Methods
Our approach projects the effects of natural disturbancesnd management treatments on vegetation by using state andransition models (STMs) (Fig. 2). The vegetative compositionnd structure defines each “state”. These states are connectedy transitions that indicate either the effect of successionalegetation development over time, or the effect of disturbanceHemstrom et al., 2004). This approach builds on transitionatrix methods that represent vegetation development as a set
f transition probabilities among various vegetative states (e.g.,orn, 1975; Cattelino et al., 1979; Noble and Slatyer, 1980;estoby et al., 1989; Laycock, 1991; Keane et al., 1996; Hann
UN
CO
RR
EC
TED
Please cite this article in press as: Hemstrom, M.A. et al., Integrated anamodels in the upper Grande Ronde River Subbasin, Oregon, USA, Landsc
t al., 1997). For example, grass/forb-closed herblands mightecome dominated by small trees and shrubs after a periodf time or might remain as grass/forb communities followingildfire. State changes along the successional, time-dependent
aaaf
Fig. 2. Example state and transition model for surface and
RO
OF
PRESSrban Planning xxx (2006) xxx–xxx 3
aths are deterministic, and without disturbance or management,ll the vegetation would ultimately accumulate in one state.ecause disturbances or management activities can change theourse of vegetative development at any point, very little or noegetation may actually accumulate in the state representing thend point of succession.
We used the Vegetation Dynamics Development ToolVDDT; Beukema et al., 2003) modeling program to project veg-tation and disturbance conditions. This is a non-spatial modelhat allows building and testing STM for a set of environmentaltrata. It has been used in several landscape assessments and landanagement planning efforts in the interior northwestern Unitedtates (e.g., Keane et al., 1996; Hann et al., 1997; Merzenich etl., 2003). We also built spatially explicit versions of the VDDTodels by using the Tool for Exploratory Landscape Scenarionalysis (TELSA; Kurz et al., 2000).
.1. Vegetation data and state classes
Most of the vegetation data were developed by the Wallowa-hitman and Umatilla National Forests and are typical of the
ind used by national forests and other land managers in thelue Mountains. Stand boundaries were delineated on 1:24,000
P
lysis of landscape management scenarios using state and transitionape Urban Planning (2006), doi:10.1016/j.landurbplan.2006.10.004
erial photographs. Stand attributes were assigned based on 122
erial photo interpretation or field stand examinations. We also 123
cquired vegetation data from private industrial forest land 124
rom the landowner, also developed from aerial photograph 125
mixed-severity wildfire in warm-dry environments.

ED
IN+ModelL
4 nd U
i126
l127
b128
b129
a130
t131
d132
m133
d134
i135
a136
t137
t138
d139
n140
s141
t142
t143
d144
s145
<146
f147
f148
F149
o150
w151
t152
w153
154
v155
v156
F157
h158
s159
f160
t161
C162
2163
m164
f165
t166
C167
a168
f169
s170
p171
s172
i173
s174
d175
p176
fi177
t178
s179
t180
e181
d182
183
c 184
a 185
c 186
t 187
l 188
3 189
190
d 191
C 192
a 193
c 194
b 195
t 196
v 197
c 198
a 199
c 200
m 201
g 202
a 203
f 204
( 205
( 206
m 207
m 208
d 209
( 210
s 211
i 212
a 213
o 214
3 215
216
s 217
n 218
p 219
d 220
w 221
t 222
s 223
e 224
l 225
t 226
c 227
o 228
e 229
f 230
m 231
NC
OR
RE
CT
ARTICLEAND 1405 1–14
M.A. Hemstrom et al. / Landscape a
nterpretation and field stand exams. Data that were particu-arly useful included tree species listed in order of abundancey canopy layer, tree size classes (diameter breast height—dbh)y canopy layer, total canopy cover, potential vegetation type,nd life form (grass/forb and shrub) in non-forest vegeta-ion. Forest structure classes are based on tree size, standensity (canopy coverage), and the presence of a single orultiple canopy layers. Separate classes also identify post-
isturbance conditions created by high-severity wildfire andnsect outbreaks. Attributes interpreted from aerial photographsnd field stand examinations were used to identify the struc-ure class. Six vegetation structure classes were based onhe presence or absence of trees and the average dbh ofominant trees: (1) grass/forb dominated, (2) shrub domi-ated, (3) seedlings/saplings–dominant trees <12.5 cm dbh, (4)mall trees–dominant trees 12.5 to <40 cm dbh, (5) mediumrees–dominant trees 40 to <52.5 cm dbh, and (6) largerees–dominant trees ≥52.5 cm dbh. Tree canopy cover wasivided into three classes: (1) tree canopy <15% cover was clas-ified as grass/forb or shrub dominated, (2) tree canopy 15% to40% (warm-dry forests) or 15% to <60% (cool-moist and coldorests) was open forest, and (3) tree canopy ≥40% (warm-dryorest) or ≥60% (cool-moist and cold forest) was dense forest.inally, tree-dominated stands were divided into those with oner more than one canopy layers. Results presented in this paperere summarized using tree canopy layer classes rather than
ree canopy cover classes, combining all canopy cover classesithin single layered versus multi-layered forest structures.Local land managers and ecologists often use potential
egetation to identify environment, disturbance regimes, andegetation growth potential (Johnson and Clausnitzer, 1992).or the purposes of this analysis, we used only land areas thatad forested potential vegetation types (about 80% of the land-cape). We grouped potential vegetation types into three majororest environments (cold, cool-moist, and warm-dry) based onhe potential natural vegetation classification by Johnson andlausnitzer (1992). Cold forest environments comprise about7% of the forest landscape. Engelmann spruce (Picea engel-annii) and subalpine fir (Abies lasiocarpa) dominate older
orests in these environments, and lodgepole pine (Pinus con-orta) frequently occurs following high-severity disturbances.ool-moist forest environments occur at intermediate elevationsnd comprise approximately 30% of the forest landscape. Mixedorests of grand fir and Douglas-fir dominate older cool-moisttands, whereas western larch (Larix occidentalis), lodgepoleine, and ponderosa pine (Pinus ponderosa) dominate early seraltands. Warm-dry forests occupy about 42% of the forested landn the study area. Because of large variability in productivity andite potential, three VDDT models were used to represent warm-ry forests. These are distinguished with a dry site ponderosaine model, a dry site Douglas-fir model, and a dry site grandr/Douglas-fir model. Ponderosa pine is especially drought
olerant and occurs on the warmest and driest sites capable of
UPlease cite this article in press as: Hemstrom, M.A. et al., Integrated anamodels in the upper Grande Ronde River Subbasin, Oregon, USA, Landsc
upporting forests. It is also tolerant of the frequent surface fireshat historically occurred on warm-dry sites. As a consequence,arly seral ponderosa pine forests historically dominated warm-ry sites.
3
fs
PR
OO
F
PRESSrban Planning xxx (2006) xxx–xxx
We used combinations of structure class (tree size, canopyover, canopy layering), overstory species, disturbance history,nd potential vegetation to assign the vegetation to 308 statelasses that are included in our models. We did not include landshat do not potentially support forests in our models owing toack of information about their fire and disturbance regimes.
.2. Disturbances, transitions, and probabilities
Our models derive from those that Hann et al. (1997)eveloped for use in a broad-scale assessment of the interiorolumbia River Basin. Their models were designed for usecross very large landscapes (over 58 million ha) and withoarse-resolution data (1-km pixels). Our modifications areased on discussions with field managers, other experts, andhe existing literature to allow better fit to higher-resolutionegetation data and more complex, localized transitions and statelasses. Our models incorporate disturbances for wildfire, insectnd disease agents, grazing by ungulates (deer, elk, and domesticattle), stand growth and development processes, and variousanagement treatments. Discussion and results of our ungulate
razing models are presented by Vavra et al. (this volume). Inddition, probabilities for disturbances and treatments variedor several land allocation/ownership combinations: wildernessnational forest lands with no active management), riparian areasnational forest lands with low levels of silvicultural and fuelsanagement to maintain water quality and aquatic habitat), lynxanagement areas (national forest lands managed to provide
enning and foraging habitat for Canada lynx), general forestnational forest lands managed for a variety of goods andervices), private industrial lands (private lands owned by large,ndustrial companies managed primarily for timber production),nd private non-industrial lands (private lands owned by variouswners managed less intensively for timber production).
.2.1. Management treatmentsForest management activities included in the model were
helterwood harvest, group selection harvest, commercial thin-ing, pre-commercial thinning, mechanical fuel treatments, andrescribed fire. The annual probabilities for each of these wereeveloped separately for cold forests, cool-moist forests, andarm-dry forests and were adjusted to reflect on-the-ground
reatment rates within each structural stage and land owner-hip/allocation. We used a consensus process with local fieldxperts (including those working on private industrial forestands) to estimate the probabilities for each kind of managementreatment by forest environment and scenario and the resultinghange in state class. For example, we asked what change wouldccur in closed canopy lodgepole pine stands in cold forestnvironments as a result of shelterwood harvest in an activeuel treatment scenario. We considered prescribed fire to be aanagement activity.
lysis of landscape management scenarios using state and transitionape Urban Planning (2006), doi:10.1016/j.landurbplan.2006.10.004
.2.2. Wildfire disturbances 232
We distinguished high-severity (e.g., stand replacement) 233
rom surface (a combined category of mixed-severity and low- 234
everity fires) wildfires (Hessburg and Agee, 2003). In general, 235

D
IN+ModelL
nd U
h236
m237
l238
t239
(240
d241
(242
l243
U244
b245
c246
w247
t248
o249
o250
3251
c252
i253
(254
a255
l256
d257
o258
b259
t260
t261
a262
d263
r264
t265
c266
s267
l268
w269
s270
h271
o272
t273
0274
m275
o276
r277
n278
s279
s280
i281
a282
i283
p284
h285
t286
t287
3288
m289
w290
fi 291
t 292
i 293
m 294
M 295
a 296
( 297
( 298
f 299
t 300
w 301
s 302
m 303
o 304
t 305
w 306
s 307
h 308
d 309
( 310
311
w 312
s 313
s 314
e 315
f 316
p 317
B 318
r 319
p 320
321
s 322
U 323
w 324
i 325
l 326
fi 327
t 328
fi 329
i 330
t 331
o 332
3 333
334
i 335
D 336
t 337
b 338
r 339
s 340
a 341
s 342
NC
OR
RE
CTE
ARTICLEAND 1405 1–14
M.A. Hemstrom et al. / Landscape a
igh-severity disturbances killed 75% or more of the overstory,ixed-severity disturbances killed 25–75% of the overstory, and
ow-severity fires killed less than 25% of the overstory. We hadhree sources of wildfire frequency and severity information:1) data on actual fire occurrences over the last two to threeecades that we could map and stratify by forest environment;2) information, mostly on historical fire frequencies, from theiterature; and (3) expert opinion from local fire managers.nfortunately, data on fire occurrences do not include proportiony fire severity, so our estimates for proportion by severity classome from the opinions of local fire managers. Because ourildfire probabilities are based on recent fires and conditions in
he study area, they reflect both the impacts of fire suppressionn fire occurrence and severity and potentially enhanced ratesf ignition from human activities.
.2.2.1. Current fire probabilities. Our process for assigningurrent wildfire probabilities was to estimate a mean fire-returnnterval for all kinds of wildfire in each forest environmentwarm-dry, cool-moist, cold) from data on actual fire occurrencend from the consensus of local fire managers. We stratifiedate seral warm, dry forest environments into those typicallyominated by ponderosa pine, Douglas-fir, and a combinationf Douglas-fir and grand fir (Johnson and Clausnitzer, 1992)ecause local fire managers thought fire frequencies and severi-ies were substantially different in those strata. We then dividedhe annual probability for wildfires of any severity into prob-bilities for high-severity and surface wildfires (Table 1). Ourivision of high-severity versus surface wildfire probabilitieseflected the opinions of local fire managers about what propor-ion of wildfires would occur in those two severity classes givenombinations of forest environment, stand cover types, and standtructure. For example, local fire managers estimated that ateast 94% of all wildfire in large tree, single-story, open-canopy,arm, dry forests dominated by ponderosa pine would be of
urface severity at present (Table 1). This means that we assumeigh-severity wildfires to be uncommon in this forest type (<6%f all wildfires) under the current fire suppression regime. Givenhe estimate that current annual probability of all wildfires is.0111 (90-year average return interval) in this forest environ-ent, high-severity wildfire was assigned an annual probability
f 0.0004 (2250 years average return interval). This mean fire-eturn interval was more infrequent than we expected, but we hado other data on current fire occurrence by severity class in thetudy area. However, changing the annual probability for high-everity wildfire in this class to 0.002 (500-year average returnnterval) had minor effect on model outputs. Available datand the consensus of fire experts is that high-severity wildfiren single-storied, open canopy, large tree stands dominated byonderosa pine is very rare at present. Fires are more oftenigh severity in dense, multi-storied stands, especially of smallrees (<40 cm dbh), and our wildfire probabilities reflect thatendency.
UPlease cite this article in press as: Hemstrom, M.A. et al., Integrated anamodels in the upper Grande Ronde River Subbasin, Oregon, USA, Landsc
.2.2.2. Historical fire probabilities. Mauroka (1994) foundean fire-return intervals of about 10–50 years in forest typeshere ponderosa pine is co-dominant with Douglas-fir and grand
dtod
PR
OO
F
PRESSrban Planning xxx (2006) xxx–xxx 5
r in the Blue Mountains. Heyerdahl et al. (2001) estimatedhat 90% of forests had mean fire-return intervals of <25 yearsn the southern half of the Blue Mountains, but only half had
ean fire-return intervals of <25 years in the northern Blueountains. Our study area is mid-way between the northern
nd southern Blue Mountains as defined by Heyerdahl et al.2001). High-severity fire was assumed by Heyerdahl et al.2001) to have occurred in small (<0.4 ha) patches in warm-dryorests and at relatively infrequent, but unspecified, intervalshat allowed development of large, old trees. They describedildfires on warm-dry sites as having been generally low in
everity (i.e., surface). We assumed that our study area had aean fire-return interval of surface wildfire on warm-dry sites
f about 25 years or slightly longer, which matches well withhis forest type in the Pacific Northwest (Agee, 1993). Becausee had no local information on the return interval for high-
everity wildfire in warm-dry environments, we assumed thatigh-severity fire was rare in open stands of large (e.g., ≥16 in.bh) trees with a mean fire-return interval of 400 years or moreTable 1).
Heyerdahl et al. (2001) had difficulty in distinguishingildfire from other disturbances in mesic forests near our
tudy area. Apparently their study site had experienced manymall-scale, non-wildfire disturbances over the historical periodxamined, perhaps mortality related to insect outbreaks. Theyound a median occurrence of one fire in the 1750–1900 timeeriod in other mesic sites in northern Blue Mountain sites.ased on this information, we assumed that the overall fire-
eturn interval in cool-moist forests was approximately 150 yearsrior to European settlement (Table 1).
Based on fire history studies in lodgepole pine, Engelmannpruce, and subalpine fir forests in other parts of the westernnited States (Agee, 1993), we assumed that fires in cold forestsere generally high-severity events with a mean fire-return
nterval of about 200 years. We also assumed that open stands ofarge western larch, a fire-resistant species, had a longer meanre-return interval for stand-replacement fire of 250 years and
hat dense stands of Engelmann spruce and subalpine fir, bothre-intolerant species, had a somewhat shorter mean fire-return
nterval for high-severity fire of about 190 years. We assumedhe mean fire-return interval for surface wildfire was generallyver 400 years.
.2.3. Insect disturbancesSeveral insects may occur at endemic and outbreak levels
n Blue Mountains forests (Ager et al., 2004), includingouglas-fir beetle (Dendroctonus pseudotsugae), Douglas-fir
ussock moth, fir engraver (Scolytus ventralis), mountain pineeetle (Dendroctonus ponderosae), spruce beetle (Dendroctonusufipennis), and western spruce budworm. Each species haspecific preferences for host tree species and tree size as wells probability of occurrence and typical patch disturbanceizes and probabilities in the study area. We included endemic
lysis of landscape management scenarios using state and transitionape Urban Planning (2006), doi:10.1016/j.landurbplan.2006.10.004
isturbances that reduce stand density but do not kill most of 343
he susceptible host and outbreak disturbances that kill most 344
r all the susceptible host over large areas. Outbreak insect 345
isturbances were assigned an average duration and periodicity 346

UN
CO
RR
EC
TED
PR
OO
F
Please cite this article in press as: Hemstrom, M.A. et al., Integrated analysis of landscape management scenarios using state and transitionmodels in the upper Grande Ronde River Subbasin, Oregon, USA, Landscape Urban Planning (2006), doi:10.1016/j.landurbplan.2006.10.004
ARTICLE IN PRESS+ModelLAND 1405 1–14
6 M.A. Hemstrom et al. / Landscape and Urban Planning xxx (2006) xxx–xxx
Table 1Assumed mean return intervals and mean annual probabilities for wildfires in large tree structure classes under historical conditions modeled in the upper GrandeRonde Subbasin, Oregon
Envt.a CTb Sc Current fire regime Historical fire regime
Alld Surfacee High severityf All Surface High severity
Prob.g MRIh Factori Prob. MRI Factor Prob. MRI Prob. MRI Prob. MRI Prob. MRI
dp PP Oo 0.0111 90 0.96 0.0107 94 0.04 0.0004 2250 0.0431 23 0.0427 23 0.0004 2250dp PP Od 0.0143 70 0.90 0.0129 78 0.10 0.0014 700 0.0529 19 0.0514 19 0.0014 700dp PP Mo 0.0111 90 0.80 0.0089 113 0.20 0.0022 450 0.0378 26 0.0356 28 0.0022 450dp PP Md 0.0143 70 0.50 0.0071 140 0.50 0.0071 140 0.0357 28 0.0286 35 0.0071 140dd DF Oo 0.0118 85 0.90 0.0106 94 0.10 0.0012 850 0.0435 23 0.0424 24 0.0012 850dd DF Od 0.0133 75 0.50 0.0067 150 0.50 0.0067 150 0.0333 30 0.0267 38 0.0067 150dd DF Mo 0.0118 85 0.80 0.0094 106 0.20 0.0024 425 0.0400 25 0.0376 27 0.0024 425dd DF Md 0.0133 75 0.50 0.0067 150 0.50 0.0067 150 0.0333 30 0.0267 38 0.0067 150dd PP Oo 0.0118 85 0.96 0.0113 89 0.04 0.0005 2125 0.0456 22 0.0452 22 0.0005 2125dd PP Od 0.0133 75 0.50 0.0067 150 0.50 0.0067 150 0.0333 30 0.0267 38 0.0067 150dd PP Mo 0.0118 85 0.80 0.0094 106 0.20 0.0024 425 0.0400 25 0.0376 27 0.0024 425dd PP Md 0.0133 75 0.50 0.0067 150 0.50 0.0067 150 0.0333 30 0.0267 38 0.0067 150dg PP Oo 0.0125 80 0.96 0.0120 83 0.04 0.0005 2000 0.0485 21 0.0480 21 0.0005 2000dg PP Od 0.0167 60 0.50 0.0083 120 0.50 0.0083 120 0.0417 24 0.0333 30 0.0083 120dg PP Mo 0.0125 80 0.80 0.0100 100 0.20 0.0025 400 0.0425 24 0.0400 25 0.0025 400dg PP Md 0.0167 60 0.30 0.0050 200 0.70 0.0117 86 0.0317 32 0.0200 50 0.0117 86dg DF, GF Oo 0.0125 80 0.90 0.0113 89 0.10 0.0013 800 0.0463 22 0.0450 22 0.0013 800dg DF, GF Od 0.0167 60 0.30 0.0050 200 0.70 0.0117 86 0.0317 32 0.0200 50 0.0117 86dg DF, GF Mo 0.0125 80 0.80 0.0100 100 0.20 0.0025 400 0.0425 24 0.0400 25 0.0025 400dg DF, GF Md 0.0167 60 0.30 0.0050 200 0.70 0.0117 86 0.0317 32 0.0200 50 0.0117 86cm WL, LP Oo 0.0083 120 0.85 0.0071 141 0.15 0.0013 800 0.0083 120 0.0071 141 0.0013 800cm WL, LP Od 0.0100 100 0.50 0.0050 200 0.50 0.0050 200 0.0100 100 0.0050 200 0.0050 200cm WL, LP Mo 0.0083 120 0.85 0.0071 141 0.15 0.0013 800 0.0083 120 0.0071 141 0.0013 800cm WL, LP Md 0.0091 110 0.50 0.0045 220 0.50 0.0045 220 0.0091 110 0.0045 220 0.0045 220cm GF, ES Oo 0.0111 90 0.60 0.0067 150 0.40 0.0044 225 0.0111 90 0.0067 150 0.0044 225cm GF, ES Od 0.0111 90 0.40 0.0044 225 0.60 0.0067 150 0.0111 90 0.0044 225 0.0067 150cm GF, ES Mo 0.0111 90 0.50 0.0056 180 0.50 0.0056 180 0.0111 90 0.0056 180 0.0056 180cm GF, ES Md 0.0111 90 0.40 0.0044 225 0.60 0.0067 150 0.0111 90 0.0044 225 0.0067 150cm DF Oo 0.0111 90 0.70 0.0078 129 0.30 0.0033 300 0.0111 90 0.0078 129 0.0033 300cm DF Od 0.0111 90 0.50 0.0056 180 0.50 0.0056 180 0.0111 90 0.0056 180 0.0056 180cm DF Mo 0.0111 90 0.70 0.0078 129 0.30 0.0033 300 0.0111 90 0.0078 129 0.0033 300cm DF Md 0.0111 90 0.50 0.0056 180 0.50 0.0056 180 0.0111 90 0.0056 180 0.0056 180cd LP, WL Oo 0.0067 150 0.40 0.0027 375 0.60 0.0040 250 0.0053 188 0.0013 750 0.0040 250cd LP, WL Od 0.0067 150 0.20 0.0013 750 0.80 0.0053 188 0.0060 167 0.0007 1500 0.0053 188cd LP, WL Mo 0.0067 150 0.40 0.0027 375 0.60 0.0040 250 0.0053 188 0.0013 750 0.0040 250cd LP, WL Md 0.0067 150 0.20 0.0013 750 0.80 0.0053 188 0.0060 167 0.0007 1500 0.0053 188cd ES, AF Oo 0.0067 150 0.40 0.0027 375 0.60 0.0040 250 0.0053 188 0.0013 750 0.0040 250cd ES, AF Od 0.0067 150 0.20 0.0013 750 0.80 0.0053 188 0.0060 167 0.0007 1500 0.0053 188cd ES, AF Mo 0.0067 150 0.40 0.0027 375 0.60 0.0040 250 0.0053 188 0.0013 750 0.0040 250cd ES, AF Md 0.0067 150 0.20 0.0013 750 0.80 0.0053 188 0.0060 167 0.0007 1500 0.0053 188cd DF Oo 0.0067 150 0.40 0.0027 375 0.60 0.0040 250 0.0053 188 0.0013 750 0.0040 250cd DF Od 0.0067 150 0.40 0.0027 375 0.60 0.0040 250 0.0053 188 0.0013 750 0.0040 250cd DF Mo 0.0067 150 0.40 0.0027 375 0.60 0.0040 250 0.0053 188 0.0013 750 0.0040 250cd DF Md 0.0067 150 0.40 0.0027 375 0.60 0.0040 250 0.0053 188 0.0013 750 0.0040 250
a Forest environment. dp: warm, dry ponderosa pine forest potential; dd: warm, dry Douglas-fir forest potential; dg: warm, dry mixed grand fir and Douglas-firforest potential; cm: cool, moist; cd: cold, dry forest potential.
b Cover type. PP: Ponderosa pine; DF: Douglas-fir; GF: Grand fir; WL: Western larch; LP: Lodgepole pine; ES: Engelmann spruce; SF: Subalpine fir.c Forest structure. Oo: dominant and codominant trees at least 52.5 cm diameter breast height, one canopy layer, and canopy cover between 15% and 40%. Od:
dominant and codominant trees at least 52 cm dbh, one canopy layer, and canopy cover over 40%. Mo: dominant and codominant trees at least 52 cm dbh, two ormore canopy layers, and canopy cover between 15% and 40%. Od: dominant and codominant trees at least 52 cm dbh, two or more canopy layers, and canopy coverover 40%.
d All wildfire severities combined.e Surface and mixed-severity wildfires combined.f High-severity wildfires.g Mean annual probability of occurrence.h Mean return interval (years).i Proportion of all wildfire in this severity class.
mhemstro
Comment on Text
This footnote contains several errors (my fault). Here is the correct wording: Forest structure. Oo = dominant and codominant trees at least 52.5 cm diameter breast height, one canopy layer, and canopy cover between 15% and 40%. Od = dominant and codominant trees at least 52 cm dbh, one canopy layer, and canopy cover over 40%. Od = dominant and codominant trees at least 52.5 cm dbh, two or more canopy layers, and canopy cover over 40%. Mo = dominant and codominant trees at least 40cm and < 52.5 cm dbh, one canopy layer, and canopy cover between 15% and 40%. Md = dominant and codominant trees at least 40cm and < 52.5 cm dbh, two or more canopy layers, and canopy cover over 40%.

D
IN+ModelL
nd U
i347
d348
3349
350
b351
d352
i353
a354
t355
i356
1357
358
359
2360
361
362
363
364
365
366
367
368
369
3370
371
372
373
374
375
4376
377
378
379
380
5381
382
383
384
385
386
w387
s388
o389
t390
e391
S392
b393
i394
p395
o396
t397
a398
w399
t400
t 401
p 402
3 403
404
d 405
n 406
s 407
T 408
o 409
f 410
a 411
( 412
s 413
c 414
a 415
t 416
a 417
u 418
t 419
n 420
421
a 422
l 423
g 424
T 425
p 426
b 427
t 428
o 429
a 430
j 431
i 432
m 433
d 434
d 435
d 436
fi 437
e 438
t 439
m 440
r 441
u 442
443
a 444
a 445
d 446
c 447
t 448
t 449
o 450
n 451
NC
OR
RE
CTE
ARTICLEAND 1405 1–14
M.A. Hemstrom et al. / Landscape a
n years and an average probability for each insect species, usingata from (Ager et al., 2004).
.2.4. Stand growth transitionsStand growth and succession transitions in our model are
ased on extensive review and adjustment of the modelseveloped by Hann et al. (1997). Many model runs were donen conjunction with local silviculturists to adjust probabilitiesnd correct transition linkages. Growth rates and successionalrends reflect several major assumptions about forest behaviorn the Blue Mountains:
. Forest growth and successional rates depend on environment,being slower in dry and cold environments than in moist,productive sites.
. Natural regeneration following disturbance is uncertain andmay take several years to a decade or more, dependingon the density of shrubs and competing vegetation and theaverage frequency of good seed crops and favorable climaticconditions. Grazing by large ungulates (deer, elk, anddomestic livestock) substantially affects regeneration ratesand tree density (Vavra et al., this volume). A high level ofgrazing reduces competing vegetation and creates favorableseedbeds, resulting in rapid regeneration or increased standdensity (Riggs et al., 2000).
. High-severity disturbances such as wildfire result in thepreferential establishment of shade-intolerant conifers (e.g.,ponderosa pine, western larch, and lodgepole pine). Distur-bances that leave much of the canopy intact preferentiallyfavor shade-tolerant species such as grand fir, Douglas-fir,Engelmann spruce, and subalpine fir.
. High-severity disturbances in large-tree dominated standsresult in high levels of snags and down wood that persistfor 20 years or more unless salvage logging removes deadmaterial. If salvage logging occurred, we also includedartificial regeneration.
. Forest growth and development transitions are generallytime dependent and unidirectional in the absence of otherdisturbances. In the absence of disturbance, the forestedlandscape would become dominated by multiple-layered,large-tree forests of late seral species.
We tested our forest growth and succession assumptionsith an independent modeling approach. We used stand-level
imulations of tree growth from a stand growth model devel-ped by Bettinger et al. (2004) and Graetz et al. (this volume)o check stand growth rates and transitions. Their model isssentially the Forest Vegetation Simulator (Crookston andtage, 1999) stripped down for batch runs of large num-ers of stands, producing outputs of thousands of stands thatnclude lists of individual trees in search of optimal standrescriptions. We classified tree lists from their model intour state classes, calculated average transition times owing
UPlease cite this article in press as: Hemstrom, M.A. et al., Integrated anamodels in the upper Grande Ronde River Subbasin, Oregon, USA, Landsc
o stand growth, and translated average transition times tonnual transition probabilities. We found very few instanceshere calculated transitions from tree lists differed substan-
ially from those estimated by field silviculturists. Where
bbrl
PR
OO
F
PRESSrban Planning xxx (2006) xxx–xxx 7
here were differences, we used calculated transitions androbabilities.
.3. Disturbance and management scenarios
We modeled the long-term vegetation and disturbance con-itions that might result from three scenarios: (1) backgroundatural disturbances (no active management and no fire suppres-ion), (2) fire suppression only, and (3) active fuels treatment.he scenarios represent existing and likely future combinationsf management activities and natural disturbances, all beginningrom current, existing vegetation conditions. The various landllocations and ownerships were either modeled individuallywhen disturbance probabilities varied by allocation or owner-hip) or were combined into a single land area. We assumed aonstant management approach under the fire suppression onlynd active fuel treatment scenarios, no policy changes occurredo alter the probabilities of management activities on any landllocation or ownership. In addition, we assumed high levels ofngulate grazing for the fire suppression only and active fuelreatment scenarios, but low grazing effects in the backgroundatural disturbance scenario (Vavra et al., this volume).
The background natural disturbance scenario did not includeny management activities and was intended to represent theikely conditions under current climate with low ungulaterazing in the absence of present-day management activities.his scenario was modeled with the same natural disturbancerobabilities across all ownerships and land allocations. Theackground natural disturbance scenario is generally similaro disturbance conditions assumed in various historical rangef variability (HRV) analyses (Hann et al., 1997; Wimberly etl., 2000; Agee, 2003) but does not assume that model pro-ections actually represent some past set of conditions. Rather,t produces simulations that represent potential conditions that
ight develop given current climatic conditions and naturalisturbance probabilities as inferred from fire history and otheristurbance studies. Because we included annual variability inisturbance probabilities (owing to local climatic fluctuations,re ignitions, and insect outbreak cycles), our simulations alsostimate variation in disturbance and vegetation conditions overime. We did not include global climate change trends. This
eans that the overall average probabilities of disturbanceemain constant through time when averaged across our sim-lation periods (i.e., no long-term trends).
The fire suppression only scenario assumed no managementctivities other than fire suppression, high ungulate grazing,nd low levels of salvage logging following stand-replacementisturbances on publicly owned lands regardless of land allo-ation. Active management probabilities from the active fuelreatment scenario were used for privately owned lands. Owingo a variety of environmental and social concerns, the probabilityf salvage following high-severity wildfire or insect outbreak isot particularly high (1%) compared to the entire area affected
lysis of landscape management scenarios using state and transitionape Urban Planning (2006), doi:10.1016/j.landurbplan.2006.10.004
y those disturbances. Wildfire suppression and natural distur- 452
ance probabilities were included at current levels. Artificial 453
egeneration (tree planting) was included following salvage 454
ogging. 455

ED
IN+ModelL
8 nd U
456
m457
f458
o459
s460
w461
o462
d463
f464
c465
m466
f467
e468
t469
d470
t471
c472
a473
n474
p475
m476
l477
u478
v479
t480
n481
c482
c483
o484
3485
486
q487
o488
M489
v490
(491
w492
w493
f494
a495
r496
p497
a498
t499
o500
c501
c502
f503
e504
g505
m506
y507
f508
w509
o510
511
s 512
3 513
a 514
y 515
t 516
3 517
e 518
c 519
c 520
s 521
a 522
w 523
s 524
v 525
v 526
y 527
m 528
e 529
a 530
4 531
4 532
533
l 534
s 535
o 536
f 537
a 538
w 539
h 540
l 541
i 542
543
b 544
o 545
t 546
t 547
p 548
s 549
a 550
s 551
m 552
i 553
g 554
a 555
b 556
s 557
M 558
r 559
w 560
NC
OR
RE
CT
ARTICLEAND 1405 1–14
M.A. Hemstrom et al. / Landscape a
An active fuels treatment scenario was developed to approxi-ate expected land management based on recently implemented
uel treatment policies. This scenario included levels and kindsf management activities designed to actively treat canopy andurface fuels to reduce wildfire risks in general forest landsithin the first decade and to maintain relatively low levelsf canopy and surface fuels across the landscape after the firstecade. Because current fuel conditions are often high, initialuel treatments were mostly accomplished through mechani-al treatment rather than through prescribed fire. After initialechanical treatment, prescribed fire was used to maintain
uels at relatively low levels, especially in warm-dry forestnvironments. Initial mechanical treatment rates were adjustedo allow treatment of stands in general forest allocations in warm-ry environments within the first decade, and then declinedo maintenance levels. Rates of fuel treatment were lower inool-moist and cold forest environments. Other managementctivities included precommercial thinning, commercial thin-ing, shelterwood harvest, and group selection harvest. Therobabilities of all activities were adjusted to reflect differentanagement objectives and activity levels by ownership and
and allocation. For example, precommercial thinning is notsed in lynx habitat areas, and silvicultural management isery limited in riparian areas. We distinguished riparian areashat are currently managed differently from uplands but didot distinguish natural vegetation or disturbances that mightharacterize riparian systems. Wildfire suppression probabilitiesontinued at current levels. Natural disturbance probabilitiesther than fire remained at current levels.
.4. Model projections and variability
Our VDDT models are relatively easy to run and executeuickly on a high-end desktop personal computer. The structuref the VDDT program allows runs of hundreds of years and manyonte Carlo simulations to generate averages and associated
ariability in state class abundance and disturbance occurrenceBeukema et al., 2003). We included annual variability for bothildfire and insect outbreaks by using a set of multipliers thate developed using expert opinion from local fire managers and
orest pathologists and entomologists to reflect the frequencynd severity of fire years and insect outbreaks over the period ofecord (generally 30 years from 1970 to 2000). The modelingrocess randomly assigns high, moderate, and low or normal firend outbreak years for each Monte Carlo simulation. This meanshat our models include variation in fire occurrence and insectutbreaks over time. We assume this variation is caused by locallimatic conditions, human activities, forest conditions, andycles of insect activity. We used 30 Monte Carlo simulationsor each model run to calculate average landscape conditions forach projected year and to assess variation. Because the processenerates random sequences of high, moderate, and low or nor-al fire and outbreak years, the projections include sequences of
UPlease cite this article in press as: Hemstrom, M.A. et al., Integrated anamodels in the upper Grande Ronde River Subbasin, Oregon, USA, Landsc
ears where wildfire, for example, is very high and nearly all theorests burn. Similarly, some year sequences include very littleildfire. Insect outbreaks tend to be more cyclical, dependingn the insect species involved (Ager et al., 2004).
et
s
PR
OO
F
PRESSrban Planning xxx (2006) xxx–xxx
With the exception of the background natural disturbancecenario, we ran each VDDT projection for 200 years with0 Monte Carlo simulations to estimate average conditionsnd variability. The simulation results we present are thereforeearly averages of the 30 Monte Carlo simulations. We ranhe background natural disturbance scenario for 500 years with0 Monte Carlo simulations to allow us to examine both theffects of a natural disturbance regime starting from existingonditions (short term, years 0–200) and long-term quasi-stableonditions (long term, years 201–500). We calculated severaltatistics for each disturbance regime simulation. The overallverage for a landscape condition (e.g., area in a structure class)as calculated by combining all 30 Monte Carol runs and all
imulation years. The average minimum and average maximumalues were calculated by finding the minimum and maximumalues, respectively, for the 30 Monte Carlo simulations of eachear, then calculating the average of those yearly minima andaxima. The absolute minimum was the smallest value ever
ncountered in any year, and any Monte Carlo simulation andbsolute maximum was the largest.
. Results
.1. Background natural disturbance scenario
Surface wildfire was the dominant disturbance across theandscape under the short-term background natural disturbancecenario (Fig. 3a). By the end of the 200-year simulation, insectutbreaks were affecting an average 0.2–0.5% of the potentiallyorested landscape annually. Wildfires of all severities affectedn average of 1.5–4.7% annually. The area of surface wildfireas generally double or more the average annual amount ofigh-severity wildfires. The annual average proportion of theandscape affected by all disturbances varied from nearly nonen some years to almost 10% in others.
Vegetation conditions under the background natural distur-ance scenario changed substantially from current conditionsver 200 years (Fig. 3d). At present, seedling/sapling and small-ree stands dominate the study area, occupying about 75% ofhe potentially forested landscape while large-tree forests com-rise less than 10%. Small-tree single story, small-tree multi-tory, medium-tree multi-story and large-tree multi-story standsll declined over 200 years. The decline in small-tree singletory stands was particularly notable (37–17%). Grass/shrub,edium-tree single story, and large-tree single story structures
ncreased. Increases in grass/shrub (6–23%) and large-tree sin-le story stands (3–17%) were substantial. After about 200 years,verage forest structure was relatively stable and dominatedy grass/shrub (23%), seedling/sapling (24%), large-tree singletory stands (17%), and small-tree single story stands (17%).
edium-tree stands and multi-layered forests of all sizes becameelatively minor in comparison. Nearly all the large-tree forestsere in warm-dry environments. Cool-moist and cold forest
lysis of landscape management scenarios using state and transitionape Urban Planning (2006), doi:10.1016/j.landurbplan.2006.10.004
nvironments contained less than 10% large-tree forests over 561
he long term. 562
Grass/shrub, seedling/sapling, large-tree single story, and 563
mall-tree single story forests dominated the landscape over 564
DO
F
ARTICLE IN PRESS+ModelLAND 1405 1–14
M.A. Hemstrom et al. / Landscape and Urban Planning xxx (2006) xxx–xxx 9
F ral diR rlo sim
t565
(566
3567
c568
s569
r570
m571
s572
c573
s574
r575
a576
FcMm
4 577
578
a 579
g 580
o 581
b 582
1 583
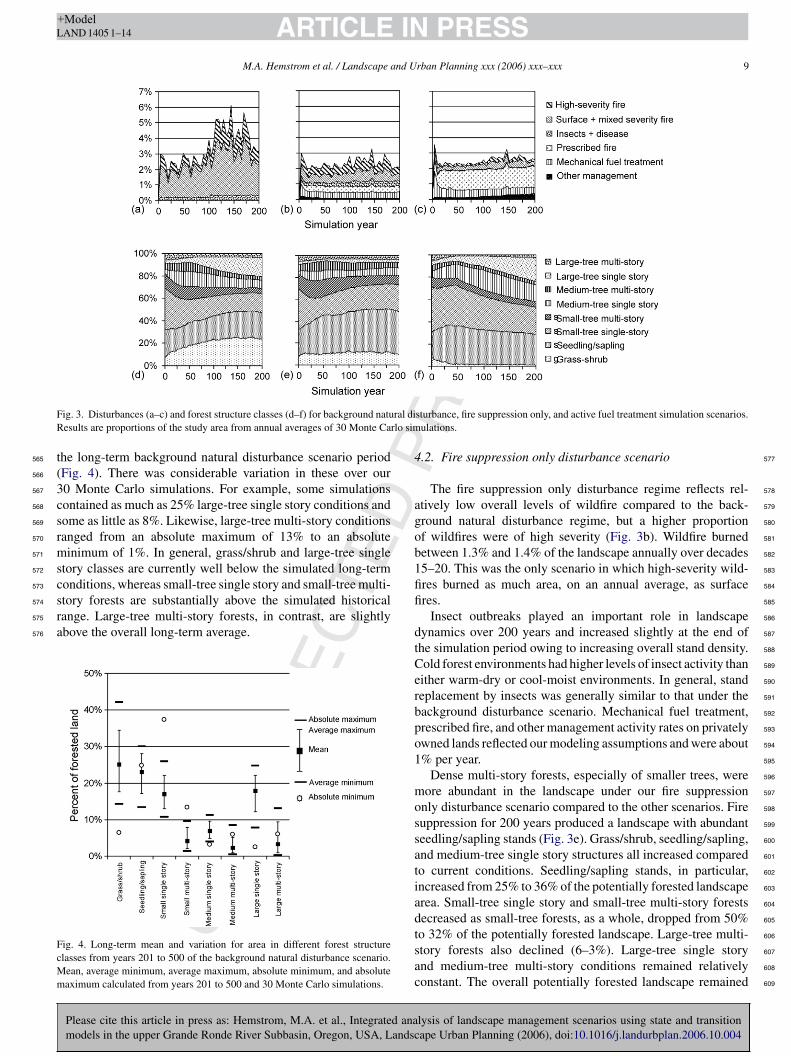
Eig. 3. Disturbances (a–c) and forest structure classes (d–f) for background natuesults are proportions of the study area from annual averages of 30 Monte Cahe long-term background natural disturbance scenario periodFig. 4). There was considerable variation in these over our0 Monte Carlo simulations. For example, some simulationsontained as much as 25% large-tree single story conditions andome as little as 8%. Likewise, large-tree multi-story conditionsanged from an absolute maximum of 13% to an absoluteinimum of 1%. In general, grass/shrub and large-tree single
tory classes are currently well below the simulated long-term
UN
CO
RR
EC
T
Please cite this article in press as: Hemstrom, M.A. et al., Integrated anamodels in the upper Grande Ronde River Subbasin, Oregon, USA, Landsc
onditions, whereas small-tree single story and small-tree multi-tory forests are substantially above the simulated historicalange. Large-tree multi-story forests, in contrast, are slightlybove the overall long-term average.
ig. 4. Long-term mean and variation for area in different forest structurelasses from years 201 to 500 of the background natural disturbance scenario.ean, average minimum, average maximum, absolute minimum, and absoluteaximum calculated from years 201 to 500 and 30 Monte Carlo simulations.
fi 584
fi 585
586
d 587
t 588
C 589
e 590
r 591
b 592
p 593
o 594
1 595
596
m 597
o 598
s 599
s 600
a 601
t 602
i 603
a 604
d 605
tsac
PR
Osturbance, fire suppression only, and active fuel treatment simulation scenarios.ulations.
.2. Fire suppression only disturbance scenario
The fire suppression only disturbance regime reflects rel-tively low overall levels of wildfire compared to the back-round natural disturbance regime, but a higher proportionf wildfires were of high severity (Fig. 3b). Wildfire burnedetween 1.3% and 1.4% of the landscape annually over decades5–20. This was the only scenario in which high-severity wild-res burned as much area, on an annual average, as surfaceres.
Insect outbreaks played an important role in landscapeynamics over 200 years and increased slightly at the end ofhe simulation period owing to increasing overall stand density.old forest environments had higher levels of insect activity thanither warm-dry or cool-moist environments. In general, standeplacement by insects was generally similar to that under theackground disturbance scenario. Mechanical fuel treatment,rescribed fire, and other management activity rates on privatelywned lands reflected our modeling assumptions and were about% per year.
Dense multi-story forests, especially of smaller trees, wereore abundant in the landscape under our fire suppression
nly disturbance scenario compared to the other scenarios. Fireuppression for 200 years produced a landscape with abundanteedling/sapling stands (Fig. 3e). Grass/shrub, seedling/sapling,nd medium-tree single story structures all increased comparedo current conditions. Seedling/sapling stands, in particular,ncreased from 25% to 36% of the potentially forested landscaperea. Small-tree single story and small-tree multi-story forestsecreased as small-tree forests, as a whole, dropped from 50%
lysis of landscape management scenarios using state and transitionape Urban Planning (2006), doi:10.1016/j.landurbplan.2006.10.004
o 32% of the potentially forested landscape. Large-tree multi- 606
tory forests also declined (6–3%). Large-tree single story 607
nd medium-tree multi-story conditions remained relatively 608
onstant. The overall potentially forested landscape remained 609

ED
IN+ModelL
1 nd U
d610
c611
4612
613
d614
M615
m616
(617
p618
1619
t620
t621
a622
f623
b624
e625
a626
o627
t628
f629
y630
631
a632
t633
0634
b635
u636
c637
a638
s639
c640
w641
s642
o643
p644
t645
f646
w647
o648
t649
i650
s651
652
m653
c654
d655
d656
a657
s658
T659
o660
c661
s662
i663
l664
f 665
o 666
s 667
g 668
fi 669
s 670
s 671
t 672
m 673
s 674
o 675
a 676
h 677
5 678
679
d 680
r 681
t 682
a 683
p 684
A 685
h 686
f 687
h 688
h 689
M 690
h 691
t 692
h 693
e 694
a 695
5 696
697
t 698
r 699
r 700
a 701
o 702
l 703
l 704
c 705
l 706
g 707
w 708
p 709
l 710
o 711
e 712
i 713
NC
OR
RE
CT
ARTICLEAND 1405 1–14
0 M.A. Hemstrom et al. / Landscape a
ominated by grass/shrub, seedling/sapling, and small-treeonditions, as it is at present.
.3. Active fuel treatment disturbance scenario
Active fuel treatments produced notable changes inisturbances over 200 years compared to the other scenarios.echanical fuel treatment, prescribed fire, and other manage-ent activities affected 1.7–2.2% of the landscape area annually
Fig. 3c). Mechanical treatments were initially higher thanrescribed fire (1.2% compared to 0.7% per year), but within00 years, prescribed fire became dominant as initial mechanicalreatment reduced fuel loads to levels that could be safelyreated with prescribed fire. Most mechanical fuel treatmentsfter 100 years occurred in cool-moist forests containing higheruels and tree species more sensitive to underburning. Theulk of prescribed fire occurred in warm-dry forests where it isasiest to implement and highly effective. Other managementctivities, principally timber harvests on privately owned lands,ccurred on about 0.1–0.2% of the landscape annually duringhe first 100 years. Shelterwood harvests in cool-moist and coldorests on national forest lands increased somewhat after 100ears as those forests grew to larger size classes.
Though quite variable on an annual basis (Fig. 3c), the forestrea affected by wildfire declined from about 0.7% at year 0o about 0.3% by 100 years, then slowly increased to about.7% again by year 200. This was substantially lower than theackground average rate of 1.5–4.7% for wildfire disturbancender the background natural disturbance scenario and reflectsombined effects from fire suppression and fuel reduction. It islso about half the annual occurrence of wildfire under the fireuppression only scenario. High-severity wildfire was heavilyoncentrated in cool-moist and cold forests, whereas surfaceildfires dominated in warm-dry forests. Increasing tree size and
tand density in upper elevation forests resulted in higher levelsf stand-replacing wildfire toward the end of the simulationeriod. Insect outbreaks declined slightly over 200 years acrosshe landscape but remained at relatively high levels in coldorests where fuel treatments and other stand-thinning activitiesere lowest. Insect outbreaks generated high-severity eventsn very little of the forest land per year in the active fuelreatment scenario and occurred at rates less than half thosen the background natural disturbance and fire suppression onlycenarios.
Grass/shrub, small-tree single story, small-tree multi-story,edium-tree multi-story, and large-tree multi-story structural
onditions all declined over 200 years (Fig. 3f). The largestecrease occurred in small-tree single story stands, whicheclined from 37% to 24% of the potentially forested landscaperea. Seedling/sapling, medium-tree single story, and large-treeingle story stands all increased compared to current conditions.he increase in seedling/sapling stands was due to a combinationf high-severity wildfire and insect outbreaks in cool-moist and
UPlease cite this article in press as: Hemstrom, M.A. et al., Integrated anamodels in the upper Grande Ronde River Subbasin, Oregon, USA, Landsc
old forests while continued reburning in dense seedling/saplingtands limited growth into small-tree size classes. An increasen medium-tree single story stands was largely due to highevels of fuel treatments and prescribed burning in warm-dry
tfwi
PR
OO
F
PRESSrban Planning xxx (2006) xxx–xxx
orests. Large-tree stands, as a whole, increased from 8% to 24%ver 200 years because small losses to large-tree multi-storytands from wildfire or insects were more than made up by largeains in single story stands owing to management (prescribedre and thinning from below) and tree growth. Large-treetands in warm-dry environments increased dramatically, buthifted strongly to single story conditions as a result of fuelreatment and prescribed fire activities, whereas those in cool-
oist and cold forests nearly disappeared. The loss of large treetructures in upper elevation forests was due to a combinationf insect outbreaks and stand-replacement wildfire, with a smalldditional loss as a result of relatively low levels of shelterwoodarvest and fuel treatment.
. Discussion
Our results beg two questions: Why are current conditions soifferent than those that might exist under a natural disturbanceegime? and Can current conditions be maintained? We suggesthat the path of forest disturbance, management treatments,nd climate change over the last 100 years or more hasroduced current conditions that might be difficult to sustain.
long history of fire suppression, forest management, andigh ungulate grazing (Vavra et al., this volume) has createdorests of smaller trees, many of which might experienceigh-severity disturbance, especially as fire suppression andigh ungulate grazing continue to increase stand densities.anagement designed to maintain current conditions would
ave to carefully balance the generation and retention of large-ree stands (especially single story structures) while slowingigh-severity disturbances from fire or insects. This might bespecially difficult if abundant multi-layered large-tree forestsre desired.
.1. Lag time, variability, and key structural elements
The full influence of our alternative scenarios on forest struc-ure took 150–200 years to develop. Decades to centuries wereequired for the growth of large trees and the establishment of aelatively stable long-term dynamic. In reality, climate changend other factors (e.g., changing political and managementbjectives) likely preclude forests from ever reaching a stableong-term dynamic at the spatial scale of our study area. Theong timeframe required to generate relatively stable landscapeonditions in our simulations resulted from the current lowandscape abundance of large trees, the long time required torow large trees, and the interaction of natural disturbancesith stand development. Some tree species (e.g., ponderosaine, western larch, and, to some extent, Douglas-fir) are long-ived and regenerate best in open, early seral conditions, whereasthers (e.g., grand fir, subalpine fir) regenerate well in shadednvironments and have shorter average longevity. Given themportance of large trees, the long timeframe required to grow
lysis of landscape management scenarios using state and transitionape Urban Planning (2006), doi:10.1016/j.landurbplan.2006.10.004
hem, and their potential longevity, and regeneration limitations 714
or early seral tree species, we suggest that large ponderosa pine, 715
estern larch, and similar species are pivotal structural elements 716
n this landscape. 717

D
IN+ModelL
nd U
718
r719
i720
p721
c722
s723
a724
a725
a726
m727
l728
a729
o730
p731
f732
5733
b734
735
a736
s737
d738
e739
l740
t741
o742
n743
s744
c745
l746
s747
t748
a749
c750
s751
n752
l753
v754
755
t756
t757
(758
1759
m760
M761
a762
e763
a764
o765
s766
i767
i768
w769
n770
m771
t772
5 773
t 774
775
o 776
w 777
t 778
l 779
A 780
a 781
t 782
m 783
B 784
o 785
a 786
a 787
t 788
t 789
m 790
y 791
a 792
t 793
o 794
m 795
c 796
o 797
798
t 799
d 800
s 801
t 802
e 803
o 804
m 805
e 806
d 807
L 808
l 809
t 810
t 811
p 812
b 813
p 814
b 815
e 816
d 817
m 818
t 819
m 820
n 821
a 822
823
u 824
NC
OR
RE
CTE
ARTICLEAND 1405 1–14
M.A. Hemstrom et al. / Landscape a
Our Monte Carlo simulations produced highly variableesults for many landscape attributes (Fig. 4) because our modelsncluded annual variability in both wildfire and insect outbreakrobabilities. Average annual conditions for various landscapeharacteristics reflect the most probable outcomes from thecenario. An average condition and variability are important andllow managers and others to evaluate likely trends. However,ctual disturbances and, consequently, the amounts of habitatsnd structures over time follow a particular path that may oray not be the most likely path. For example, the amount of
arge-tree multi-story forest might average 3% of the landscaperea under a natural disturbance scenario, but wildfire and insectutbreaks interacting with stand growth and development mayroduce wide fluctuations in the amount of large-tree multi-storyorests over time in any one run.
.2. Differences between current landscape andackground natural disturbance conditions
The current landscape is outside the simulated long-termverage minimum to average maximum ranges for severaltructural conditions compared to the background naturalisturbance scenario (Fig. 4). Single story large-tree forests, forxample, occupied an average of nearly 20% of the forestedandscape under the background disturbance scenario, but lesshan 5% at present. Frequent, low-severity wildfire favoredpen stands of large, fire resistant trees under the backgroundatural disturbance scenario while multi-storied large treetands averaged less than 10% of the forested landscape. Aombination of wildfire and insect outbreaks killed multi-storyarge-tree forests almost as fast as stands reached large, multi-toried condition in our simulations. This was particularlyrue in cool-moist and cold forests where infrequent wildfirellows high stand densities in early stand development. Theurrently existing structural conditions, driven by decades of fireuppression and various management activities, may be nowhereear a dynamic equilibrium. An expectation that the currentandscape condition contains sustainable or stable amounts ofarious forest structures, and habitats may be unreasonable.
The decline of single story forests of large, fire-resistantrees and an increase in dense forests of smaller, fire-intolerantrees has been well documented in the interior Columbia basine.g., Everett et al., 1994; Hann et al., 1997; Hessburg et al.,999; Hemstrom et al., 2001; Hessburg and Agee, 2003) andore generally in western North America (e.g., Covington andoore, 1994; Peet, 2000). Several decades of fire suppression
llowed fire-intolerant species such as grand fir to becomestablished in the understory of previously open forests. Inddition, timber harvest and insect activity reduced numbersf large ponderosa pine and other fire-tolerant species. Multi-tory forests, on the other hand, have become more abundantn many places. Multi-story forests with large-trees have notncreased, however, because large-trees in multi-story forests
UPlease cite this article in press as: Hemstrom, M.A. et al., Integrated anamodels in the upper Grande Ronde River Subbasin, Oregon, USA, Landsc
ere lost to timber harvest and insect activity. Our backgroundatural disturbance scenario results, indicating dominance byulti-story small- and medium-tree forests, agree well overall
rends in the interior Columbia River basin.
aloo
PR
OO
F
PRESSrban Planning xxx (2006) xxx–xxx 11
.3. Abundant multi-story large-tree forests may be difficulto sustain
The fire suppression only scenario did not produce large areasf multi-layered, dense large-tree forests, as might be expectedhen fires are suppressed for 200 years. Our models assumed
hat suppression of high-severity wildfires in dense forests isess effective than suppression of surface fires in open forests.lthough we assume that fire suppression reduces the total
mount of wildfire, high-severity wildfire was more commonhan in other scenarios. In addition, insect outbreaks disturbed
ore area, especially in cold forests, than in the other scenarios.oth trends were due to increases in dense, multi-layered forestsn national forest lands as a consequence of fire suppressionnd no fuel management. In our simulations, insect outbreaksnd wildfire converted many multi-layered large tree forestso grass/shrub and seedling/sapling stands about as quickly asrees reached large size. Large-tree forests, especially those with
ulti-layered structure, were less abundant at the end of 200ears than in any other disturbance scenario. Fire suppressionlone might reduce the overall frequency of wildfire comparedo historical conditions but is unlikely to generate large areasf multi-storied large-tree forest. In addition, wildfires wouldore often be of high severity and insect outbreaks would be
onspicuous, leading to questions about the public acceptabilityf a fire suppression only scenario.
None of our scenarios produced abundant multi-story large-ree forests. In fact, those forests declined from current con-itions under all three alternatives. The active fuel treatmentcenario produced slightly more area in large-tree forests thanhe background disturbance scenario, and both produced consid-rably more area in large-tree forests than the fire suppressionnly scenario. The active fuel treatment scenario also generatedore single story large- and medium-tree forests in warm-dry
nvironments than the other scenarios. In all cases, large-treeominated forests were less than 25% of the landscape area.arge trees take 150 years or more to grow in most areas of this
andscape and, when lost, are difficult to replace. In addition,here is some question about the ability of stand thinning and fuelreatment to generate abundant stands of large, open ponderosaine. Ager et al. (this volume) modeled stand-level effects ofark beetles and found that open stands of large ponderosaine could become could suffer more mortality during a barkeetle outbreak. We were not able to fully account for thisffect because their models did not include the suite of naturalisturbances and management activities that occurred in ourodels. Perhaps the reduction in high-severity wildfire under
he active fuel treatment scenario would offset increased insectortality across the landscape. This possibility suggests the
eed for additional integration of stand-level disturbance modelscross large landscapes.
The relatively low levels of multi-story large-tree forestsnder all our scenarios indicate potential difficulties in man-
lysis of landscape management scenarios using state and transitionape Urban Planning (2006), doi:10.1016/j.landurbplan.2006.10.004
gement for wildlife species that are associated with multi-story 825
arge-tree forests. Wisdom et al. (2000) listed several species 826
f conservation concern that are associated with multi-story 827
lder forests. Wales et al. (this volume) discuss the potential 828

ED
IN+ModelL
1 nd U
i829
m830
a831
l832
m833
t834
l835
5836
m837
838
h839
c840
W841
v842
l843
t844
s845
i846
i847
m848
o849
i850
i851
852
a853
e854
a855
a856
i857
s858
m859
r860
t861
a862
r863
864
h865
m866
t867
i868
(869
a870
t871
a872
h873
m874
s875
fi876
a877
t878
W879
t880
t881
w882
f883
g 884
n 885
f 886
s 887
e 888
W 889
c 890
a 891
a 892
s 893
o 894
o 895
d 896
m 897
6 898
899
s 900
r 901
v 902
l 903
u 904
a 905
906
s 907
l 908
o 909
f 910
i 911
n 912
m 913
a 914
t 915
i 916
d 917
A 918
919
U 920
F 921
L 922
F 923
s 924
f 925
G 926
F 927
R 928
A 929
930
NC
OR
RE
CT
ARTICLEAND 1405 1–14
2 M.A. Hemstrom et al. / Landscape a
mpacts of our scenarios on Lynx denning habitat. In effect,ulti-story large-tree forests became more unstable as their
bundance increased in our simulations. We suggest that at someevel managing for high levels of multi-story large-tree forests
ay produce “boom and bust” conditions or other limitations onhe sustainable amount of multi-story large-tree forests in thisandscape.
.4. Strengths and weaknesses of the state and transitionodels approach
State and transition models, in general, appear to us toave several strengths and weaknesses that are important toonsider when contemplating their use for landscape simulation.e used STM because they allow integration of a wide
ariety of information from empirical data, other models, theiterature, and expert opinion. The models are relatively easyo understand because ecological interactions are subsumed intates and transitions. However, portraying complex ecologicalnteractions as boxes and arrows and using a combination ofnformation from other models, the literature, and expert opinion
eans that very complicated interactions and different kindsf information are simplified and combined. Our projections,nterpretations, discussion, and conclusions must be consideredn this light.
Our simulation models are, as is true of all such efforts,formalized set of assumptions about how we think the
cological processes (including human activities) in the studyrea interact to produce vegetation conditions, disturbances,nd associated landscape characteristics. Although we usedndependent information from the literature and from stand-levelilvicultural models to help build and calibrate our STM, ourodels still represent an integration of our assumptions. Our
esults, discussion, and conclusions are based on assumptionshat may or may not represent actual ecological fact or “truth”nd are, therefore, hypotheses about how this landscape mighteact to different management scenarios.
The composition and structure of vegetation through time isighly variable in this and landscapes of similar size, environ-ent, and vegetation conditions. Our models were not-spatial;
hey did not simulate stand-level effects of management activ-ties and disturbance. Results obtained from spatially explicite.g., patch-level) simulations provide important informationbout patch sizes, inter-patch distances, and other patch metricshat our models do not provide. Keane et al. (2002), using
spatially explicit (i.e., patch-level) landscape model foundigh levels of variability in community dynamics and patchetrics over time in comparable landscapes and suggested that
imulation time periods should be at least 10 times the longestre return interval to include rare but important events. Theylso suggest that landscapes should be large (e.g., >100,000 ha)o capture landscape patterns caused by large, rare fire events.
imberly (2002), working in the Oregon Coast Range, found
UPlease cite this article in press as: Hemstrom, M.A. et al., Integrated anamodels in the upper Grande Ronde River Subbasin, Oregon, USA, Landsc
hat even larger landscapes (e.g., >200,000 ha) were requiredo simulate the full range of historical wildfires. Our landscapeas likely large enough to capture a representative range of
orest and disturbance conditions in this environment, especially
A
A
PR
OO
F
PRESSrban Planning xxx (2006) xxx–xxx
iven the non-spatial nature of the models we used. We didot find very long simulation time periods to be necessaryor the quasi-stable landscape condition to emerge under ourcenarios, probably because our models were not spatiallyxplicit and did not consider patch-level disturbance dynamics.e also found the non-spatial VDDT model much easier to
alibrate than spatially explicit models. We expect that VDDTnd similar models would be much easier to adapt for oper-tional use by forest managers, particularly for large land-capes, than spatially explicit models. Perhaps a combinationf approaches, using non-spatial models for general estimatesf trends across large areas and spatially explicit models for localrill-down to patch characteristics would be work well for landanagers.
. Conclusions
State and transition models, in general, appear to us to haveeveral strengths and weaknesses that pertain to interpreting ouresults. We used STMs because they allow integration of a wideariety of information from empirical data, other models, theiterature, and expert opinion. The models are relatively easy tose and understand. This simplification, however, limited ourbility to include detailed ecological relations and processes.
Several interesting landscape hypotheses emerge from ourcenario simulations: (1) changes in management approach inandscapes the size of our study area may take decades or playut owing to the time required to grow large trees and theeedback loops among disturbances, (2) the current landscapes considerably different from that which might exist under aatural disturbance regime, (3) fire suppression alone does notimic background natural disturbances and does not produce
bundant large-tree structure, and (4) dense, multi-layered large-ree forests may be particularly difficult to maintain in abundancen this and similar landscapes owing to wildfire and insectisturbances.
cknowledgements
The authors would like to acknowledge support from theSDA Forest Service, PNW Research Station and the USDAorest Service National Fire Plan for project funding and theaGrande Ranger District of the Wallowa-Whitman Nationalorest for assistance in building and calibrating models andupplying vegetation data. We also very much appreciate helprom Martha Aitken of the PNW Research Station in buildingIS datasets and from David Powell of the Umatilla Nationalorest in building VDDT models.
eferences
gee, J.K., 1993. Fire Ecology of Pacific Northwest Forests. Island Press,Washington, DC, 493.
lysis of landscape management scenarios using state and transitionape Urban Planning (2006), doi:10.1016/j.landurbplan.2006.10.004
gee, J.K., 2003. Historical range of variability in eastern Cascades forests, 931
Washington USA. Landscape Ecol. 18, 725–740. 932
ger, A.A., Hayes, J.L., Schmidt, C.L., 2004. Simulating mortality from insects 933
and diseases. In: Hayes, J.L., Ager, A.A., Barbour, R.J. (Eds.), Methods for 934
Integrating Modeling of Landscape Change: Interior Northwest Landscape 935

D
IN+ModelL
nd U
936
937
A938
939
940
A941
942
943
944
B945
946
947
948
B949
950
951
B952
953
954
B955
956
957
958
959
960
B961
962
963
C964
965
C966
967
C968
969
970
971
E972
973
974
975
G976
977
978
979
G980
981
982
H983
984
985
986
987
988
989
H990
991
H992
993
994
995
996
997
H998
999
1000
1001
H1002
1003
H 1004
1005
1006
1007
1008
1009
1010
H 1011
1012
1013
H 1014
1015
1016
J 1017
1018
1019
J 1020
1021
K 1022
1023
1024
1025
K 1026
1027
1028
K 1029
1030
1031
L 1032
1033
M 1034
1035
1036
M 1037
1038
1039
1040
M 1041
1042
1043
1044
1045
N 1046
1047
1048
P 1049
1050
1051
R 1052
1053
1054
1055
1056
S 1057
1058
1059
1060
1061
T 1062
1063
U 1064
1065
U 1066
NC
OR
RE
CTE
ARTICLEAND 1405 1–14
M.A. Hemstrom et al. / Landscape a
Analysis System. Gen. Tech. Rep. PNW-GTR-610. USDA Forest Service,Pacific Northwest Research Station, Portland, OR, pp. 104–116.
ger, A.A., MacMahan, A., Hayes, J.L., Smith, E., this volume. Modeling theeffects of thinning on bark beetle and potential wildfire impacts in the BlueMountains of northeastern Oregon. Landscape Urban Plan.
lig, R.J., Zheng, D., Spies, T.A., Butler, B.J., 2000. Forest cover dynamics inthe Pacific Northwest west side: regional trends and projections. Res. Pap.PNW-RP-522. USDA Forest Service, Pacific Northwest Research Station,Portland, OR, 22 pp.
arrett, T.M., 2001. Models of vegetative change for landscape planning: acomparison of FETM, LANDSUM, SIMPPLLE, and VDDT. Gen. Tech.Rep. RMRS-GTR-76-WWW. USDA Forest Service, Rocky MountainResearch Station, Ogden, UT, 14 pp.
ettinger, P., Sessions, J., Boston, K., 1997. Using tabu search to schedule timberharvests subject to spatial wildlife goals for big game. Ecol. Model. 94,111–123.
ettinger, P., Sessions, J., Johnson, K.N., 1998. Ensuring the compatibility ofaquatic habitat and commodity production goals in eastern Oregon with atabu search procedure. For. Sci. 44, 96–112.
ettinger, P., Graetz, D., Ager, A.A., Sessions, J., 2004. The SafeD forestlandscape planning model. In: Hayes, J.L., Ager, A.A., Barbour, R.J. (Eds.),Methods for Integrating Modeling of Landscape Change: Interior NorthwestLandscape Analysis System. Gen. Tech. Rep. PNW-GTR-610. USDAForest Service. Pacific Northwest Research Station, Portland, OR, pp. 41–63.
eukema, S.J., Kurz, W.A., Pinkham, C.B., Milosheva, K., Frid, L., 2003.Vegetation Dynamics Development Tool, User’s Guide, Version 4.4c. ESSATechnologies Ltd., Vancouver, British Columbia, Canada, 239 pp.
attelino, P.M., Noble, I.R., Slatyer, R.O., Kessell, S.R., 1979. Predicting themultiple pathways of plant succession. Environ. Manage. 3, 41–50.
ovington, W.W., Moore, M.M., 1994. Southwestern ponderosa forest structurechanges since Euro-American settlement. J. For. 92, 39–47.
rookston, N.L., Stage, A.R., 1999. Percent canopy cover and stand structurestatistics from the forest vegetation simulator. Gen. Tech. Rep. RMRS-GTR-24. USDA Forest Service, Rocky Mountain Research Station, Fort Collins,CO, 15 pp.
verett, R.L., Hessburg, P.F., Jensen, M.E., Bormann, B., 1994. Eastsideforest ecosystem health assessment. Gen. Tech. Rep. PNW-GTR-317.USDA Forest Service, Pacific Northwest Research Station, Portland, OR,61 pp.
raetz, D.H., 2000. The SafeD model: incorporating episodic disturbancesand heuristic programming into forest management planning for theApplegate River watershed, southwestern Oregon. M.S. Thesis, Oregon StateUniversity, Corvallis, OR, 127 pp.
raetz, D.H., Sessions, J., Garman, S., this volume. Using stand-level optimiza-tion to reduce crown fire risk in the Blue Mountains of eastern Oregon.Landscape Urban Plan.
ann, W.J., Jones, J.L., Karl, M.G., Hessburg, P.F., Keane, R.E., Long, D.G.,Menakis, J.P., McNicoll, C.H., Leonard, S.G., Gravenmier, R.A., Smith,B.G., 1997. Landscape dynamics of the basin. In: Quigley, T.M., Arbelbide,S.J. (Eds.), An Assessment of Ecosystem Components in the InteriorColumbia Basin and Portions of the Klamath and Great Basins. Gen. Tech.Rep. PNW-GTR-405. USDA Forest Service, Pacific Northwest ResearchStation, Portland, OR, pp. 337–1055.
ayes, J.L., Daterman, G.E., 2001. Bark beetles (Scolytidae spp.) in easternOregon and Washington. Northwest Sci. 75, 21–30.
emstrom, M.A., Ager, A.A., Vavra, M., Wales, B.C., Wisdom, M.J., 2004.State and transition approach for integrating landscape models. In: Hayes,J.L., Ager, A.A., Barbour, R.J. (Eds.), Methods for Integrating Modelingof Landscape Change: Interior Northwest Landscape Analysis System.Gen. Tech. Rep. PNW-GTR-610. USDA Forest Service, Pacific NorthwestResearch Station, Portland, OR, pp. 17–40.
emstrom, M.A., Korol, J.J., Hann, W.J., 2001. Trends in terrestrial plant
UPlease cite this article in press as: Hemstrom, M.A. et al., Integrated anamodels in the upper Grande Ronde River Subbasin, Oregon, USA, Landsc
communities and landscape health indicate the effects of alternativemanagement strategies in the interior Columbia River basin. For. Ecol.Manage. 5504, 1–21.
essburg, P.F., Agee, J.K., 2003. An environmental narrative of inland northwestUnited States forests, 1800–2000. For. Ecol. Manage. 178, 23–59.
V
PR
OO
F
PRESSrban Planning xxx (2006) xxx–xxx 13
essburg, P.F., Smith, B.G., Kreiter, S.D., Miller, C.A., Salter, R.B., McNicoll,C.H., Hann, W.J., 1999. Historical and Current Forest and Range Landscapesin the Interior Columbia River Basin and Portions of the Klamath and GreatBasins. Part I: Linking Vegetation Patterns and Landscape Vulnerability toPotential Insect and Pathogen Disturbances. Gen. Tech. Rep. PNW-GTR-458, USDA Forest Service, Pacific Northwest Research Station, Portland,OR, 357 pp.
eyerdahl, E., Brubaker, L.B., Agee, J.K., 2001. Factors controlling spatialvariation in historical fire regimes: a multiscale example from the interiorwest USA. Ecology 82, 660–678.
orn, H.S., 1975. Markovian properties of forest succession. In: Cody, M.L.,Diamond, J.M. (Eds.), Ecology and Evolution of Communities. HarvardUniversity Press, Cambridge, MA, pp. 196–211.
ohnson, C.G., Jr., Clausnitzer, R.R., 1992. Plant associations of the Blueand Ochoco Mountains. R6-ERWT-036-92. USDA Forest Service, PacificNorthwest Region, Portland, OR, 164 pp.
ohnson, K.N., Stuart, T.W., Crim, S.A., 1986. FORPLAN Version 2: AnOverview. USDA Forest Service, Washington, DC, 98 pp.
eane, R.E., Menakis, J.P., Long, D., Hann, W.J., Bevins, C., 1996. Simu-lating coarse-scale dynamics using the Columbia River basin successionmodel—CRBSUM. Gen. Tech. Rep. INT-GTR-340. USDA Forest Service,Intermountain Research Station, Ogden, UT, 50 pp.
eane, R.E., Parsons, R.A., Hessburg, P.A., 2002. Estimating historical rangeand variation of landscape patch dynamics: limitations of the simulationapproach. Ecol. Model. 151, 29–49.
urz, W.A., Beukemei, S.J., Klenner, W., Greenough, J.A., Robinson, D.C.E.,Sharpe, A.D., Webb, T.M., 2000. TELSA: the tool for exploratory landscapescenario analysis. Comput. Electron. Agr. 27, 227–242.
aycock, W.A., 1991. Stable states and thresholds of range condition on NorthAmerican rangelands: a viewpoint. J. Range Manage. 44, 427–433.
auroka, K.R., 1994. Fire history of Pseudotsuga menziesii and Abies grandisstands in the Blue Mountains of Oregon and Washington. M.S. Thesis,University of Washington, Seattle, WA, 73 pp.
erzenich, J., Kurz, W.A., Beukema, S., Arbaugh, M., Schilling, S., 2003.Determining forest fuel treatments for the Bitterroot front using VDDT. In:Arthaud, G.J., Barrett, T.M. (Eds.), Systems Analysis in Forest Resources.Kluwer Academic Publishers, New York, pp. 47–59.
ladenoff, D.J., He, H.S., 1999. Design and behavior of LANDIS, anobject-oriented model of forest landscape disturbance and succession. In:Mladenoff, D.J., Baker, W.L. (Eds.), Advances in Spatial Modeling of ForestLandscape Change: Approaches and Applications. Cambridge UniversityPress, Cambridge, UK, pp. 125–162.
oble, I.R., Slatyer, R.O., 1980. The use of vital attributes to predict successionalchanges in plant communities subject to recurrent disturbances. Vegetatio43, 5–21.
eet, R.K., 2000. Forests and meadows of the Rocky Mountains. In: Bar-bour, M.G., Billings, W.D. (Eds.), North American Terrestrial Vegetation.Cambridge University Press, Cambridge, UK, pp. 75–122.
iggs, R.A., Tiedemann, A.R., Cook, J.G., Ballard, T.M., Edgerton, P.J., Vavra,M., Krueger, W.C., Hall, F.C., Bryant, L.D., Irwin, L.L., Delcurto, T.,2000. Modification of mixed-conifer forests by ruminant herbivores in theBlue Mountains ecological province. Res. Pap. PNW-RP-527. USDA ForestService, Pacific Northwest Research Station, Portland, OR, 77 pp.
essions, J., Johnson, K.N., Franklin, J.F., Gabriel, J.T., 1999. Achievingsustainable forest structures on fire prone landscapes while pursuing multiplegoals. In: Mladenoff, D.J., Baker, W.L. (Eds.), Spatial Modeling of ForestLandscape Change. Cambridge University Press, Cambridge, UK, pp.210–255.
orgersen, T.R., 2001. Defoliators in eastern Oregon and Washington. NorthwestSci. 75, 11–20.
SDA Forest Service, 1980–2000. Annual insect and disease conditions report.USDA Forest Service, Pacific Northwest Region, Portland, OR.
SDA Forest Service, USDI Bureau of Land Management, 2000. Interior
lysis of landscape management scenarios using state and transitionape Urban Planning (2006), doi:10.1016/j.landurbplan.2006.10.004
Columbia Basin Final Environmental Impact Statement, BLM/OR/WA/Pt- 1067
01/010+1792. Portland, OR irregular pagination. 1068
avra, M., Hemstrom, M.A., Wisdom, M., this volume. Herbivory: Developing 1069
models to describe the impact on plant community composition and 1070
structure, and interactions with other disturbances. Landscape Urban Plan. 1071
mhemstro
Cross-Out
mhemstro
Replacement Text
Ager, A.A., MacMahan, A., Hayes, J.L., Smith, E., Modeling the effects of thinning on bark beetle impacts and wildfire potential in the Blue Mountains of eastern Oregon. Landscape and Urban Planning (2006), doi:10.1016/j.landurbplan.2006.10.010
mhemstro
Cross-Out
mhemstro
Replacement Text
Vavra, M., Hemstrom, M.A., Wisdom, M., Modeling the effects of herbivores on the abundance of forest overstory states using a state-transition approach in the upper Grande Ronde River Basin, Oregon, USA, Landscape Urban Planning (2006), doi:10.1016/j.landurbplan.2006.10.005
mhemstro
Cross-Out

IN+ModelL
1 nd U
W1072
1073
1074
W1075
1076
W1077
1078
W1079
W 1080
1081
1082
W 1083
ARTICLEAND 1405 1–14
4 M.A. Hemstrom et al. / Landscape a
ales, B.C., Suring, L.H., Hemstrom, M.A., this volume. Assessment of long-term trends in large tree wildlife habitat associated with fire and fuelmanagement in Northeast Oregon, USA. Landscape Urban Plan.
edin, H., 1999. Stand level prescription generation under multiple objectives.
UN
CO
RR
EC
TED
Please cite this article in press as: Hemstrom, M.A. et al., Integrated anamodels in the upper Grande Ronde River Subbasin, Oregon, USA, Landsc
M.S. Thesis. Oregon State University, Corvallis, OR, 178 pp.estoby, M., Walker, B., Noy-Meir, I., 1989. Opportunistic management for
rangelands not at equilibrium. J. Range Manage. 42, 266–276.imberly, M.C., 2002. Spatial simulation of historical landscape patterns in
coastal forests of the Pacific Northwest. Can. J. For. Res. 32, 1316–1328.
PRESSrban Planning xxx (2006) xxx–xxx
imberly, M.C., Spies, T.A., Long, C.J., Whitlock, C., 2000. Simulatinghistorical variability in the amount of old forests in the Oregon Coast Range.Conserv. Biol. 14, 167–180.
isdom, M.J., Holthausen, R.S., Wales, B.C., Hargis, C.D., Saab, V.A., Lee,
PR
OO
F
lysis of landscape management scenarios using state and transitionape Urban Planning (2006), doi:10.1016/j.landurbplan.2006.10.004
D.C., Hann, W.J., Rich, T.D., Rowland, M.M., Murphy, W.J., Eames, 1084
M.R., 2000. Source habitats for terrestrial vertebrates of focus in the 1085
interior Columbia basin: broad-scale trends and management implications. 1086
Gen. Tech. Rep. PNW-GTR-485. USDA Forest Service, Pacific Northwest 1087
Research Station, Portland, OR, 434 pp. 1088
mhemstro
Cross-Out
mhemstro
Replacement Text
Wales, B.C., Suring, L.H., Hemstrom M.A. 2006. Modeling potential outcomes of fire and fuel management scenarios on the structure of forested habitats in northeast Oregon, USA, Landscape Urban Planning doi:10.1016/j.landurbplan.2006.10.006