HemoCue Hb 201 DM Analyzer & HemoCue DM … · 1 Introduction 3 PART I 1 Introduction Note! Prior...
282
HemoCue Hb 201 DM Analyzer & HemoCue DM Docking Station Reference Manual
Transcript of HemoCue Hb 201 DM Analyzer & HemoCue DM … · 1 Introduction 3 PART I 1 Introduction Note! Prior...
HemoCue Hb 201 DM Analyzer& HemoCue DM Docking Station
Reference Manual

CONTENTS
CONTENTS
PART I Introduction . . . . . . . . . . . . . . . . . . . 1
1 Introduction . . . . . . . . . . . . . . . . . . . . 3
1.1 The HemoCue Hb 201 DM System. . . . . . . . . . 41.1.1 Unpacking . . . . . . . . . . . . . . . . . . . . . . . . . . . . . . . . . . 4
1.1.2 Inspection . . . . . . . . . . . . . . . . . . . . . . . . . . . . . . . . . . 5
1.1.3 Materials required but not provided . . . . . . . . . . . . . . . 5
1.2 Abbreviations/glossary . . . . . . . . . . . . . . . . . . . 6
1.3 Designated Terminology . . . . . . . . . . . . . . . . . . 9
1.4 Functional description . . . . . . . . . . . . . . . . . . . 111.4.1 System Components . . . . . . . . . . . . . . . . . . . . . . . . . 11
1.4.2 Analyzer overview . . . . . . . . . . . . . . . . . . . . . . . . . . . 13
1.4.3 Docking station – General . . . . . . . . . . . . . . . . . . . . . 16
1.4.4 Docking Station overview . . . . . . . . . . . . . . . . . . . . . 18
1.4.5 Functions and features . . . . . . . . . . . . . . . . . . . . . . . 23
2 Safety . . . . . . . . . . . . . . . . . . . . . . . 25
2.1 HemoCue Hb 201 DM System . . . . . . . . . . . . 252.1.1 Usage of the System . . . . . . . . . . . . . . . . . . . . . . . . . 25
2.2 General . . . . . . . . . . . . . . . . . . . . . . . . . . . . . . 262.2.1 Hazard information . . . . . . . . . . . . . . . . . . . . . . . . . . 26
2.3 Handling of the System . . . . . . . . . . . . . . . . . . 272.3.1 System Components . . . . . . . . . . . . . . . . . . . . . . . . . 27
i
CONTENTS
3 Installation/General operations . . . . . . 29
3.1 Getting started – Analyzer . . . . . . . . . . . . . . . . 293.1.1 Power source. . . . . . . . . . . . . . . . . . . . . . . . . . . . . . . 293.1.2 Turning on the Analyzer . . . . . . . . . . . . . . . . . . . . . . 343.1.3 Power saver mode. . . . . . . . . . . . . . . . . . . . . . . . . . . 363.1.4 Turning the Analyzer off . . . . . . . . . . . . . . . . . . . . . . 363.1.5 Loading the Analyzer with a Cuvette . . . . . . . . . . . . . 37
3.2 Getting started – Single Docking Station. . . . . 383.2.1 Connect to a PC or a LAN . . . . . . . . . . . . . . . . . . . . . 383.2.2 Power source. . . . . . . . . . . . . . . . . . . . . . . . . . . . . . . 41
3.3 Getting started – Multiple Docking Stations. . . 423.3.1 Connecting Docking Stations . . . . . . . . . . . . . . . . . . 423.3.2 Connect to a PC or a LAN . . . . . . . . . . . . . . . . . . . . . 453.3.3 Power source. . . . . . . . . . . . . . . . . . . . . . . . . . . . . . . 46
3.4 Docking Station LED . . . . . . . . . . . . . . . . . . . . 47
3.5 How to operate the Display . . . . . . . . . . . . . . . 493.5.1 Display buttons . . . . . . . . . . . . . . . . . . . . . . . . . . . . . 493.5.2 Using the Barcode Scanner button . . . . . . . . . . . . . . 52
3.6 Operating the Analyzer . . . . . . . . . . . . . . . . . . 543.6.1 Start up . . . . . . . . . . . . . . . . . . . . . . . . . . . . . . . . . . . 543.6.2 Login Image. . . . . . . . . . . . . . . . . . . . . . . . . . . . . . . . 553.6.3 Main Menu and On-line Help. . . . . . . . . . . . . . . . . . . 56
3.7 Display buttons and symbols. . . . . . . . . . . . . . 573.7.1 Navigation buttons. . . . . . . . . . . . . . . . . . . . . . . . . . . 573.7.2 Procedure buttons . . . . . . . . . . . . . . . . . . . . . . . . . . . 583.7.3 Other display buttons. . . . . . . . . . . . . . . . . . . . . . . . . 593.7.4 Display symbols. . . . . . . . . . . . . . . . . . . . . . . . . . . . . 623.7.5 Entering information with letters and digits . . . . . . . . 643.7.6 Entering information from barcodes . . . . . . . . . . . . . 67
ii
CONTENTS
PART II Settings . . . . . . . . . . . . . . . . . . . . . 69
4 Settings . . . . . . . . . . . . . . . . . . . . . . 71
4.1 Activating the Settings procedure . . . . . . . . . . 71
4.2 Define Lists . . . . . . . . . . . . . . . . . . . . . . . . . . . 744.2.1 Liquid Controls. . . . . . . . . . . . . . . . . . . . . . . . . . . . . . 75
4.2.2 Cuvette Batches . . . . . . . . . . . . . . . . . . . . . . . . . . . . 81
4.2.3 Define Operators . . . . . . . . . . . . . . . . . . . . . . . . . . . . 85
4.2.4 Define Comments . . . . . . . . . . . . . . . . . . . . . . . . . . . 90
4.2.5 Define Log Notes. . . . . . . . . . . . . . . . . . . . . . . . . . . . 93
4.3 Basic Settings . . . . . . . . . . . . . . . . . . . . . . . . . 964.3.1 Date/Time . . . . . . . . . . . . . . . . . . . . . . . . . . . . . . . . . 97
4.3.2 Power Saver . . . . . . . . . . . . . . . . . . . . . . . . . . . . . . . 99
4.3.3 Audible Signals . . . . . . . . . . . . . . . . . . . . . . . . . . . . 100
4.3.4 Language. . . . . . . . . . . . . . . . . . . . . . . . . . . . . . . . . 101
4.4 Advanced Settings . . . . . . . . . . . . . . . . . . . . 1024.4.1 General Settings . . . . . . . . . . . . . . . . . . . . . . . . . . . 103
4.4.2 Patient Test Settings . . . . . . . . . . . . . . . . . . . . . . . . 113
4.4.3 QC Test Settings . . . . . . . . . . . . . . . . . . . . . . . . . . . 122
4.4.4 Linearity Test Settings . . . . . . . . . . . . . . . . . . . . . . . 134
4.5 Default Settings . . . . . . . . . . . . . . . . . . . . . . . 136
4.6 Infra Red . . . . . . . . . . . . . . . . . . . . . . . . . . . . 1374.6.1 The transmitting Analyzer . . . . . . . . . . . . . . . . . . . . 137
4.6.2 The Receiving Analyzer. . . . . . . . . . . . . . . . . . . . . . 140
4.7 Docking Station Settings . . . . . . . . . . . . . . . . 141
iii
CONTENTS
PART III Routine use . . . . . . . . . . . . . . . . . 143
5 Blood specimen collection . . . . . . . . . 145
5.1 Capillary blood. . . . . . . . . . . . . . . . . . . . . . . . 145
5.2 Venous and Arterial Blood. . . . . . . . . . . . . . . 151
6 Patient Test procedure . . . . . . . . . . . 153
6.1 Patient Test . . . . . . . . . . . . . . . . . . . . . . . . . . 1536.1.1 Patient Test Result . . . . . . . . . . . . . . . . . . . . . . . . . 159
6.1.2 Verify . . . . . . . . . . . . . . . . . . . . . . . . . . . . . . . . . . . . 161
6.1.3 Entering Comments. . . . . . . . . . . . . . . . . . . . . . . . . 163
6.1.4 Entering Comments – Verified sample . . . . . . . . . . 168
7 STAT Test procedure . . . . . . . . . . . . 171
7.1 STAT Test . . . . . . . . . . . . . . . . . . . . . . . . . . . 1717.1.1 STAT Test Result . . . . . . . . . . . . . . . . . . . . . . . . . . 173
8 QC Test procedure . . . . . . . . . . . . . . 175
8.1 Events necessitating QC Tests . . . . . . . . . . . 1758.1.1 QC Reminder. . . . . . . . . . . . . . . . . . . . . . . . . . . . . . 175
8.1.2 QC Lockout . . . . . . . . . . . . . . . . . . . . . . . . . . . . . . . 177
8.1.3 Supervisory Lockout . . . . . . . . . . . . . . . . . . . . . . . . 178
8.2 Performing a QC Test . . . . . . . . . . . . . . . . . . 1798.2.1 QC Tests at a specific concentration level . . . . . . . 181
8.2.2 Linearity Test . . . . . . . . . . . . . . . . . . . . . . . . . . . . . . 186
8.2.3 Proficiency Test . . . . . . . . . . . . . . . . . . . . . . . . . . . . 197
iv
CONTENTS
9 Reviewing stored data . . . . . . . . . . . 201
9.1 Activating the Stored Data procedure . . . . . . 201
9.2 Review Stored Data. . . . . . . . . . . . . . . . . . . . 2049.2.1 Review All Data . . . . . . . . . . . . . . . . . . . . . . . . . . . . 205
9.2.2 Review PAT/STAT. . . . . . . . . . . . . . . . . . . . . . . . . . 207
9.2.3 Review QC Tests. . . . . . . . . . . . . . . . . . . . . . . . . . . 210
9.2.4 Review Analyzer Log. . . . . . . . . . . . . . . . . . . . . . . . 217
9.3 Delete Stored Data . . . . . . . . . . . . . . . . . . . . 219
9.4 Review Latest Download. . . . . . . . . . . . . . . . 222
9.5 Log Input . . . . . . . . . . . . . . . . . . . . . . . . . . . . 223
10 Data communications . . . . . . . . . . . . 225
10.1 Interaction Application – Analyzer . . . . . . . . . 225
10.2 Docking station setup . . . . . . . . . . . . . . . . . . 226
10.3 Data transfer . . . . . . . . . . . . . . . . . . . . . . . . . 233
PART IV Other actions . . . . . . . . . . . . . . . . 237
11 Maintenance . . . . . . . . . . . . . . . . . . 239
11.1 Cleaning the Cuvette holder and the optronic unit . . . . . . . . . . . . . . . . . . . . . . . . . . . . . 239
11.2 Cleaning the Display . . . . . . . . . . . . . . . . . . . 241
11.3 Cleaning of the Analyzer Outer case and the Docking Station 241
11.4 Calibrating the Display. . . . . . . . . . . . . . . . . . 242
v
CONTENTS
12 Troubleshooting . . . . . . . . . . . . . . . . 245
12.1 Error messages . . . . . . . . . . . . . . . . . . . . . . . 245
PART V Miscellaneous . . . . . . . . . . . . . . . . 253
13 Technical specifications. . . . . . . . . . . 257
13.1 General . . . . . . . . . . . . . . . . . . . . . . . . . . . . . 257
13.2 Intended purpose/ Intended Use . . . . . . . . . . 257
13.3 Theory . . . . . . . . . . . . . . . . . . . . . . . . . . . . . . 257
13.4 Reagents . . . . . . . . . . . . . . . . . . . . . . . . . . . . 258
13.5 Sample material. . . . . . . . . . . . . . . . . . . . . . . 258
13.6 Storage and environmental requirements . . . 258
13.7 Quality Control. . . . . . . . . . . . . . . . . . . . . . . . 259
13.8 Measuring range . . . . . . . . . . . . . . . . . . . . . . 25913.8.1 Whole Blood . . . . . . . . . . . . . . . . . . . . . . . . . . . . . . 259
13.9 Limitations . . . . . . . . . . . . . . . . . . . . . . . . . . . 259
13.10 Expected values . . . . . . . . . . . . . . . . . . . . . . 259
13.11 Technical Specifications . . . . . . . . . . . . . . . . 260
13.12 Signal input and signal output connections . . 261
13.13 Electromagnetic Compatibility . . . . . . . . . . . . 262
vi
CONTENTS
13.14 Warranty . . . . . . . . . . . . . . . . . . . . . . . . . . . . 264
13.15 Spare parts and accessories . . . . . . . . . . . . . 264
13.16 Symbols on System Components and Accessories 265
13.17 References . . . . . . . . . . . . . . . . . . . . . . . . . . 266 APPENDICESA Default Settings . . . . . . . . . . . . . . . . . . . i
vii

CONTENTS
viii

PART I Introduction
Hb 201 DM
Version 1.0
Serial no.0319610019
Hb 201 DM

PART I
This page intentionally left blank
2
1 IntroductionPART I
1 Introduction
Note! Prior to starting the HemoCue Hb 201 DM Analyzer, read section 2 Safety, followed by section 3 Installation/General operations.
Thank you for choosing the HemoCue Hb 201 DM system.
The HemoCue Hb 201 DM system is a compact, portable, yet versatile, hemoglobin measuring system. It is ideally suited for health care facilities that require central lab quality values within a few minutes, at the point of care location.
The System consists of the HemoCue Hb 201 DM Analyzer, the HemoCue DM Docking Station, the HemoCue Hb 201 Microcuvettes.
This Reference Manual contains instructions for settings, quality assessment, patient testing, and troubleshooting of the HemoCue Hb 201 DM Analyzer, as well as installation of the HemoCue DM Docking Station. For information on the HemoCue 201 DM - DMS Software, see the separate User’s Guide on the DMS Software CD.
This chapter gives a brief overview of the functions and features of the Analyzer and the Docking Station.
3
1 Introduction PART I
1.1 The HemoCue Hb 201 DM System
1.1.1 Unpacking
FIGURE 1-1
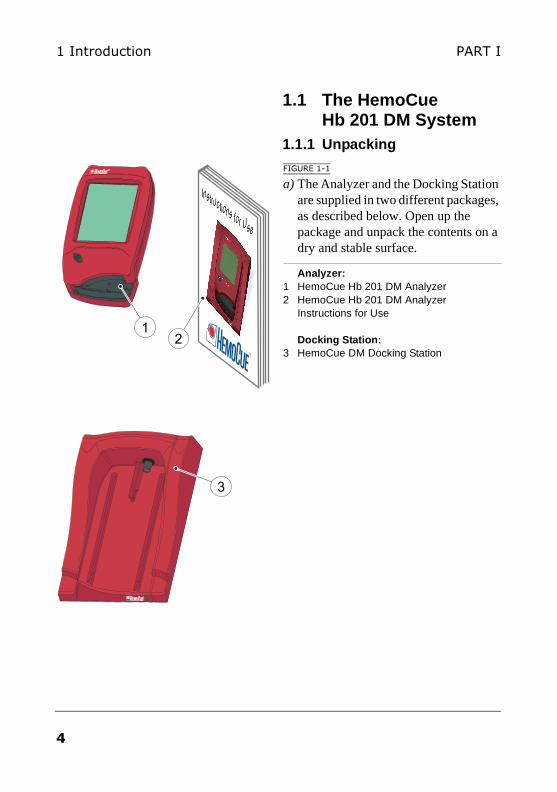
a) The Analyzer and the Docking Station are supplied in two different packages, as described below. Open up the package and unpack the contents on a dry and stable surface.
Analyzer:1 HemoCue Hb 201 DM Analyzer2 HemoCue Hb 201 DM Analyzer
Instructions for Use Docking Station:
3 HemoCue DM Docking Station
Instructions for Use
12
3
4
1 IntroductionPART I
1.1.2 Inspection
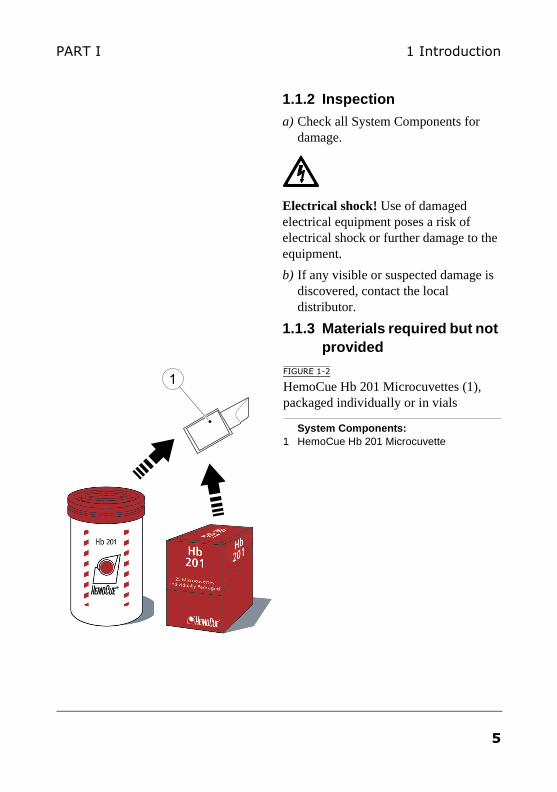
a) Check all System Components for damage.
Electrical shock! Use of damaged electrical equipment poses a risk of electrical shock or further damage to the equipment.
b) If any visible or suspected damage is discovered, contact the local distributor.
1.1.3 Materials required but not provided
FIGURE 1-2
HemoCue Hb 201 Microcuvettes (1), packaged individually or in vials
System Components:1 HemoCue Hb 201 Microcuvette
1
5
1 Introduction PART I
1.2 Abbreviations/glossary
(Continues)
AC Alternating Current
IrD Compact Disc
CIC Connectivity Industry Consortium The CIC was an open, non-profit, industry-driven consortium comprised of device manufacturers, information system vendors and health care providers. It was chartered to address impediments to POC device connectivity with the objective of enabling seamless information exchange between POC devices and electronic medical records and laboratory information systems.
DM Data Management
DMS Data Management Server
HC HemoCue
Hub A physical connecting device A hub is a place of convergence where data arrives from one or more directions and is forwarded in one or more other directions.
IP Internet Protocol
IP-address A number that identifies each sender or receiver of information that is sent in packets across the Internet
IR Infra Red (light) Electromagnetic radiation with wavelengths longer than those of visible light but shorter than those of radio waves
IrDA Infrared Data Association
6
1 IntroductionPART I
(Continues)
(Continues)
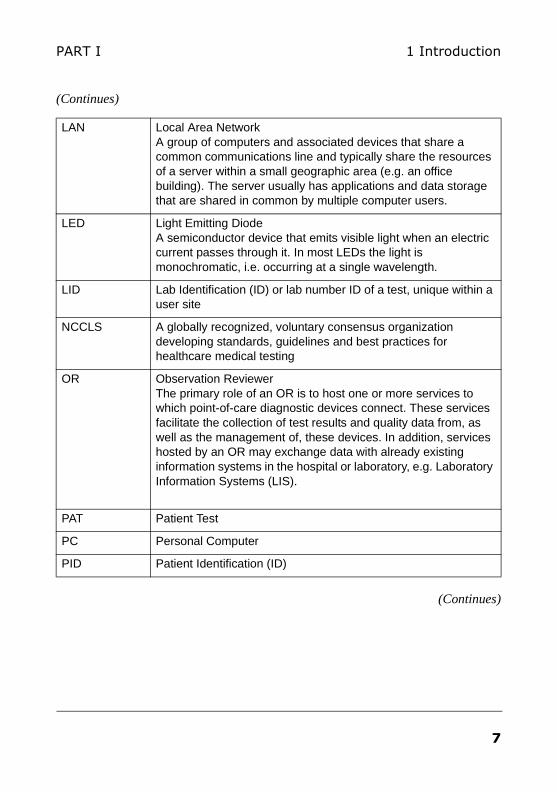
LAN Local Area Network A group of computers and associated devices that share a common communications line and typically share the resources of a server within a small geographic area (e.g. an office building). The server usually has applications and data storage that are shared in common by multiple computer users.
LED Light Emitting Diode A semiconductor device that emits visible light when an electric current passes through it. In most LEDs the light is monochromatic, i.e. occurring at a single wavelength.
LID Lab Identification (ID) or lab number ID of a test, unique within a user site
NCCLS A globally recognized, voluntary consensus organization developing standards, guidelines and best practices for healthcare medical testing
OR Observation Reviewer The primary role of an OR is to host one or more services to which point-of-care diagnostic devices connect. These services facilitate the collection of test results and quality data from, as well as the management of, these devices. In addition, services hosted by an OR may exchange data with already existing information systems in the hospital or laboratory, e.g. Laboratory Information Systems (LIS).
PAT Patient Test
PC Personal Computer
PID Patient Identification (ID)
7
1 Introduction PART I
(Continues)
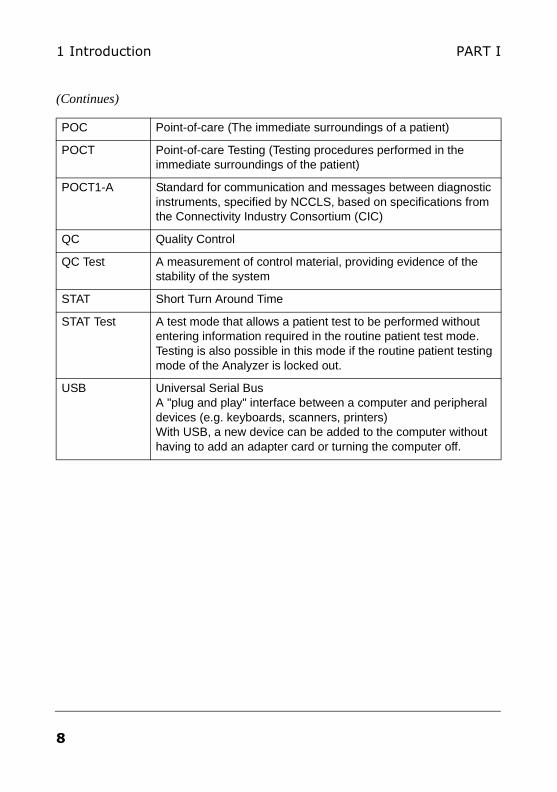
POC Point-of-care (The immediate surroundings of a patient)
POCT Point-of-care Testing (Testing procedures performed in the immediate surroundings of the patient)
POCT1-A Standard for communication and messages between diagnostic instruments, specified by NCCLS, based on specifications from the Connectivity Industry Consortium (CIC)
QC Quality Control
QC Test A measurement of control material, providing evidence of the stability of the system
STAT Short Turn Around Time
STAT Test A test mode that allows a patient test to be performed without entering information required in the routine patient test mode. Testing is also possible in this mode if the routine patient testing mode of the Analyzer is locked out.
USB Universal Serial Bus A "plug and play" interface between a computer and peripheral devices (e.g. keyboards, scanners, printers) With USB, a new device can be added to the computer without having to add an adapter card or turning the computer off.
8
1 IntroductionPART I
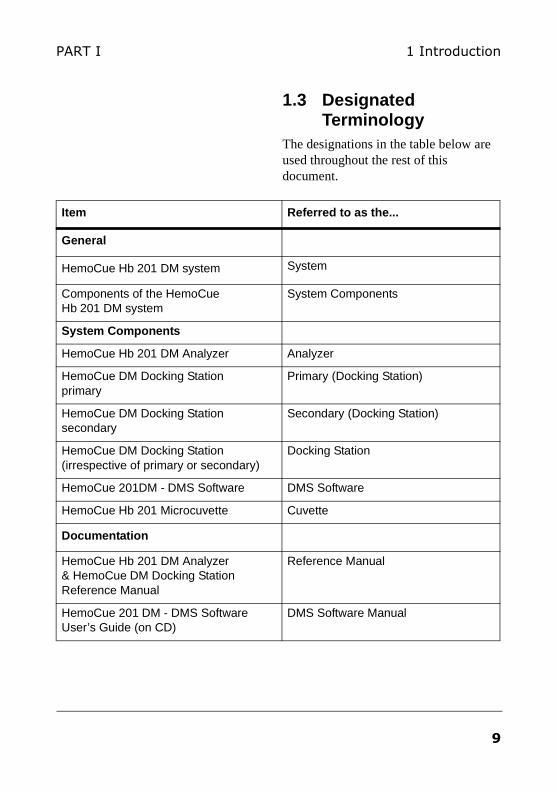
1.3 Designated Terminology
The designations in the table below are used throughout the rest of this document.
Item Referred to as the...
General
HemoCue Hb 201 DM system System
Components of the HemoCue Hb 201 DM system
System Components
System Components
HemoCue Hb 201 DM Analyzer Analyzer
HemoCue DM Docking Station primary
Primary (Docking Station)
HemoCue DM Docking Station secondary
Secondary (Docking Station)
HemoCue DM Docking Station (irrespective of primary or secondary)
Docking Station
HemoCue 201DM - DMS Software DMS Software
HemoCue Hb 201 Microcuvette Cuvette
Documentation
HemoCue Hb 201 DM Analyzer & HemoCue DM Docking Station Reference Manual
Reference Manual
HemoCue 201 DM - DMS Software User’s Guide (on CD)
DMS Software Manual
9
1 Introduction PART I
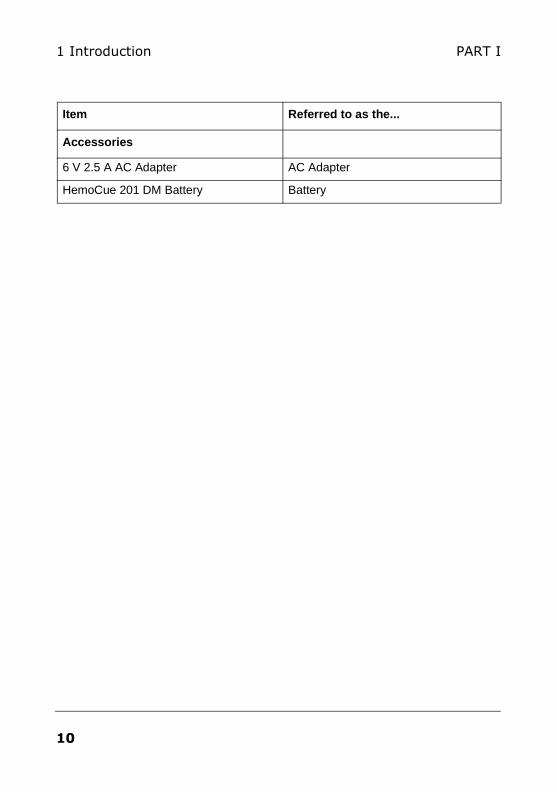
Item Referred to as the...
Accessories
6 V 2.5 A AC Adapter AC Adapter
HemoCue 201 DM Battery Battery
10
1 IntroductionPART I
1.4 Functional description
1.4.1 System Components
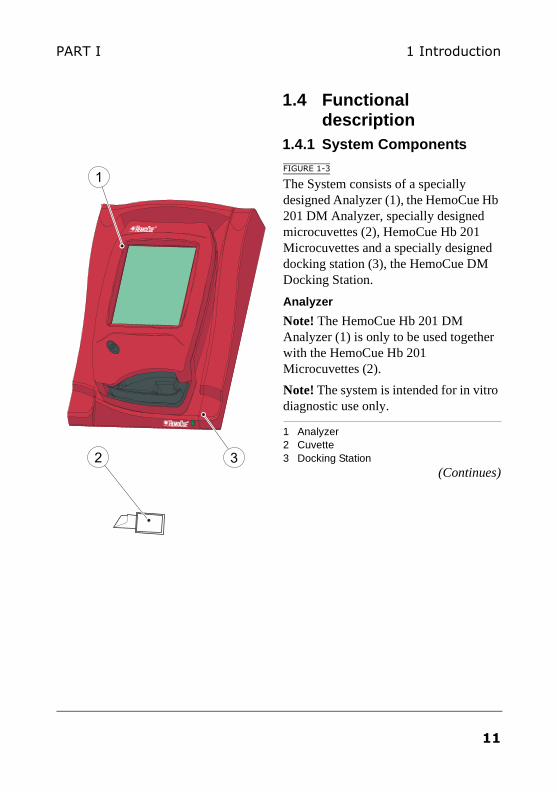
FIGURE 1-3
The System consists of a specially designed Analyzer (1), the HemoCue Hb 201 DM Analyzer, specially designed microcuvettes (2), HemoCue Hb 201 Microcuvettes and a specially designed docking station (3), the HemoCue DM Docking Station.
Analyzer
Note! The HemoCue Hb 201 DM Analyzer (1) is only to be used together with the HemoCue Hb 201 Microcuvettes (2).
Note! The system is intended for in vitro diagnostic use only.
1 Analyzer2 Cuvette3 Docking Station
(Continues)
1
2 3
11

1 Introduction PART I
(Continues)
Docking Station
Full data management is possible when the Analyzer is placed in the Docking Station (3) which is connected via USB or LAN to a PC hosting the DMS Software. The Analyzer Battery is recharged while in the Docking Station.
12
1 IntroductionPART I
1.4.2 Analyzer overview
Front panel
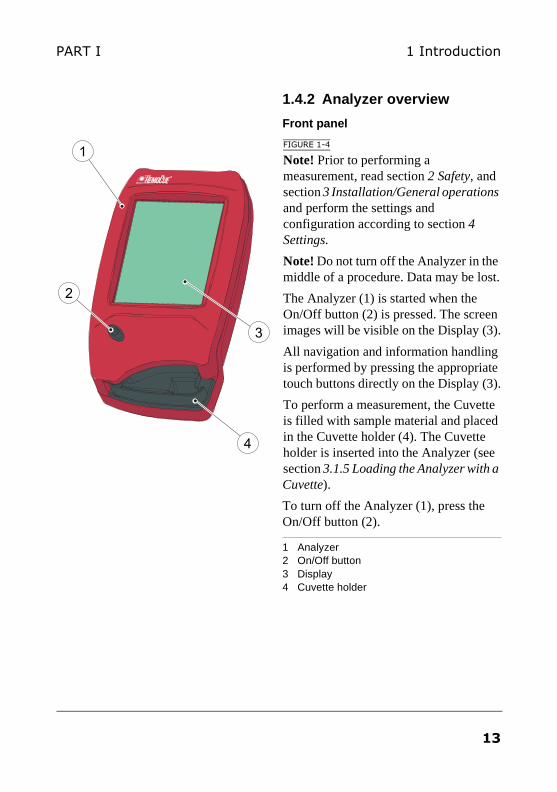
FIGURE 1-4
Note! Prior to performing a measurement, read section 2 Safety, and section 3 Installation/General operations and perform the settings and configuration according to section 4 Settings.
Note! Do not turn off the Analyzer in the middle of a procedure. Data may be lost.
The Analyzer (1) is started when the On/Off button (2) is pressed. The screen images will be visible on the Display (3).
All navigation and information handling is performed by pressing the appropriate touch buttons directly on the Display (3).
To perform a measurement, the Cuvette is filled with sample material and placed in the Cuvette holder (4). The Cuvette holder is inserted into the Analyzer (see section 3.1.5 Loading the Analyzer with a Cuvette).
To turn off the Analyzer (1), press the On/Off button (2).
1 Analyzer2 On/Off button3 Display4 Cuvette holder
1
4
3
2
13
1 Introduction PART I
Back panel
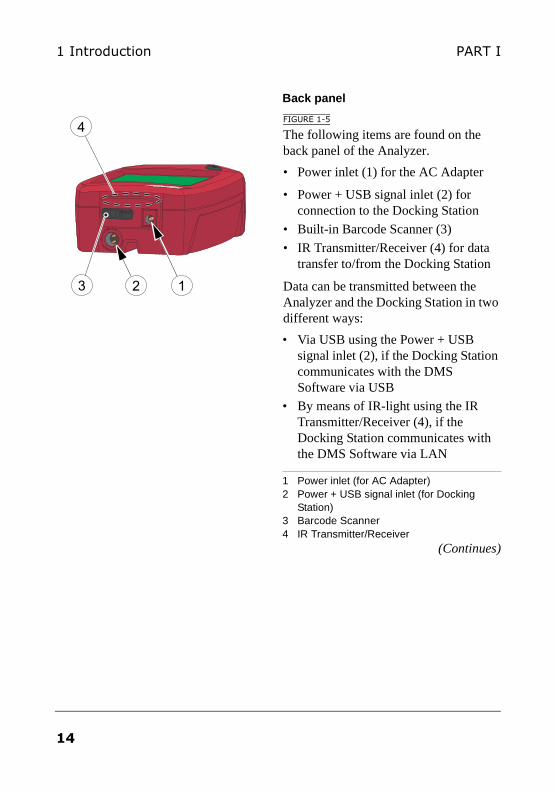
FIGURE 1-5
The following items are found on the back panel of the Analyzer.
• Power inlet (1) for the AC Adapter
• Power + USB signal inlet (2) for connection to the Docking Station
• Built-in Barcode Scanner (3)
• IR Transmitter/Receiver (4) for data transfer to/from the Docking Station
Data can be transmitted between the Analyzer and the Docking Station in two different ways:
• Via USB using the Power + USB signal inlet (2), if the Docking Station communicates with the DMS Software via USB
• By means of IR-light using the IR Transmitter/Receiver (4), if the Docking Station communicates with the DMS Software via LAN
1 Power inlet (for AC Adapter)2 Power + USB signal inlet (for Docking
Station)3 Barcode Scanner4 IR Transmitter/Receiver
(Continues)
3
4
12
14
1 IntroductionPART I
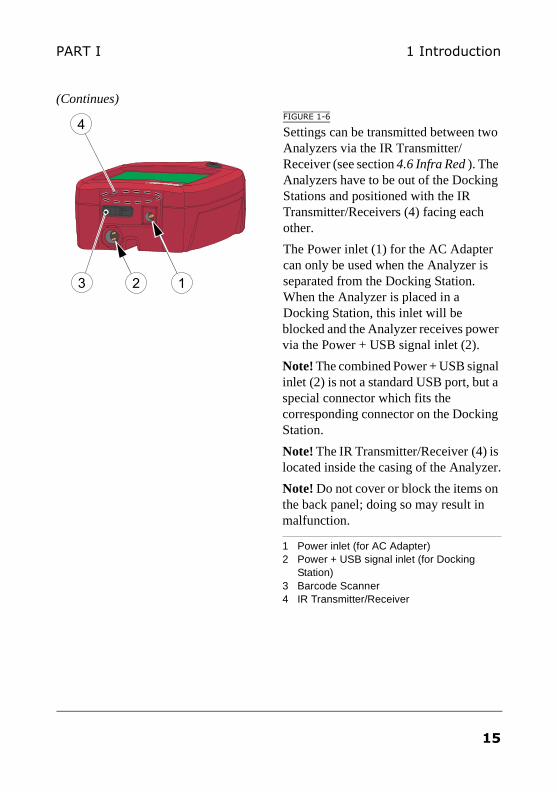
(Continues)FIGURE 1-6
Settings can be transmitted between two Analyzers via the IR Transmitter/Receiver (see section 4.6 Infra Red ). The Analyzers have to be out of the Docking Stations and positioned with the IR Transmitter/Receivers (4) facing each other.
The Power inlet (1) for the AC Adapter can only be used when the Analyzer is separated from the Docking Station. When the Analyzer is placed in a Docking Station, this inlet will be blocked and the Analyzer receives power via the Power + USB signal inlet (2).
Note! The combined Power + USB signal inlet (2) is not a standard USB port, but a special connector which fits the corresponding connector on the Docking Station.
Note! The IR Transmitter/Receiver (4) is located inside the casing of the Analyzer.
Note! Do not cover or block the items on the back panel; doing so may result in malfunction.
1 Power inlet (for AC Adapter)2 Power + USB signal inlet (for Docking
Station)3 Barcode Scanner4 IR Transmitter/Receiver
3
4
12
15
1 Introduction PART I
1.4.3 Docking station – General
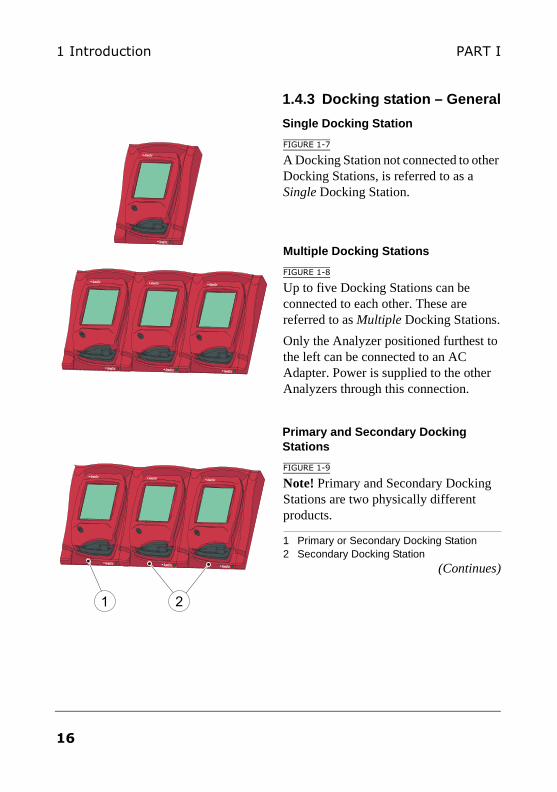
Single Docking Station
FIGURE 1-7
A Docking Station not connected to other Docking Stations, is referred to as a Single Docking Station.
Multiple Docking Stations
FIGURE 1-8
Up to five Docking Stations can be connected to each other. These are referred to as Multiple Docking Stations.
Only the Analyzer positioned furthest to the left can be connected to an AC Adapter. Power is supplied to the other Analyzers through this connection.
Primary and Secondary Docking Stations
FIGURE 1-9
Note! Primary and Secondary Docking Stations are two physically different products.
1 Primary or Secondary Docking Station2 Secondary Docking Station
(Continues)
1 2
16
1 IntroductionPART I
(Continues)FIGURE 1-10
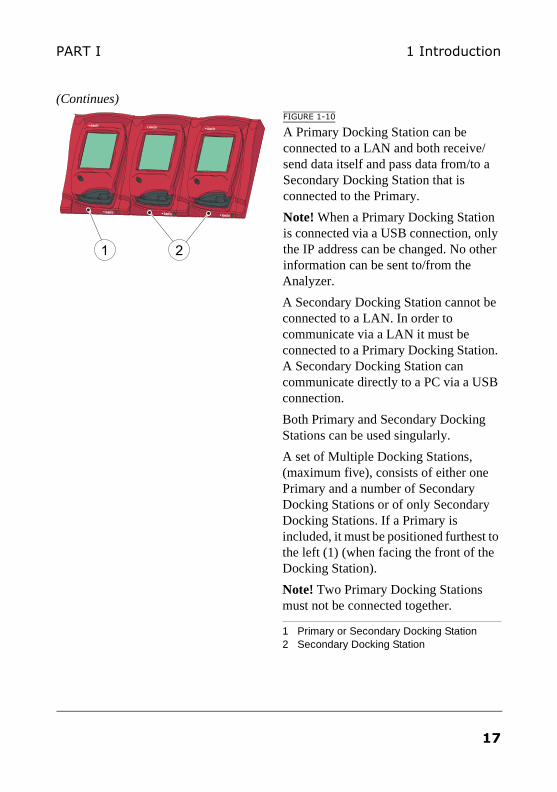
A Primary Docking Station can be connected to a LAN and both receive/send data itself and pass data from/to a Secondary Docking Station that is connected to the Primary.
Note! When a Primary Docking Station is connected via a USB connection, only the IP address can be changed. No other information can be sent to/from the Analyzer.
A Secondary Docking Station cannot be connected to a LAN. In order to communicate via a LAN it must be connected to a Primary Docking Station. A Secondary Docking Station can communicate directly to a PC via a USB connection.
Both Primary and Secondary Docking Stations can be used singularly.
A set of Multiple Docking Stations, (maximum five), consists of either one Primary and a number of Secondary Docking Stations or of only Secondary Docking Stations. If a Primary is included, it must be positioned furthest to the left (1) (when facing the front of the Docking Station).
Note! Two Primary Docking Stations must not be connected together.
1 Primary or Secondary Docking Station2 Secondary Docking Station
1 2
17
1 Introduction PART I
1.4.4 Docking Station overview
Front
FIGURE 1-11
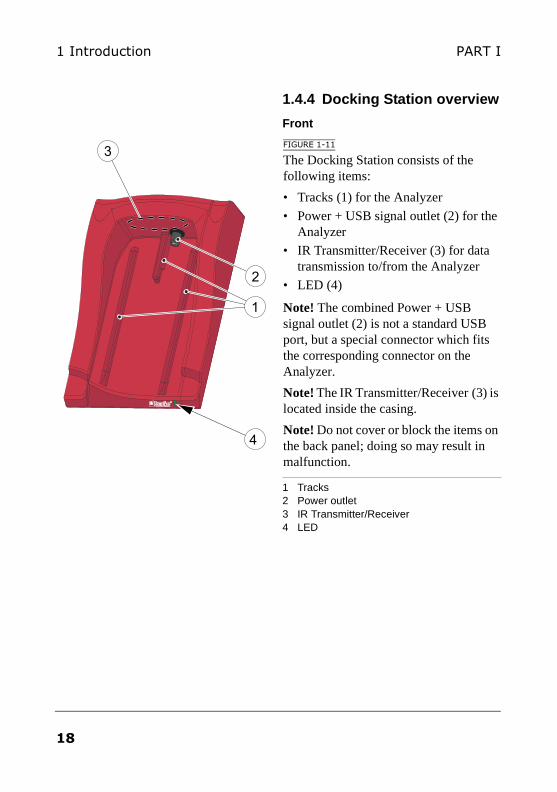
The Docking Station consists of the following items:
• Tracks (1) for the Analyzer
• Power + USB signal outlet (2) for the Analyzer
• IR Transmitter/Receiver (3) for data transmission to/from the Analyzer
• LED (4)
Note! The combined Power + USB signal outlet (2) is not a standard USB port, but a special connector which fits the corresponding connector on the Analyzer.
Note! The IR Transmitter/Receiver (3) is located inside the casing.
Note! Do not cover or block the items on the back panel; doing so may result in malfunction.
1 Tracks2 Power outlet3 IR Transmitter/Receiver4 LED
2
4
3
1
18
1 IntroductionPART I
Back panel – Primary Docking Station
FIGURE 1-12
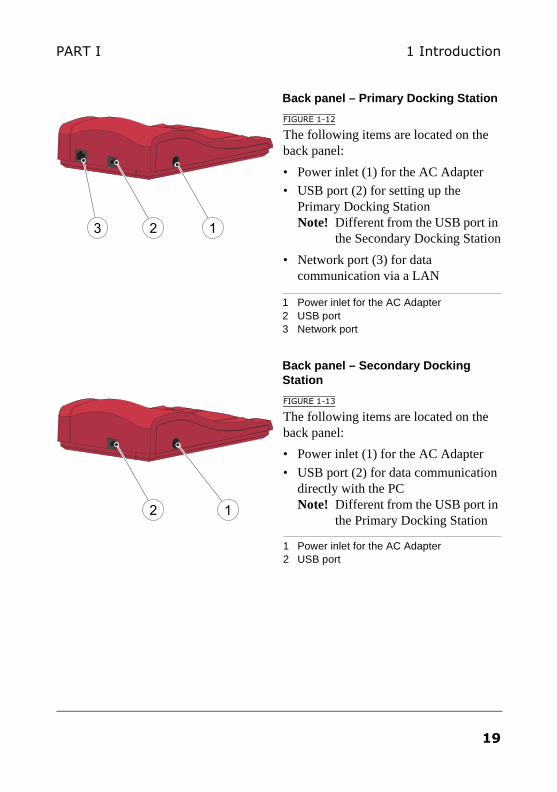
The following items are located on the back panel:
• Power inlet (1) for the AC Adapter
• USB port (2) for setting up the Primary Docking StationNote! Different from the USB port in
the Secondary Docking Station
• Network port (3) for data communication via a LAN
1 Power inlet for the AC Adapter2 USB port3 Network port
Back panel – Secondary Docking Station
FIGURE 1-13
The following items are located on the back panel:
• Power inlet (1) for the AC Adapter
• USB port (2) for data communication directly with the PCNote! Different from the USB port in
the Primary Docking Station
1 Power inlet for the AC Adapter2 USB port
23 1
12
19
1 Introduction PART I
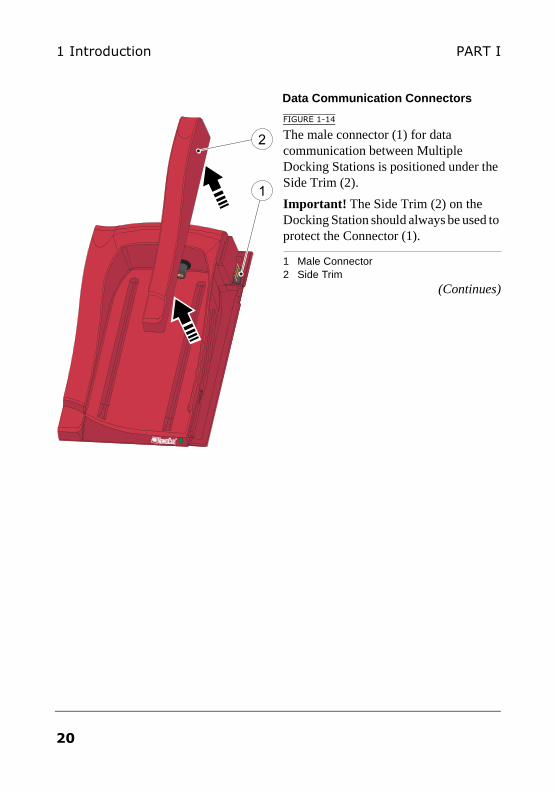
Data Communication Connectors
FIGURE 1-14
The male connector (1) for data communication between Multiple Docking Stations is positioned under the Side Trim (2).
Important! The Side Trim (2) on the Docking Station should always be used to protect the Connector (1).
1 Male Connector2 Side Trim
(Continues)
1
2
20

1 IntroductionPART I
(Continues)SingleFIGURE 1-15
The female connector (3) is positioned under the Bottom Trim (4).
Note! There is no female connector (3) on a Primary Docking Station .
Important! The Bottom Trim (4) on the Docking Station should always be used to protect the Connector (3).
3 Female Connector4 Bottom Trim
4
3
21
1 Introduction PART I
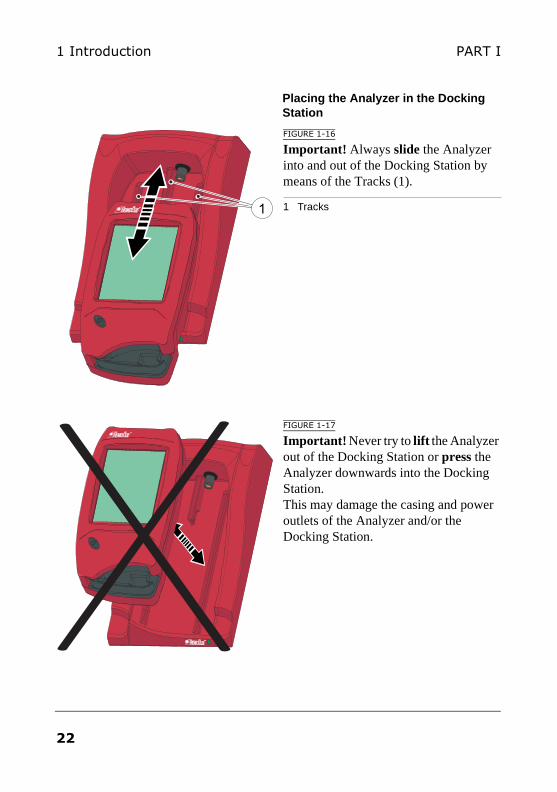
Placing the Analyzer in the Docking Station
FIGURE 1-16
Important! Always slide the Analyzer into and out of the Docking Station by means of the Tracks (1).
1 Tracks
FIGURE 1-17
Important! Never try to lift the Analyzer out of the Docking Station or press the Analyzer downwards into the Docking Station. This may damage the casing and power outlets of the Analyzer and/or the Docking Station.
1
22
1 IntroductionPART I
1.4.5 Functions and features
The HemoCue Hb 201 DM system is a powerful data management system for decentralized testing. It can be customized by the user allowing the activation or deactivation of the following functions:
• Operator ID input, with lockout function if the Operator ID is not recognized
• Patient ID input
• Cuvette batch data input
• Lab number input
• Quality Control with input of lot numbers, range and lockout functions
• Linearity and proficiency testing
• STAT tests
The Analyzer stores:
• Approximately 4000 Patient/STAT test results (including Patient ID, Operator ID, date, time, comments, etc.)
• Approximately 500 QC test results (including QC level, Operator ID, date, time, comments, etc.)
• Approximately 500 Analyzer log entries (Error messages, maintenance etc.)
(Continues)
23
1 Introduction PART I
(Continues)The Analyzer also has the following features:
• Easy-to-use Display
• Built-in Barcode Scanner
• Powered either by a rechargeable lithium-ion Battery, AC Adapter or via the Docking Station. The Battery is recharged when connected to the Docking Station.
• Communication with DMS Software or OR via Docking Station, according to POCT1-A standard (also known as the CIC standard).
24
2 SafetyPART I
2 Safety
2.1 HemoCue Hb 201 DM System
2.1.1 Usage of the System
FIGURE 2-1
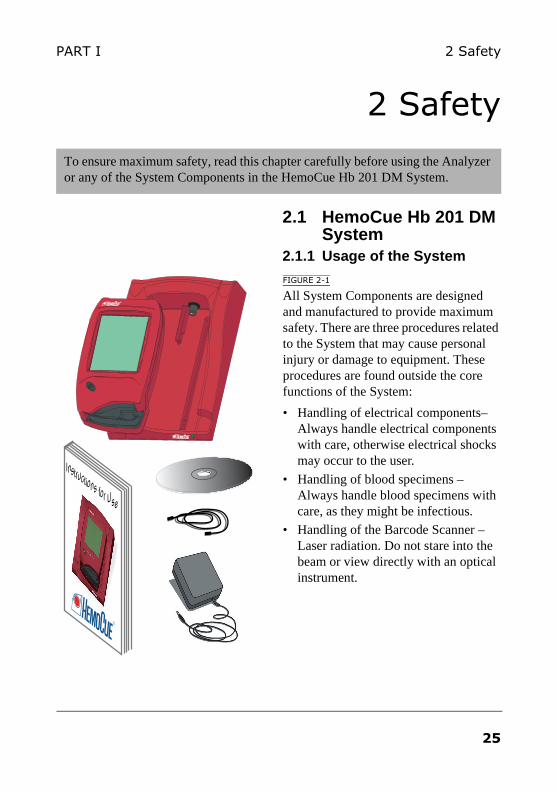
All System Components are designed and manufactured to provide maximum safety. There are three procedures related to the System that may cause personal injury or damage to equipment. These procedures are found outside the core functions of the System:
• Handling of electrical components– Always handle electrical components with care, otherwise electrical shocks may occur to the user.
• Handling of blood specimens – Always handle blood specimens with care, as they might be infectious.
• Handling of the Barcode Scanner – Laser radiation. Do not stare into the beam or view directly with an optical instrument.
To ensure maximum safety, read this chapter carefully before using the Analyzer or any of the System Components in the HemoCue Hb 201 DM System.
Instructions for Use
25
2 Safety PART I
2.2 General2.2.1 Hazard information
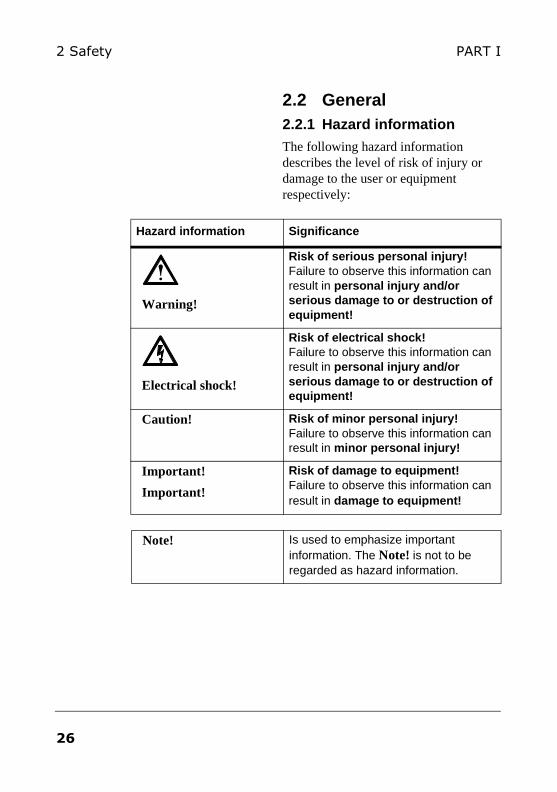
The following hazard information describes the level of risk of injury or damage to the user or equipment respectively:
Hazard information Significance
Warning!
Risk of serious personal injury!Failure to observe this information can result in personal injury and/or serious damage to or destruction of equipment!
Electrical shock!
Risk of electrical shock!Failure to observe this information can result in personal injury and/or serious damage to or destruction of equipment!
Caution! Risk of minor personal injury!Failure to observe this information can result in minor personal injury!
Important!
Important!
Risk of damage to equipment!Failure to observe this information can result in damage to equipment!
Note! Is used to emphasize important information. The Note! is not to be regarded as hazard information.
26
2 SafetyPART I
2.3 Handling of the System
2.3.1 System Components
Carefully follow the instructions in this document and pay special attention to the Hazard information in section 2.2.1 Hazard information.
Battery
Warning! Lithium-ion battery - Danger of explosion - Replace the Battery with the same type recommended by HemoCue.
Consult local environmental authorities for proper disposal.
Cuvette
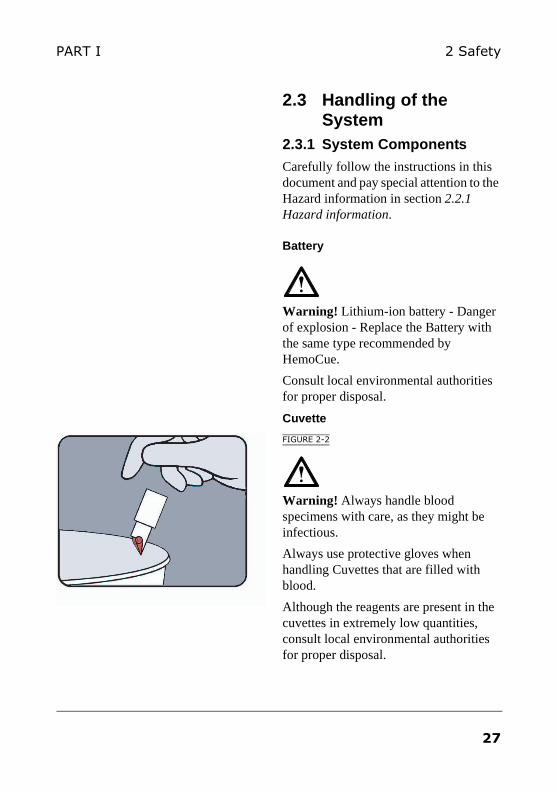
FIGURE 2-2
Warning! Always handle blood specimens with care, as they might be infectious.
Always use protective gloves when handling Cuvettes that are filled with blood.
Although the reagents are present in the cuvettes in extremely low quantities, consult local environmental authorities for proper disposal.
27

2 Safety PART I
This page intentionally left blank
28

3 Installation/General operationsPART I
3 Installation/General operations
3.1 Getting started – Analyzer
3.1.1 Power source
The Analyzer can be powered either by the rechargeable Battery or by a standard electrical outlet via the AC Adapter.
Recharging the Battery
FIGURE 3-1
The rechargeable Battery (1) is located in a battery compartment on the bottom of the Analyzer.
a) Recharge the Battery (1) by connecting the AC Adapter to the Analyzer or by placing the Analyzer in the Docking Station. A brand new Battery will take longer to charge the first 2 to 3 times.
1 Battery(Continues)
This chapter describes the general operations necessary for Analyzer use.
1
29
3 Installation/General operations PART I
(Continues)A fully charged Battery will power the Analyzer for 100 hours when in the stand-by mode or for two days of normal use. Normal use is defined as 60 samples/day using the Barcode Scanner.
The Battery recharges to 70% of its capacity in less than 2 hours and to nearly 100% in less than 10 hours.
30
3 Installation/General operationsPART I
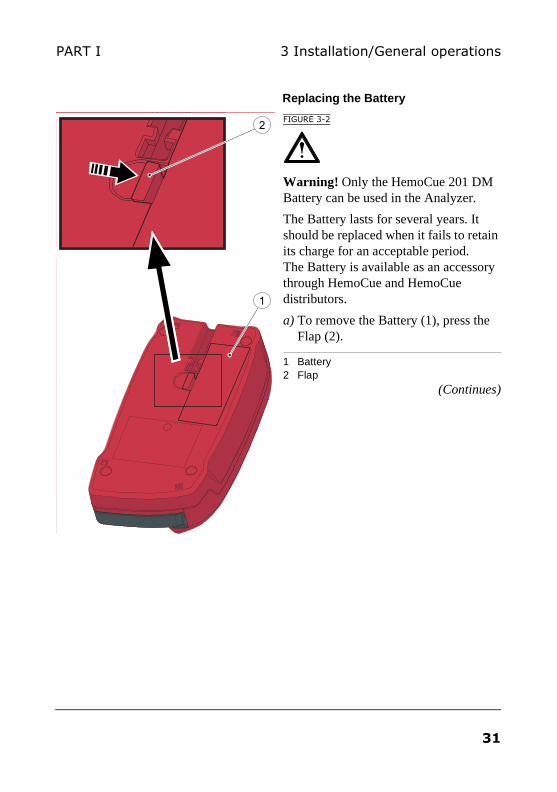
Replacing the Battery
FIGURE 3-2
Warning! Only the HemoCue 201 DM Battery can be used in the Analyzer.
The Battery lasts for several years. It should be replaced when it fails to retain its charge for an acceptable period. The Battery is available as an accessory through HemoCue and HemoCue distributors.
a) To remove the Battery (1), press the Flap (2).
1 Battery2 Flap
(Continues)
2
1
31
3 Installation/General operations PART I
(Continues)
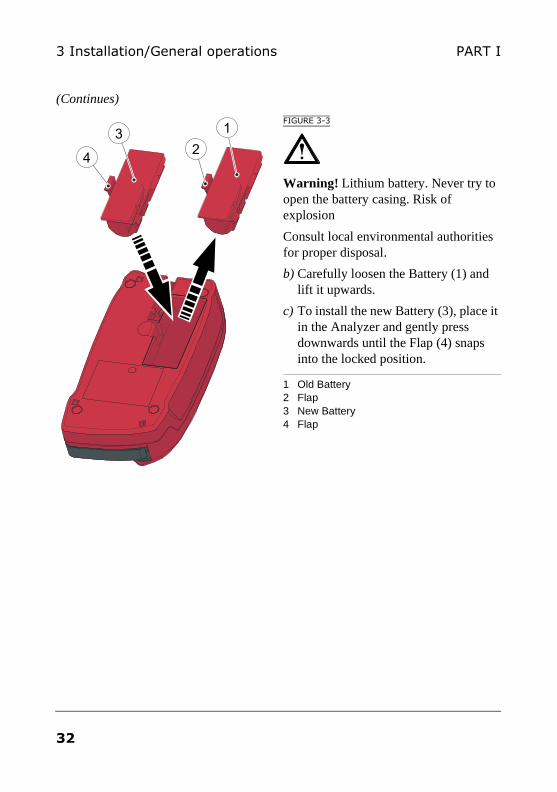
FIGURE 3-3
Warning! Lithium battery. Never try to open the battery casing. Risk of explosion
Consult local environmental authorities for proper disposal.
b) Carefully loosen the Battery (1) and lift it upwards.
c) To install the new Battery (3), place it in the Analyzer and gently press downwards until the Flap (4) snaps into the locked position.
1 Old Battery2 Flap3 New Battery4 Flap
1
23
4
32
3 Installation/General operationsPART I
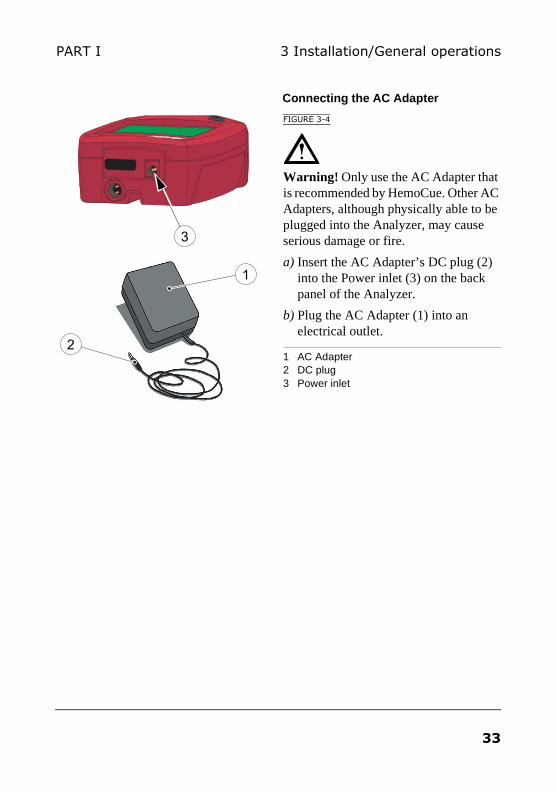
Connecting the AC Adapter
FIGURE 3-4
Warning! Only use the AC Adapter that is recommended by HemoCue. Other AC Adapters, although physically able to be plugged into the Analyzer, may cause serious damage or fire.
a) Insert the AC Adapter’s DC plug (2) into the Power inlet (3) on the back panel of the Analyzer.
b) Plug the AC Adapter (1) into an electrical outlet.
1 AC Adapter2 DC plug3 Power inlet
3
1
2
33
3 Installation/General operations PART I
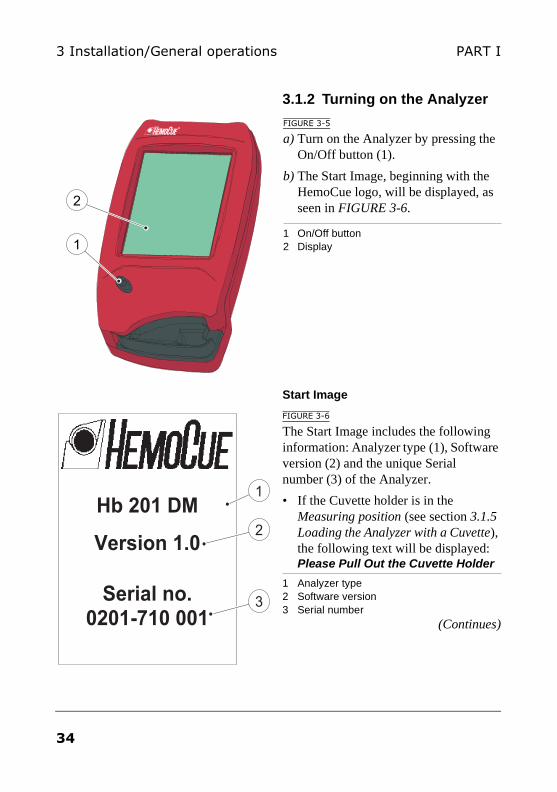
3.1.2 Turning on the Analyzer
FIGURE 3-5
a) Turn on the Analyzer by pressing the On/Off button (1).
b) The Start Image, beginning with the HemoCue logo, will be displayed, as seen in FIGURE 3-6.
1 On/Off button2 Display
Start Image
FIGURE 3-6
The Start Image includes the following information: Analyzer type (1), Software version (2) and the unique Serial number (3) of the Analyzer.
• If the Cuvette holder is in the Measuring position (see section 3.1.5 Loading the Analyzer with a Cuvette), the following text will be displayed: Please Pull Out the Cuvette Holder
1 Analyzer type2 Software version3 Serial number
(Continues)
2
1
Hb 201 DM
Version 1.0
Serial no.
0201-710 001
1
2
3
34
3 Installation/General operationsPART I
(Continues)
• If the Cuvette holder is in the Loading position (see section 3.1.5 Loading the Analyzer with a Cuvette), the following text will be displayed: Please Wait Selftesting ... No inputs can be made for approximately 20 seconds during the selftest.
For information on how to operate the Display, see section 3.5 How to operate the Display.
For instructions on how to perform tests, see section 6 Patient Test procedure, section 7 STAT Test procedure and section 8 QC Test procedure.
For safety information, see section 2 Safety.
35
3 Installation/General operations PART I
3.1.3 Power saver mode
When no procedures have been performed within the time predefined in the Analyzer settings (see section 4.3.2 Power Saver), the Analyzer will switch to power save mode.
If the Analyzer is powered via the AC adapter, the user will be logged off, the image on the display will disappear, but the power will remain on. Touch the Display to reactivate it.
If the Analyzer is powered via the Battery, the user will be logged off and the Analyzer will be switched off. Press the On/Off button to reactivate it.
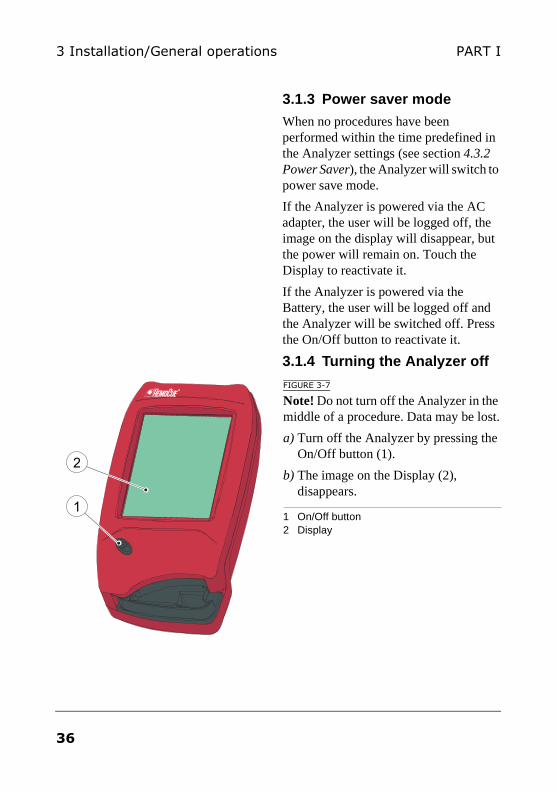
3.1.4 Turning the Analyzer off
FIGURE 3-7
Note! Do not turn off the Analyzer in the middle of a procedure. Data may be lost.
a) Turn off the Analyzer by pressing the On/Off button (1).
b) The image on the Display (2), disappears.
1 On/Off button2 Display
2
1
36
3 Installation/General operationsPART I
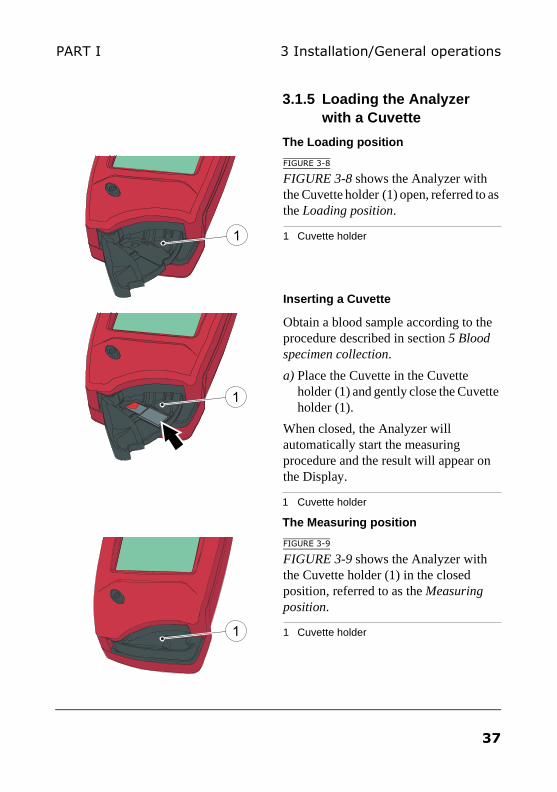
3.1.5 Loading the Analyzer with a Cuvette
The Loading position
FIGURE 3-8
FIGURE 3-8 shows the Analyzer with the Cuvette holder (1) open, referred to as the Loading position.
1 Cuvette holder
Inserting a Cuvette
Obtain a blood sample according to the procedure described in section 5 Blood specimen collection.
a) Place the Cuvette in the Cuvette holder (1) and gently close the Cuvette holder (1).
When closed, the Analyzer will automatically start the measuring procedure and the result will appear on the Display.
1 Cuvette holder
The Measuring position
FIGURE 3-9
FIGURE 3-9 shows the Analyzer with the Cuvette holder (1) in the closed position, referred to as the Measuring position.
1 Cuvette holder
1
1
1
37
3 Installation/General operations PART I
3.2 Getting started – Single Docking Station
3.2.1 Connect to a PC or a LAN
Note! This procedure should be performed by a network administrator.
Important! Always keep electrical equipment turned off during connection procedures.
• A Single Primary Docking Station can be connected to a LAN or to a PC via the USB.
Note! When a Primary Docking Station is connected via a USB connection, only the IP address can be changed. No other information can be sent to/from the Analyzer.
• A Single Secondary Docking Station can be connected directly to a PC via the USB, but not to a LAN.
(Continues)
38
3 Installation/General operationsPART I
(Continues)
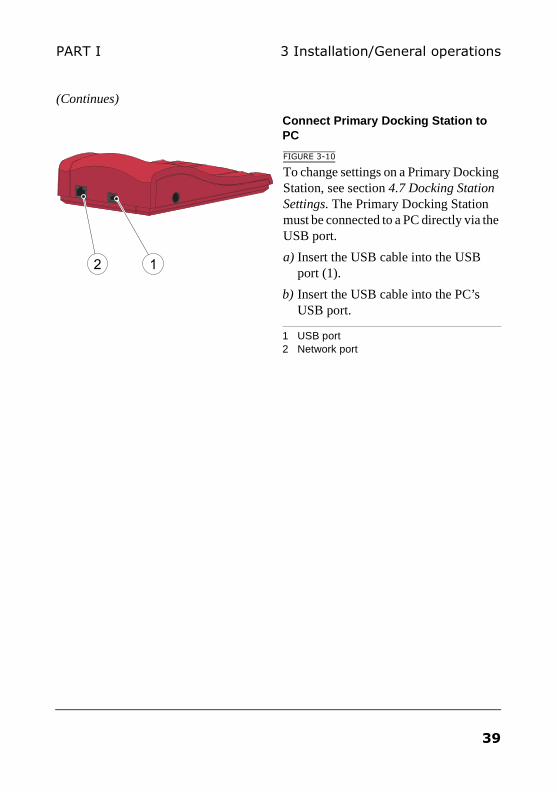
Connect Primary Docking Station to PC
FIGURE 3-10
To change settings on a Primary Docking Station, see section 4.7 Docking Station Settings. The Primary Docking Station must be connected to a PC directly via the USB port.
a) Insert the USB cable into the USB port (1).
b) Insert the USB cable into the PC’s USB port.
1 USB port2 Network port
12
39
3 Installation/General operations PART I
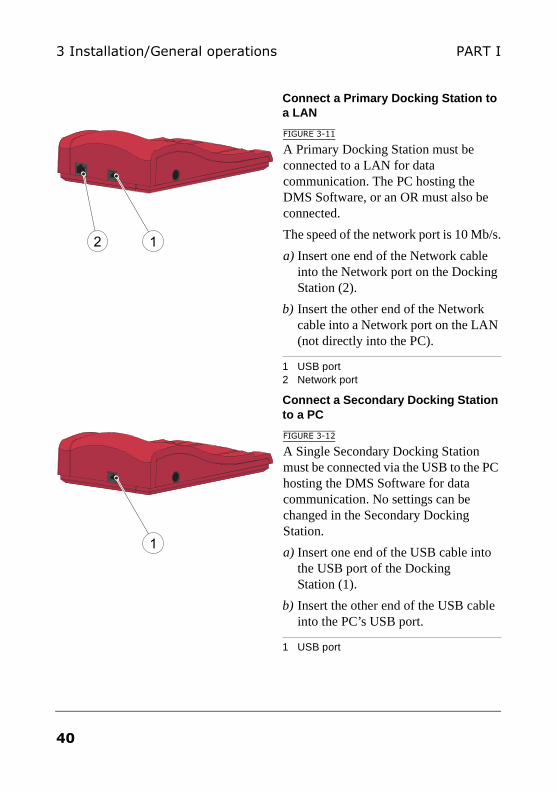
Connect a Primary Docking Station to a LAN
FIGURE 3-11
A Primary Docking Station must be connected to a LAN for data communication. The PC hosting the DMS Software, or an OR must also be connected.
The speed of the network port is 10 Mb/s.
a) Insert one end of the Network cable into the Network port on the Docking Station (2).
b) Insert the other end of the Network cable into a Network port on the LAN (not directly into the PC).
1 USB port2 Network port
Connect a Secondary Docking Station to a PC
FIGURE 3-12
A Single Secondary Docking Station must be connected via the USB to the PC hosting the DMS Software for data communication. No settings can be changed in the Secondary Docking Station.
a) Insert one end of the USB cable into the USB port of the Docking Station (1).
b) Insert the other end of the USB cable into the PC’s USB port.
1 USB port
12
1
40
3 Installation/General operationsPART I
3.2.2 Power source
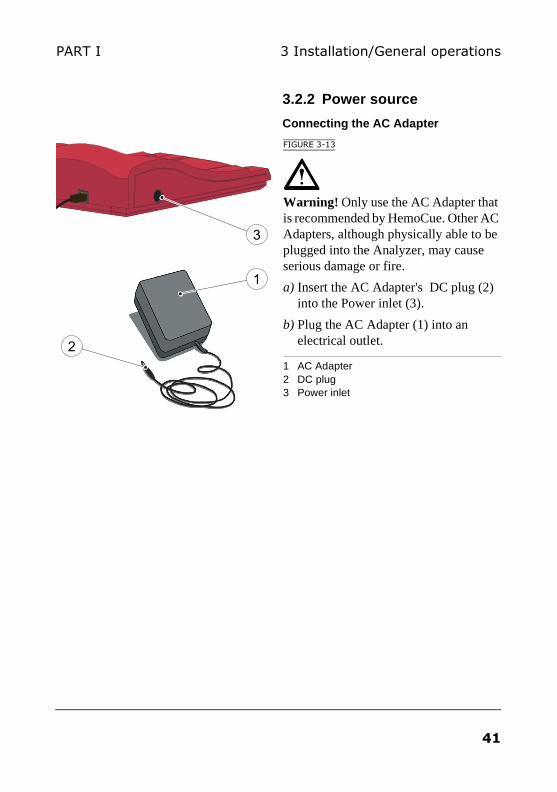
Connecting the AC Adapter
FIGURE 3-13
Warning! Only use the AC Adapter that is recommended by HemoCue. Other AC Adapters, although physically able to be plugged into the Analyzer, may cause serious damage or fire.
a) Insert the AC Adapter's DC plug (2) into the Power inlet (3).
b) Plug the AC Adapter (1) into an electrical outlet.
1 AC Adapter2 DC plug3 Power inlet
3
1
2
41
3 Installation/General operations PART I
3.3 Getting started – Multiple Docking Stations
3.3.1 Connecting Docking Stations
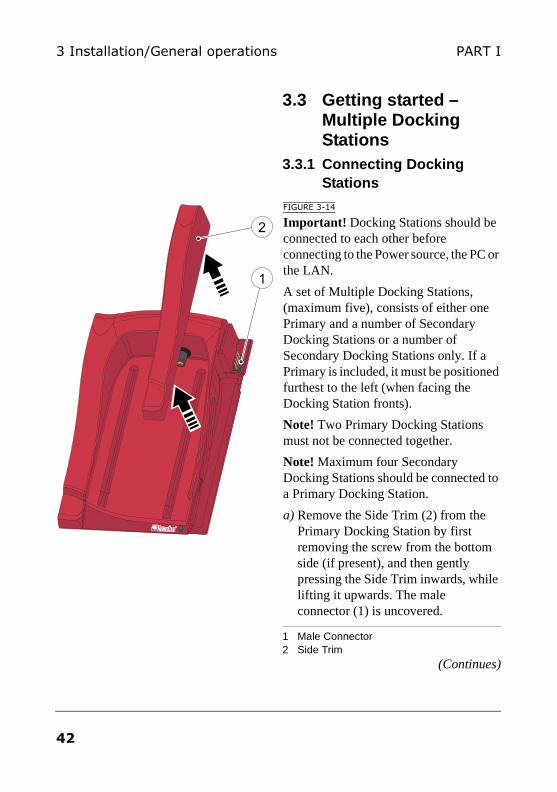
FIGURE 3-14
Important! Docking Stations should be connected to each other before connecting to the Power source, the PC or the LAN.
A set of Multiple Docking Stations, (maximum five), consists of either one Primary and a number of Secondary Docking Stations or a number of Secondary Docking Stations only. If a Primary is included, it must be positioned furthest to the left (when facing the Docking Station fronts).
Note! Two Primary Docking Stations must not be connected together.
Note! Maximum four Secondary Docking Stations should be connected to a Primary Docking Station.
a) Remove the Side Trim (2) from the Primary Docking Station by first removing the screw from the bottom side (if present), and then gently pressing the Side Trim inwards, while lifting it upwards. The male connector (1) is uncovered.
1 Male Connector2 Side Trim
(Continues)
1
2
42
3 Installation/General operationsPART I
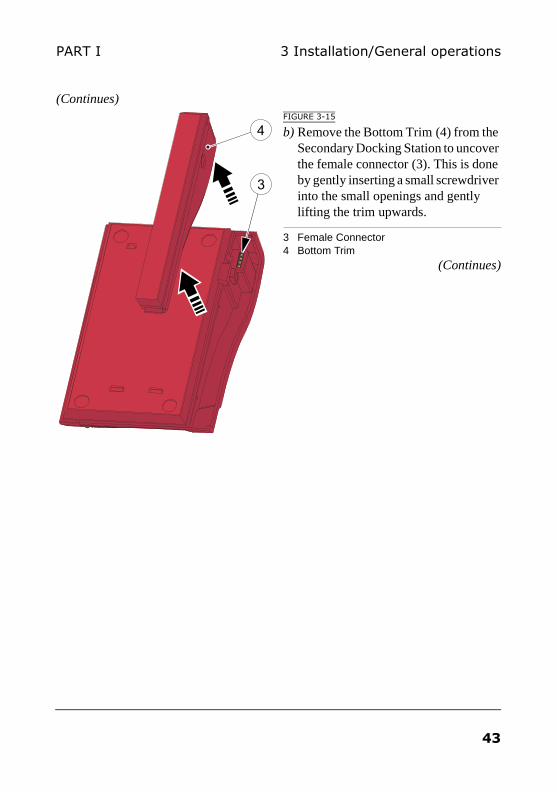
(Continues)FIGURE 3-15
b) Remove the Bottom Trim (4) from the Secondary Docking Station to uncover the female connector (3). This is done by gently inserting a small screwdriver into the small openings and gently lifting the trim upwards.
3 Female Connector4 Bottom Trim
(Continues)
4
3
43
3 Installation/General operations PART I
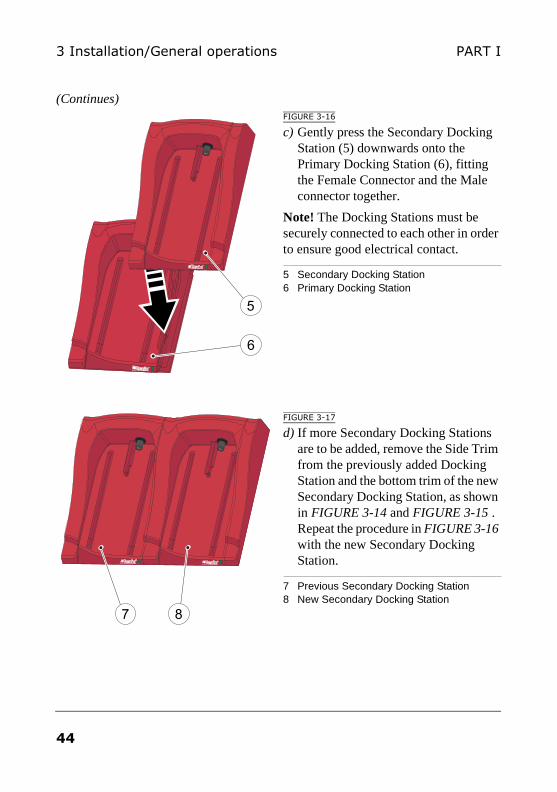
(Continues)FIGURE 3-16
c) Gently press the Secondary Docking Station (5) downwards onto the Primary Docking Station (6), fitting the Female Connector and the Male connector together.
Note! The Docking Stations must be securely connected to each other in order to ensure good electrical contact.
5 Secondary Docking Station6 Primary Docking Station
FIGURE 3-17
d) If more Secondary Docking Stations are to be added, remove the Side Trim from the previously added Docking Station and the bottom trim of the new Secondary Docking Station, as shown in FIGURE 3-14 and FIGURE 3-15 . Repeat the procedure in FIGURE 3-16 with the new Secondary Docking Station.
7 Previous Secondary Docking Station8 New Secondary Docking Station
6
5
7 8
44
3 Installation/General operationsPART I
3.3.2 Connect to a PC or a LAN
Note! This procedure should be performed by a Network administrator.
Important! Always keep electrical equipment turned off during connection procedures.
• A Primary Docking Station in a multiple set can be connected to a PC via the LAN. It can also be connected via the USB, in this case only the IP address of the Primary Docking Station can be changed.
• A Secondary Docking Station in a multiple set containing a Primary can communicate with a LAN via the Primary. It can also be connected directly to a PC, via the USB, in which case, the USB connection takes preference.
• A Secondary Docking Station in a multiple set consisting solely of Secondary Docking Stations, can only be connected to a PC directly via the USB. Only electrical power will be transferred between these Docking Stations.
• A Secondary Docking Station cannot be directly connected to a LAN.
Connect the Primary Docking Station in a multiple set to a PC
See section FIGURE 3-10.
45
3 Installation/General operations PART I
Connect the Primary Docking Station in a multiple set to a LAN
See FIGURE 3-11.
Connect the Secondary Docking Station in a multiple set to a PC
If the set consists solely of Secondary Docking Stations, each Docking Station must be connected via the USB to the PC hosting the DMS Software for data communication, see FIGURE 3-12.
If the set contains a Primary which is connected to a LAN, the USB connection is not necessary.
3.3.3 Power source
The Docking Station (Primary or Secondary) furthest to the left is connected to the Power source as described in section 3.2.2 Power source.
The rest of the Docking Stations in a multiple set are connected to the Power source via this Docking Station and can not be connected separately.
46
3 Installation/General operationsPART I
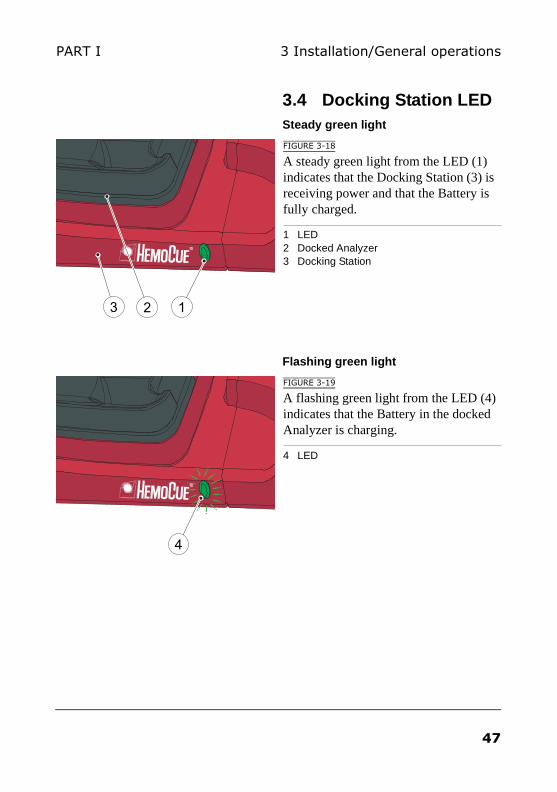
3.4 Docking Station LEDSteady green light
FIGURE 3-18
A steady green light from the LED (1) indicates that the Docking Station (3) is receiving power and that the Battery is fully charged.
1 LED2 Docked Analyzer3 Docking Station
Flashing green light
FIGURE 3-19
A flashing green light from the LED (4) indicates that the Battery in the docked Analyzer is charging.
4 LED
2 13
iiii
i i
i i i i i iiii
4
47
3 Installation/General operations PART I
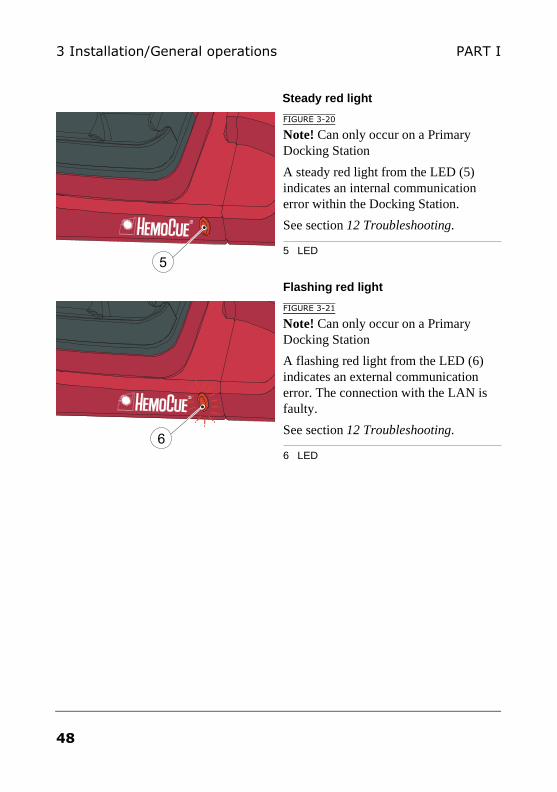
Steady red light
FIGURE 3-20
Note! Can only occur on a Primary Docking Station
A steady red light from the LED (5) indicates an internal communication error within the Docking Station.
See section 12 Troubleshooting.
5 LED
Flashing red light
FIGURE 3-21
Note! Can only occur on a Primary Docking Station
A flashing red light from the LED (6) indicates an external communication error. The connection with the LAN is faulty.
See section 12 Troubleshooting.
6 LED
5
iiii
i i
i i i i i iiii
6
48
3 Installation/General operationsPART I
3.5 How to operate the Display
3.5.1 Display buttons
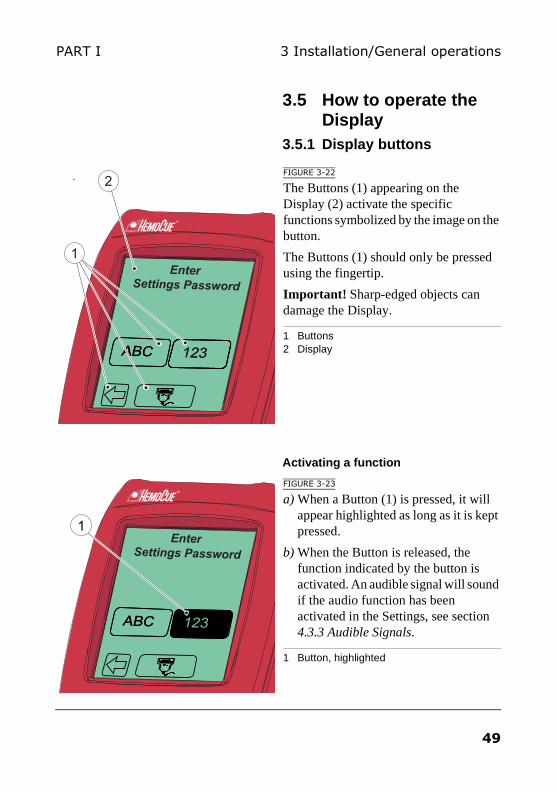
FIGURE 3-22
The Buttons (1) appearing on the Display (2) activate the specific functions symbolized by the image on the button.
The Buttons (1) should only be pressed using the fingertip.
Important! Sharp-edged objects can damage the Display.
1 Buttons2 Display
Activating a function
FIGURE 3-23
a) When a Button (1) is pressed, it will appear highlighted as long as it is kept pressed.
b) When the Button is released, the function indicated by the button is activated. An audible signal will sound if the audio function has been activated in the Settings, see section 4.3.3 Audible Signals.
1 Button, highlighted
EnterSettings Password
EnterSettings Password
1
49
3 Installation/General operations PART I
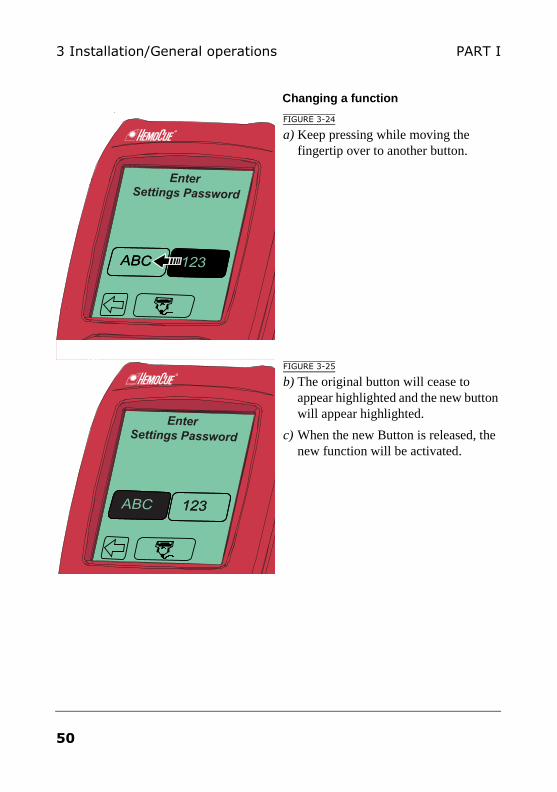
Changing a function
FIGURE 3-24
a) Keep pressing while moving the fingertip over to another button.
FIGURE 3-25
b) The original button will cease to appear highlighted and the new button will appear highlighted.
c) When the new Button is released, the new function will be activated.
EnterSettings Password EnterSettings Password
EnterSettings Password
50
3 Installation/General operationsPART I
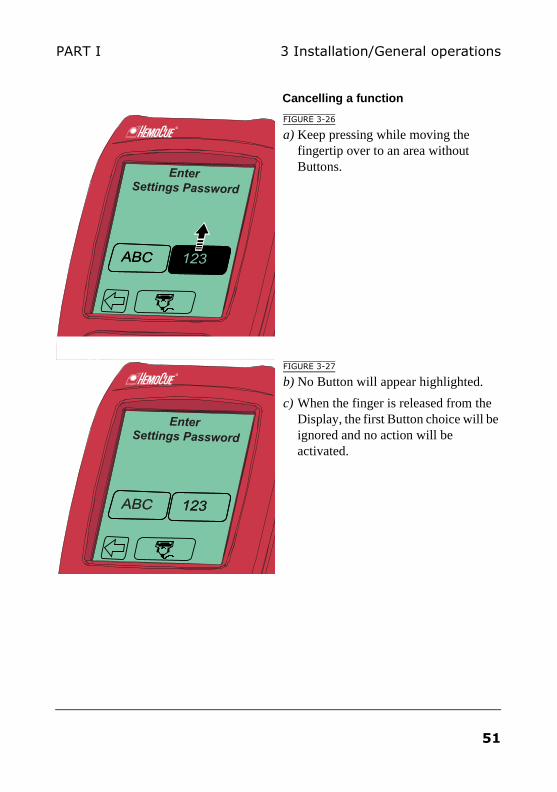
Cancelling a function
FIGURE 3-26
a) Keep pressing while moving the fingertip over to an area without Buttons.
FIGURE 3-27
b) No Button will appear highlighted.
c) When the finger is released from the Display, the first Button choice will be ignored and no action will be activated.
EnterSettings Password
EnterSettings Password
51
3 Installation/General operations PART I
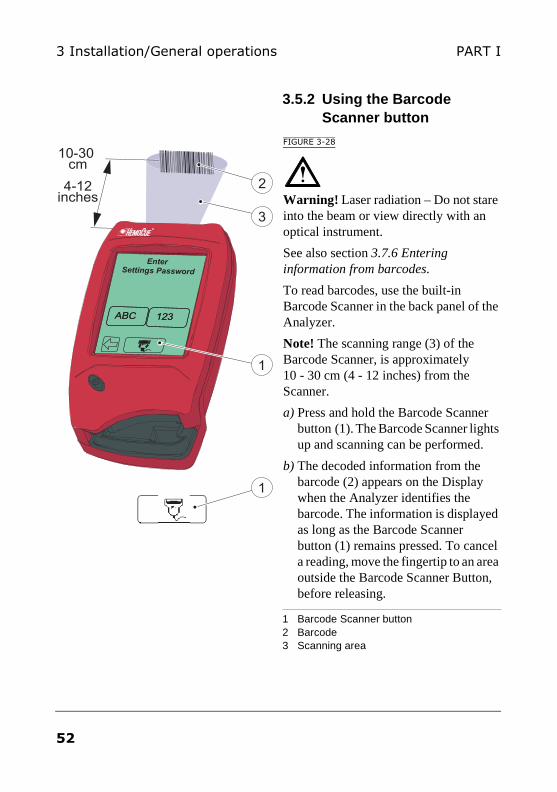
3.5.2 Using the Barcode Scanner button
FIGURE 3-28
Warning! Laser radiation – Do not stare into the beam or view directly with an optical instrument.
See also section 3.7.6 Entering information from barcodes.
To read barcodes, use the built-in Barcode Scanner in the back panel of the Analyzer.
Note! The scanning range (3) of the Barcode Scanner, is approximately 10 - 30 cm (4 - 12 inches) from the Scanner.
a) Press and hold the Barcode Scanner button (1). The Barcode Scanner lights up and scanning can be performed.
b) The decoded information from the barcode (2) appears on the Display when the Analyzer identifies the barcode. The information is displayed as long as the Barcode Scanner button (1) remains pressed. To cancel a reading, move the fingertip to an area outside the Barcode Scanner Button, before releasing.
1 Barcode Scanner button2 Barcode3 Scanning area
10-30 cm�
4-12inches
EnterSettings Password
52
3 Installation/General operationsPART I
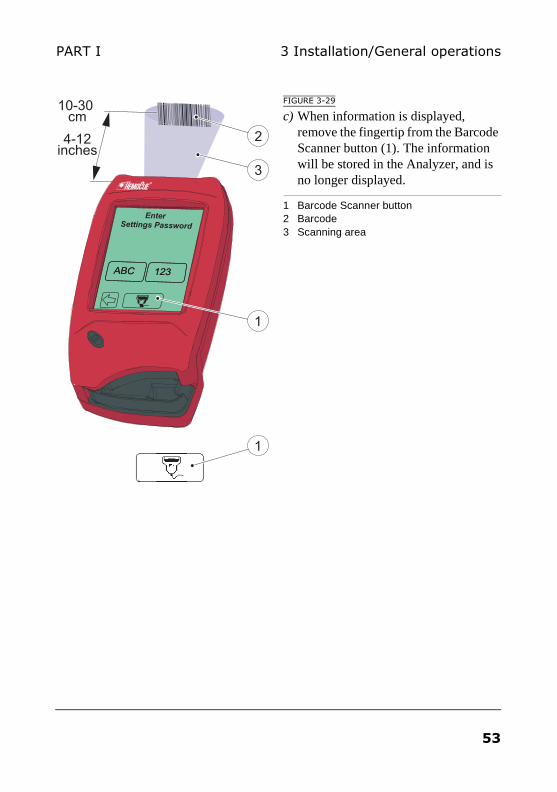
FIGURE 3-29
c) When information is displayed, remove the fingertip from the Barcode Scanner button (1). The information will be stored in the Analyzer, and is no longer displayed.
1 Barcode Scanner button2 Barcode3 Scanning area
10-30 cm�
4-12inches
EnterSettings Password
53

3 Installation/General operations PART I
3.6 Operating the Analyzer
3.6.1 Start up
a) Turn the Analyzer on (see 3.1 Getting started – Analyzer). The Start Image, beginning with the HemoCue logo, will be displayed.
b) If the Cuvette holder is in the measuring position, the following text will be displayed: Please Pull Out the Cuvette Holder. Pull the Cuvette holder out to the loading position.
Note! When the Cuvette holder is in the loading position the following text: Please Wait Selftesting ... is displayed for approximately 20 seconds while the Analyzer is selftesting. No functions can be activated during the selftest.
c) If the requirement for Operator ID is set to “Not Used” (see section 4 Settings), the Main Menu will be displayed, FIGURE 3-31, without the Operator Name. If Operator ID is required, the Login Image will be displayed, FIGURE 3-30.
54
3 Installation/General operationsPART I
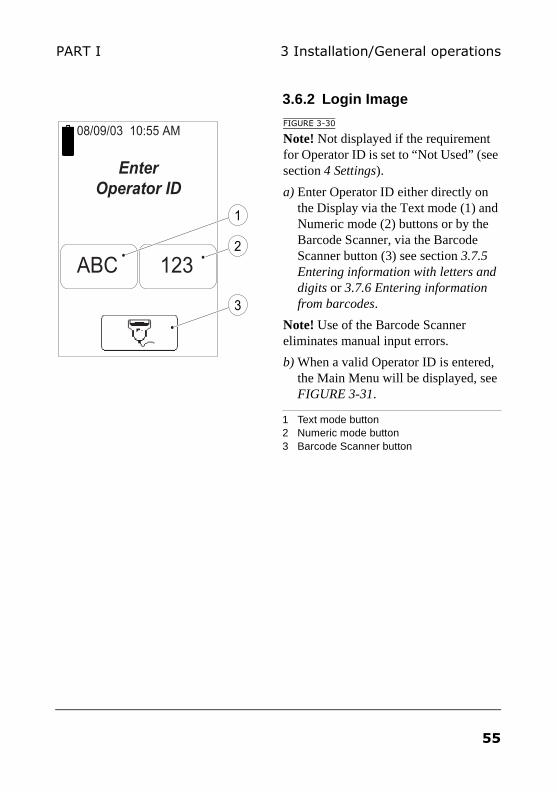
3.6.2 Login Image
FIGURE 3-30
Note! Not displayed if the requirement for Operator ID is set to “Not Used” (see section 4 Settings).
a) Enter Operator ID either directly on the Display via the Text mode (1) and Numeric mode (2) buttons or by the Barcode Scanner, via the Barcode Scanner button (3) see section 3.7.5 Entering information with letters and digits or 3.7.6 Entering information from barcodes.
Note! Use of the Barcode Scanner eliminates manual input errors.
b) When a valid Operator ID is entered, the Main Menu will be displayed, see FIGURE 3-31.
1 Text mode button2 Numeric mode button3 Barcode Scanner button
EnterOperator ID
08/09/03 10:55 AM
123ABC
3
2
1
55
3 Installation/General operations PART I
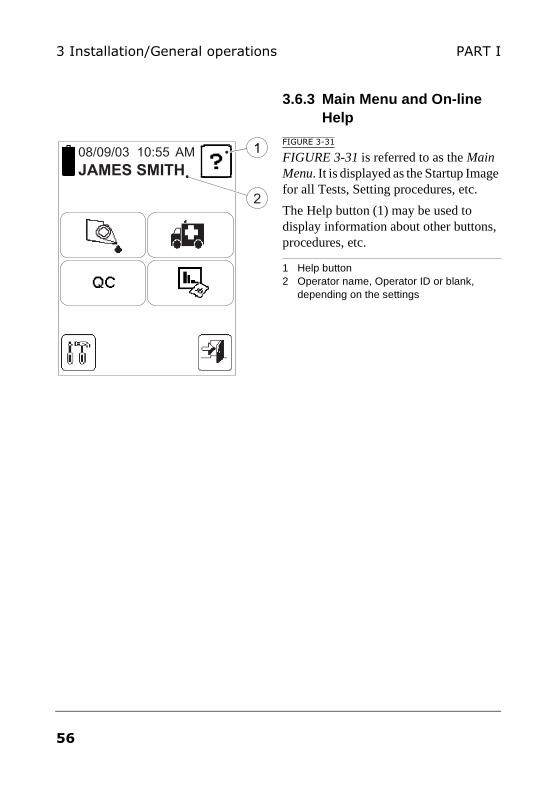
3.6.3 Main Menu and On-line Help
FIGURE 3-31
FIGURE 3-31 is referred to as the Main Menu. It is displayed as the Startup Image for all Tests, Setting procedures, etc.
The Help button (1) may be used to display information about other buttons, procedures, etc.
1 Help button2 Operator name, Operator ID or blank,
depending on the settings
08/09/03 10:55 AM
JAMES SMITH1
56
3 Installation/General operationsPART I
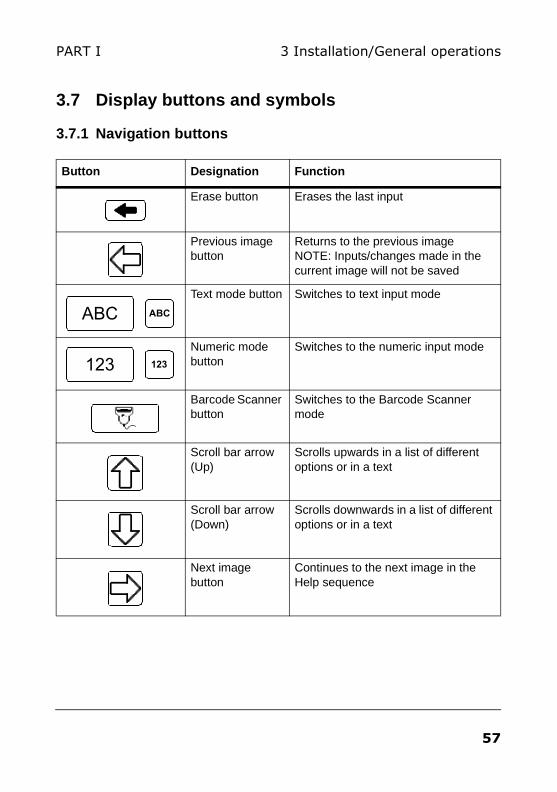
3.7 Display buttons and symbols
3.7.1 Navigation buttons
Button Designation Function
Erase button Erases the last input
Previous image button
Returns to the previous imageNOTE: Inputs/changes made in the current image will not be saved
Text mode button Switches to text input mode
Numeric mode button
Switches to the numeric input mode
Barcode Scanner button
Switches to the Barcode Scanner mode
Scroll bar arrow(Up)
Scrolls upwards in a list of different options or in a text
Scroll bar arrow(Down)
Scrolls downwards in a list of different options or in a text
Next image button
Continues to the next image in the Help sequence
ABCABC
123 123
57
3 Installation/General operations PART I
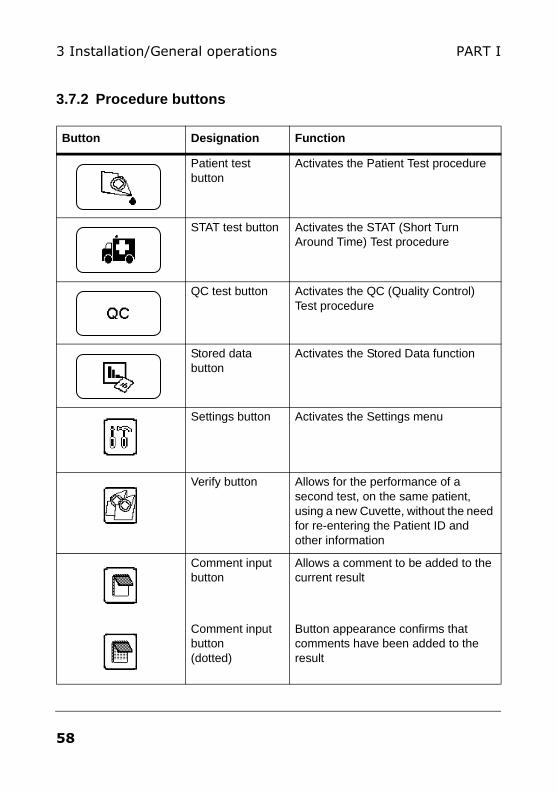
3.7.2 Procedure buttons
Button Designation Function
Patient test button
Activates the Patient Test procedure
STAT test button Activates the STAT (Short Turn Around Time) Test procedure
QC test button Activates the QC (Quality Control) Test procedure
Stored data button
Activates the Stored Data function
Settings button Activates the Settings menu
Verify button Allows for the performance of a second test, on the same patient, using a new Cuvette, without the need for re-entering the Patient ID and other information
Comment input button
Allows a comment to be added to the current result
Comment input button(dotted)
Button appearance confirms that comments have been added to the result
58
3 Installation/General operationsPART I
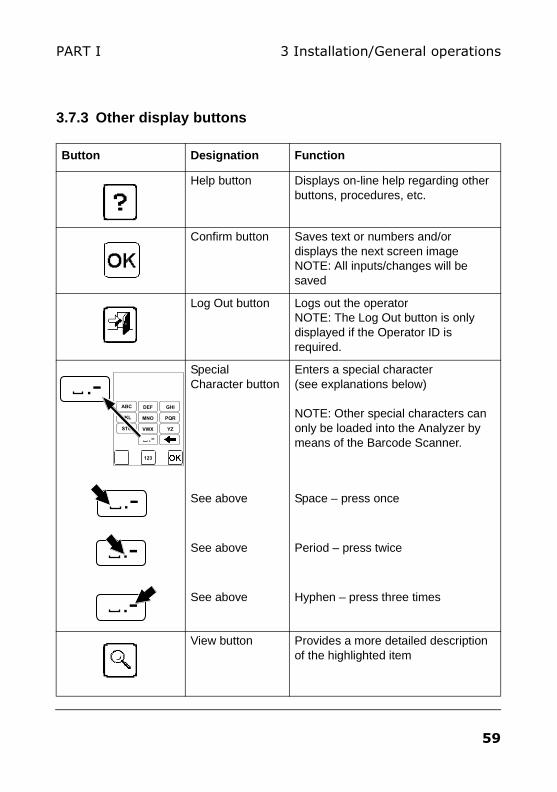
3.7.3 Other display buttons
Button Designation Function
Help button Displays on-line help regarding other buttons, procedures, etc.
Confirm button Saves text or numbers and/or displays the next screen imageNOTE: All inputs/changes will be saved
Log Out button Logs out the operatorNOTE: The Log Out button is only displayed if the Operator ID is required.
Special Character button
Enters a special character (see explanations below)
NOTE: Other special characters can only be loaded into the Analyzer by means of the Barcode Scanner.
See above Space – press once
See above Period – press twice
See above Hyphen – press three times
View button Provides a more detailed description of the highlighted item
[
STU YZVWX
JKL PQRMNO
ABC GHIDEF
.-
123123
59
3 Installation/General operations PART I
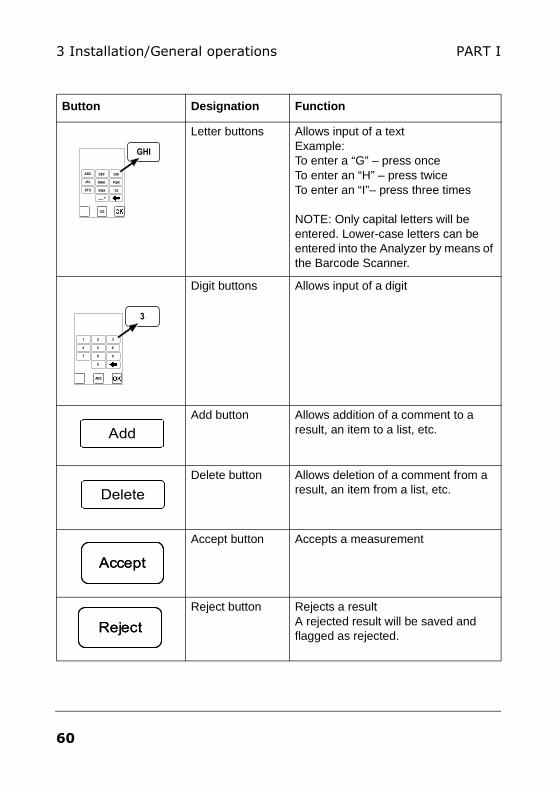
Letter buttons Allows input of a textExample:To enter a “G” – press onceTo enter an “H” – press twiceTo enter an “I”– press three times
NOTE: Only capital letters will be entered. Lower-case letters can be entered into the Analyzer by means of the Barcode Scanner.
Digit buttons Allows input of a digit
Add button Allows addition of a comment to a result, an item to a list, etc.
Delete button Allows deletion of a comment from a result, an item from a list, etc.
Accept button Accepts a measurement
Reject button Rejects a resultA rejected result will be saved and flagged as rejected.
Button Designation Function[
STU YZVWX
JKL PQRMNO
ABC GHIDEF
.-
123
GHI
123
3
0
7 98
4 65
1 32
ABC123
Add
Delete
AcceptAccept
RejectReject
60
3 Installation/General operationsPART I
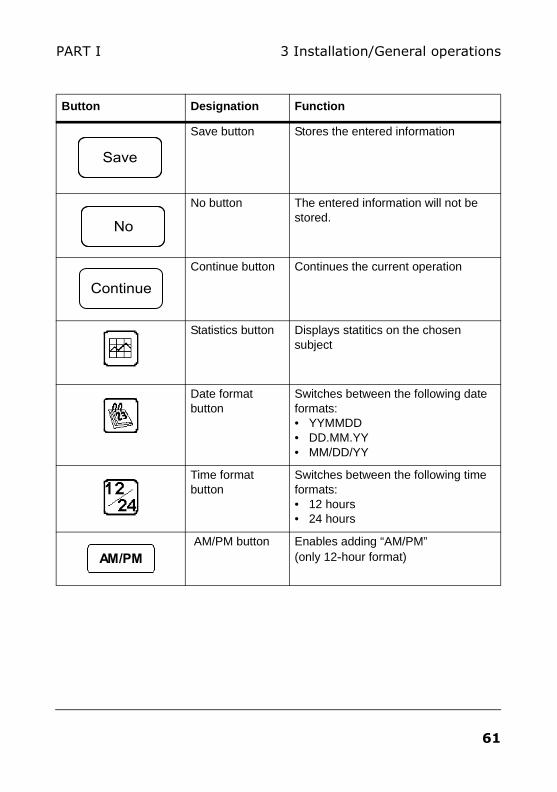
Save button Stores the entered information
No button The entered information will not be stored.
Continue button Continues the current operation
Statistics button Displays statitics on the chosen subject
Date format button
Switches between the following date formats:• YYMMDD• DD.MM.YY• MM/DD/YY
Time format button
Switches between the following time formats:• 12 hours• 24 hours
AM/PM button Enables adding “AM/PM” (only 12-hour format)
Button Designation Function
Save
No
Continue
AM/PM
61
3 Installation/General operations PART I
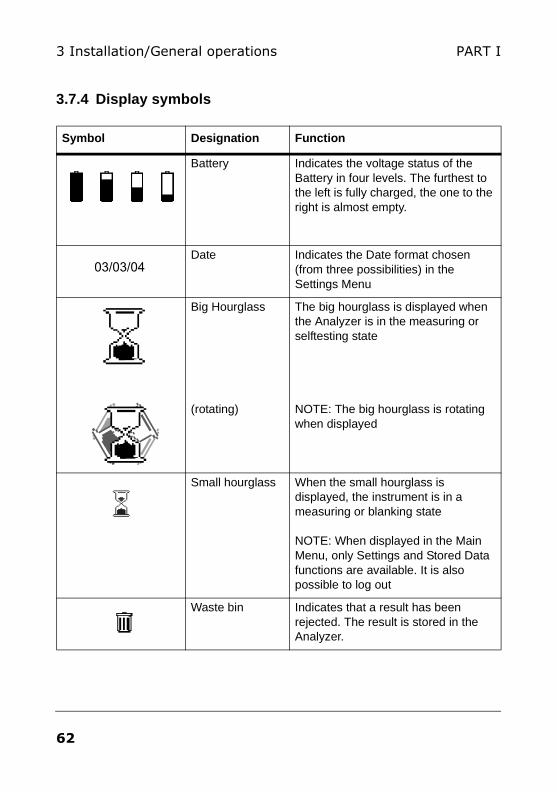
3.7.4 Display symbols
Symbol Designation Function
Battery Indicates the voltage status of the Battery in four levels. The furthest to the left is fully charged, the one to the right is almost empty.
Date Indicates the Date format chosen (from three possibilities) in the Settings Menu
Big Hourglass
(rotating)
The big hourglass is displayed when the Analyzer is in the measuring or selftesting state
NOTE: The big hourglass is rotating when displayed
Small hourglass When the small hourglass is displayed, the instrument is in a measuring or blanking state
NOTE: When displayed in the Main Menu, only Settings and Stored Data functions are available. It is also possible to log out
Waste bin Indicates that a result has been rejected. The result is stored in the Analyzer.
03/03/04
62
3 Installation/General operationsPART I
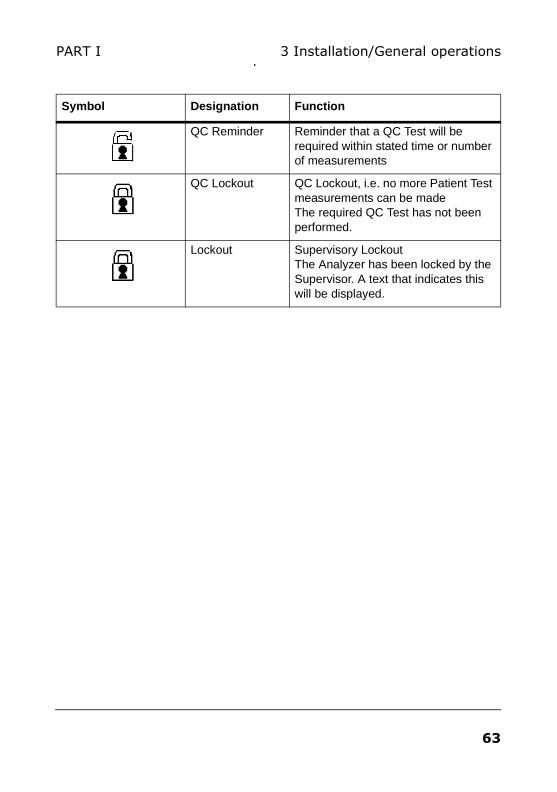
QC Reminder Reminder that a QC Test will be required within stated time or number of measurements
QC Lockout QC Lockout, i.e. no more Patient Test measurements can be madeThe required QC Test has not been performed.
Lockout Supervisory LockoutThe Analyzer has been locked by the Supervisor. A text that indicates this will be displayed.
Symbol Designation Function
63
3 Installation/General operations PART I
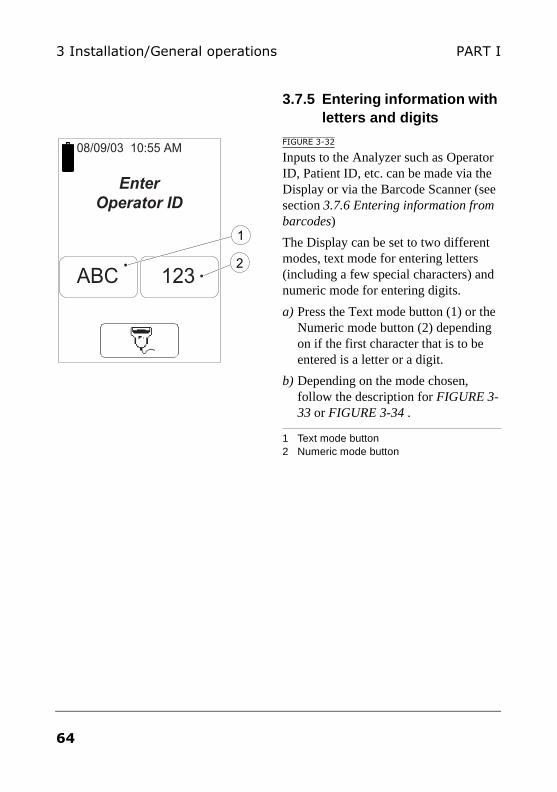
3.7.5 Entering information with letters and digits
FIGURE 3-32
Inputs to the Analyzer such as Operator ID, Patient ID, etc. can be made via the Display or via the Barcode Scanner (see section 3.7.6 Entering information from barcodes)
The Display can be set to two different modes, text mode for entering letters (including a few special characters) and numeric mode for entering digits.
a) Press the Text mode button (1) or the Numeric mode button (2) depending on if the first character that is to be entered is a letter or a digit.
b) Depending on the mode chosen, follow the description for FIGURE 3-33 or FIGURE 3-34 .
1 Text mode button2 Numeric mode button
EnterOperator ID
08/09/03 10:55 AM
123ABC
1
2
64
3 Installation/General operationsPART I
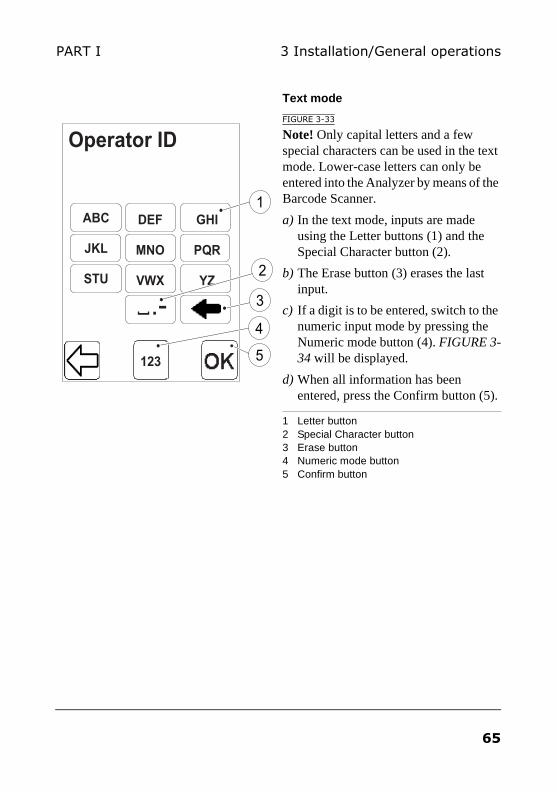
Text mode
FIGURE 3-33
Note! Only capital letters and a few special characters can be used in the text mode. Lower-case letters can only be entered into the Analyzer by means of the Barcode Scanner.
a) In the text mode, inputs are made using the Letter buttons (1) and the Special Character button (2).
b) The Erase button (3) erases the last input.
c) If a digit is to be entered, switch to the numeric input mode by pressing the Numeric mode button (4). FIGURE 3-34 will be displayed.
d) When all information has been entered, press the Confirm button (5).
1 Letter button2 Special Character button3 Erase button4 Numeric mode button5 Confirm button
Operator ID[
STU YZVWX
JKL PQRMNO
ABC GHIDEF
.-2
1
123 5
3
4
65
3 Installation/General operations PART I
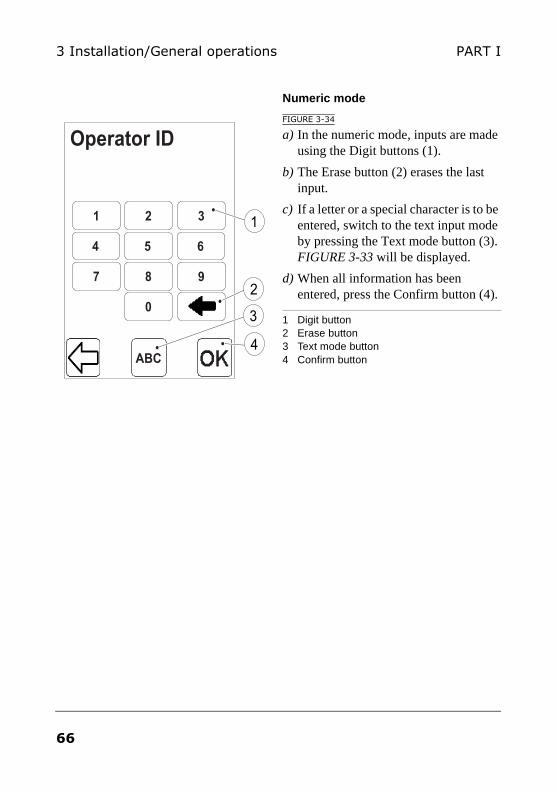
Numeric mode
FIGURE 3-34
a) In the numeric mode, inputs are made using the Digit buttons (1).
b) The Erase button (2) erases the last input.
c) If a letter or a special character is to be entered, switch to the text input mode by pressing the Text mode button (3). FIGURE 3-33 will be displayed.
d) When all information has been entered, press the Confirm button (4).
1 Digit button2 Erase button3 Text mode button4 Confirm button
0
7 98
4 65
1 32
Operator ID
1
ABC
2
4
3
66
3 Installation/General operationsPART I
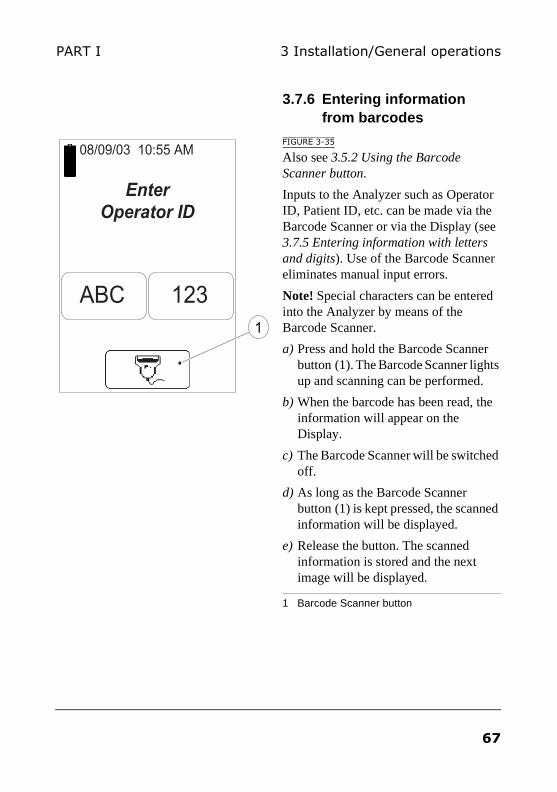
3.7.6 Entering information from barcodes
FIGURE 3-35
Also see 3.5.2 Using the Barcode Scanner button.
Inputs to the Analyzer such as Operator ID, Patient ID, etc. can be made via the Barcode Scanner or via the Display (see 3.7.5 Entering information with letters and digits). Use of the Barcode Scanner eliminates manual input errors.
Note! Special characters can be entered into the Analyzer by means of the Barcode Scanner.
a) Press and hold the Barcode Scanner button (1). The Barcode Scanner lights up and scanning can be performed.
b) When the barcode has been read, the information will appear on the Display.
c) The Barcode Scanner will be switched off.
d) As long as the Barcode Scanner button (1) is kept pressed, the scanned information will be displayed.
e) Release the button. The scanned information is stored and the next image will be displayed.
1 Barcode Scanner button
EnterOperator ID
08/09/03 10:55 AM
123ABC1
67

3 Installation/General operations PART I
This page intentionally left blank
68
PART II Settings
Hb 201 DM
Enter Settings Password

PART II
This page intentionally left blank
70
4 SettingsPART II
4 Settings
4.1 Activating the Settings procedure
FIGURE 4-1
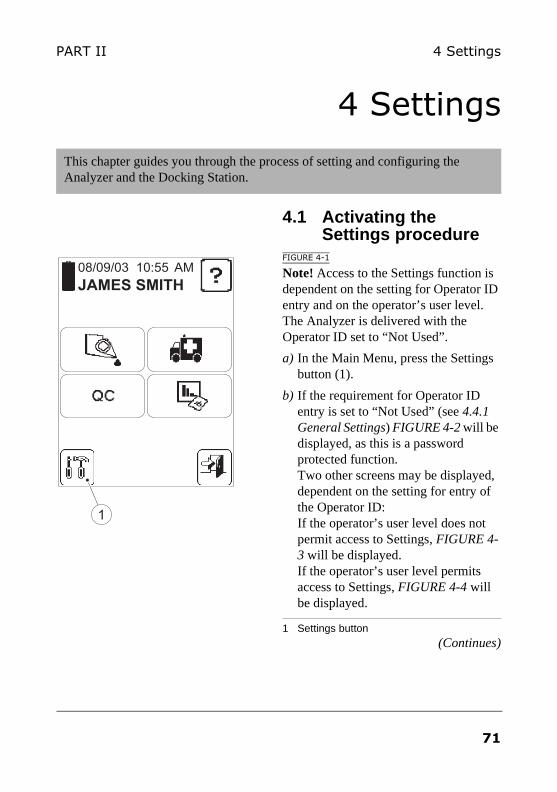
Note! Access to the Settings function is dependent on the setting for Operator ID entry and on the operator’s user level. The Analyzer is delivered with the Operator ID set to “Not Used”.
a) In the Main Menu, press the Settings button (1).
b) If the requirement for Operator ID entry is set to “Not Used” (see 4.4.1 General Settings) FIGURE 4-2 will be displayed, as this is a password protected function. Two other screens may be displayed, dependent on the setting for entry of the Operator ID: If the operator’s user level does not permit access to Settings, FIGURE 4-3 will be displayed. If the operator’s user level permits access to Settings, FIGURE 4-4 will be displayed.
1 Settings button(Continues)
This chapter guides you through the process of setting and configuring the Analyzer and the Docking Station.
08/09/03 10:55 AM
JAMES SMITH
1
71
4 Settings PART II
(Continues)
FIGURE 4-2
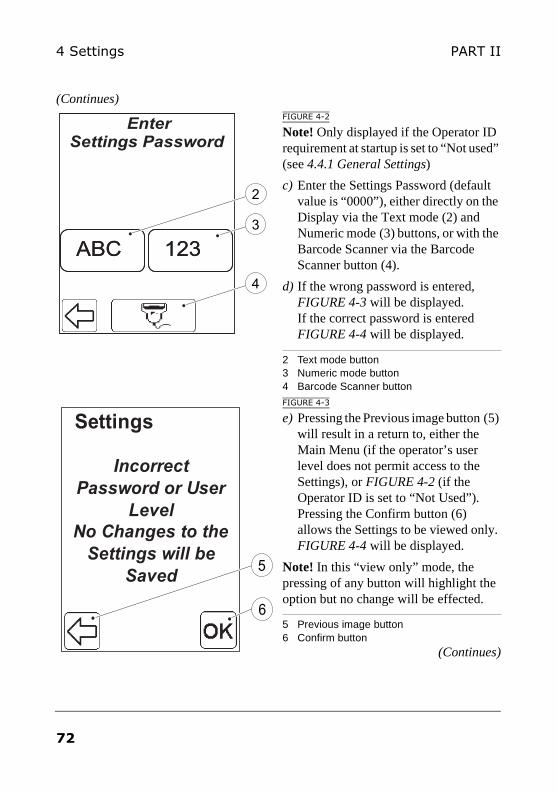
Note! Only displayed if the Operator ID requirement at startup is set to “Not used” (see 4.4.1 General Settings)
c) Enter the Settings Password (default value is “0000”), either directly on the Display via the Text mode (2) and Numeric mode (3) buttons, or with the Barcode Scanner via the Barcode Scanner button (4).
d) If the wrong password is entered, FIGURE 4-3 will be displayed. If the correct password is entered FIGURE 4-4 will be displayed.
2 Text mode button3 Numeric mode button4 Barcode Scanner button
FIGURE 4-3
e) Pressing the Previous image button (5) will result in a return to, either the Main Menu (if the operator’s user level does not permit access to the Settings), or FIGURE 4-2 (if the Operator ID is set to “Not Used”). Pressing the Confirm button (6) allows the Settings to be viewed only. FIGURE 4-4 will be displayed.
Note! In this “view only” mode, the pressing of any button will highlight the option but no change will be effected.
5 Previous image button6 Confirm button
(Continues)
Enter Settings Password
123123ABCABC
4
3
2
Settings
Incorrect Password or User
LevelNo Changes to the
Settings will be Saved
6
5
72
4 SettingsPART II
(Continues)FIGURE 4-4
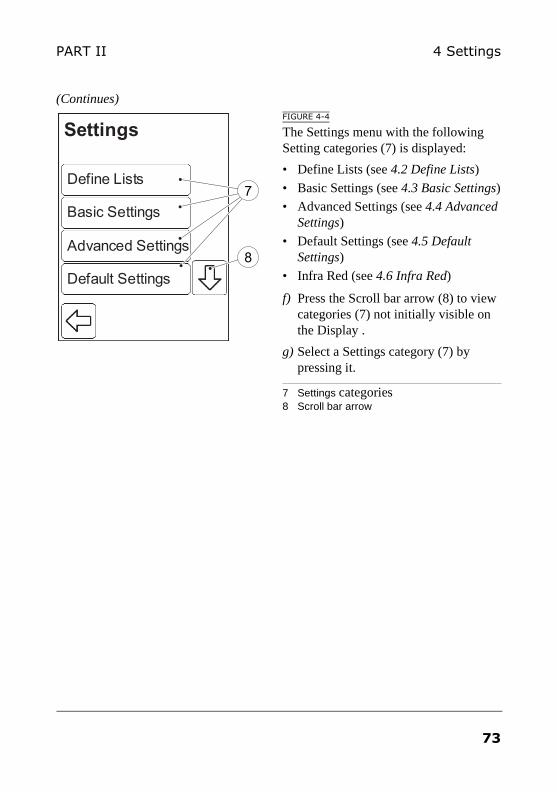
The Settings menu with the following Setting categories (7) is displayed:
• Define Lists (see 4.2 Define Lists)
• Basic Settings (see 4.3 Basic Settings)
• Advanced Settings (see 4.4 Advanced Settings)
• Default Settings (see 4.5 Default Settings)
• Infra Red (see 4.6 Infra Red)
f) Press the Scroll bar arrow (8) to view categories (7) not initially visible on the Display .
g) Select a Settings category (7) by pressing it.
7 Settings categories8 Scroll bar arrow
Settings
Define ListsDefine Lists
Advanced SettingsAdvanced Settings
Default SettingsDefault Settings
Basic SettingsBasic Settings
8
7
73
4 Settings PART II
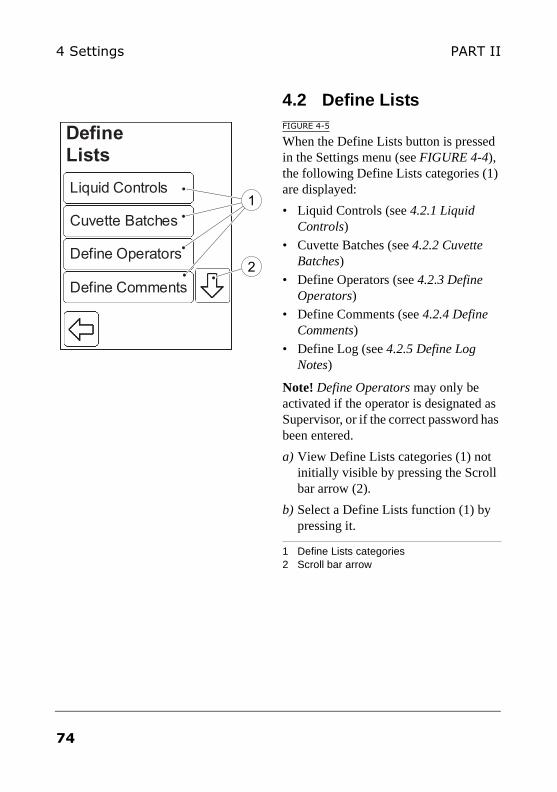
4.2 Define ListsFIGURE 4-5
When the Define Lists button is pressed in the Settings menu (see FIGURE 4-4), the following Define Lists categories (1) are displayed:
• Liquid Controls (see 4.2.1 Liquid Controls)
• Cuvette Batches (see 4.2.2 Cuvette Batches)
• Define Operators (see 4.2.3 Define Operators)
• Define Comments (see 4.2.4 Define Comments)
• Define Log (see 4.2.5 Define Log Notes)
Note! Define Operators may only be activated if the operator is designated as Supervisor, or if the correct password has been entered.
a) View Define Lists categories (1) not initially visible by pressing the Scroll bar arrow (2).
b) Select a Define Lists function (1) by pressing it.
1 Define Lists categories2 Scroll bar arrow
Liquid ControlsLiquid Controls
Cuvette BatchesCuvette Batches
Define OperatorsDefine Operators
Define Lists
Define CommentsDefine Comments2
1
74
4 SettingsPART II
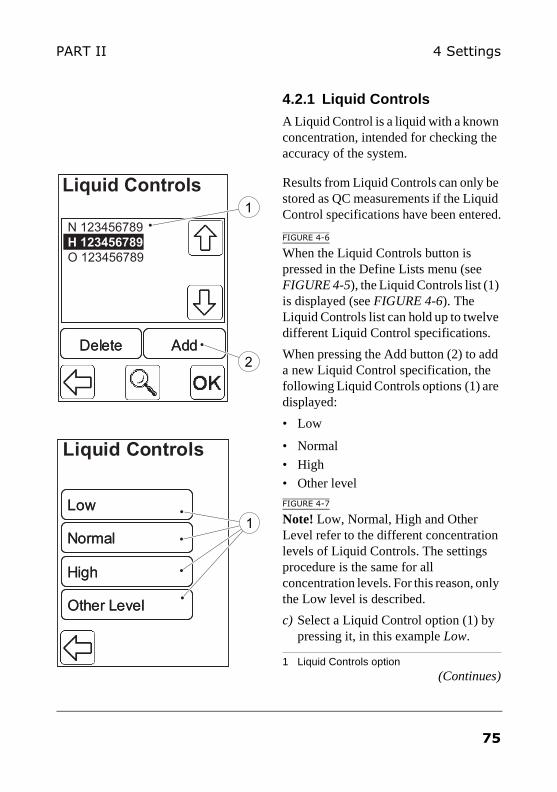
4.2.1 Liquid Controls
A Liquid Control is a liquid with a known concentration, intended for checking the accuracy of the system.
Results from Liquid Controls can only be stored as QC measurements if the Liquid Control specifications have been entered.
FIGURE 4-6
When the Liquid Controls button is pressed in the Define Lists menu (see FIGURE 4-5), the Liquid Controls list (1) is displayed (see FIGURE 4-6). The Liquid Controls list can hold up to twelve different Liquid Control specifications.
When pressing the Add button (2) to add a new Liquid Control specification, the following Liquid Controls options (1) are displayed:
• Low
• Normal
• High
• Other level
FIGURE 4-7
Note! Low, Normal, High and Other Level refer to the different concentration levels of Liquid Controls. The settings procedure is the same for all concentration levels. For this reason, only the Low level is described.
c) Select a Liquid Control option (1) by pressing it, in this example Low.
1 Liquid Controls option(Continues)
Liquid Controls
N 123456789H 123456789O 123456789
DeleteDelete AddAdd2
1
Liquid Controls
NormalNormal
HighHigh
Other LevelOther Level
LowLow1
75
4 Settings PART II
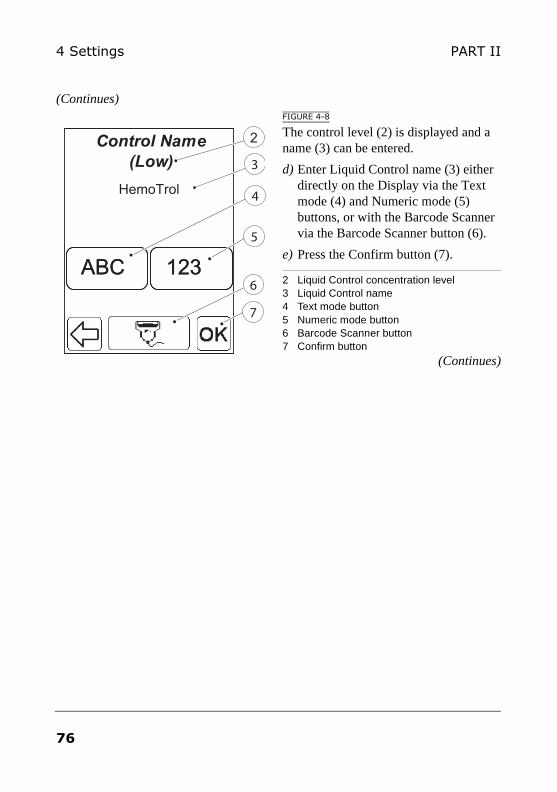
(Continues)FIGURE 4-8
The control level (2) is displayed and a name (3) can be entered.
d) Enter Liquid Control name (3) either directly on the Display via the Text mode (4) and Numeric mode (5) buttons, or with the Barcode Scanner via the Barcode Scanner button (6).
e) Press the Confirm button (7).
2 Liquid Control concentration level 3 Liquid Control name4 Text mode button5 Numeric mode button6 Barcode Scanner button7 Confirm button
(Continues)
Control Name
(Low)
123123ABCABC
4
5
6
7
2
3
HemoTrol
76
4 SettingsPART II
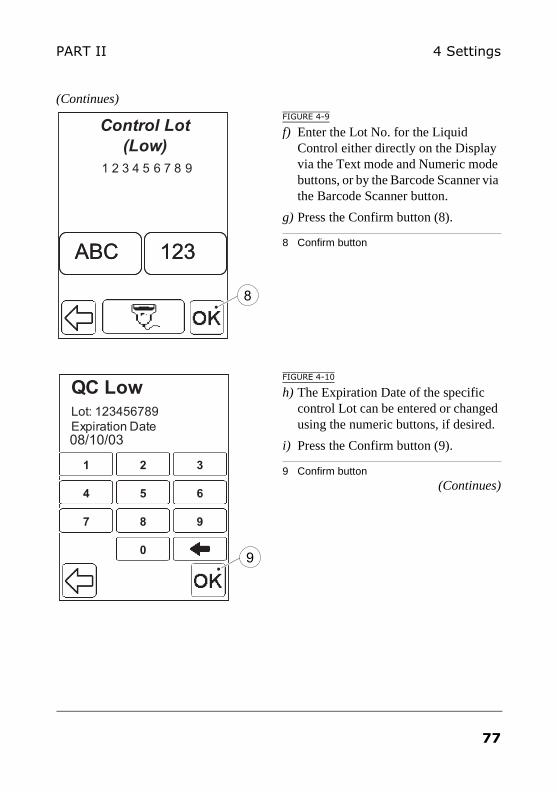
(Continues)FIGURE 4-9
f) Enter the Lot No. for the Liquid Control either directly on the Display via the Text mode and Numeric mode buttons, or by the Barcode Scanner via the Barcode Scanner button.
g) Press the Confirm button (8).
8 Confirm button
FIGURE 4-10
h) The Expiration Date of the specific control Lot can be entered or changed using the numeric buttons, if desired.
i) Press the Confirm button (9).
9 Confirm button(Continues)
Control Lot(Low)
1 2 3 4 5 6 7 8 9
123123ABCABC
8
QC LowLot: 123456789Expiration Date
1
5
2
87
4 6
9
3
0
11
55
22
8877
44 66
99
33
00
08/10/03
9
77
4 Settings PART II
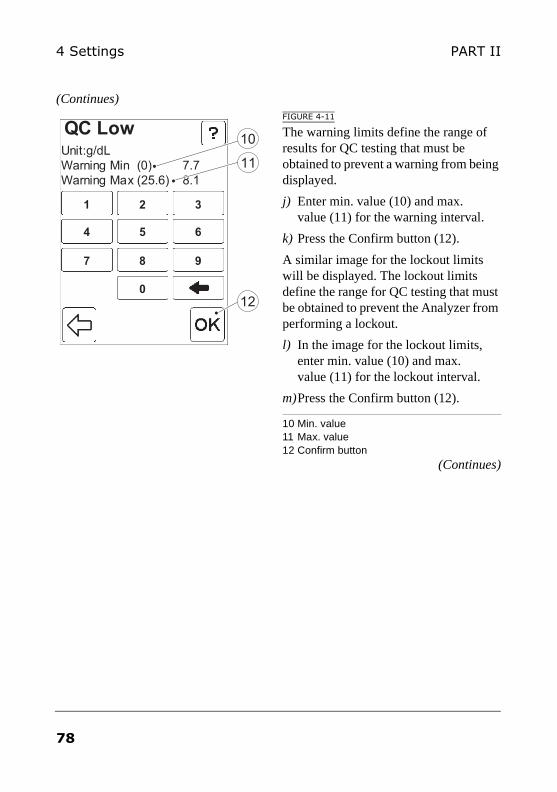
(Continues)FIGURE 4-11
The warning limits define the range of results for QC testing that must be obtained to prevent a warning from being displayed.
j) Enter min. value (10) and max. value (11) for the warning interval.
k) Press the Confirm button (12).
A similar image for the lockout limits will be displayed. The lockout limits define the range for QC testing that must be obtained to prevent the Analyzer from performing a lockout.
l) In the image for the lockout limits, enter min. value (10) and max. value (11) for the lockout interval.
m)Press the Confirm button (12).
10 Min. value11 Max. value12 Confirm button
(Continues)
Unit:g/dL
Warning Min (0) 7.7
Warning Max (25.6) 8.1
QC Low
1
5
2
87
4 6
9
3
0
11
55
22
8877
44 66
99
33
00
10
11
12
78
4 SettingsPART II
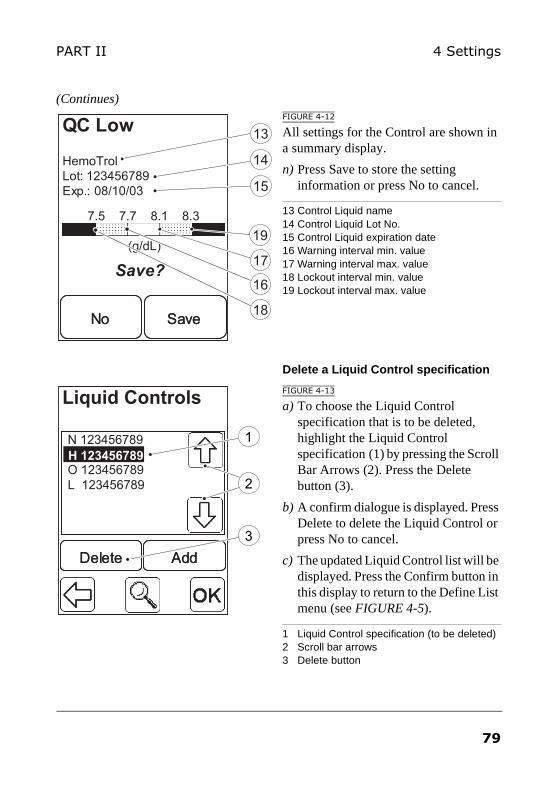
(Continues)FIGURE 4-12
All settings for the Control are shown in a summary display.
n) Press Save to store the setting information or press No to cancel.
13 Control Liquid name14 Control Liquid Lot No.15 Control Liquid expiration date16 Warning interval min. value17 Warning interval max. value18 Lockout interval min. value19 Lockout interval max. value
Delete a Liquid Control specification
FIGURE 4-13
a) To choose the Liquid Control specification that is to be deleted, highlight the Liquid Control specification (1) by pressing the Scroll Bar Arrows (2). Press the Delete button (3).
b) A confirm dialogue is displayed. Press Delete to delete the Liquid Control or press No to cancel.
c) The updated Liquid Control list will be displayed. Press the Confirm button in this display to return to the Define List menu (see FIGURE 4-5).
1 Liquid Control specification (to be deleted)2 Scroll bar arrows3 Delete button
QC Low
HemoTrol
Lot: 123456789
Exp.: 08/10/03
Save?
NoNo SaveSave
7.5 7.7 8.1 8.3
(g/dL)
13
14
15
17
16
19
18
Liquid Controls
N 123456789H 123456789O 123456789L 123456789
DeleteDelete AddAdd
1
2
3
79
4 Settings PART II
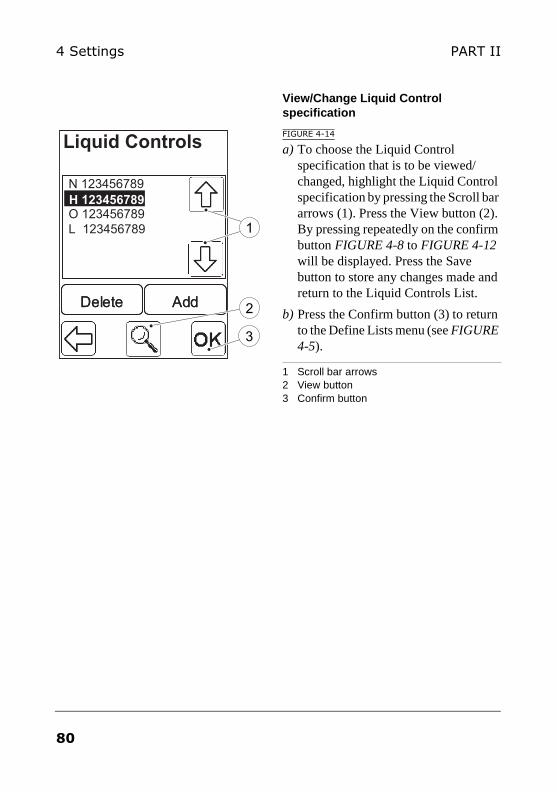
View/Change Liquid Control specification
FIGURE 4-14
a) To choose the Liquid Control specification that is to be viewed/changed, highlight the Liquid Control specification by pressing the Scroll bar arrows (1). Press the View button (2). By pressing repeatedly on the confirm button FIGURE 4-8 to FIGURE 4-12 will be displayed. Press the Save button to store any changes made and return to the Liquid Controls List.
b) Press the Confirm button (3) to return to the Define Lists menu (see FIGURE 4-5).
1 Scroll bar arrows2 View button3 Confirm button
Liquid Controls
N 123456789H 123456789O 123456789L 123456789
DeleteDelete AddAdd 2
1
3
80
4 SettingsPART II
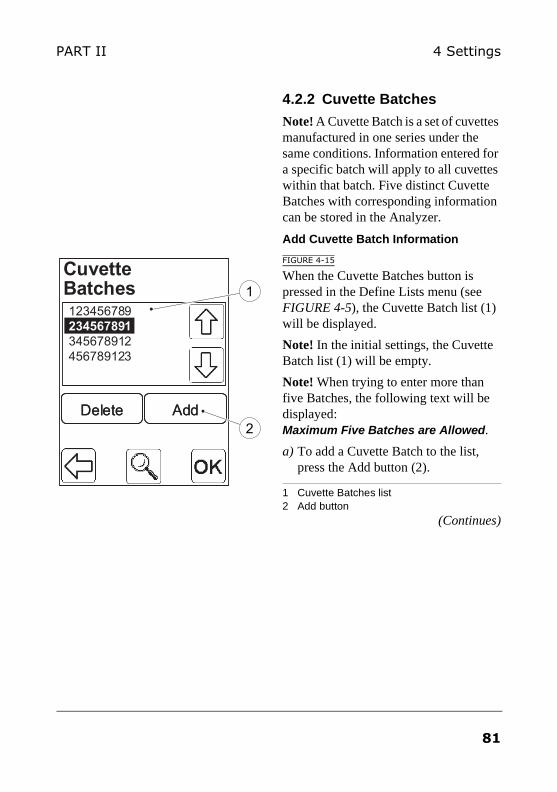
4.2.2 Cuvette Batches
Note! A Cuvette Batch is a set of cuvettes manufactured in one series under the same conditions. Information entered for a specific batch will apply to all cuvettes within that batch. Five distinct Cuvette Batches with corresponding information can be stored in the Analyzer.
Add Cuvette Batch Information
FIGURE 4-15
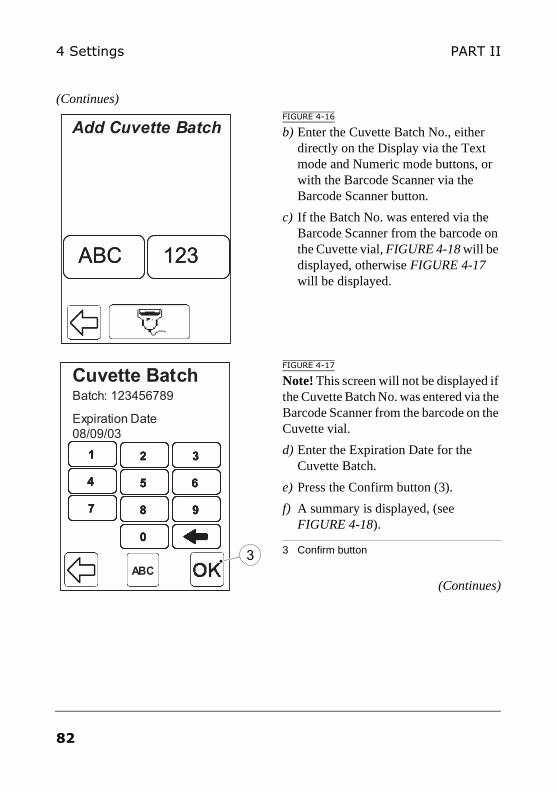
When the Cuvette Batches button is pressed in the Define Lists menu (see FIGURE 4-5), the Cuvette Batch list (1) will be displayed.
Note! In the initial settings, the Cuvette Batch list (1) will be empty.
Note! When trying to enter more than five Batches, the following text will be displayed: Maximum Five Batches are Allowed.
a) To add a Cuvette Batch to the list, press the Add button (2).
1 Cuvette Batches list2 Add button
(Continues)
Cuvette Batches123456789234567891345678912456789123
DeleteDelete AddAdd2
1
81
4 Settings PART II
(Continues)FIGURE 4-16
b) Enter the Cuvette Batch No., either directly on the Display via the Text mode and Numeric mode buttons, or with the Barcode Scanner via the Barcode Scanner button.
c) If the Batch No. was entered via the Barcode Scanner from the barcode on the Cuvette vial, FIGURE 4-18 will be displayed, otherwise FIGURE 4-17 will be displayed.
FIGURE 4-17
Note! This screen will not be displayed if the Cuvette Batch No. was entered via the Barcode Scanner from the barcode on the Cuvette vial.
d) Enter the Expiration Date for the Cuvette Batch.
e) Press the Confirm button (3).
f) A summary is displayed, (see FIGURE 4-18).
3 Confirm button
(Continues)
Add Cuvette Batch
123123ABCABC
0
7 98
4 65
1 32
00
77 9988
44 6655
11 3322
Cuvette BatchBatch: 123456789
Expiration Date08/09/03
3ABCABC
82
4 SettingsPART II
(Continues)FIGURE 4-18
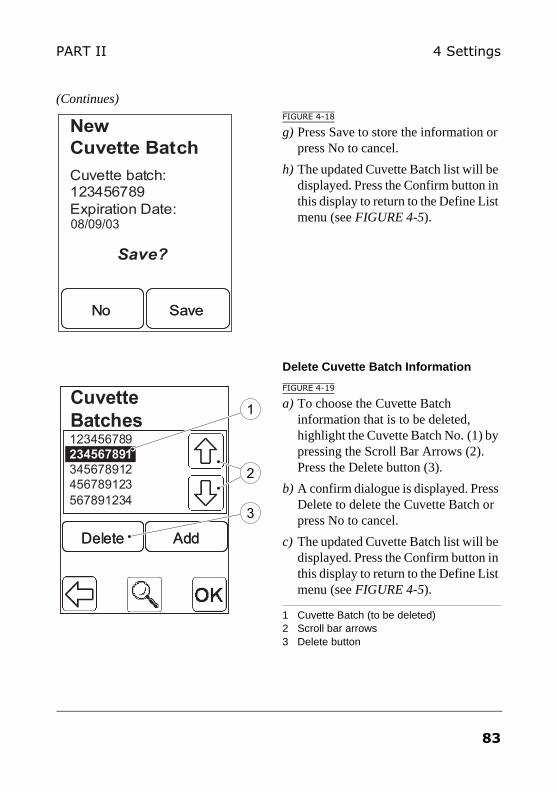
g) Press Save to store the information or press No to cancel.
h) The updated Cuvette Batch list will be displayed. Press the Confirm button in this display to return to the Define List menu (see FIGURE 4-5).
Delete Cuvette Batch Information
FIGURE 4-19
a) To choose the Cuvette Batch information that is to be deleted, highlight the Cuvette Batch No. (1) by pressing the Scroll Bar Arrows (2). Press the Delete button (3).
b) A confirm dialogue is displayed. Press Delete to delete the Cuvette Batch or press No to cancel.
c) The updated Cuvette Batch list will be displayed. Press the Confirm button in this display to return to the Define List menu (see FIGURE 4-5).
1 Cuvette Batch (to be deleted)2 Scroll bar arrows3 Delete button
New Cuvette BatchCuvette batch: 123456789Expiration Date:
Save?
NoNo SaveSave
08/09/03
Cuvette Batches123456789234567891345678912456789123567891234
DeleteDelete AddAdd
2
1
3
83
4 Settings PART II
View Cuvette Batch Information
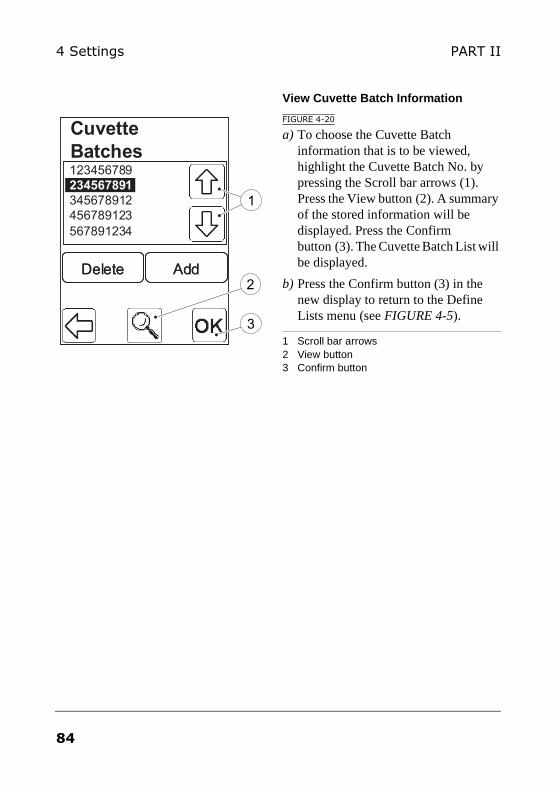
FIGURE 4-20
a) To choose the Cuvette Batch information that is to be viewed, highlight the Cuvette Batch No. by pressing the Scroll bar arrows (1). Press the View button (2). A summary of the stored information will be displayed. Press the Confirm button (3). The Cuvette Batch List will be displayed.
b) Press the Confirm button (3) in the new display to return to the Define Lists menu (see FIGURE 4-5).
1 Scroll bar arrows2 View button3 Confirm button
Cuvette Batches123456789234567891345678912456789123567891234
DeleteDelete AddAdd2
3
1
84
4 SettingsPART II
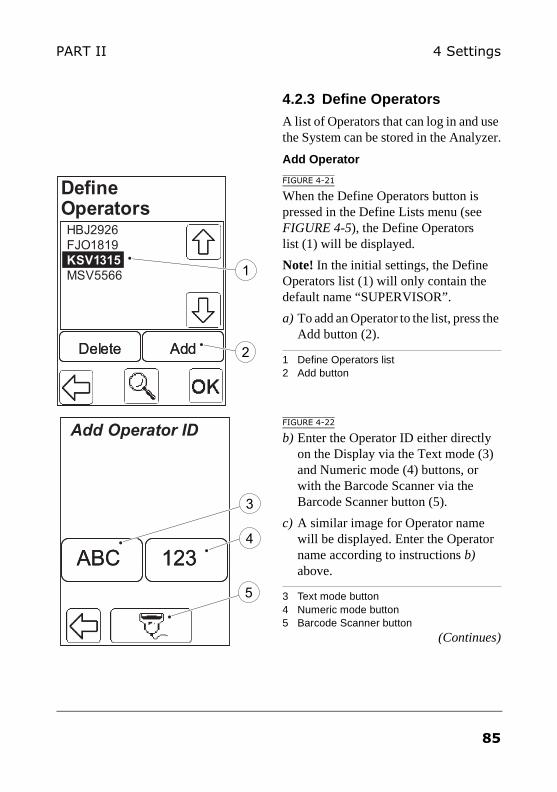
4.2.3 Define Operators
A list of Operators that can log in and use the System can be stored in the Analyzer.
Add Operator
FIGURE 4-21
When the Define Operators button is pressed in the Define Lists menu (see FIGURE 4-5), the Define Operators list (1) will be displayed.
Note! In the initial settings, the Define Operators list (1) will only contain the default name “SUPERVISOR”.
a) To add an Operator to the list, press the Add button (2).
1 Define Operators list2 Add button
FIGURE 4-22
b) Enter the Operator ID either directly on the Display via the Text mode (3) and Numeric mode (4) buttons, or with the Barcode Scanner via the Barcode Scanner button (5).
c) A similar image for Operator name will be displayed. Enter the Operator name according to instructions b) above.
3 Text mode button4 Numeric mode button5 Barcode Scanner button
(Continues)
Define OperatorsHBJ2926FJO1819KSV1315MSV5566
DeleteDelete AddAdd 2
1
Add Operator ID
123123ABCABC4
5
3
85
4 Settings PART II
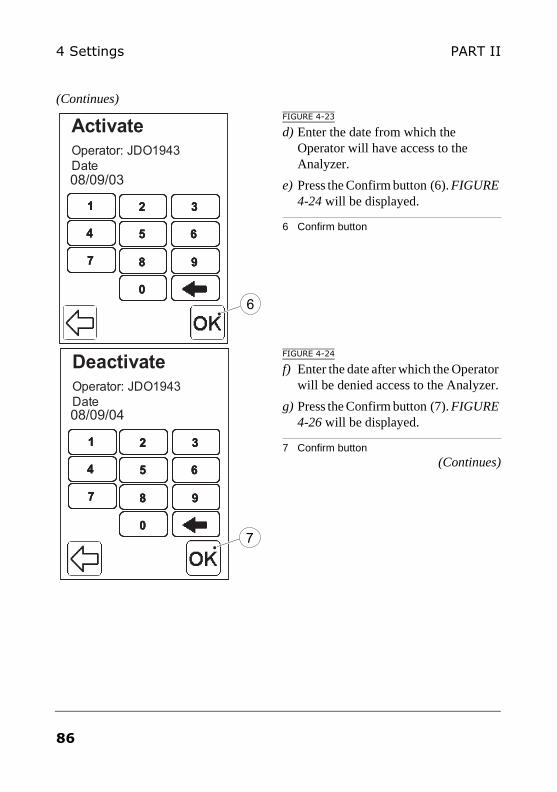
(Continues)FIGURE 4-23
d) Enter the date from which the Operator will have access to the Analyzer.
e) Press the Confirm button (6). FIGURE 4-24 will be displayed.
6 Confirm button
FIGURE 4-24
f) Enter the date after which the Operator will be denied access to the Analyzer.
g) Press the Confirm button (7). FIGURE 4-26 will be displayed.
7 Confirm button(Continues)
0
7 98
4 65
1 32
00
77 9988
44 6655
11 3322
ActivateOperator: JDO1943 Date
6
08/09/03
0
7 98
4 65
1 32
00
77 9988
44 6655
11 3322
DeactivateOperator: JDO1943 Date
7
08/09/04
86
4 SettingsPART II
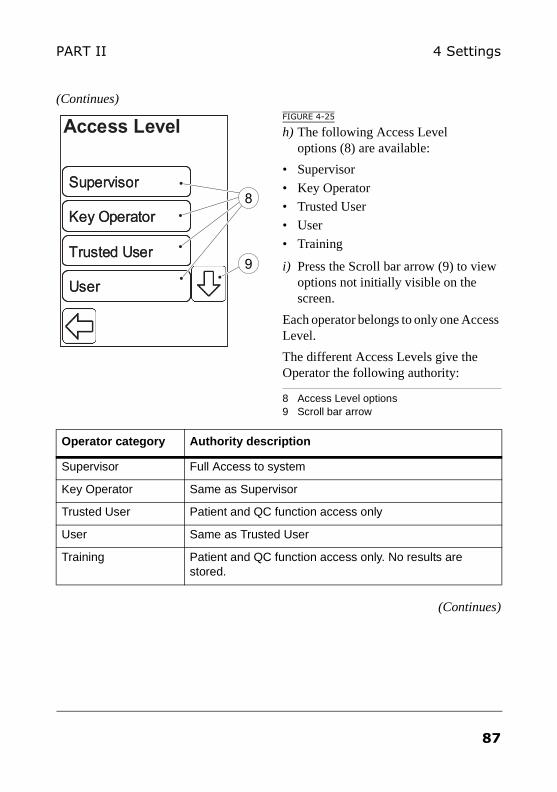
(Continues)FIGURE 4-25
h) The following Access Level options (8) are available:
• Supervisor
• Key Operator
• Trusted User
• User
• Training
i) Press the Scroll bar arrow (9) to view options not initially visible on the screen.
Each operator belongs to only one Access Level.
The different Access Levels give the Operator the following authority:
8 Access Level options9 Scroll bar arrow
(Continues)
Operator category Authority description
Supervisor Full Access to system
Key Operator Same as Supervisor
Trusted User Patient and QC function access only
User Same as Trusted User
Training Patient and QC function access only. No results are stored.
Key OperatorKey Operator
Trusted UserTrusted User
UserUser
Access Level
SupervisorSupervisor
9
8
87
4 Settings PART II
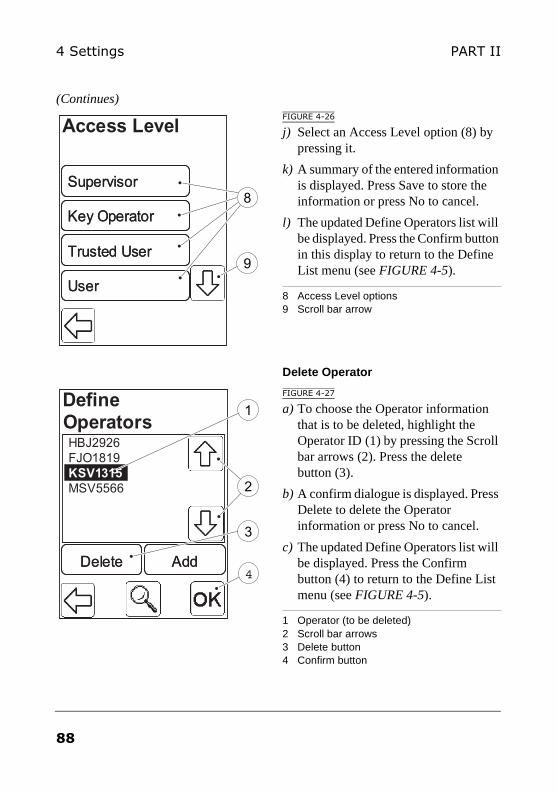
(Continues)FIGURE 4-26
j) Select an Access Level option (8) by pressing it.
k) A summary of the entered information is displayed. Press Save to store the information or press No to cancel.
l) The updated Define Operators list will be displayed. Press the Confirm button in this display to return to the Define List menu (see FIGURE 4-5).
8 Access Level options9 Scroll bar arrow
Delete Operator
FIGURE 4-27
a) To choose the Operator information that is to be deleted, highlight the Operator ID (1) by pressing the Scroll bar arrows (2). Press the delete button (3).
b) A confirm dialogue is displayed. Press Delete to delete the Operator information or press No to cancel.
c) The updated Define Operators list will be displayed. Press the Confirm button (4) to return to the Define List menu (see FIGURE 4-5).
1 Operator (to be deleted)2 Scroll bar arrows3 Delete button4 Confirm button
Key OperatorKey Operator
Trusted UserTrusted User
UserUser
Access Level
SupervisorSupervisor
9
8
Define OperatorsHBJ2926FJO1819KSV1315MSV5566
DeleteDelete AddAdd
2
1
3
4
88
4 SettingsPART II
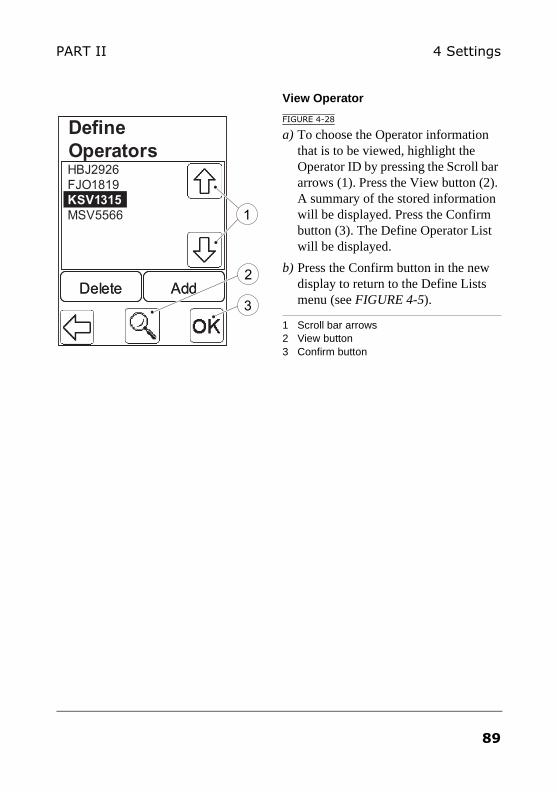
View Operator
FIGURE 4-28
a) To choose the Operator information that is to be viewed, highlight the Operator ID by pressing the Scroll bar arrows (1). Press the View button (2). A summary of the stored information will be displayed. Press the Confirm button (3). The Define Operator List will be displayed.
b) Press the Confirm button in the new display to return to the Define Lists menu (see FIGURE 4-5).
1 Scroll bar arrows2 View button3 Confirm button
Define OperatorsHBJ2926FJO1819KSV1315MSV5566
DeleteDelete AddAdd3
2
1
89
4 Settings PART II
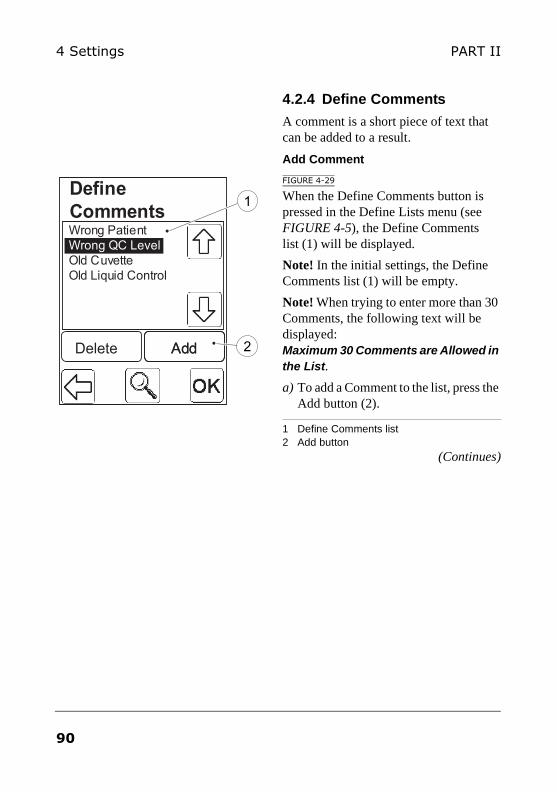
4.2.4 Define Comments
A comment is a short piece of text that can be added to a result.
Add Comment
FIGURE 4-29
When the Define Comments button is pressed in the Define Lists menu (see FIGURE 4-5), the Define Comments list (1) will be displayed.
Note! In the initial settings, the Define Comments list (1) will be empty.
Note! When trying to enter more than 30 Comments, the following text will be displayed: Maximum 30 Comments are Allowed in the List.
a) To add a Comment to the list, press the Add button (2).
1 Define Comments list2 Add button
(Continues)
Define CommentsWrong PatientWrong QC LevelOld CuvetteOld Liquid Control
Delete AddAdd
1
2
90
4 SettingsPART II
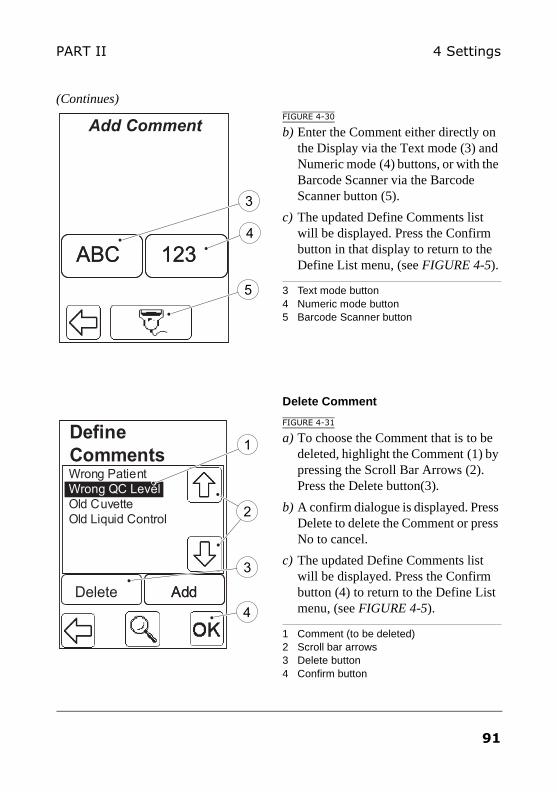
(Continues)FIGURE 4-30
b) Enter the Comment either directly on the Display via the Text mode (3) and Numeric mode (4) buttons, or with the Barcode Scanner via the Barcode Scanner button (5).
c) The updated Define Comments list will be displayed. Press the Confirm button in that display to return to the Define List menu, (see FIGURE 4-5).
3 Text mode button4 Numeric mode button5 Barcode Scanner button
Delete Comment
FIGURE 4-31
a) To choose the Comment that is to be deleted, highlight the Comment (1) by pressing the Scroll Bar Arrows (2). Press the Delete button(3).
b) A confirm dialogue is displayed. Press Delete to delete the Comment or press No to cancel.
c) The updated Define Comments list will be displayed. Press the Confirm button (4) to return to the Define List menu, (see FIGURE 4-5).
1 Comment (to be deleted)2 Scroll bar arrows3 Delete button4 Confirm button
Add Comment
123123ABCABC4
5
3
Define CommentsWrong PatientWrong QC LevelOld CuvetteOld Liquid Control
Delete AddAdd
1
3
2
4
91
4 Settings PART II
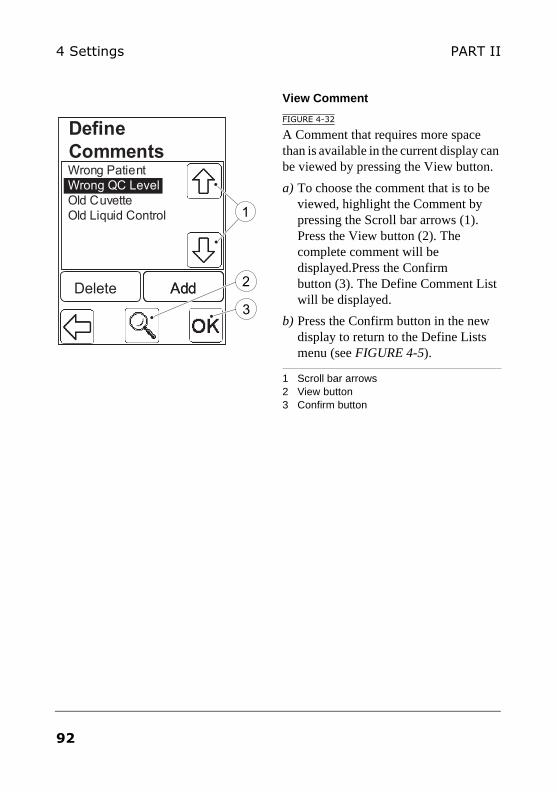
View Comment
FIGURE 4-32
A Comment that requires more space than is available in the current display can be viewed by pressing the View button.
a) To choose the comment that is to be viewed, highlight the Comment by pressing the Scroll bar arrows (1). Press the View button (2). The complete comment will be displayed.Press the Confirm button (3). The Define Comment List will be displayed.
b) Press the Confirm button in the new display to return to the Define Lists menu (see FIGURE 4-5).
1 Scroll bar arrows2 View button3 Confirm button
Define CommentsWrong PatientWrong QC LevelOld CuvetteOld Liquid Control
Delete AddAdd 2
3
1
92
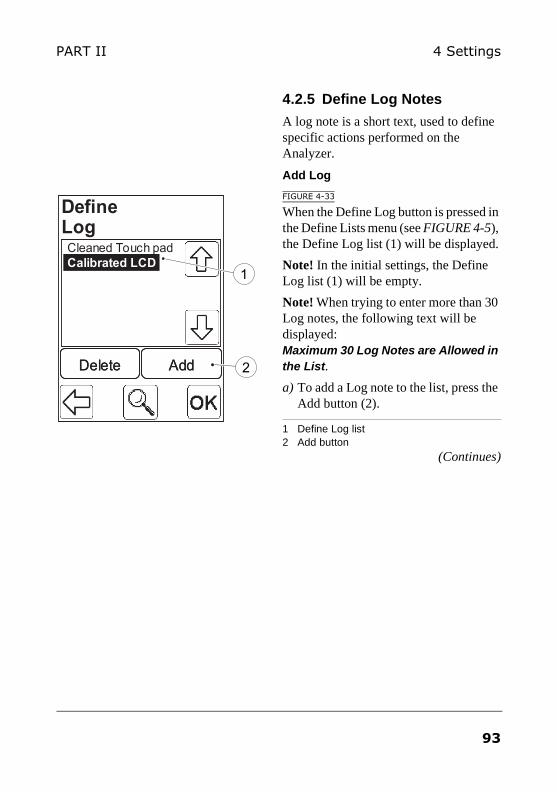
4 SettingsPART II
4.2.5 Define Log Notes
A log note is a short text, used to define specific actions performed on the Analyzer.
Add Log
FIGURE 4-33
When the Define Log button is pressed in the Define Lists menu (see FIGURE 4-5), the Define Log list (1) will be displayed.
Note! In the initial settings, the Define Log list (1) will be empty.
Note! When trying to enter more than 30 Log notes, the following text will be displayed: Maximum 30 Log Notes are Allowed in the List.
a) To add a Log note to the list, press the Add button (2).
1 Define Log list2 Add button
(Continues)
Define LogCleaned Touch padCalibrated LCD
DeleteDelete AddAdd 2
1
93
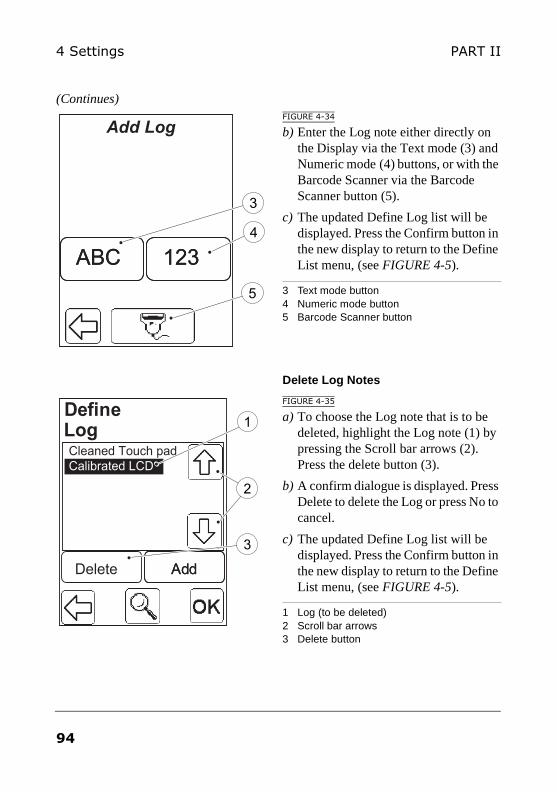
4 Settings PART II
(Continues)FIGURE 4-34
b) Enter the Log note either directly on the Display via the Text mode (3) and Numeric mode (4) buttons, or with the Barcode Scanner via the Barcode Scanner button (5).
c) The updated Define Log list will be displayed. Press the Confirm button in the new display to return to the Define List menu, (see FIGURE 4-5).
3 Text mode button4 Numeric mode button5 Barcode Scanner button
Delete Log Notes
FIGURE 4-35
a) To choose the Log note that is to be deleted, highlight the Log note (1) by pressing the Scroll bar arrows (2). Press the delete button (3).
b) A confirm dialogue is displayed. Press Delete to delete the Log or press No to cancel.
c) The updated Define Log list will be displayed. Press the Confirm button in the new display to return to the Define List menu, (see FIGURE 4-5).
1 Log (to be deleted)2 Scroll bar arrows3 Delete button
Add Log
123123ABCABC4
5
3
Define LogCleaned Touch padCalibrated LCD
Delete AddAdd
1
3
2
94
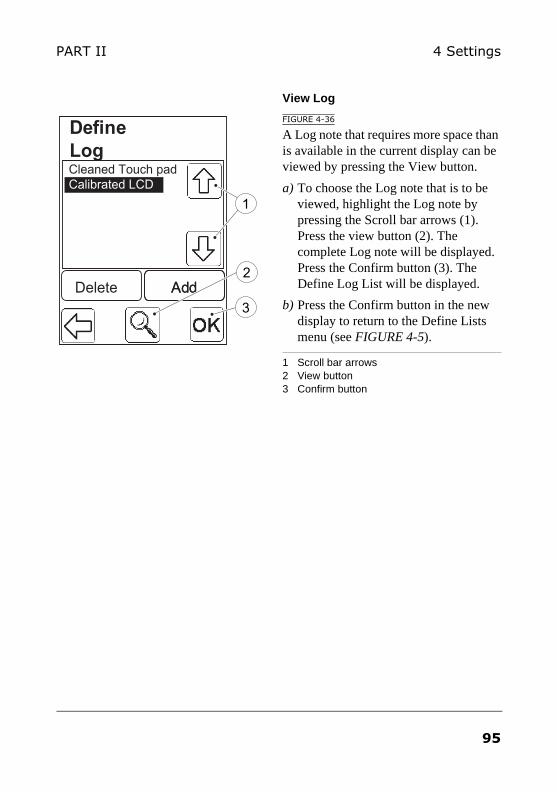
4 SettingsPART II
View Log
FIGURE 4-36
A Log note that requires more space than is available in the current display can be viewed by pressing the View button.
a) To choose the Log note that is to be viewed, highlight the Log note by pressing the Scroll bar arrows (1). Press the view button (2). The complete Log note will be displayed. Press the Confirm button (3). The Define Log List will be displayed.
b) Press the Confirm button in the new display to return to the Define Lists menu (see FIGURE 4-5).
1 Scroll bar arrows2 View button3 Confirm button
Define LogCleaned Touch padCalibrated LCD
Delete AddAdd2
3
1
95
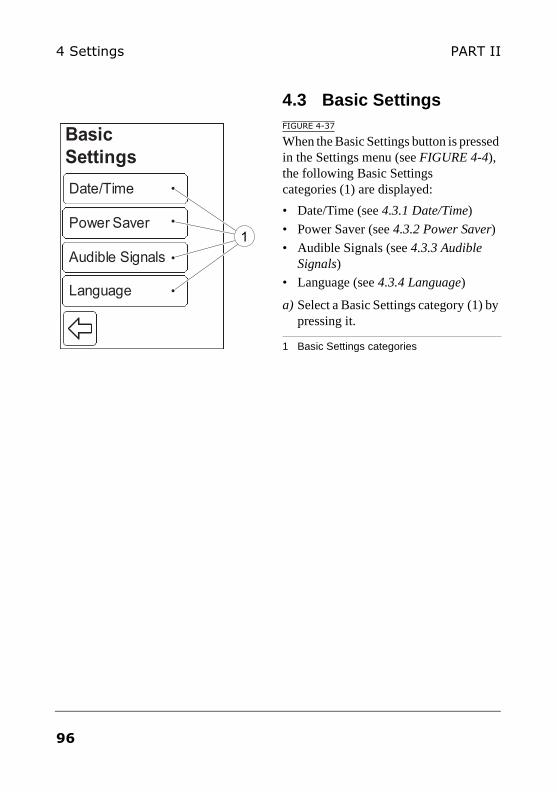
4 Settings PART II
4.3 Basic SettingsFIGURE 4-37
When the Basic Settings button is pressed in the Settings menu (see FIGURE 4-4), the following Basic Settings categories (1) are displayed:
• Date/Time (see 4.3.1 Date/Time)
• Power Saver (see 4.3.2 Power Saver)
• Audible Signals (see 4.3.3 Audible Signals)
• Language (see 4.3.4 Language)
a) Select a Basic Settings category (1) by pressing it.
1 Basic Settings categories
Power SaverPower Saver
Audible SignalsAudible Signals
Basic SettingsDate/TimeDate/Time
LanguageLanguage
1
96
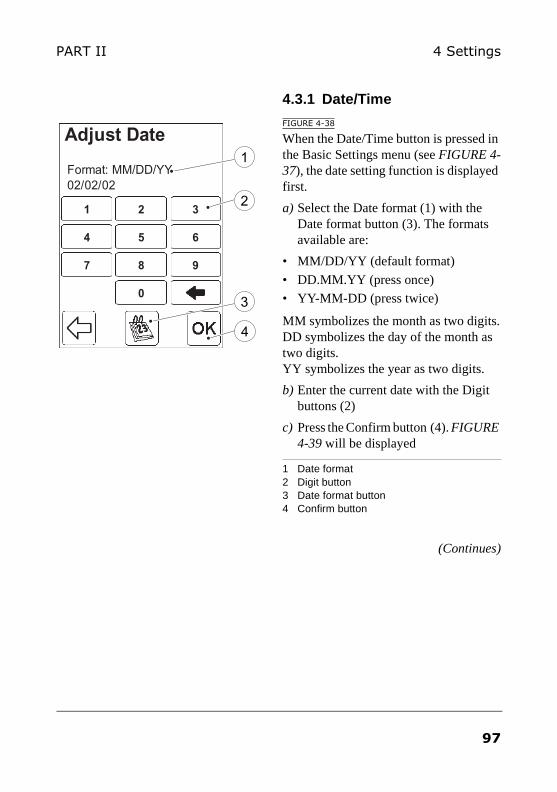
4 SettingsPART II
4.3.1 Date/Time
FIGURE 4-38
When the Date/Time button is pressed in the Basic Settings menu (see FIGURE 4-37), the date setting function is displayed first.
a) Select the Date format (1) with the Date format button (3). The formats available are:
• MM/DD/YY (default format)
• DD.MM.YY (press once)
• YY-MM-DD (press twice)
MM symbolizes the month as two digits. DD symbolizes the day of the month as two digits. YY symbolizes the year as two digits.
b) Enter the current date with the Digit buttons (2)
c) Press the Confirm button (4). FIGURE 4-39 will be displayed
1 Date format2 Digit button3 Date format button4 Confirm button
(Continues)
Format: MM/DD/YY02/02/02
Adjust Date
1
5
2
87
4 6
9
3
0
11
55
22
8877
44 66
99
33
003
1
2
4
97
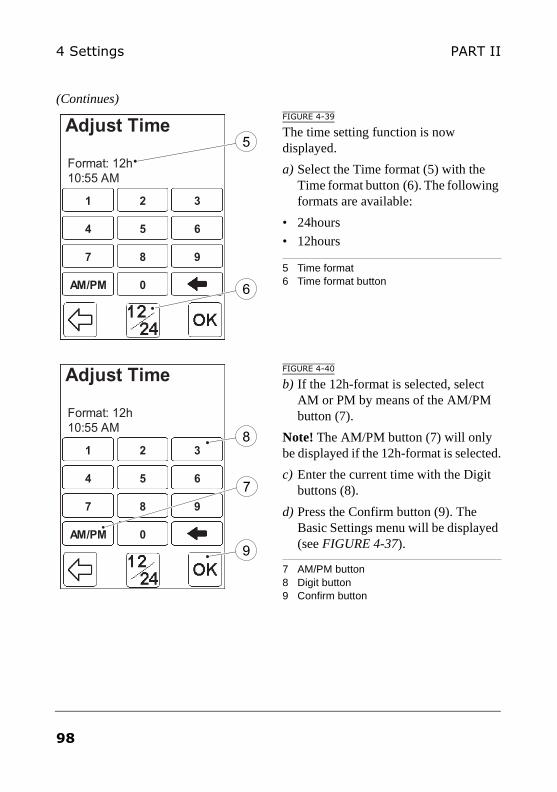
4 Settings PART II
(Continues)FIGURE 4-39
The time setting function is now displayed.
a) Select the Time format (5) with the Time format button (6). The following formats are available:
• 24hours
• 12hours
5 Time format6 Time format button
FIGURE 4-40
b) If the 12h-format is selected, select AM or PM by means of the AM/PM button (7).
Note! The AM/PM button (7) will only be displayed if the 12h-format is selected.
c) Enter the current time with the Digit buttons (8).
d) Press the Confirm button (9). The Basic Settings menu will be displayed (see FIGURE 4-37).
7 AM/PM button8 Digit button9 Confirm button
Format: 12h10:55 AM
Adjust Time
11
55
22
8877
44 66
99
33
00AM/PMAM/PM 6
5
Format: 12h10:55 AM
Adjust Time
11
55
22
8877
44 66
99
33
00AM/PMAM/PM
8
9
7
98
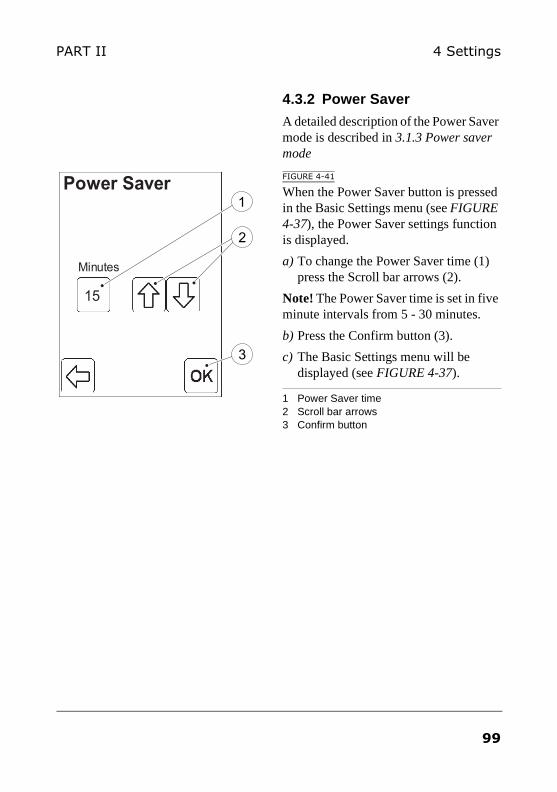
4 SettingsPART II
4.3.2 Power Saver
A detailed description of the Power Saver mode is described in 3.1.3 Power saver mode
FIGURE 4-41
When the Power Saver button is pressed in the Basic Settings menu (see FIGURE 4-37), the Power Saver settings function is displayed.
a) To change the Power Saver time (1) press the Scroll bar arrows (2).
Note! The Power Saver time is set in five minute intervals from 5 - 30 minutes.
b) Press the Confirm button (3).
c) The Basic Settings menu will be displayed (see FIGURE 4-37).
1 Power Saver time2 Scroll bar arrows3 Confirm button
Power Saver
30
Minutes
2
1
3
15
99
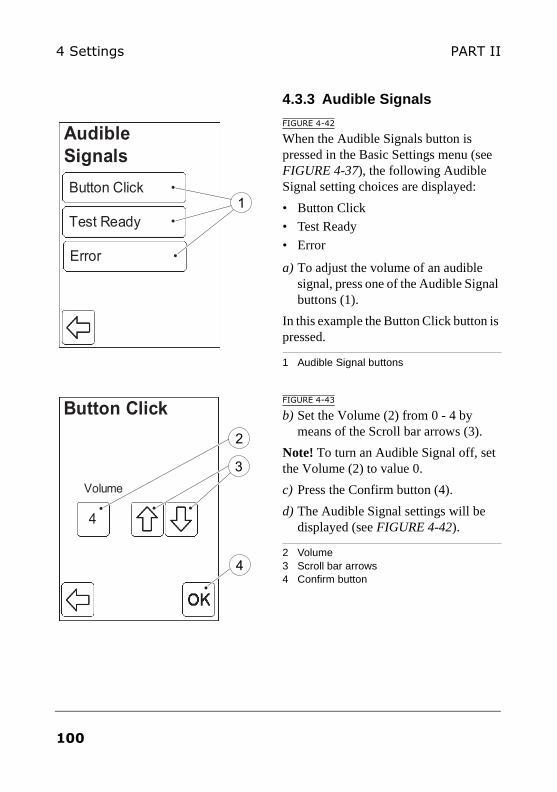
4 Settings PART II
4.3.3 Audible Signals
FIGURE 4-42
When the Audible Signals button is pressed in the Basic Settings menu (see FIGURE 4-37), the following Audible Signal setting choices are displayed:
• Button Click
• Test Ready
• Error
a) To adjust the volume of an audible signal, press one of the Audible Signal buttons (1).
In this example the Button Click button is pressed.
1 Audible Signal buttons
FIGURE 4-43
b) Set the Volume (2) from 0 - 4 by means of the Scroll bar arrows (3).
Note! To turn an Audible Signal off, set the Volume (2) to value 0.
c) Press the Confirm button (4).
d) The Audible Signal settings will be displayed (see FIGURE 4-42).
2 Volume3 Scroll bar arrows4 Confirm button
Button ClickButton Click
Test ReadyTest Ready
Audible Signals
ErrorError
1
Button Click
2
Volume
3
2
4
4
100
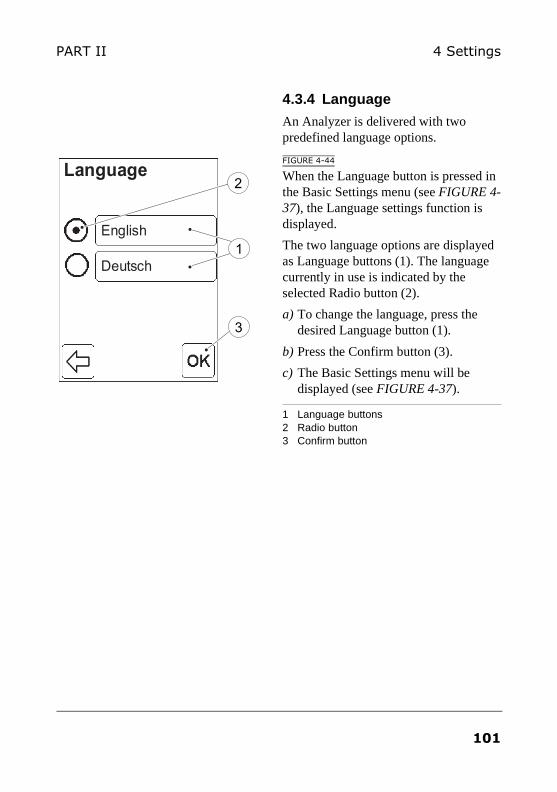
4 SettingsPART II
4.3.4 Language
An Analyzer is delivered with two predefined language options.
FIGURE 4-44
When the Language button is pressed in the Basic Settings menu (see FIGURE 4-37), the Language settings function is displayed.
The two language options are displayed as Language buttons (1). The language currently in use is indicated by the selected Radio button (2).
a) To change the language, press the desired Language button (1).
b) Press the Confirm button (3).
c) The Basic Settings menu will be displayed (see FIGURE 4-37).
1 Language buttons2 Radio button3 Confirm button
EnglishEnglish
DeutschDeutsch
Language2
1
3
101
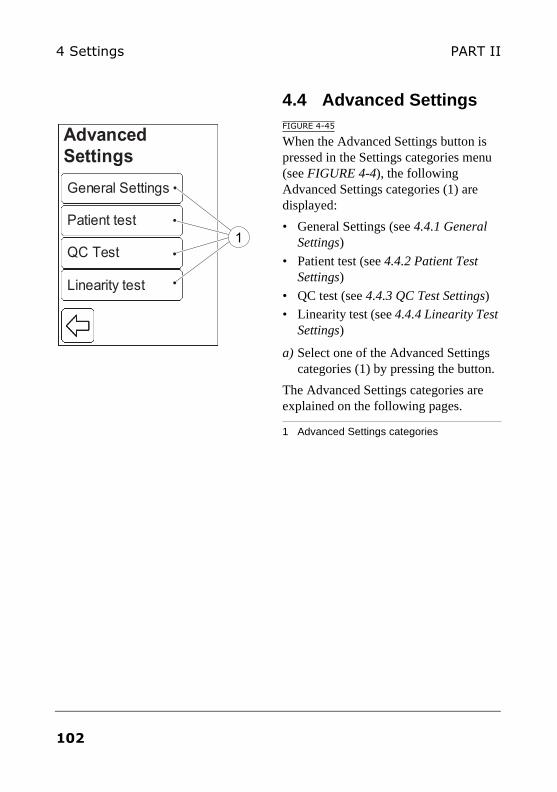
4 Settings PART II
4.4 Advanced SettingsFIGURE 4-45
When the Advanced Settings button is pressed in the Settings categories menu (see FIGURE 4-4), the following Advanced Settings categories (1) are displayed:
• General Settings (see 4.4.1 General Settings)
• Patient test (see 4.4.2 Patient Test Settings)
• QC test (see 4.4.3 QC Test Settings)
• Linearity test (see 4.4.4 Linearity Test Settings)
a) Select one of the Advanced Settings categories (1) by pressing the button.
The Advanced Settings categories are explained on the following pages.
1 Advanced Settings categories
General SettingsGeneral Settings
Patient testPatient test
QC testQC Test
Linearity testLinearity test
Advanced Settings
1
102
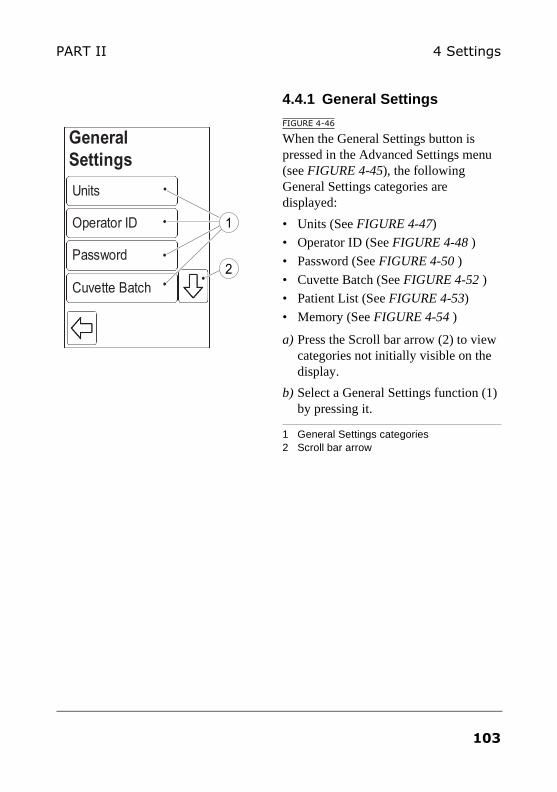
4 SettingsPART II
4.4.1 General Settings
FIGURE 4-46
When the General Settings button is pressed in the Advanced Settings menu (see FIGURE 4-45), the following General Settings categories are displayed:
• Units (See FIGURE 4-47)
• Operator ID (See FIGURE 4-48 )
• Password (See FIGURE 4-50 )
• Cuvette Batch (See FIGURE 4-52 )
• Patient List (See FIGURE 4-53)
• Memory (See FIGURE 4-54 )
a) Press the Scroll bar arrow (2) to view categories not initially visible on the display.
b) Select a General Settings function (1) by pressing it.
1 General Settings categories2 Scroll bar arrow
UnitsUnits
Operator IDOperator ID
PasswordPassword
Cuvette BatchCuvette Batch
GeneralSettings
1
2
103
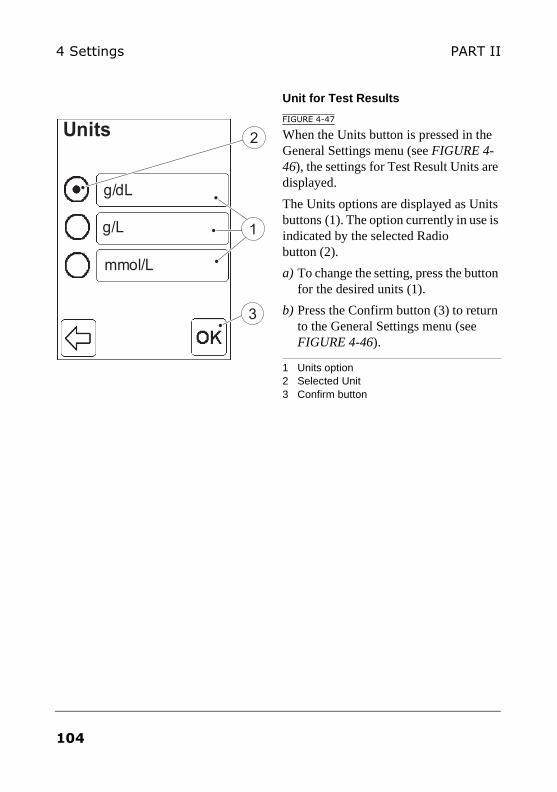
4 Settings PART II
Unit for Test Results
FIGURE 4-47
When the Units button is pressed in the General Settings menu (see FIGURE 4-46), the settings for Test Result Units are displayed.
The Units options are displayed as Units buttons (1). The option currently in use is indicated by the selected Radio button (2).
a) To change the setting, press the button for the desired units (1).
b) Press the Confirm button (3) to return to the General Settings menu (see FIGURE 4-46).
1 Units option2 Selected Unit3 Confirm button
mg/dLg/dL
mmol/L
Units
3
2
mmol/L
g/L 1
104
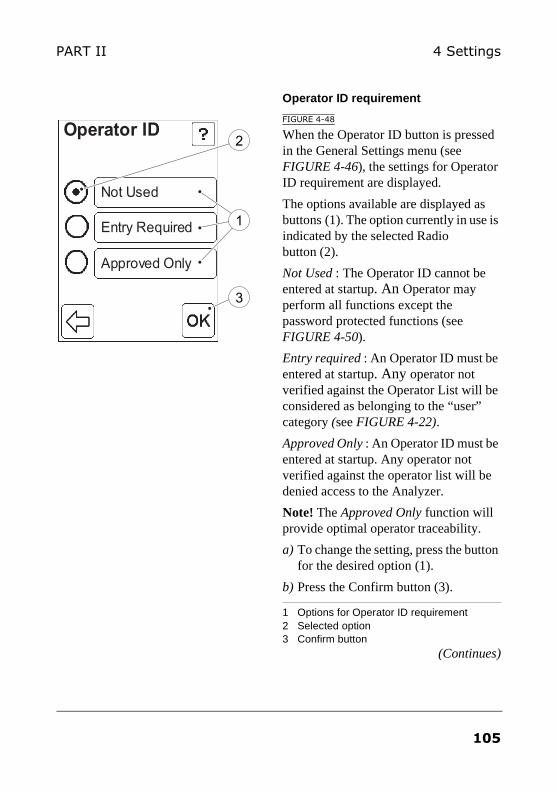
4 SettingsPART II
Operator ID requirement
FIGURE 4-48
When the Operator ID button is pressed in the General Settings menu (see FIGURE 4-46), the settings for Operator ID requirement are displayed.
The options available are displayed as buttons (1). The option currently in use is indicated by the selected Radio button (2).
Not Used : The Operator ID cannot be entered at startup. An Operator may perform all functions except the password protected functions (see FIGURE 4-50).
Entry required : An Operator ID must be entered at startup. Any operator not verified against the Operator List will be considered as belonging to the “user” category (see FIGURE 4-22).
Approved Only : An Operator ID must be entered at startup. Any operator not verified against the operator list will be denied access to the Analyzer.
Note! The Approved Only function will provide optimal operator traceability.
a) To change the setting, press the button for the desired option (1).
b) Press the Confirm button (3).
1 Options for Operator ID requirement 2 Selected option3 Confirm button
(Continues)
Not UsedNot Used
Entry RequiredEntry Required
Operator ID
Approved OnlyApproved Only
2
3
1
105
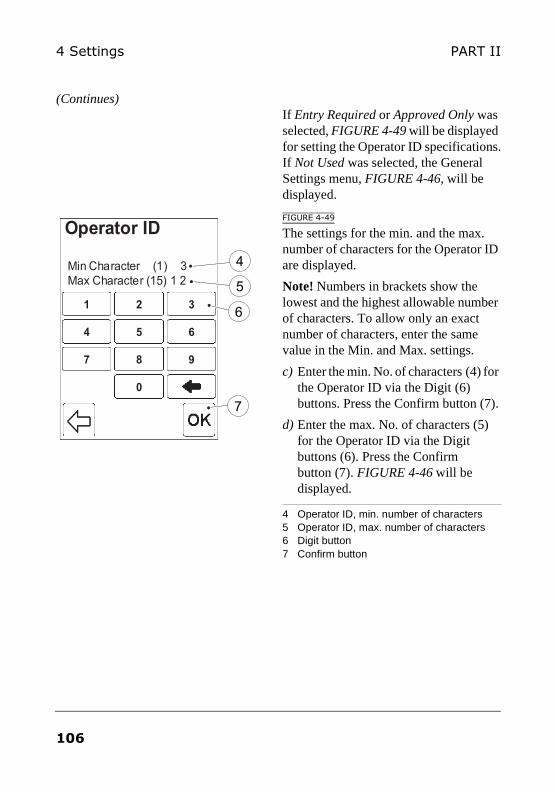
4 Settings PART II
(Continues)If Entry Required or Approved Only was selected, FIGURE 4-49 will be displayed for setting the Operator ID specifications. If Not Used was selected, the General Settings menu, FIGURE 4-46, will be displayed.
FIGURE 4-49
The settings for the min. and the max. number of characters for the Operator ID are displayed.
Note! Numbers in brackets show the lowest and the highest allowable number of characters. To allow only an exact number of characters, enter the same value in the Min. and Max. settings.
c) Enter the min. No. of characters (4) for the Operator ID via the Digit (6) buttons. Press the Confirm button (7).
d) Enter the max. No. of characters (5) for the Operator ID via the Digit buttons (6). Press the Confirm button (7). FIGURE 4-46 will be displayed.
4 Operator ID, min. number of characters5 Operator ID, max. number of characters6 Digit button7 Confirm button
Min Character (1) 3Max Character (15) 1 2
Operator ID
1
5
2
87
4 6
9
3
0
11
55
22
8877
44 66
99
33
00
5
4
6
7
106
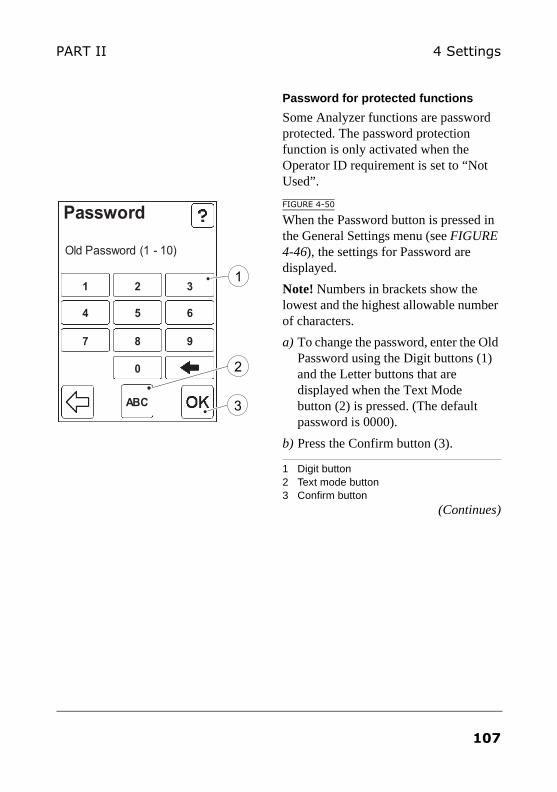
4 SettingsPART II
Password for protected functions
Some Analyzer functions are password protected. The password protection function is only activated when the Operator ID requirement is set to “Not Used”.
FIGURE 4-50
When the Password button is pressed in the General Settings menu (see FIGURE 4-46), the settings for Password are displayed.
Note! Numbers in brackets show the lowest and the highest allowable number of characters.
a) To change the password, enter the Old Password using the Digit buttons (1) and the Letter buttons that are displayed when the Text Mode button (2) is pressed. (The default password is 0000).
b) Press the Confirm button (3).
1 Digit button2 Text mode button3 Confirm button
(Continues)
Old Password (1 - 10)
Password
1
5
2
87
4 6
9
3
0
11
55
22
8877
44 66
99
33
00
ABCABC
2
3
1
107
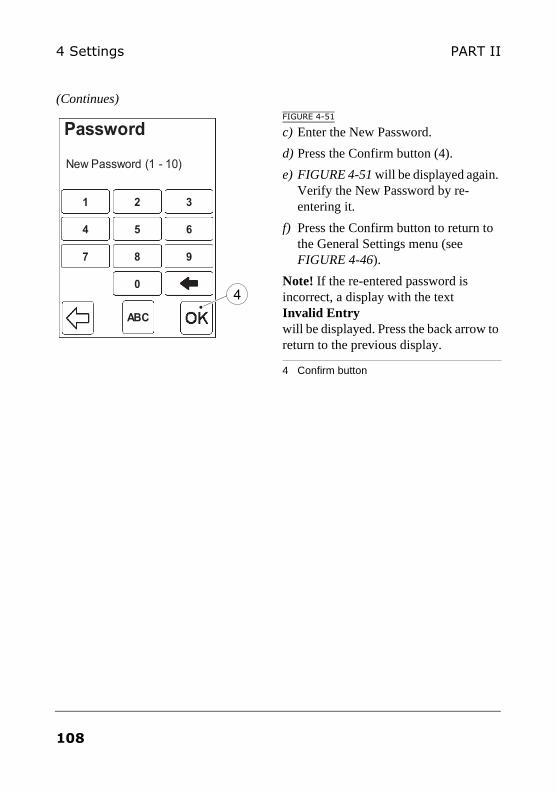
4 Settings PART II
(Continues)FIGURE 4-51
c) Enter the New Password.
d) Press the Confirm button (4).
e) FIGURE 4-51 will be displayed again. Verify the New Password by re-entering it.
f) Press the Confirm button to return to the General Settings menu (see FIGURE 4-46).
Note! If the re-entered password is incorrect, a display with the text Invalid Entry will be displayed. Press the back arrow to return to the previous display.
4 Confirm button
New Password (1 - 10)
Password
1
5
2
87
4 6
9
3
0
11
55
22
8877
44 66
99
33
00
ABCABC
4
108
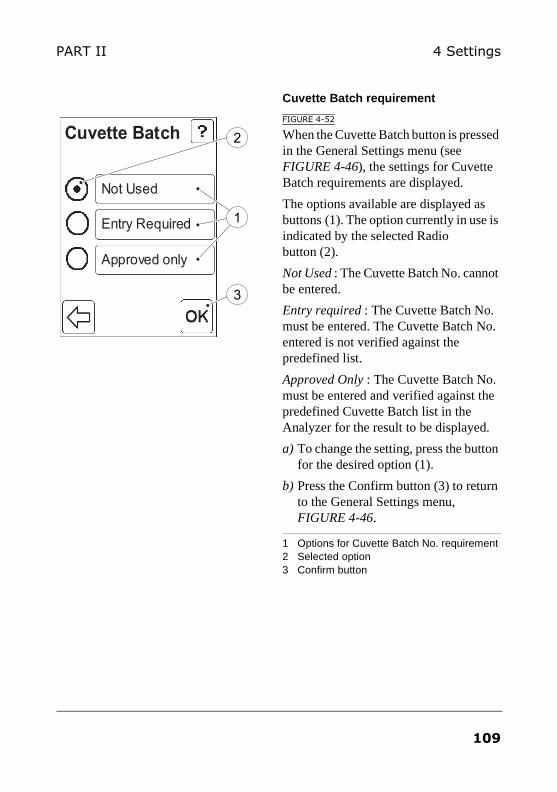
4 SettingsPART II
Cuvette Batch requirement
FIGURE 4-52
When the Cuvette Batch button is pressed in the General Settings menu (see FIGURE 4-46), the settings for Cuvette Batch requirements are displayed.
The options available are displayed as buttons (1). The option currently in use is indicated by the selected Radio button (2).
Not Used : The Cuvette Batch No. cannot be entered.
Entry required : The Cuvette Batch No. must be entered. The Cuvette Batch No. entered is not verified against the predefined list.
Approved Only : The Cuvette Batch No. must be entered and verified against the predefined Cuvette Batch list in the Analyzer for the result to be displayed.
a) To change the setting, press the button for the desired option (1).
b) Press the Confirm button (3) to return to the General Settings menu, FIGURE 4-46.
1 Options for Cuvette Batch No. requirement 2 Selected option3 Confirm button
Cuvette Batch
Not UsedNot Used
Entry RequiredEntry Required
Approved onlyApproved only
2
3
1
109
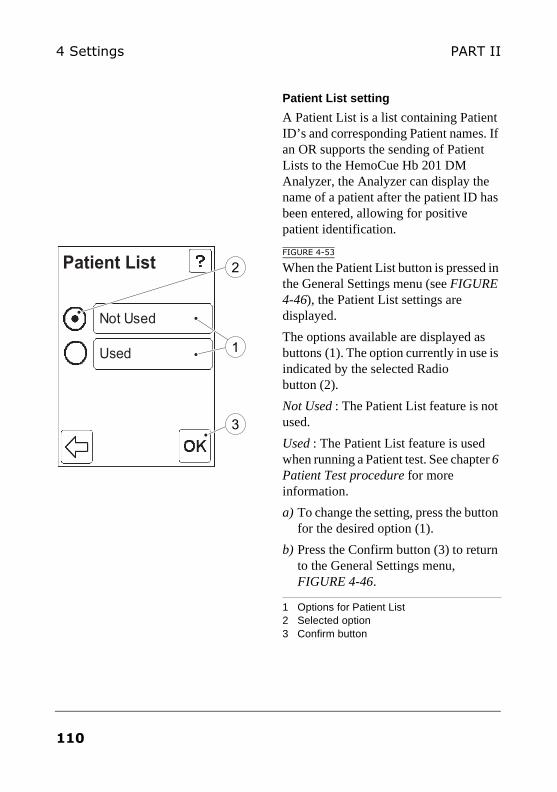
4 Settings PART II
Patient List setting
A Patient List is a list containing Patient ID’s and corresponding Patient names. If an OR supports the sending of Patient Lists to the HemoCue Hb 201 DM Analyzer, the Analyzer can display the name of a patient after the patient ID has been entered, allowing for positive patient identification.
FIGURE 4-53
When the Patient List button is pressed in the General Settings menu (see FIGURE 4-46), the Patient List settings are displayed.
The options available are displayed as buttons (1). The option currently in use is indicated by the selected Radio button (2).
Not Used : The Patient List feature is not used.
Used : The Patient List feature is used when running a Patient test. See chapter 6 Patient Test procedure for more information.
a) To change the setting, press the button for the desired option (1).
b) Press the Confirm button (3) to return to the General Settings menu, FIGURE 4-46.
1 Options for Patient List2 Selected option3 Confirm button
Patient List
Not UsedNot Used
Entry RequiredUsed
2
3
1
110
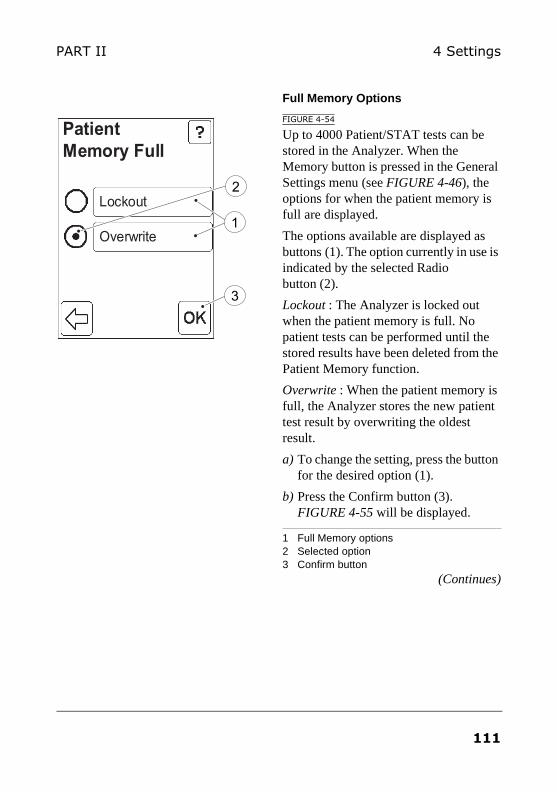
4 SettingsPART II
Full Memory Options
FIGURE 4-54
Up to 4000 Patient/STAT tests can be stored in the Analyzer. When the Memory button is pressed in the General Settings menu (see FIGURE 4-46), the options for when the patient memory is full are displayed.
The options available are displayed as buttons (1). The option currently in use is indicated by the selected Radio button (2).
Lockout : The Analyzer is locked out when the patient memory is full. No patient tests can be performed until the stored results have been deleted from the Patient Memory function.
Overwrite : When the patient memory is full, the Analyzer stores the new patient test result by overwriting the oldest result.
a) To change the setting, press the button for the desired option (1).
b) Press the Confirm button (3). FIGURE 4-55 will be displayed.
1 Full Memory options2 Selected option3 Confirm button
(Continues)
LockoutLockout
OverwriteOverwrite
Patient Memory Full
2
3
1
111
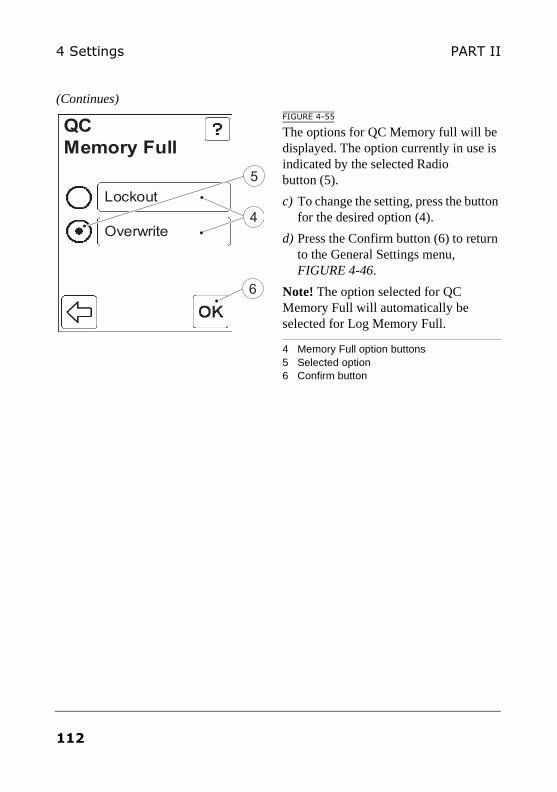
4 Settings PART II
(Continues)FIGURE 4-55
The options for QC Memory full will be displayed. The option currently in use is indicated by the selected Radio button (5).
c) To change the setting, press the button for the desired option (4).
d) Press the Confirm button (6) to return to the General Settings menu, FIGURE 4-46.
Note! The option selected for QC Memory Full will automatically be selected for Log Memory Full.
4 Memory Full option buttons5 Selected option6 Confirm button
LockoutLockout
OverwriteOverwrite
QC
Memory Full
5
4
6
112
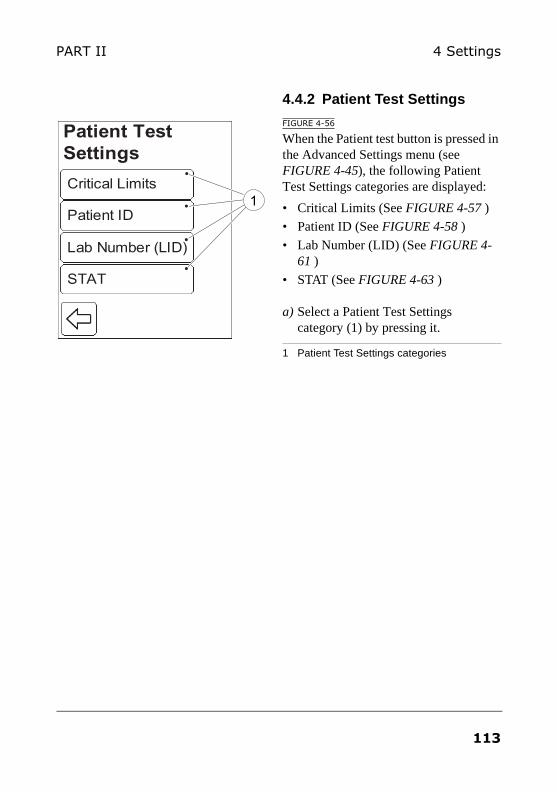
4 SettingsPART II
4.4.2 Patient Test Settings
FIGURE 4-56
When the Patient test button is pressed in the Advanced Settings menu (see FIGURE 4-45), the following Patient Test Settings categories are displayed:
• Critical Limits (See FIGURE 4-57 )
• Patient ID (See FIGURE 4-58 )
• Lab Number (LID) (See FIGURE 4-61 )
• STAT (See FIGURE 4-63 )
a) Select a Patient Test Settings category (1) by pressing it.
1 Patient Test Settings categories
Critical LimitsCritical Limits
Patient IDPatient ID
Lab Number (LID)
STATSTAT
Patient TestSettings
1
113
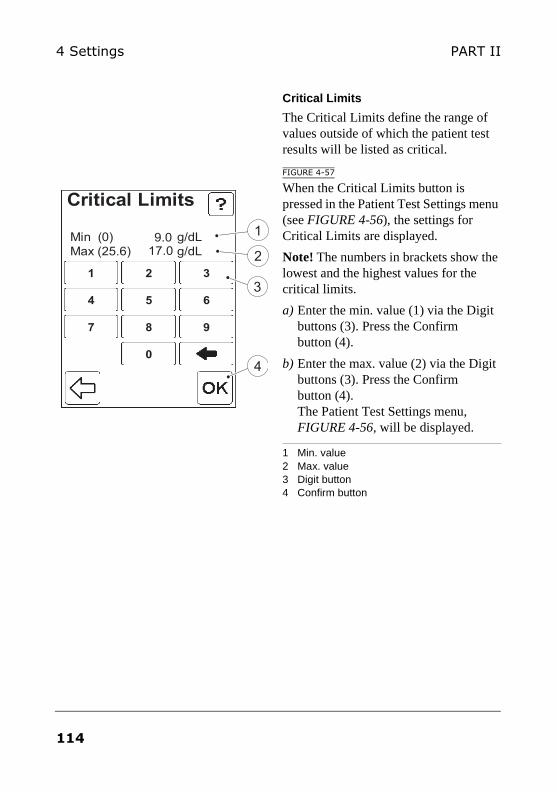
4 Settings PART II
Critical Limits
The Critical Limits define the range of values outside of which the patient test results will be listed as critical.
FIGURE 4-57
When the Critical Limits button is pressed in the Patient Test Settings menu (see FIGURE 4-56), the settings for Critical Limits are displayed.
Note! The numbers in brackets show the lowest and the highest values for the critical limits.
a) Enter the min. value (1) via the Digit buttons (3). Press the Confirm button (4).
b) Enter the max. value (2) via the Digit buttons (3). Press the Confirm button (4). The Patient Test Settings menu, FIGURE 4-56, will be displayed.
1 Min. value2 Max. value3 Digit button4 Confirm button
Min (0) 9.0 g/dL
Max (25.6) 17.0 g/dL
Critical Limits
11
55
22
8877
44 66
99
33
00
2
1
4
3
114
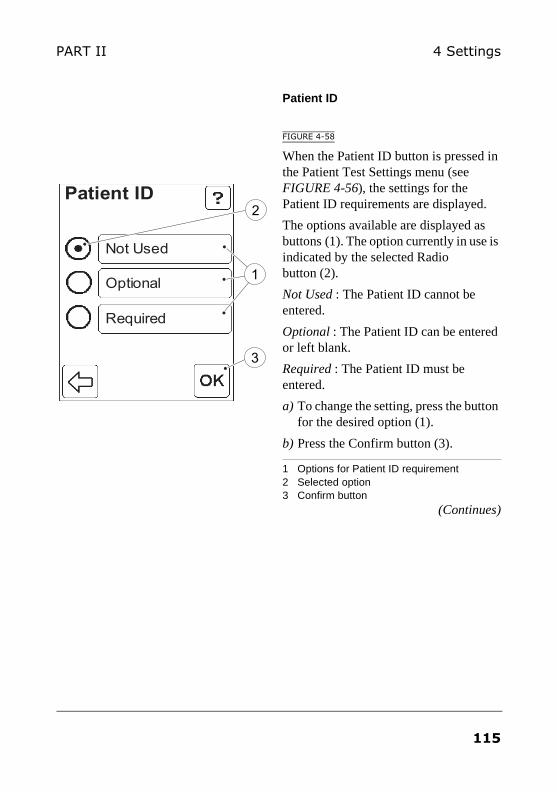
4 SettingsPART II
Patient ID
FIGURE 4-58
When the Patient ID button is pressed in the Patient Test Settings menu (see FIGURE 4-56), the settings for the Patient ID requirements are displayed.
The options available are displayed as buttons (1). The option currently in use is indicated by the selected Radio button (2).
Not Used : The Patient ID cannot be entered.
Optional : The Patient ID can be entered or left blank.
Required : The Patient ID must be entered.
a) To change the setting, press the button for the desired option (1).
b) Press the Confirm button (3).
1 Options for Patient ID requirement 2 Selected option3 Confirm button
(Continues)
Not UsedNot Used
OptionalOptional
Patient ID
RequiredRequired
3
1
2
115
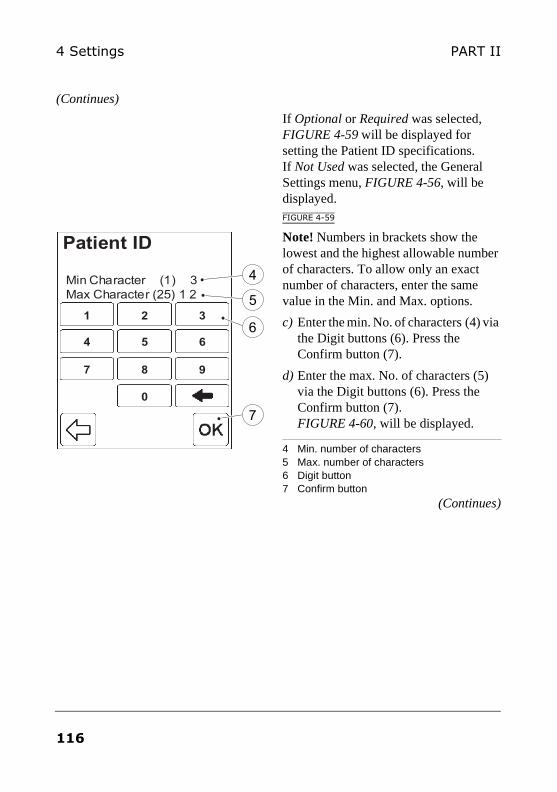
4 Settings PART II
(Continues)
If Optional or Required was selected, FIGURE 4-59 will be displayed for setting the Patient ID specifications. If Not Used was selected, the General Settings menu, FIGURE 4-56, will be displayed. FIGURE 4-59
Note! Numbers in brackets show the lowest and the highest allowable number of characters. To allow only an exact number of characters, enter the same value in the Min. and Max. options.
c) Enter the min. No. of characters (4) via the Digit buttons (6). Press the Confirm button (7).
d) Enter the max. No. of characters (5) via the Digit buttons (6). Press the Confirm button (7). FIGURE 4-60, will be displayed.
4 Min. number of characters5 Max. number of characters6 Digit button7 Confirm button
(Continues)
Min Character (1) 3Max Character (25) 1 2
Patient ID
1
5
2
87
4 6
9
3
0
11
55
22
8877
44 66
99
33
00
5
4
6
7
116
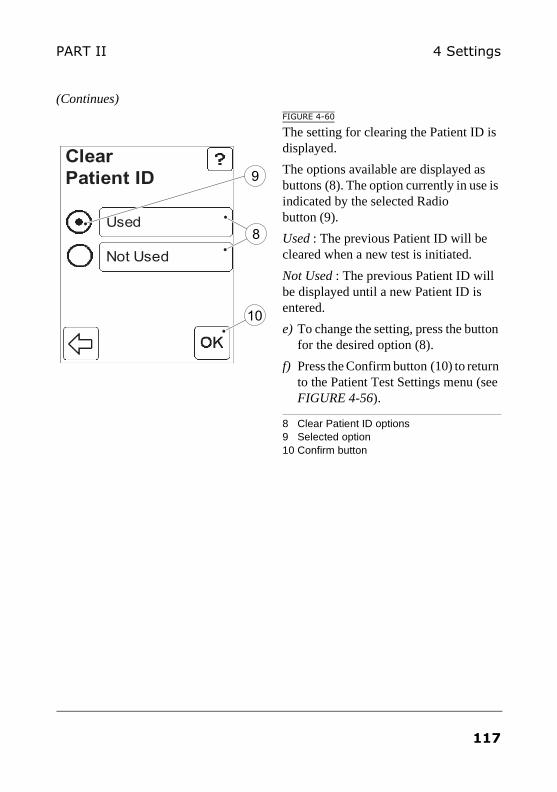
4 SettingsPART II
(Continues)FIGURE 4-60
The setting for clearing the Patient ID is displayed.
The options available are displayed as buttons (8). The option currently in use is indicated by the selected Radio button (9).
Used : The previous Patient ID will be cleared when a new test is initiated.
Not Used : The previous Patient ID will be displayed until a new Patient ID is entered.
e) To change the setting, press the button for the desired option (8).
f) Press the Confirm button (10) to return to the Patient Test Settings menu (see FIGURE 4-56).
8 Clear Patient ID options9 Selected option10 Confirm button
UsedUsed
Not UsedNot Used
Clear Patient ID
8
10
9
117
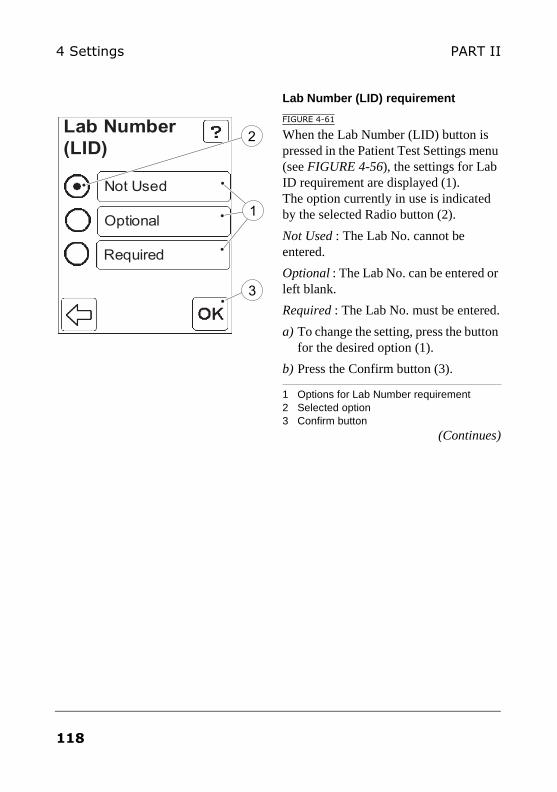
4 Settings PART II
Lab Number (LID) requirement
FIGURE 4-61
When the Lab Number (LID) button is pressed in the Patient Test Settings menu (see FIGURE 4-56), the settings for Lab ID requirement are displayed (1). The option currently in use is indicated by the selected Radio button (2).
Not Used : The Lab No. cannot be entered.
Optional : The Lab No. can be entered or left blank.
Required : The Lab No. must be entered.
a) To change the setting, press the button for the desired option (1).
b) Press the Confirm button (3).
1 Options for Lab Number requirement2 Selected option3 Confirm button
(Continues)
Not UsedNot Used
OptionalOptional
Lab Number(LID)
3
2
Required
1
118
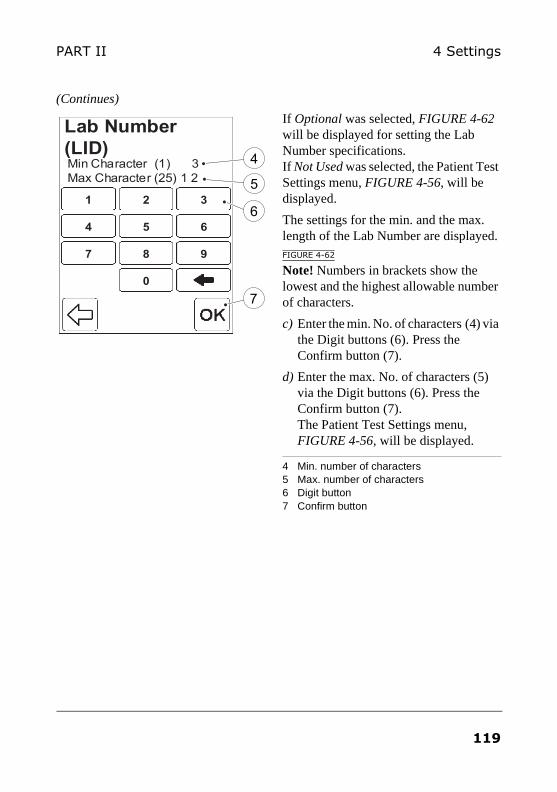
4 SettingsPART II
(Continues)
If Optional was selected, FIGURE 4-62 will be displayed for setting the Lab Number specifications. If Not Used was selected, the Patient Test Settings menu, FIGURE 4-56, will be displayed.
The settings for the min. and the max. length of the Lab Number are displayed.FIGURE 4-62
Note! Numbers in brackets show the lowest and the highest allowable number of characters.
c) Enter the min. No. of characters (4) via the Digit buttons (6). Press the Confirm button (7).
d) Enter the max. No. of characters (5) via the Digit buttons (6). Press the Confirm button (7). The Patient Test Settings menu, FIGURE 4-56, will be displayed.
4 Min. number of characters5 Max. number of characters6 Digit button7 Confirm button
Min Character (1) 3Max Character (25) 1 2
Lab Number(LID)
1
5
2
87
4 6
9
3
0
11
55
22
8877
44 66
99
33
00
5
4
6
7
119
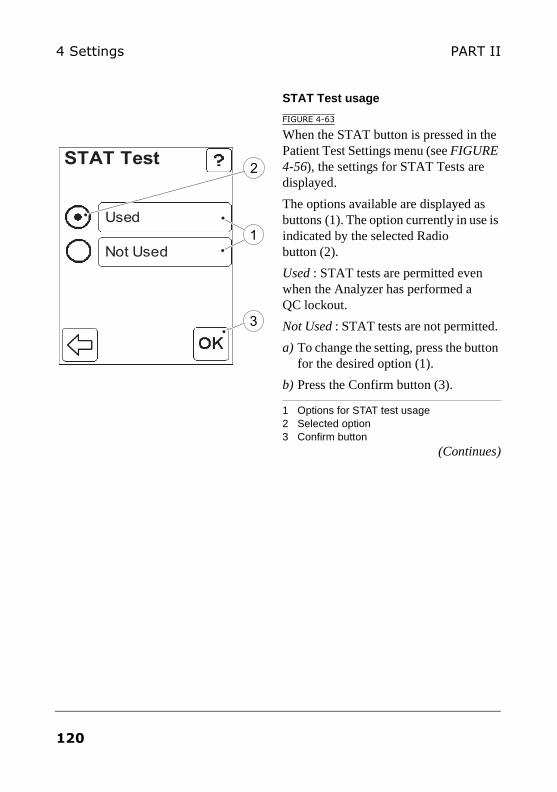
4 Settings PART II
STAT Test usage
FIGURE 4-63
When the STAT button is pressed in the Patient Test Settings menu (see FIGURE 4-56), the settings for STAT Tests are displayed.
The options available are displayed as buttons (1). The option currently in use is indicated by the selected Radio button (2).
Used : STAT tests are permitted even when the Analyzer has performed a QC lockout.
Not Used : STAT tests are not permitted.
a) To change the setting, press the button for the desired option (1).
b) Press the Confirm button (3).
1 Options for STAT test usage2 Selected option3 Confirm button
(Continues)
UsedUsed
Not UsedNot Used
STAT Test
3
1
2
120
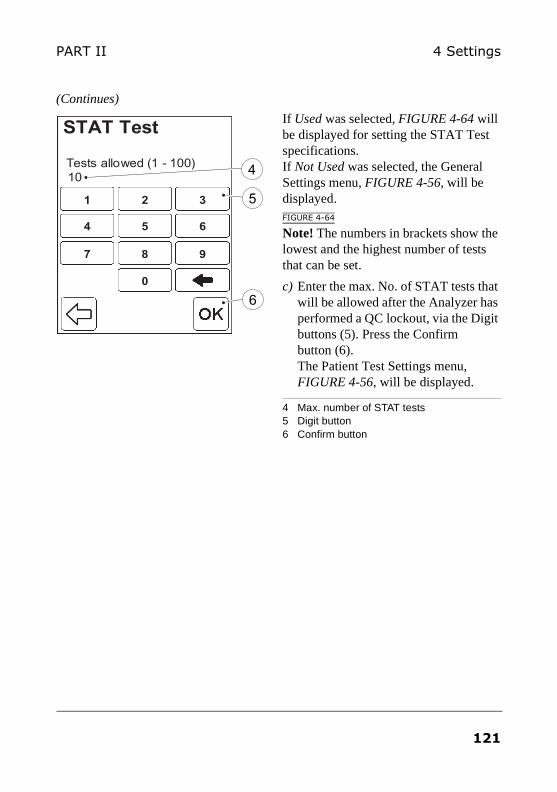
4 SettingsPART II
(Continues)
If Used was selected, FIGURE 4-64 will be displayed for setting the STAT Test specifications. If Not Used was selected, the General Settings menu, FIGURE 4-56, will be displayed.FIGURE 4-64
Note! The numbers in brackets show the lowest and the highest number of tests that can be set.
c) Enter the max. No. of STAT tests that will be allowed after the Analyzer has performed a QC lockout, via the Digit buttons (5). Press the Confirm button (6). The Patient Test Settings menu, FIGURE 4-56, will be displayed.
4 Max. number of STAT tests5 Digit button6 Confirm button
Tests allowed (1 - 100)10
STAT Test
1
5
2
87
4 6
9
3
0
11
55
22
8877
44 66
99
33
00
5
4
6
121
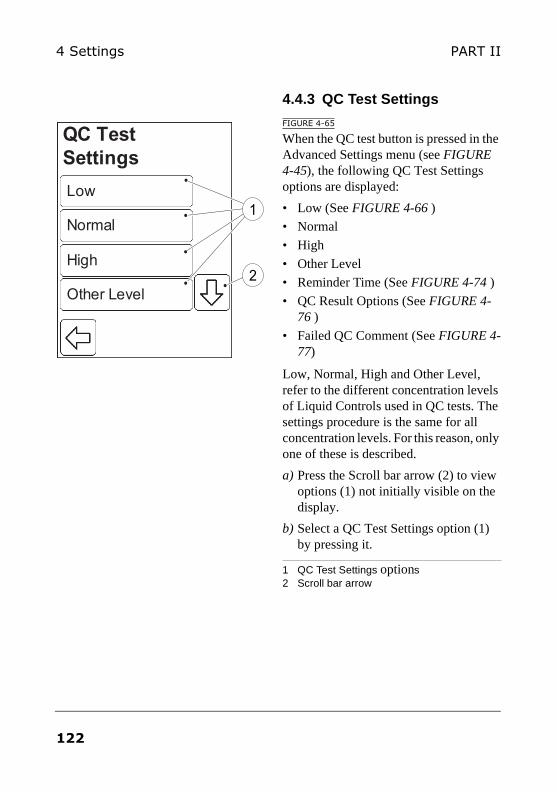
4 Settings PART II
4.4.3 QC Test Settings
FIGURE 4-65
When the QC test button is pressed in the Advanced Settings menu (see FIGURE 4-45), the following QC Test Settings options are displayed:
• Low (See FIGURE 4-66 )
• Normal
• High
• Other Level
• Reminder Time (See FIGURE 4-74 )
• QC Result Options (See FIGURE 4-76 )
• Failed QC Comment (See FIGURE 4-77)
Low, Normal, High and Other Level, refer to the different concentration levels of Liquid Controls used in QC tests. The settings procedure is the same for all concentration levels. For this reason, only one of these is described.
a) Press the Scroll bar arrow (2) to view options (1) not initially visible on the display.
b) Select a QC Test Settings option (1) by pressing it.
1 QC Test Settings options2 Scroll bar arrow
LowLow
NormalNormal
HighHigh
Other LevelOther Level
QC TestSettings
1
2
122
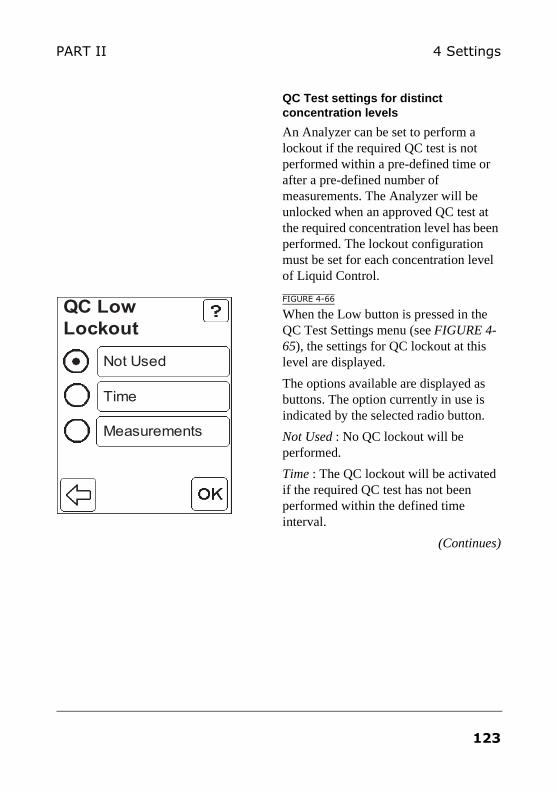
4 SettingsPART II
QC Test settings for distinct concentration levels
An Analyzer can be set to perform a lockout if the required QC test is not performed within a pre-defined time or after a pre-defined number of measurements. The Analyzer will be unlocked when an approved QC test at the required concentration level has been performed. The lockout configuration must be set for each concentration level of Liquid Control.
FIGURE 4-66
When the Low button is pressed in the QC Test Settings menu (see FIGURE 4-65), the settings for QC lockout at this level are displayed.
The options available are displayed as buttons. The option currently in use is indicated by the selected radio button.
Not Used : No QC lockout will be performed.
Time : The QC lockout will be activated if the required QC test has not been performed within the defined time interval.
(Continues)
Not UsedNot Used
TimeTime
MeasurementsMeasurements
QC LowLockout
123
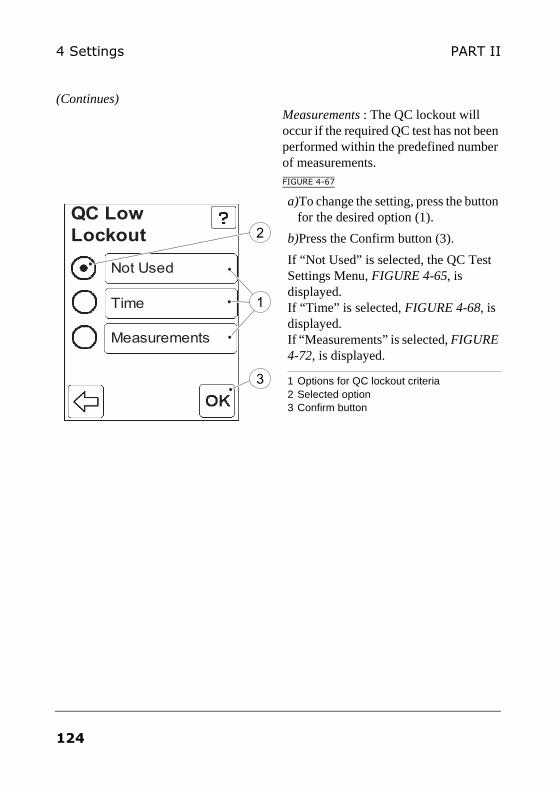
4 Settings PART II
(Continues)Measurements : The QC lockout will occur if the required QC test has not been performed within the predefined number of measurements.FIGURE 4-67
a)To change the setting, press the button for the desired option (1).
b)Press the Confirm button (3).
If “Not Used” is selected, the QC Test Settings Menu, FIGURE 4-65, is displayed. If “Time” is selected, FIGURE 4-68, is displayed. If “Measurements” is selected, FIGURE 4-72, is displayed.
1 Options for QC lockout criteria2 Selected option3 Confirm button
Not UsedNot Used
TimeTime
MeasurementsMeasurements
QC LowLockout
3
1
2
124
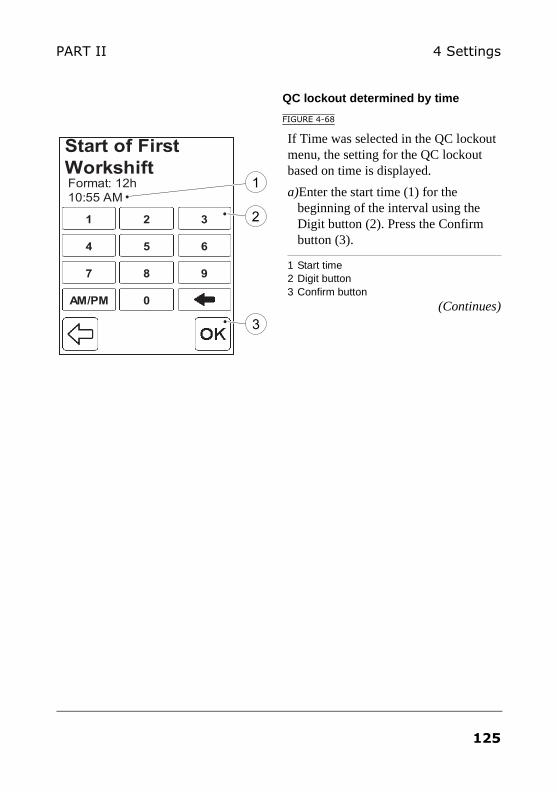
4 SettingsPART II
QC lockout determined by time
FIGURE 4-68
If Time was selected in the QC lockout menu, the setting for the QC lockout based on time is displayed.
a)Enter the start time (1) for the beginning of the interval using the Digit button (2). Press the Confirm button (3).
1 Start time2 Digit button3 Confirm button
(Continues)
Format: 12h10:55 AM
Start of FirstWorkshift
11
55
22
8877
44 66
99
33
00AM/PMAM/PM
1
2
3
125
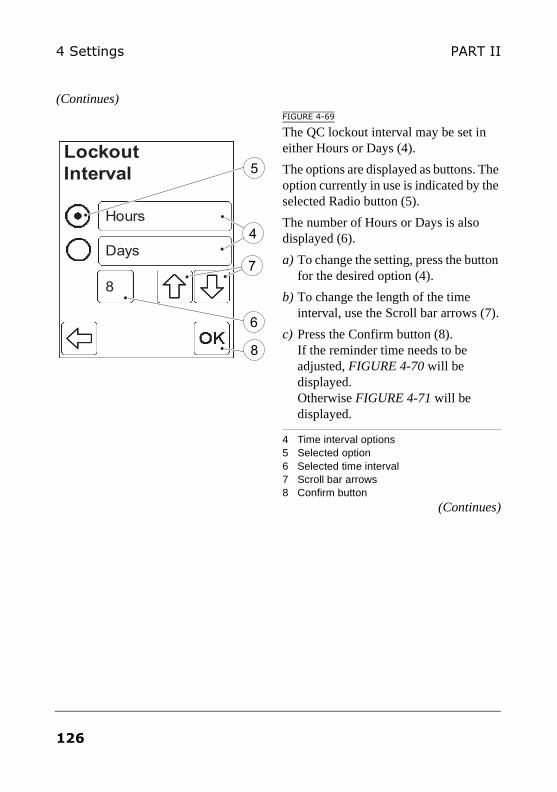
4 Settings PART II
(Continues)FIGURE 4-69
The QC lockout interval may be set in either Hours or Days (4).
The options are displayed as buttons. The option currently in use is indicated by the selected Radio button (5).
The number of Hours or Days is also displayed (6).
a) To change the setting, press the button for the desired option (4).
b) To change the length of the time interval, use the Scroll bar arrows (7).
c) Press the Confirm button (8). If the reminder time needs to be adjusted, FIGURE 4-70 will be displayed. Otherwise FIGURE 4-71 will be displayed.
4 Time interval options5 Selected option6 Selected time interval7 Scroll bar arrows8 Confirm button
(Continues)
HoursHours
DaysDays
LockoutInterval
888
6
4
7
5
8
126
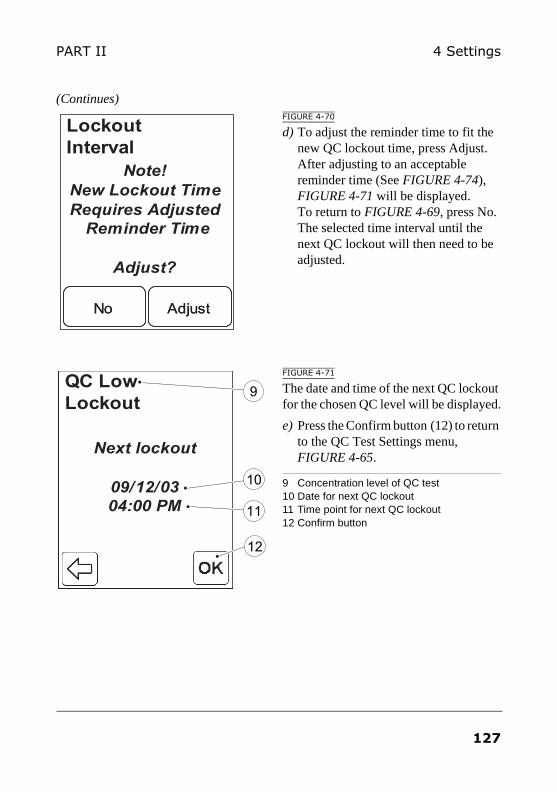
4 SettingsPART II
(Continues)FIGURE 4-70
d) To adjust the reminder time to fit the new QC lockout time, press Adjust. After adjusting to an acceptable reminder time (See FIGURE 4-74), FIGURE 4-71 will be displayed. To return to FIGURE 4-69, press No. The selected time interval until the next QC lockout will then need to be adjusted.
FIGURE 4-71
The date and time of the next QC lockout for the chosen QC level will be displayed.
e) Press the Confirm button (12) to return to the QC Test Settings menu, FIGURE 4-65.
9 Concentration level of QC test10 Date for next QC lockout 11 Time point for next QC lockout 12 Confirm button
LockoutInterval
NoNo AdjustAdjust
Note! New Lockout Time Requires Adjusted
Reminder Time
Adjust?
QC LowLockout
Next lockout
09/12/03 04:00 PM
10
11
9
12
127
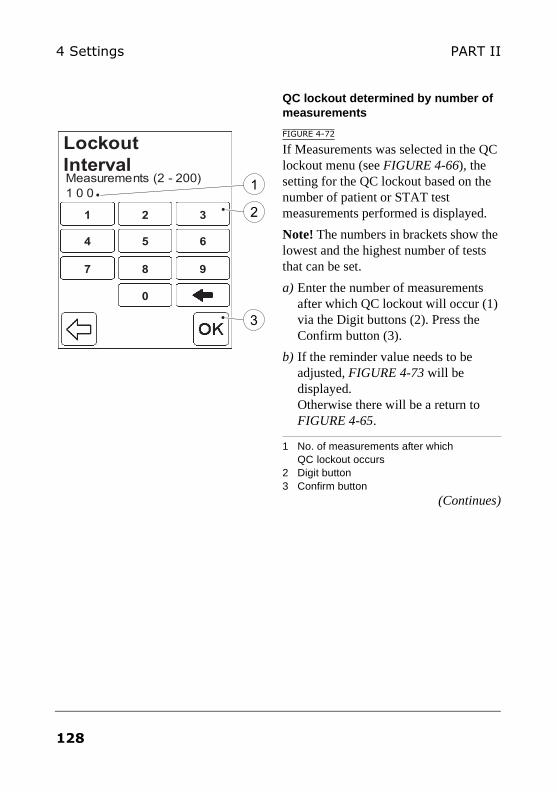
4 Settings PART II
QC lockout determined by number of measurements
FIGURE 4-72
If Measurements was selected in the QC lockout menu (see FIGURE 4-66), the setting for the QC lockout based on the number of patient or STAT test measurements performed is displayed.
Note! The numbers in brackets show the lowest and the highest number of tests that can be set.
a) Enter the number of measurements after which QC lockout will occur (1) via the Digit buttons (2). Press the Confirm button (3).
b) If the reminder value needs to be adjusted, FIGURE 4-73 will be displayed. Otherwise there will be a return to FIGURE 4-65.
1 No. of measurements after which QC lockout occurs
2 Digit button3 Confirm button
(Continues)
Measurements (2 - 200) 1 0 0
LockoutInterval
1
5
2
87
4 6
9
3
0
11
55
22
8877
44 66
99
33
00
1
2
3
128
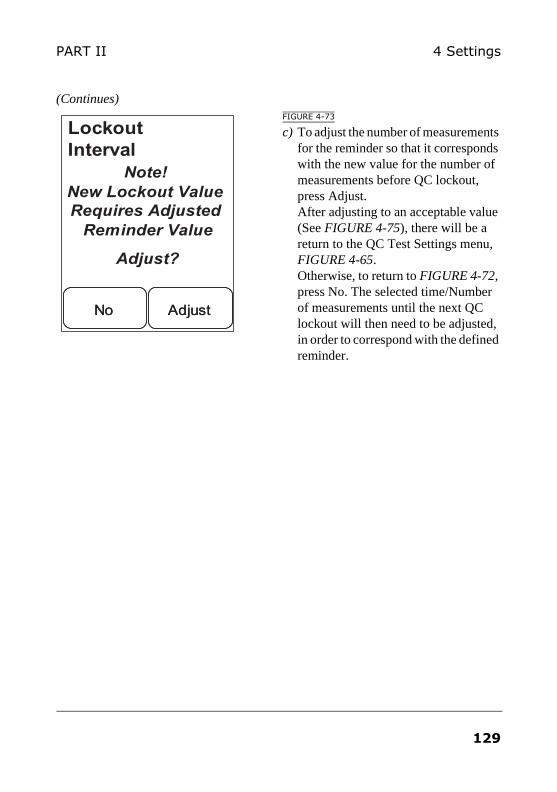
4 SettingsPART II
(Continues)FIGURE 4-73
c) To adjust the number of measurements for the reminder so that it corresponds with the new value for the number of measurements before QC lockout, press Adjust. After adjusting to an acceptable value (See FIGURE 4-75), there will be a return to the QC Test Settings menu, FIGURE 4-65. Otherwise, to return to FIGURE 4-72, press No. The selected time/Number of measurements until the next QC lockout will then need to be adjusted, in order to correspond with the defined reminder.
LockoutInterval
NoNo AdjustAdjust
Note! New Lockout Value Requires Adjusted
Reminder Value
Adjust?
129
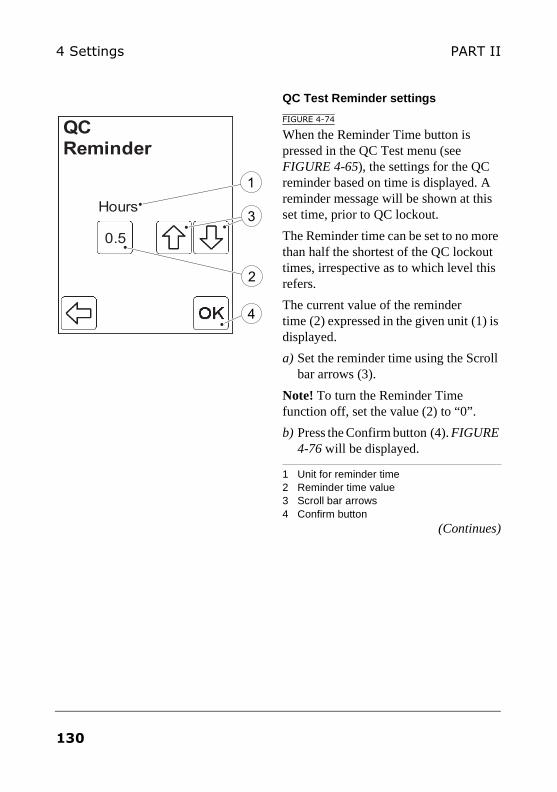
4 Settings PART II
QC Test Reminder settings
FIGURE 4-74
When the Reminder Time button is pressed in the QC Test menu (see FIGURE 4-65), the settings for the QC reminder based on time is displayed. A reminder message will be shown at this set time, prior to QC lockout.
The Reminder time can be set to no more than half the shortest of the QC lockout times, irrespective as to which level this refers.
The current value of the reminder time (2) expressed in the given unit (1) is displayed.
a) Set the reminder time using the Scroll bar arrows (3).
Note! To turn the Reminder Time function off, set the value (2) to “0”.
b) Press the Confirm button (4). FIGURE 4-76 will be displayed.
1 Unit for reminder time 2 Reminder time value3 Scroll bar arrows4 Confirm button
(Continues)
QCReminder
0.50.50.5
Hours
2
3
1
4
130
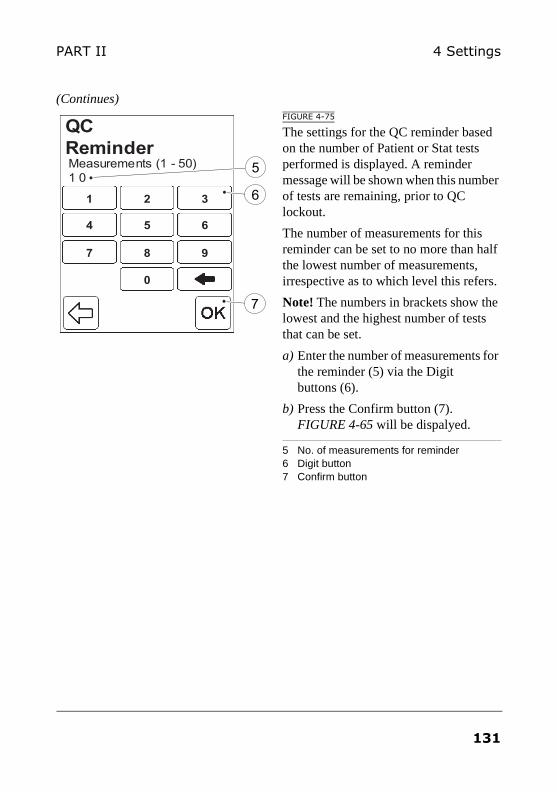
4 SettingsPART II
(Continues)FIGURE 4-75
The settings for the QC reminder based on the number of Patient or Stat tests performed is displayed. A reminder message will be shown when this number of tests are remaining, prior to QC lockout.
The number of measurements for this reminder can be set to no more than half the lowest number of measurements, irrespective as to which level this refers.
Note! The numbers in brackets show the lowest and the highest number of tests that can be set.
a) Enter the number of measurements for the reminder (5) via the Digit buttons (6).
b) Press the Confirm button (7). FIGURE 4-65 will be dispalyed.
5 No. of measurements for reminder6 Digit button7 Confirm button
Measurements (1 - X) 1 0
QCReminder
1
5
2
87
4 6
9
3
0
11
55
22
8877
44 66
99
33
00
Measurements (1 - 50) 1 0
QCReminder
1
5
2
87
4 6
9
3
0
11
55
22
8877
44 66
99
33
00
5
6
7
131
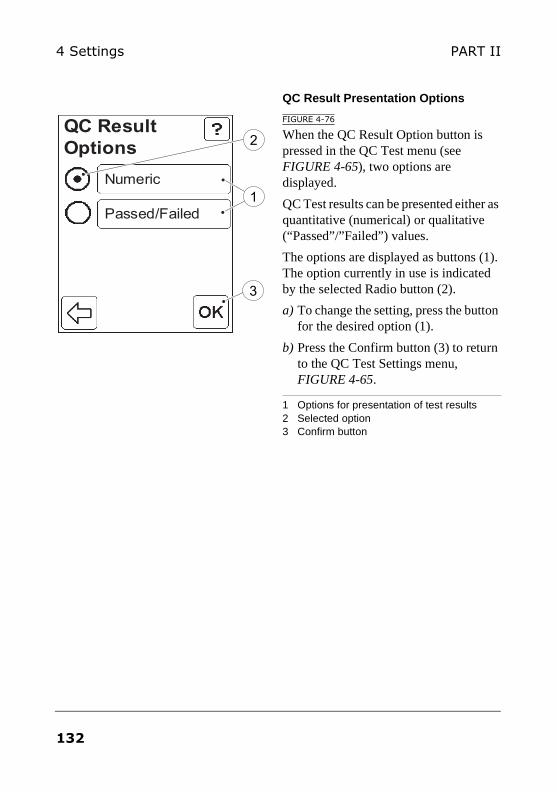
4 Settings PART II
QC Result Presentation Options
FIGURE 4-76
When the QC Result Option button is pressed in the QC Test menu (see FIGURE 4-65), two options are displayed.
QC Test results can be presented either as quantitative (numerical) or qualitative (“Passed”/”Failed”) values.
The options are displayed as buttons (1). The option currently in use is indicated by the selected Radio button (2).
a) To change the setting, press the button for the desired option (1).
b) Press the Confirm button (3) to return to the QC Test Settings menu, FIGURE 4-65.
1 Options for presentation of test results2 Selected option3 Confirm button
NumericNumeric
Passed/FailedPassed/Failed
QC Result Options
1
3
2
132
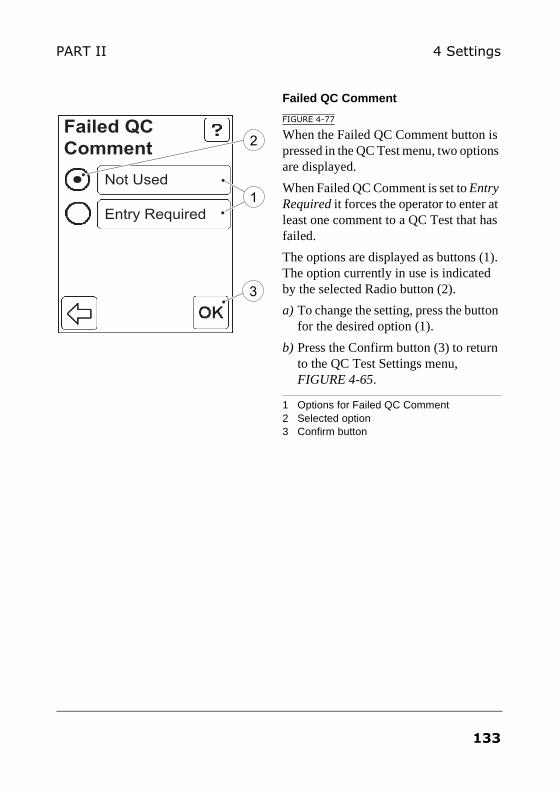
4 SettingsPART II
Failed QC Comment
FIGURE 4-77
When the Failed QC Comment button is pressed in the QC Test menu, two options are displayed.
When Failed QC Comment is set to Entry Required it forces the operator to enter at least one comment to a QC Test that has failed.
The options are displayed as buttons (1). The option currently in use is indicated by the selected Radio button (2).
a) To change the setting, press the button for the desired option (1).
b) Press the Confirm button (3) to return to the QC Test Settings menu, FIGURE 4-65.
1 Options for Failed QC Comment2 Selected option3 Confirm button
NumericNot Used
Passed/FailedEntry Required
Failed QC Comment
1
3
2
133
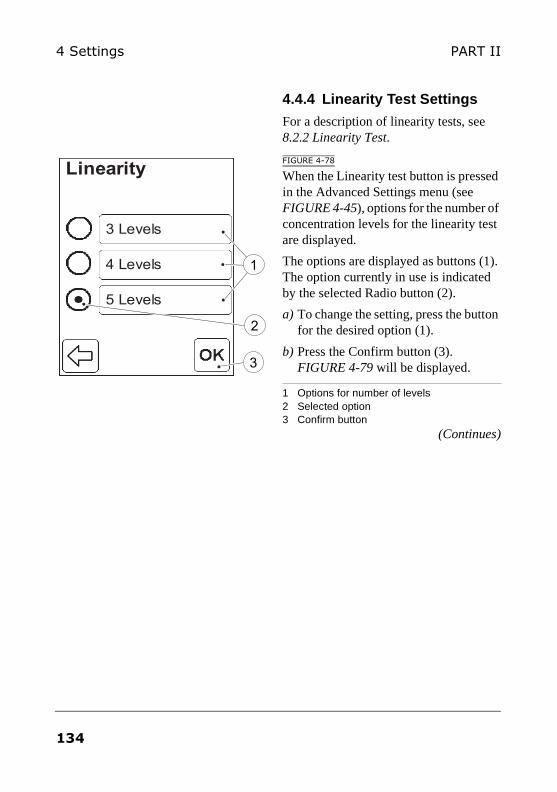
4 Settings PART II
4.4.4 Linearity Test Settings
For a description of linearity tests, see 8.2.2 Linearity Test.
FIGURE 4-78
When the Linearity test button is pressed in the Advanced Settings menu (see FIGURE 4-45), options for the number of concentration levels for the linearity test are displayed.
The options are displayed as buttons (1). The option currently in use is indicated by the selected Radio button (2).
a) To change the setting, press the button for the desired option (1).
b) Press the Confirm button (3). FIGURE 4-79 will be displayed.
1 Options for number of levels 2 Selected option3 Confirm button
(Continues)
3 Levels3 Levels
4 Levels4 Levels
Linearity
5 Levels5 Levels
3
1
2
134
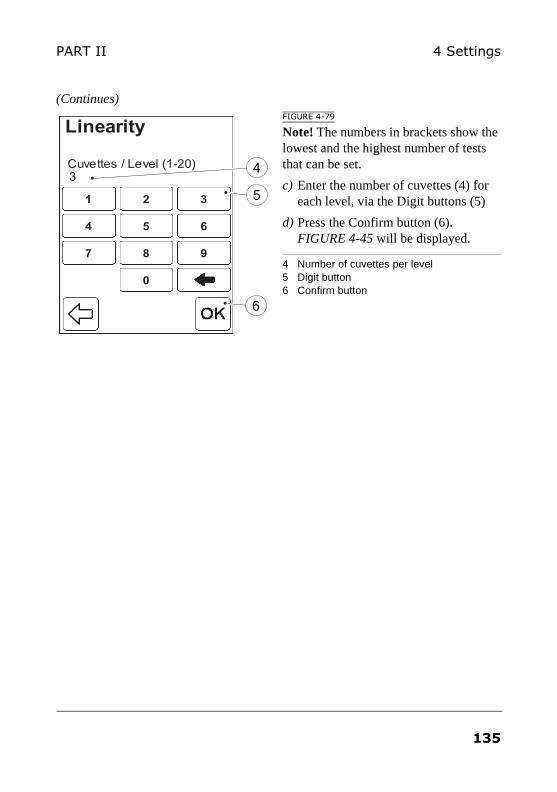
4 SettingsPART II
(Continues)FIGURE 4-79
Note! The numbers in brackets show the lowest and the highest number of tests that can be set.
c) Enter the number of cuvettes (4) for each level, via the Digit buttons (5)
d) Press the Confirm button (6). FIGURE 4-45 will be displayed.
4 Number of cuvettes per level5 Digit button6 Confirm button
Cuvettes / Level (1-20) 3
Linearity
1
5
2
87
4 6
9
3
0
11
55
22
8877
44 66
99
33
00
4
5
6
135
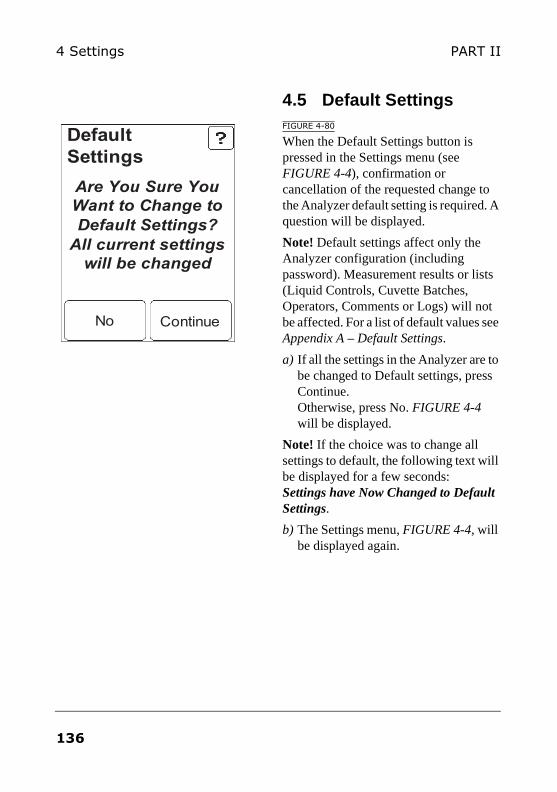
4 Settings PART II
4.5 Default SettingsFIGURE 4-80
When the Default Settings button is pressed in the Settings menu (see FIGURE 4-4), confirmation or cancellation of the requested change to the Analyzer default setting is required. A question will be displayed.
Note! Default settings affect only the Analyzer configuration (including password). Measurement results or lists (Liquid Controls, Cuvette Batches, Operators, Comments or Logs) will not be affected. For a list of default values see Appendix A – Default Settings.
a) If all the settings in the Analyzer are to be changed to Default settings, press Continue. Otherwise, press No. FIGURE 4-4 will be displayed.
Note! If the choice was to change all settings to default, the following text will be displayed for a few seconds: Settings have Now Changed to Default Settings.
b) The Settings menu, FIGURE 4-4, will be displayed again.
DefaultSettings
NoNo ContinueContinue
Are You Sure You Want to Change to Default Settings?
All current settings will be changed
136
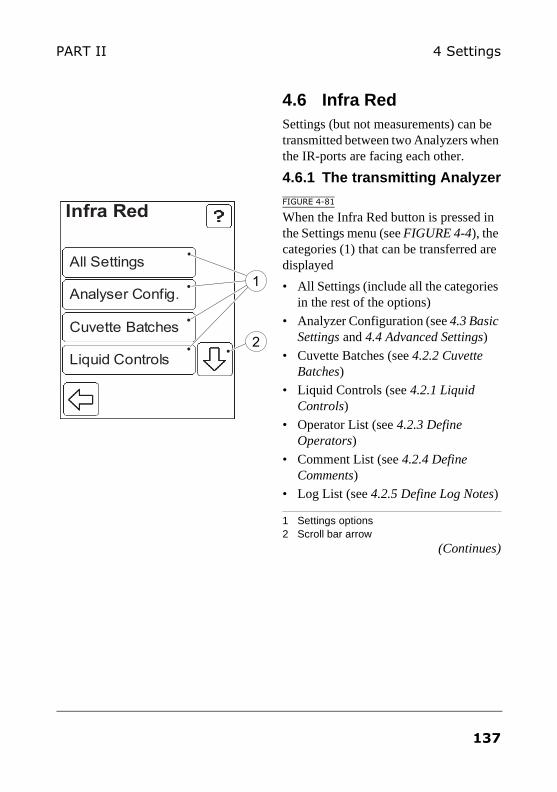
4 SettingsPART II
4.6 Infra RedSettings (but not measurements) can be transmitted between two Analyzers when the IR-ports are facing each other.
4.6.1 The transmitting Analyzer
FIGURE 4-81
When the Infra Red button is pressed in the Settings menu (see FIGURE 4-4), the categories (1) that can be transferred are displayed
• All Settings (include all the categories in the rest of the options)
• Analyzer Configuration (see 4.3 Basic Settings and 4.4 Advanced Settings)
• Cuvette Batches (see 4.2.2 Cuvette Batches)
• Liquid Controls (see 4.2.1 Liquid Controls)
• Operator List (see 4.2.3 Define Operators)
• Comment List (see 4.2.4 Define Comments)
• Log List (see 4.2.5 Define Log Notes)
1 Settings options2 Scroll bar arrow
(Continues)
All SettingsAll Settings
Analyser Config.Analyser Config.
Cuvette batchesCuvette Batches
Liquid ControlsLiquid Controls
Infra Red
1
2
137
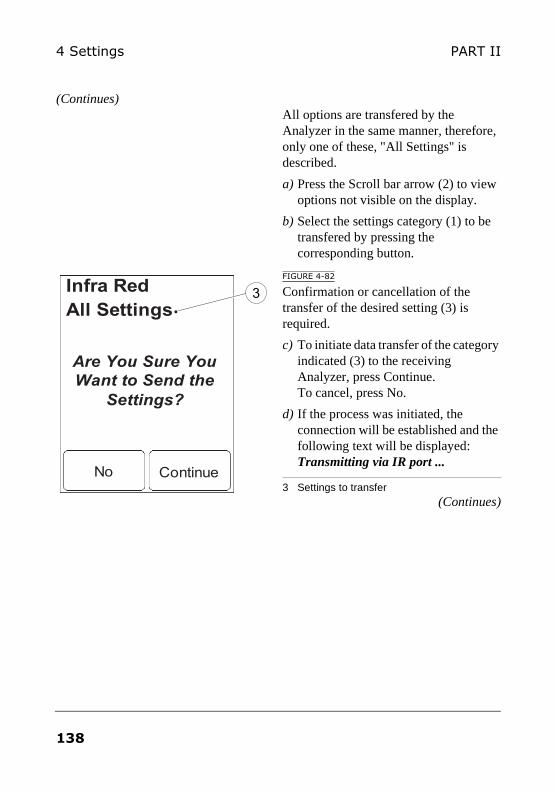
4 Settings PART II
(Continues)All options are transfered by the Analyzer in the same manner, therefore, only one of these, "All Settings" is described.
a) Press the Scroll bar arrow (2) to view options not visible on the display.
b) Select the settings category (1) to be transfered by pressing the corresponding button.
FIGURE 4-82
Confirmation or cancellation of the transfer of the desired setting (3) is required.
c) To initiate data transfer of the category indicated (3) to the receiving Analyzer, press Continue. To cancel, press No.
d) If the process was initiated, the connection will be established and the following text will be displayed: Transmitting via IR port ...
3 Settings to transfer(Continues)
Infra Red All Settings
NoNo ContinueContinue
Are You Sure You Want to Send the
Settings?
3
138
4 SettingsPART II
(Continues)e) If a connection was established
successfully and the transfer was accepted by the receiving Analyzer (see FIGURE 4-83), the same text will continue to be displayed during data transfer. When the transfer is completed, the following text will be displayed for a few seconds: Transmission OK and a beep will be heard if the audible signal is enabled. FIGURE 4-81 will be displayed.
f) If no connection was established or transfer was rejected by the receiving Analyzer, the following text will be displayed: No Connection With Compatible IR Device An error beep will be heard if the audible signal is enabled. See Troubleshooting on page 245. Press the Confirm button. FIGURE 4-81 will be displayed.
139
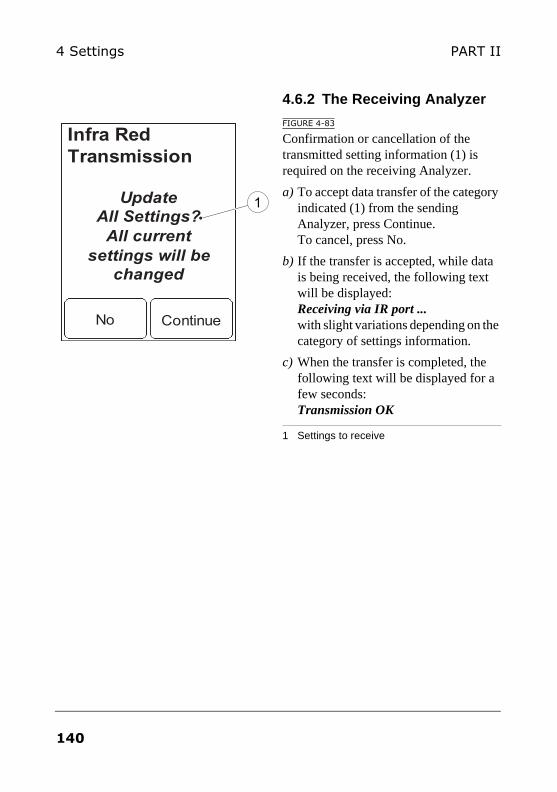
4 Settings PART II
4.6.2 The Receiving Analyzer
FIGURE 4-83
Confirmation or cancellation of the transmitted setting information (1) is required on the receiving Analyzer.
a) To accept data transfer of the category indicated (1) from the sending Analyzer, press Continue. To cancel, press No.
b) If the transfer is accepted, while data is being received, the following text will be displayed: Receiving via IR port ... with slight variations depending on the category of settings information.
c) When the transfer is completed, the following text will be displayed for a few seconds: Transmission OK
1 Settings to receive
Infra Red Transmission
NoNo ContinueContinue
UpdateAll Settings?
All current settings will be
changed
1
140
4 SettingsPART II
4.7 Docking Station Settings
The settings of a Docking Station consist of network parameters necessary to enable communication with a LAN, such as the IP address of the Docking Station. Settings can only be made on Primary Docking Stations, not on Secondary, see Primary and Secondary Docking Stations.
The setting of a Docking Station is made from the DMS Software application. In order to perform the settings, the Docking Station must be connected to the PC hosting the DMS Software, see section 10.2 Docking station setup.
141

4 Settings PART II
142
PART III Routine use
Please Filland
Insert a Cuvette
Patient Test
Hb 201 DM

PART III
This page intentionally left blank
144
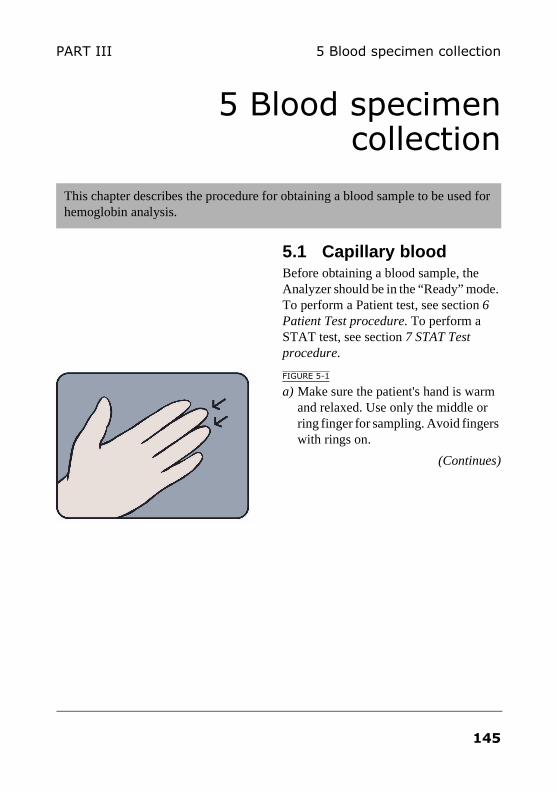
5 Blood specimen collectionPART III
5 Blood specimen collection
5.1 Capillary bloodBefore obtaining a blood sample, the Analyzer should be in the “Ready” mode. To perform a Patient test, see section 6 Patient Test procedure. To perform a STAT test, see section 7 STAT Test procedure.
FIGURE 5-1
a) Make sure the patient's hand is warm and relaxed. Use only the middle or ring finger for sampling. Avoid fingers with rings on.
(Continues)
This chapter describes the procedure for obtaining a blood sample to be used for hemoglobin analysis.
145
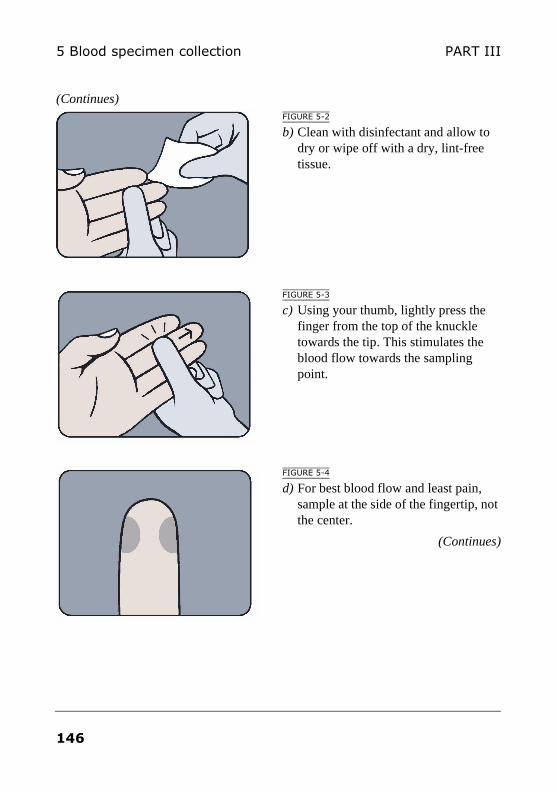
5 Blood specimen collection PART III
(Continues)FIGURE 5-2
b) Clean with disinfectant and allow to dry or wipe off with a dry, lint-free tissue.
FIGURE 5-3
c) Using your thumb, lightly press the finger from the top of the knuckle towards the tip. This stimulates the blood flow towards the sampling point.
FIGURE 5-4
d) For best blood flow and least pain, sample at the side of the fingertip, not the center.
(Continues)
146
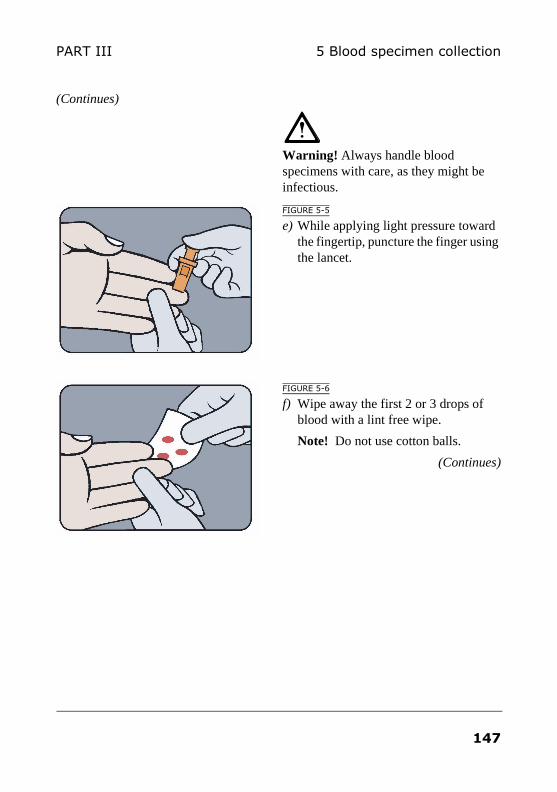
5 Blood specimen collectionPART III
(Continues)
Warning! Always handle blood specimens with care, as they might be infectious.
FIGURE 5-5
e) While applying light pressure toward the fingertip, puncture the finger using the lancet.
FIGURE 5-6
f) Wipe away the first 2 or 3 drops of blood with a lint free wipe.
Note! Do not use cotton balls.
(Continues)
147
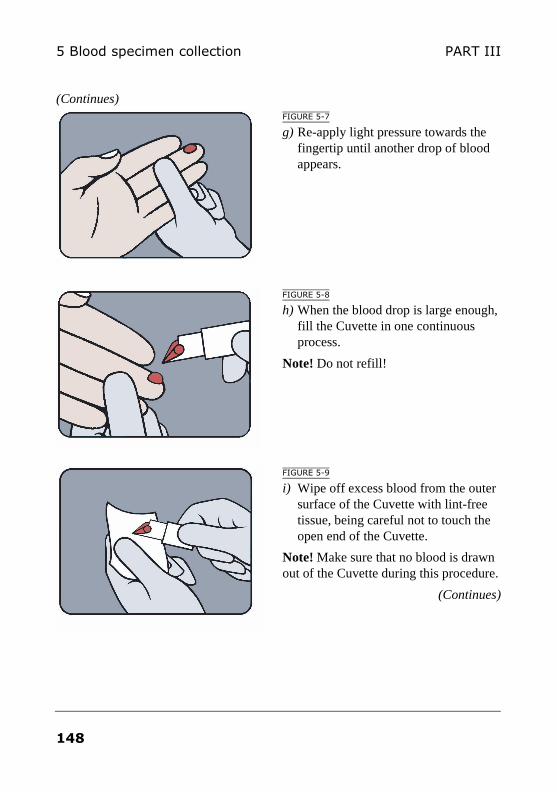
5 Blood specimen collection PART III
(Continues)FIGURE 5-7
g) Re-apply light pressure towards the fingertip until another drop of blood appears.
FIGURE 5-8
h) When the blood drop is large enough, fill the Cuvette in one continuous process.
Note! Do not refill!
FIGURE 5-9
i) Wipe off excess blood from the outer surface of the Cuvette with lint-free tissue, being careful not to touch the open end of the Cuvette.
Note! Make sure that no blood is drawn out of the Cuvette during this procedure.
(Continues)
148
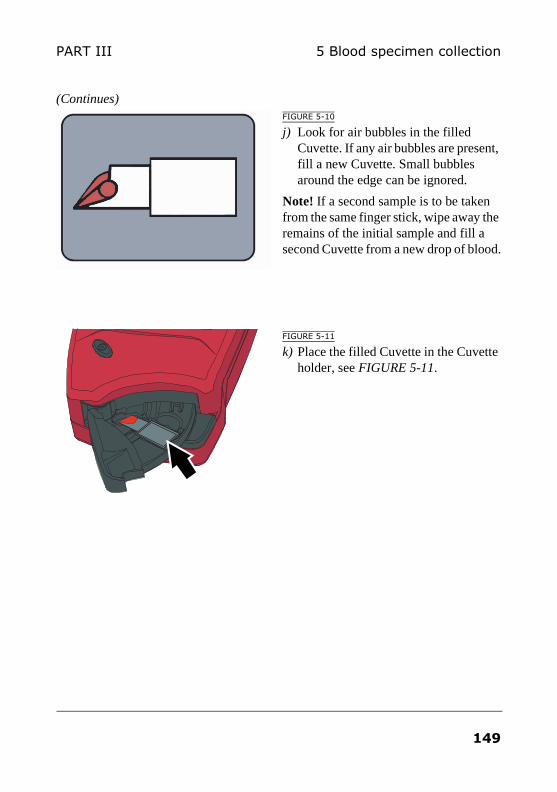
5 Blood specimen collectionPART III
(Continues)FIGURE 5-10
j) Look for air bubbles in the filled Cuvette. If any air bubbles are present, fill a new Cuvette. Small bubbles around the edge can be ignored.
Note! If a second sample is to be taken from the same finger stick, wipe away the remains of the initial sample and fill a second Cuvette from a new drop of blood.
FIGURE 5-11
k) Place the filled Cuvette in the Cuvette holder, see FIGURE 5-11.
149
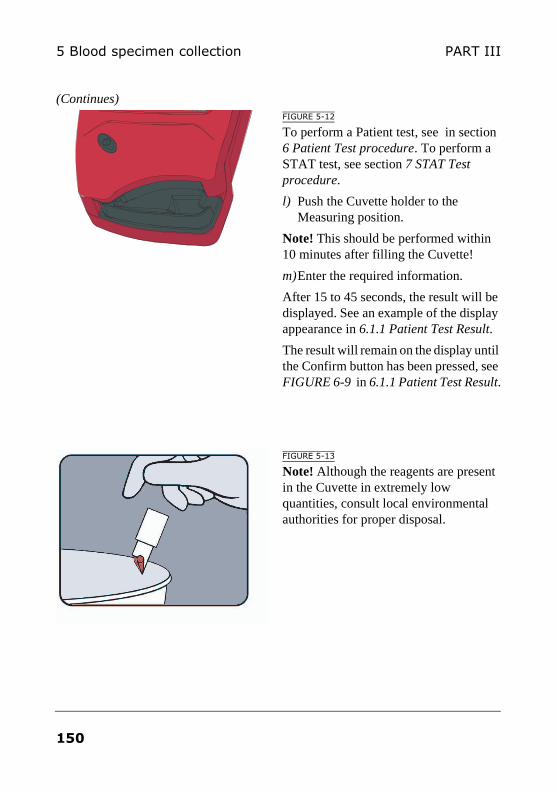
5 Blood specimen collection PART III
(Continues)FIGURE 5-12
To perform a Patient test, see in section 6 Patient Test procedure. To perform a STAT test, see section 7 STAT Test procedure.
l) Push the Cuvette holder to the Measuring position.
Note! This should be performed within 10 minutes after filling the Cuvette!
m)Enter the required information.
After 15 to 45 seconds, the result will be displayed. See an example of the display appearance in 6.1.1 Patient Test Result.
The result will remain on the display until the Confirm button has been pressed, see FIGURE 6-9 in 6.1.1 Patient Test Result.
FIGURE 5-13
Note! Although the reagents are present in the Cuvette in extremely low quantities, consult local environmental authorities for proper disposal.
150
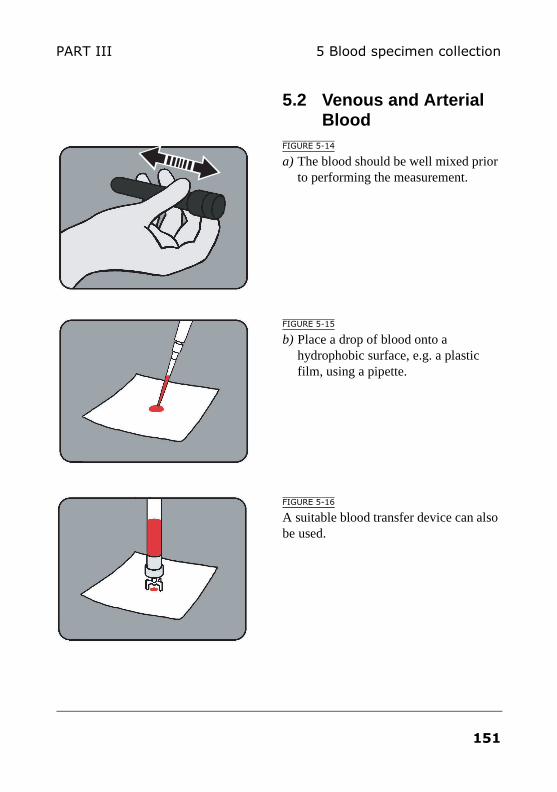
5 Blood specimen collectionPART III
5.2 Venous and Arterial Blood
FIGURE 5-14
a) The blood should be well mixed prior to performing the measurement.
FIGURE 5-15
b) Place a drop of blood onto a hydrophobic surface, e.g. a plastic film, using a pipette.
FIGURE 5-16
A suitable blood transfer device can also be used.
151
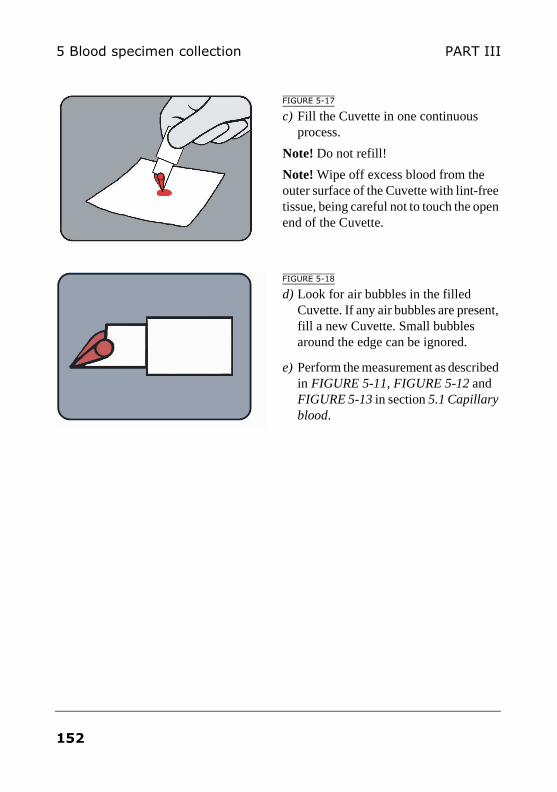
5 Blood specimen collection PART III
FIGURE 5-17
c) Fill the Cuvette in one continuous process.
Note! Do not refill!
Note! Wipe off excess blood from the outer surface of the Cuvette with lint-free tissue, being careful not to touch the open end of the Cuvette.
FIGURE 5-18
d) Look for air bubbles in the filled Cuvette. If any air bubbles are present, fill a new Cuvette. Small bubbles around the edge can be ignored.
e) Perform the measurement as described in FIGURE 5-11, FIGURE 5-12 and FIGURE 5-13 in section 5.1 Capillary blood.
152
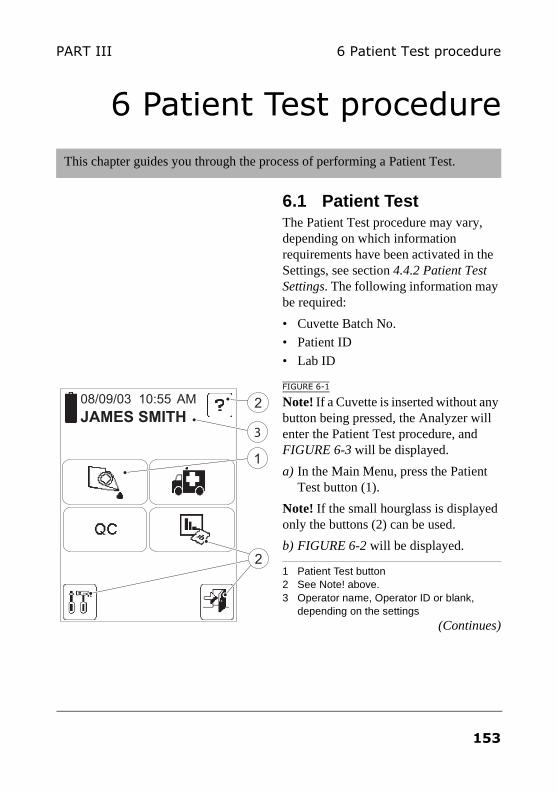
6 Patient Test procedurePART III
6 Patient Test procedure
6.1 Patient TestThe Patient Test procedure may vary, depending on which information requirements have been activated in the Settings, see section 4.4.2 Patient Test Settings. The following information may be required:
• Cuvette Batch No.
• Patient ID
• Lab ID
FIGURE 6-1
Note! If a Cuvette is inserted without any button being pressed, the Analyzer will enter the Patient Test procedure, and FIGURE 6-3 will be displayed.
a) In the Main Menu, press the Patient Test button (1).
Note! If the small hourglass is displayed only the buttons (2) can be used.
b) FIGURE 6-2 will be displayed.
1 Patient Test button2 See Note! above.3 Operator name, Operator ID or blank,
depending on the settings(Continues)
This chapter guides you through the process of performing a Patient Test.
08/09/03 10:55 AM
JAMES SMITH
1
2
2
3
153
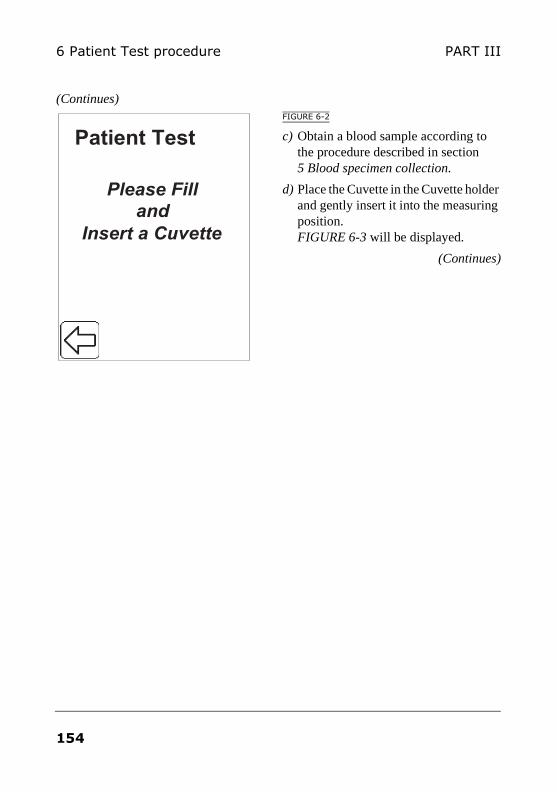
6 Patient Test procedure PART III
(Continues)FIGURE 6-2
c) Obtain a blood sample according to the procedure described in section 5 Blood specimen collection.
d) Place the Cuvette in the Cuvette holder and gently insert it into the measuring position. FIGURE 6-3 will be displayed.
(Continues)
Please Fill
and
Insert a Cuvette
Patient Test
154
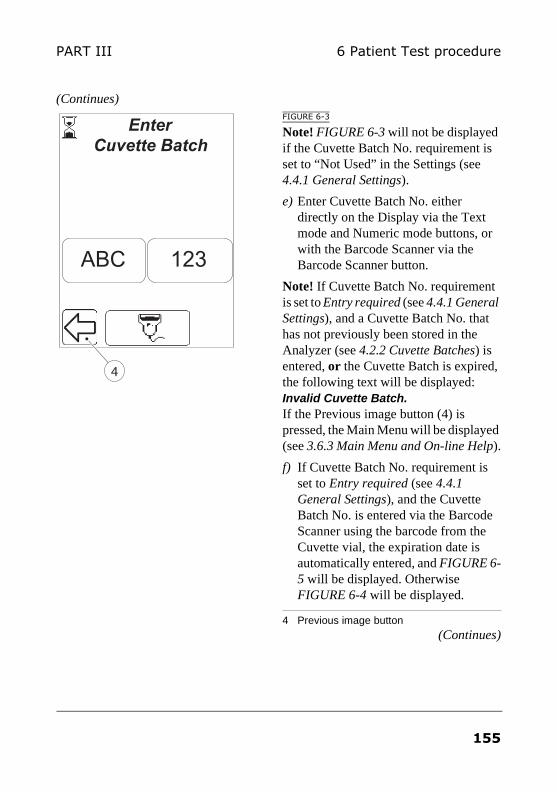
6 Patient Test procedurePART III
(Continues)FIGURE 6-3
Note! FIGURE 6-3 will not be displayed if the Cuvette Batch No. requirement is set to “Not Used” in the Settings (see 4.4.1 General Settings).
e) Enter Cuvette Batch No. either directly on the Display via the Text mode and Numeric mode buttons, or with the Barcode Scanner via the Barcode Scanner button.
Note! If Cuvette Batch No. requirement is set to Entry required (see 4.4.1 General Settings), and a Cuvette Batch No. that has not previously been stored in the Analyzer (see 4.2.2 Cuvette Batches) is entered, or the Cuvette Batch is expired, the following text will be displayed: Invalid Cuvette Batch. If the Previous image button (4) is pressed, the Main Menu will be displayed (see 3.6.3 Main Menu and On-line Help).
f) If Cuvette Batch No. requirement is set to Entry required (see 4.4.1 General Settings), and the Cuvette Batch No. is entered via the Barcode Scanner using the barcode from the Cuvette vial, the expiration date is automatically entered, and FIGURE 6-5 will be displayed. Otherwise FIGURE 6-4 will be displayed.
4 Previous image button(Continues)
Enter
Cuvette Batch
123ABC
4
155
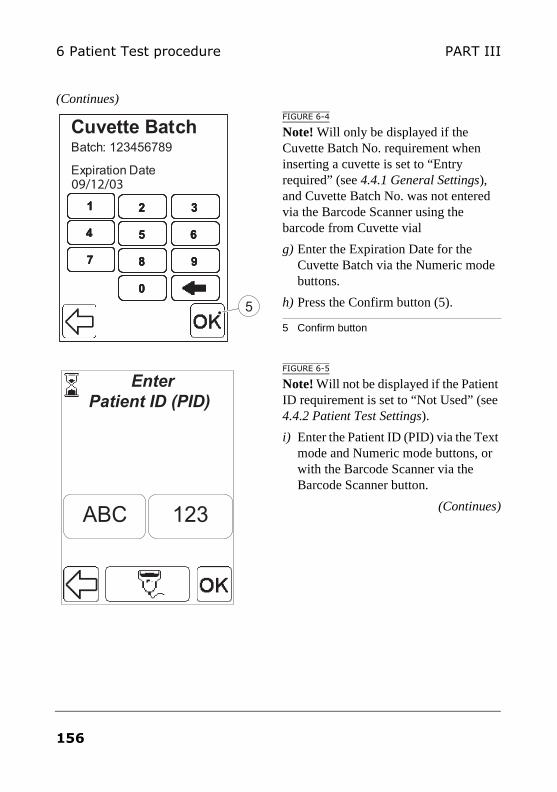
6 Patient Test procedure PART III
(Continues)FIGURE 6-4
Note! Will only be displayed if the Cuvette Batch No. requirement when inserting a cuvette is set to “Entry required” (see 4.4.1 General Settings), and Cuvette Batch No. was not entered via the Barcode Scanner using the barcode from Cuvette vial
g) Enter the Expiration Date for the Cuvette Batch via the Numeric mode buttons.
h) Press the Confirm button (5).
5 Confirm button
FIGURE 6-5
Note! Will not be displayed if the Patient ID requirement is set to “Not Used” (see 4.4.2 Patient Test Settings).
i) Enter the Patient ID (PID) via the Text mode and Numeric mode buttons, or with the Barcode Scanner via the Barcode Scanner button.
(Continues)
0
7 98
4 65
1 32
00
77 9988
44 6655
11 3322
Cuvette BatchBatch: 123456789
Expiration Date
5
09/12/03
Enter
Patient ID (PID)
123ABC
156
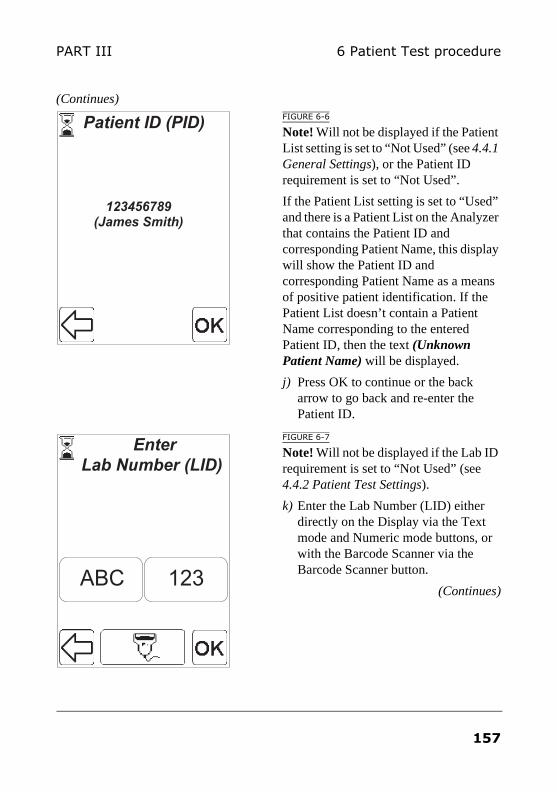
6 Patient Test procedurePART III
(Continues)FIGURE 6-6
Note! Will not be displayed if the Patient List setting is set to “Not Used” (see 4.4.1 General Settings), or the Patient ID requirement is set to “Not Used”.
If the Patient List setting is set to “Used” and there is a Patient List on the Analyzer that contains the Patient ID and corresponding Patient Name, this display will show the Patient ID and corresponding Patient Name as a means of positive patient identification. If the Patient List doesn’t contain a Patient Name corresponding to the entered Patient ID, then the text (Unknown Patient Name) will be displayed.
j) Press OK to continue or the back arrow to go back and re-enter the Patient ID.
FIGURE 6-7
Note! Will not be displayed if the Lab ID requirement is set to “Not Used” (see 4.4.2 Patient Test Settings).
k) Enter the Lab Number (LID) either directly on the Display via the Text mode and Numeric mode buttons, or with the Barcode Scanner via the Barcode Scanner button.
(Continues)
Patient ID (PID)
123456789(James Smith)
Enter
Lab Number (LID)
123ABC
157
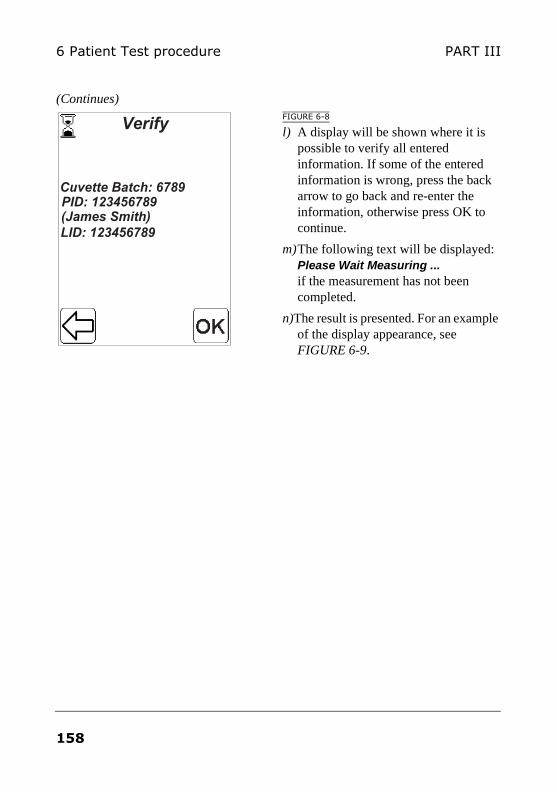
6 Patient Test procedure PART III
(Continues)FIGURE 6-8
l) A display will be shown where it is possible to verify all entered information. If some of the entered information is wrong, press the back arrow to go back and re-enter the information, otherwise press OK to continue.
m)The following text will be displayed: Please Wait Measuring ... if the measurement has not been completed.
n)The result is presented. For an example of the display appearance, see FIGURE 6-9.
Verify
PID: 123456789(James Smith)LID: 123456789
Cuvette Batch: 6789
158
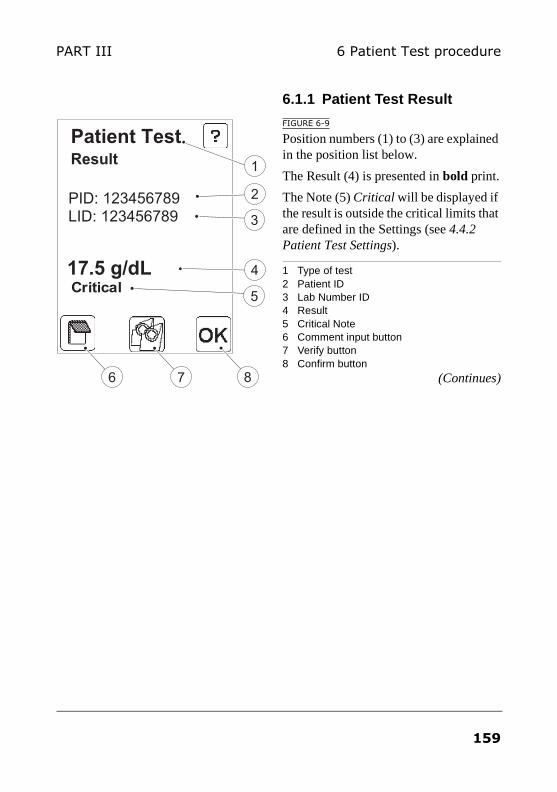
6 Patient Test procedurePART III
6.1.1 Patient Test Result
FIGURE 6-9
Position numbers (1) to (3) are explained in the position list below.
The Result (4) is presented in bold print.
The Note (5) Critical will be displayed if the result is outside the critical limits that are defined in the Settings (see 4.4.2 Patient Test Settings).
1 Type of test2 Patient ID3 Lab Number ID4 Result5 Critical Note6 Comment input button7 Verify button8 Confirm button
(Continues)
Patient Test
PID: 123456789LID: 123456789
17.5 g/dL
Result
87
2
4
Critical
6
1
5
3
159
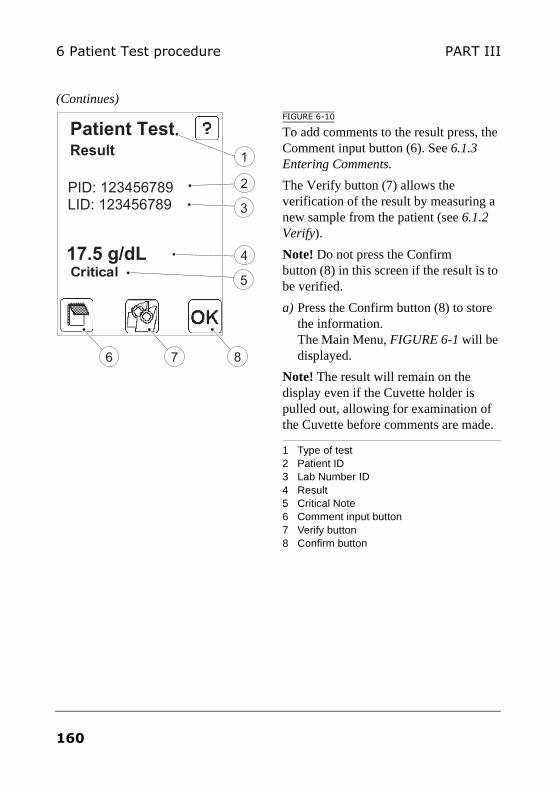
6 Patient Test procedure PART III
(Continues)FIGURE 6-10
To add comments to the result press, the Comment input button (6). See 6.1.3 Entering Comments.
The Verify button (7) allows the verification of the result by measuring a new sample from the patient (see 6.1.2 Verify).
Note! Do not press the Confirm button (8) in this screen if the result is to be verified.
a) Press the Confirm button (8) to store the information. The Main Menu, FIGURE 6-1 will be displayed.
Note! The result will remain on the display even if the Cuvette holder is pulled out, allowing for examination of the Cuvette before comments are made.
1 Type of test2 Patient ID3 Lab Number ID4 Result5 Critical Note6 Comment input button7 Verify button8 Confirm button
Patient Test
PID: 123456789LID: 123456789
17.5 g/dL
Result
87
2
4
Critical
6
1
5
3
160
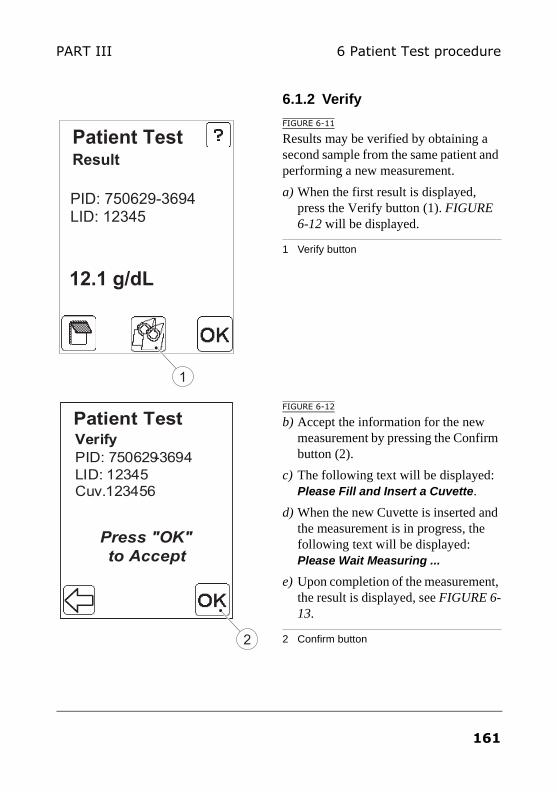
6 Patient Test procedurePART III
6.1.2 Verify
FIGURE 6-11
Results may be verified by obtaining a second sample from the same patient and performing a new measurement.
a) When the first result is displayed, press the Verify button (1). FIGURE 6-12 will be displayed.
1 Verify button
FIGURE 6-12
b) Accept the information for the new measurement by pressing the Confirm button (2).
c) The following text will be displayed: Please Fill and Insert a Cuvette.
d) When the new Cuvette is inserted and the measurement is in progress, the following text will be displayed: Please Wait Measuring ...
e) Upon completion of the measurement, the result is displayed, see FIGURE 6-13.
2 Confirm button
Patient Test
PID: 750629-3694LID: 12345
12.1 g/dL
Result
1
Patient Test
PID: 750629-3694
LID: 12345Cuv.123456
Verify
Press "OK"
to Accept
2
161
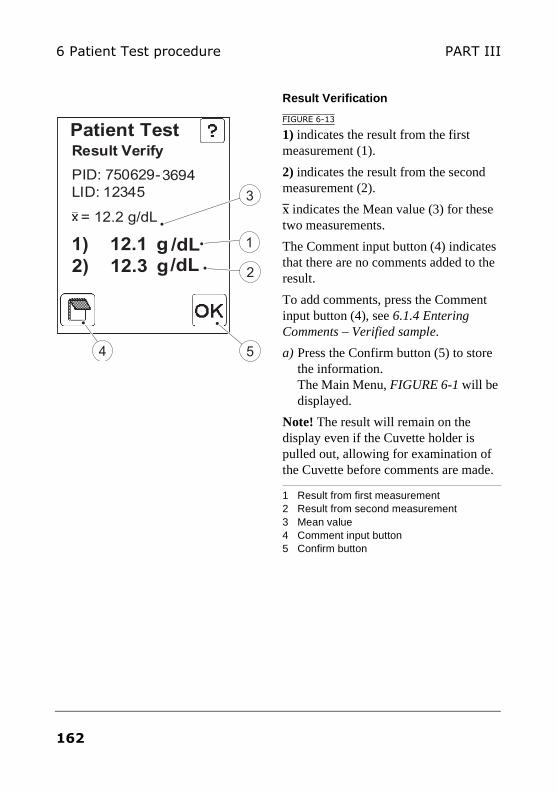
6 Patient Test procedure PART III
Result Verification
FIGURE 6-13
1) indicates the result from the first measurement (1).
2) indicates the result from the second measurement (2).
X indicates the Mean value (3) for these two measurements.
The Comment input button (4) indicates that there are no comments added to the result.
To add comments, press the Comment input button (4), see 6.1.4 Entering Comments – Verified sample.
a) Press the Confirm button (5) to store the information. The Main Menu, FIGURE 6-1 will be displayed.
Note! The result will remain on the display even if the Cuvette holder is pulled out, allowing for examination of the Cuvette before comments are made.
1 Result from first measurement2 Result from second measurement3 Mean value4 Comment input button5 Confirm button
Patient Test
PID: 750629 - 3694
LID: 12345
= 12.2 g/dL
1) 12.1 g /dL
2) 12.3 g/dL
Result Verify
5
1
3
2
4
162
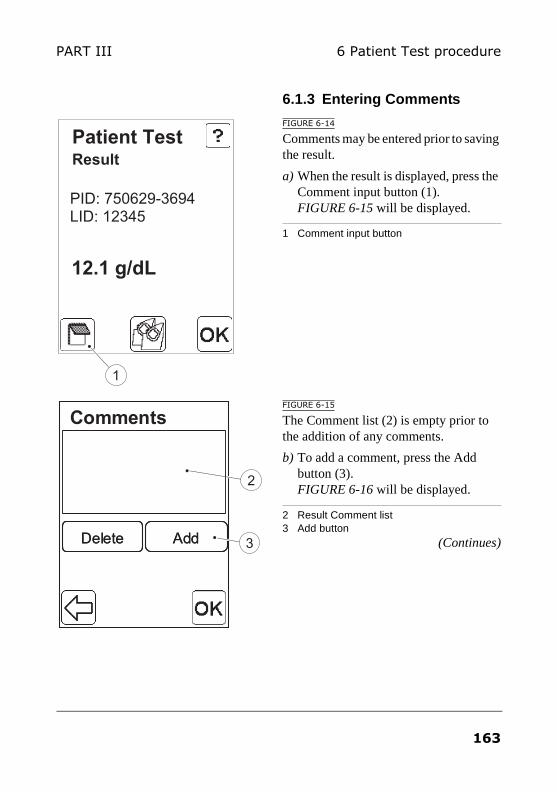
6 Patient Test procedurePART III
6.1.3 Entering Comments
FIGURE 6-14
Comments may be entered prior to saving the result.
a) When the result is displayed, press the Comment input button (1). FIGURE 6-15 will be displayed.
1 Comment input button
FIGURE 6-15
The Comment list (2) is empty prior to the addition of any comments.
b) To add a comment, press the Add button (3). FIGURE 6-16 will be displayed.
2 Result Comment list3 Add button
(Continues)
Patient Test
PID: 750629-3694LID: 12345
12.1 g/dL
Result
1
Comments
DeleteDelete AddAdd 3
2
163
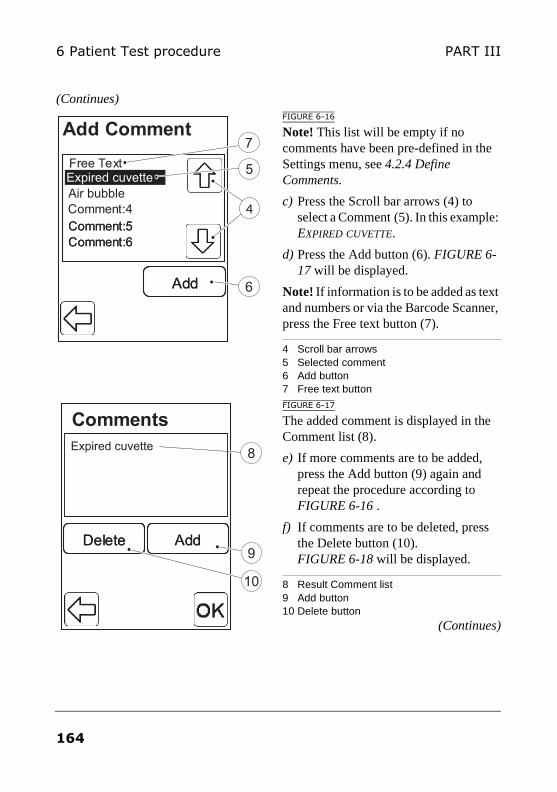
6 Patient Test procedure PART III
(Continues)FIGURE 6-16
Note! This list will be empty if no comments have been pre-defined in the Settings menu, see 4.2.4 Define Comments.
c) Press the Scroll bar arrows (4) to select a Comment (5). In this example: EXPIRED CUVETTE.
d) Press the Add button (6). FIGURE 6-17 will be displayed.
Note! If information is to be added as text and numbers or via the Barcode Scanner, press the Free text button (7).
4 Scroll bar arrows5 Selected comment6 Add button7 Free text button
FIGURE 6-17
The added comment is displayed in the Comment list (8).
e) If more comments are to be added, press the Add button (9) again and repeat the procedure according to FIGURE 6-16 .
f) If comments are to be deleted, press the Delete button (10). FIGURE 6-18 will be displayed.
8 Result Comment list9 Add button10 Delete button
(Continues)
Add Comment
AddAdd
Comment:5
Comment:6
Free Text
Air bubble
Comment:5
Comment:6
Free TextExpired cuvette
7
6
Comment:4 4
5
Comments
DeleteDelete AddAdd9
Expired cuvette8
10
164
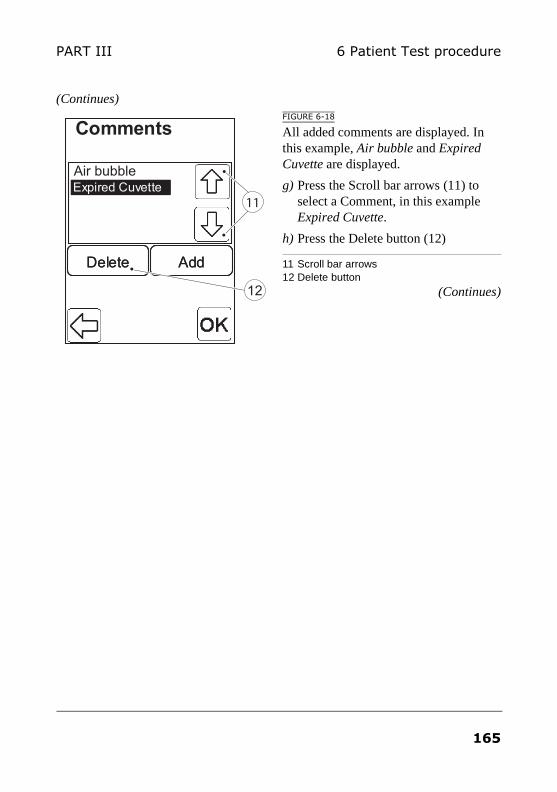
6 Patient Test procedurePART III
(Continues)FIGURE 6-18
All added comments are displayed. In this example, Air bubble and Expired Cuvette are displayed.
g) Press the Scroll bar arrows (11) to select a Comment, in this example Expired Cuvette.
h) Press the Delete button (12)
11 Scroll bar arrows12 Delete button
(Continues)
Comments
DeleteDelete AddAdd
Expired CuvetteExpired Cuvette
12
Air bubble
11
165
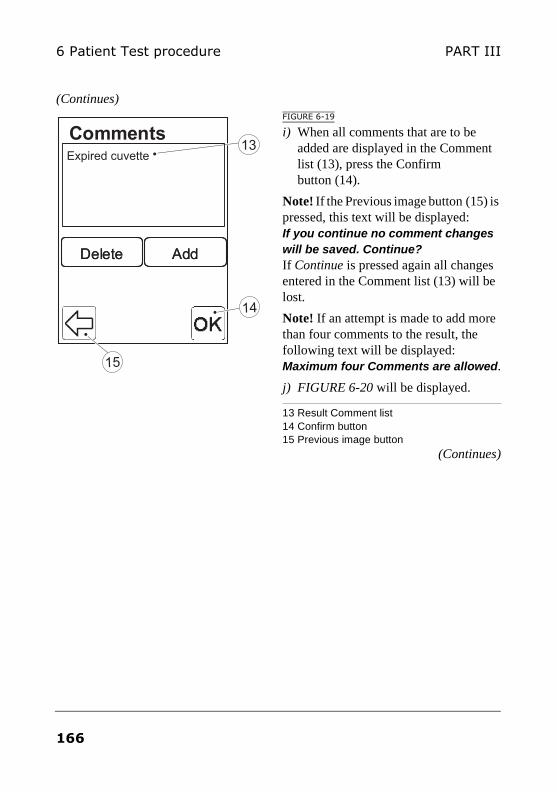
6 Patient Test procedure PART III
(Continues)FIGURE 6-19
i) When all comments that are to be added are displayed in the Comment list (13), press the Confirm button (14).
Note! If the Previous image button (15) is pressed, this text will be displayed: If you continue no comment changes will be saved. Continue? If Continue is pressed again all changes entered in the Comment list (13) will be lost.
Note! If an attempt is made to add more than four comments to the result, the following text will be displayed: Maximum four Comments are allowed.
j) FIGURE 6-20 will be displayed.
13 Result Comment list 14 Confirm button15 Previous image button
(Continues)
Comments
DeleteDelete AddAdd
14
Expired cuvette13
15
166
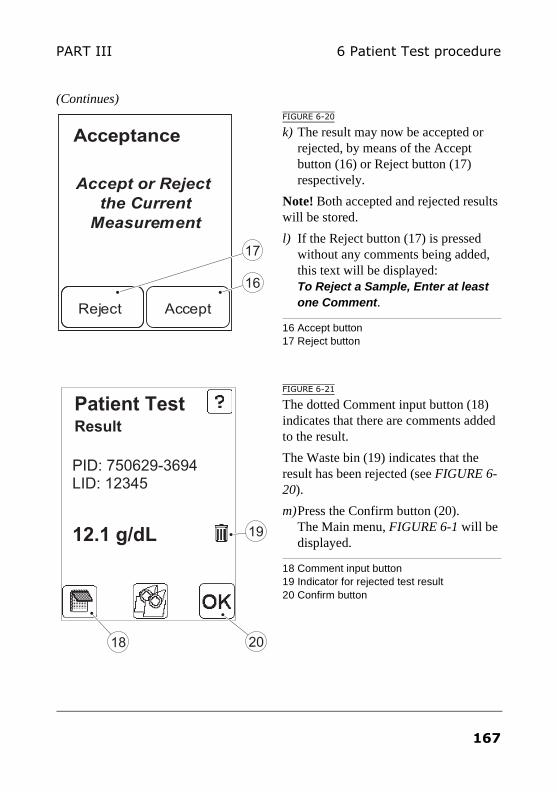
6 Patient Test procedurePART III
(Continues)FIGURE 6-20
k) The result may now be accepted or rejected, by means of the Accept button (16) or Reject button (17) respectively.
Note! Both accepted and rejected results will be stored.
l) If the Reject button (17) is pressed without any comments being added, this text will be displayed: To Reject a Sample, Enter at least one Comment.
16 Accept button17 Reject button
FIGURE 6-21
The dotted Comment input button (18) indicates that there are comments added to the result.
The Waste bin (19) indicates that the result has been rejected (see FIGURE 6-20).
m)Press the Confirm button (20). The Main menu, FIGURE 6-1 will be displayed.
18 Comment input button19 Indicator for rejected test result20 Confirm button
Acceptance
Reject Accept
Accept or Reject
the Current
Measurement
16
17
Patient Test
PID: 750629-3694LID: 12345
12.1 g/dL
Result
18 20
19
167
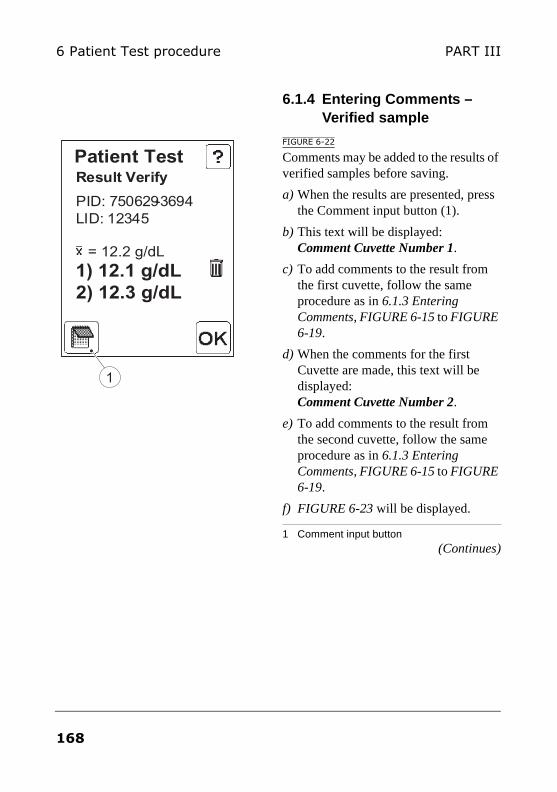
6 Patient Test procedure PART III
6.1.4 Entering Comments – Verified sample
FIGURE 6-22
Comments may be added to the results of verified samples before saving.
a) When the results are presented, press the Comment input button (1).
b) This text will be displayed: Comment Cuvette Number 1.
c) To add comments to the result from the first cuvette, follow the same procedure as in 6.1.3 Entering Comments, FIGURE 6-15 to FIGURE 6-19.
d) When the comments for the first Cuvette are made, this text will be displayed: Comment Cuvette Number 2.
e) To add comments to the result from the second cuvette, follow the same procedure as in 6.1.3 Entering Comments, FIGURE 6-15 to FIGURE 6-19.
f) FIGURE 6-23 will be displayed.
1 Comment input button(Continues)
Patient Test
PID: 750629-3694
LID: 12345
= 12.2 g/dL
1) 12.1 g/dL
2) 12.3 g/dL
Result Verify
1
168
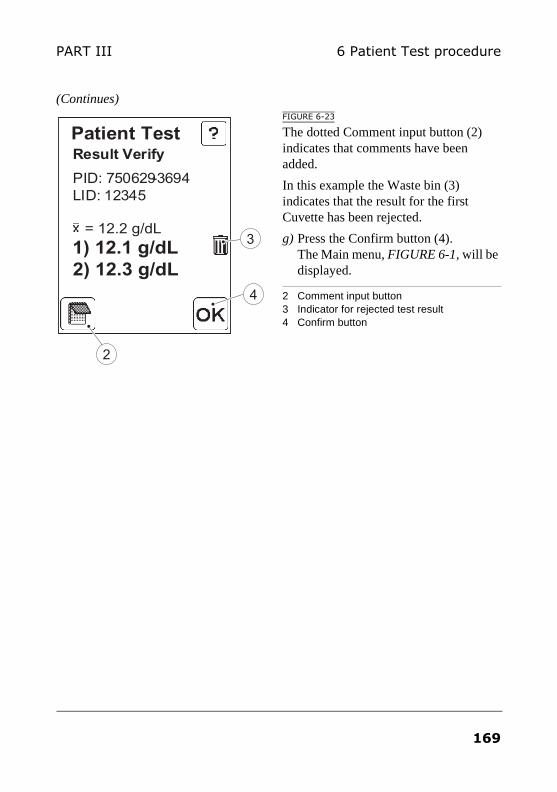
6 Patient Test procedurePART III
(Continues)FIGURE 6-23
The dotted Comment input button (2) indicates that comments have been added.
In this example the Waste bin (3) indicates that the result for the first Cuvette has been rejected.
g) Press the Confirm button (4). The Main menu, FIGURE 6-1, will be displayed.
2 Comment input button3 Indicator for rejected test result4 Confirm button
Patient Test
PID: 750629-3694
LID: 12345
= 12.2 g/dL
1) 12.1 g/dL
2) 12.3 g/dL
Result Verify
4
2
3
169
6 Patient Test procedure PART III
170
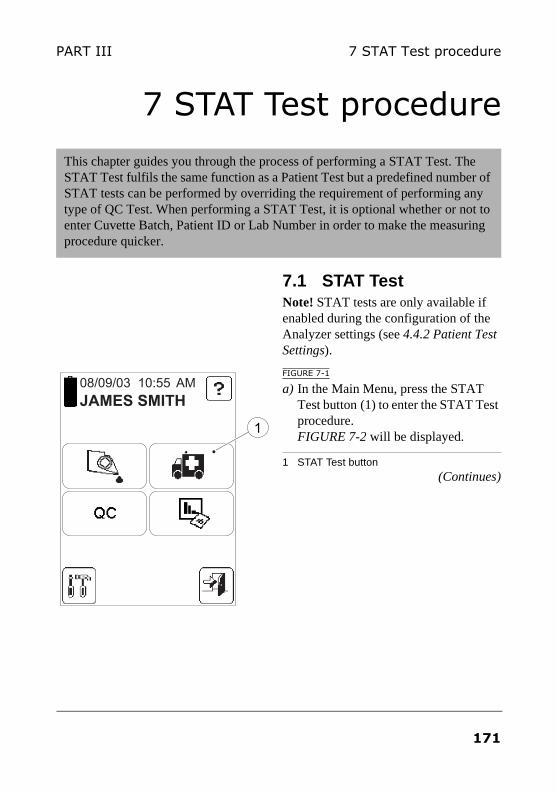
7 STAT Test procedurePART III
7 STAT Test procedure
7.1 STAT TestNote! STAT tests are only available if enabled during the configuration of the Analyzer settings (see 4.4.2 Patient Test Settings).
FIGURE 7-1
a) In the Main Menu, press the STAT Test button (1) to enter the STAT Test procedure. FIGURE 7-2 will be displayed.
1 STAT Test button(Continues)
This chapter guides you through the process of performing a STAT Test. The STAT Test fulfils the same function as a Patient Test but a predefined number of STAT tests can be performed by overriding the requirement of performing any type of QC Test. When performing a STAT Test, it is optional whether or not to enter Cuvette Batch, Patient ID or Lab Number in order to make the measuring procedure quicker.
08/09/03 10:55 AM
JAMES SMITH
1
171
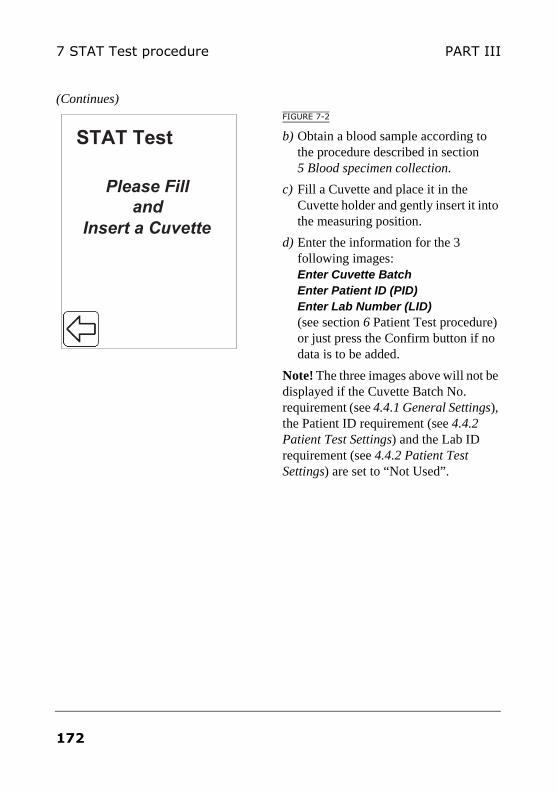
7 STAT Test procedure PART III
(Continues)FIGURE 7-2
b) Obtain a blood sample according to the procedure described in section 5 Blood specimen collection.
c) Fill a Cuvette and place it in the Cuvette holder and gently insert it into the measuring position.
d) Enter the information for the 3 following images: Enter Cuvette Batch Enter Patient ID (PID) Enter Lab Number (LID) (see section 6 Patient Test procedure) or just press the Confirm button if no data is to be added.
Note! The three images above will not be displayed if the Cuvette Batch No. requirement (see 4.4.1 General Settings), the Patient ID requirement (see 4.4.2 Patient Test Settings) and the Lab ID requirement (see 4.4.2 Patient Test Settings) are set to “Not Used”.
Please Fill
and
Insert a Cuvette
STAT Test
172
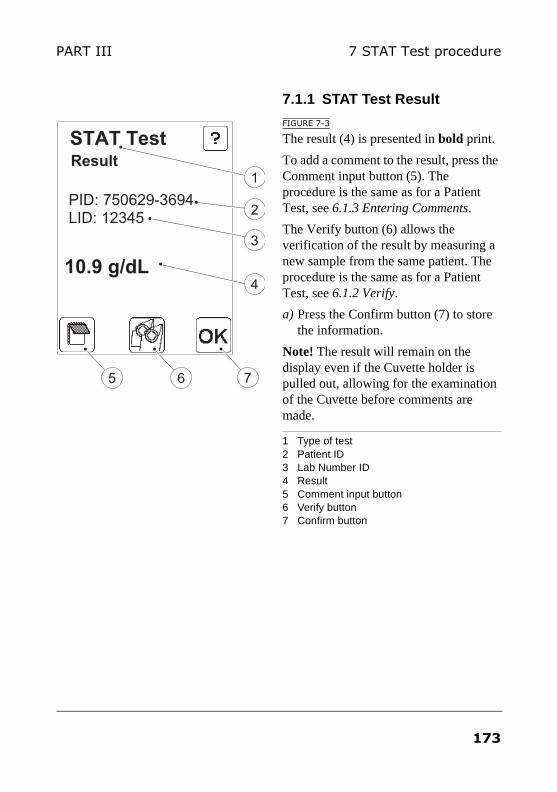
7 STAT Test procedurePART III
7.1.1 STAT Test Result
FIGURE 7-3
The result (4) is presented in bold print.
To add a comment to the result, press the Comment input button (5). The procedure is the same as for a Patient Test, see 6.1.3 Entering Comments.
The Verify button (6) allows the verification of the result by measuring a new sample from the same patient. The procedure is the same as for a Patient Test, see 6.1.2 Verify.
a) Press the Confirm button (7) to store the information.
Note! The result will remain on the display even if the Cuvette holder is pulled out, allowing for the examination of the Cuvette before comments are made.
1 Type of test2 Patient ID3 Lab Number ID4 Result5 Comment input button6 Verify button7 Confirm button
STAT Test
PID: 750629-3694LID: 12345
10.9 g/dL
Result
76
1
2
3
4
5
173

7 STAT Test procedure PART III
This page intentionally left blank
174
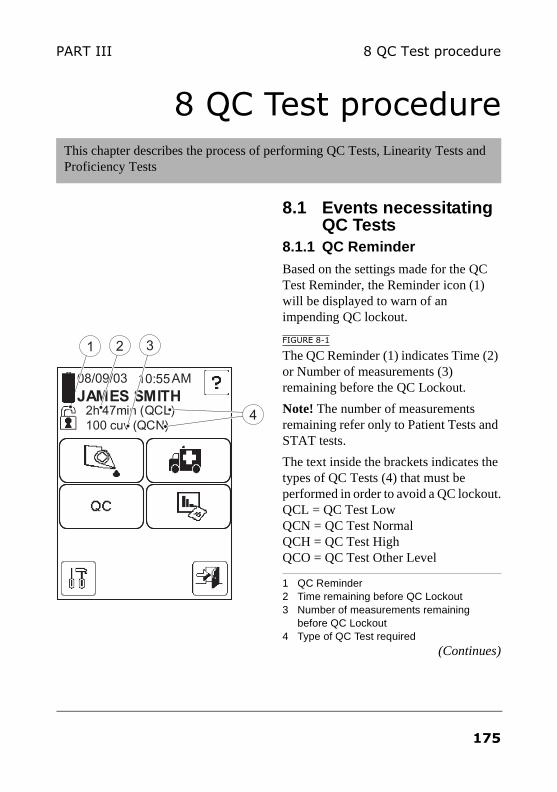
8 QC Test procedurePART III
8 QC Test procedure
8.1 Events necessitating QC Tests
8.1.1 QC Reminder
Based on the settings made for the QC Test Reminder, the Reminder icon (1) will be displayed to warn of an impending QC lockout.
FIGURE 8-1
The QC Reminder (1) indicates Time (2) or Number of measurements (3) remaining before the QC Lockout.
Note! The number of measurements remaining refer only to Patient Tests and STAT tests.
The text inside the brackets indicates the types of QC Tests (4) that must be performed in order to avoid a QC lockout. QCL = QC Test Low QCN = QC Test Normal QCH = QC Test High QCO = QC Test Other Level
1 QC Reminder2 Time remaining before QC Lockout3 Number of measurements remaining
before QC Lockout4 Type of QC Test required
(Continues)
This chapter describes the process of performing QC Tests, Linearity Tests and Proficiency Tests
08/09/03 10:55AM
JAMES SMITH2h 47min (QCL)
100 cuv (QCN)
1 32
4
175
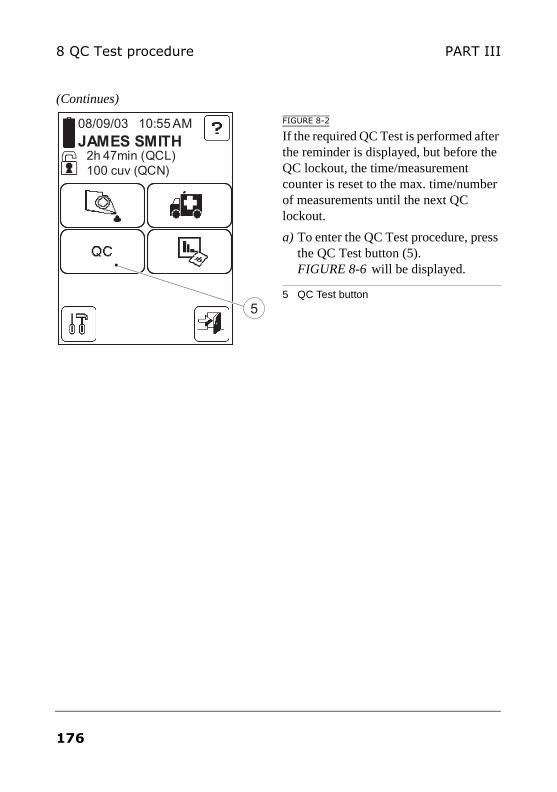
8 QC Test procedure PART III
(Continues)
FIGURE 8-2
If the required QC Test is performed after the reminder is displayed, but before the QC lockout, the time/measurement counter is reset to the max. time/number of measurements until the next QC lockout.
a) To enter the QC Test procedure, press the QC Test button (5). FIGURE 8-6 will be displayed.
5 QC Test button
08/09/03 10:55 AM
JAMES SMITH2h 47min (QCL)
100 cuv (QCN)
5
176
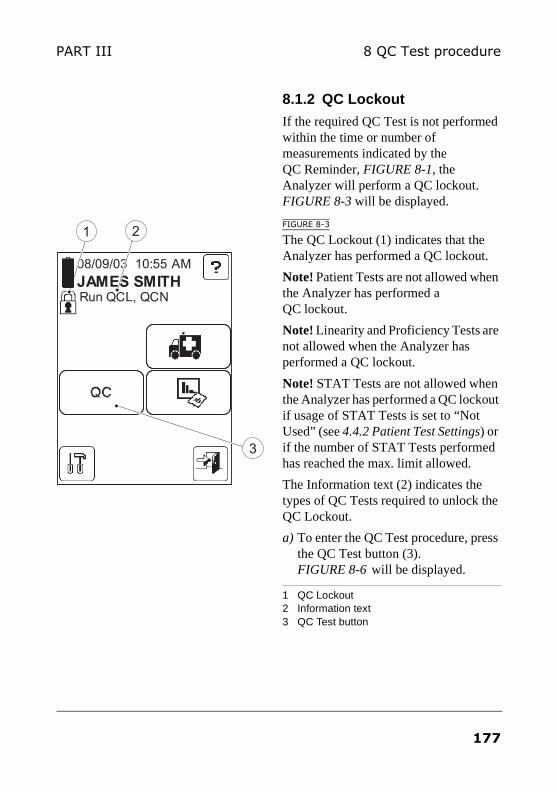
8 QC Test procedurePART III
8.1.2 QC Lockout
If the required QC Test is not performed within the time or number of measurements indicated by the QC Reminder, FIGURE 8-1, the Analyzer will perform a QC lockout. FIGURE 8-3 will be displayed.
FIGURE 8-3
The QC Lockout (1) indicates that the Analyzer has performed a QC lockout.
Note! Patient Tests are not allowed when the Analyzer has performed a QC lockout.
Note! Linearity and Proficiency Tests are not allowed when the Analyzer has performed a QC lockout.
Note! STAT Tests are not allowed when the Analyzer has performed a QC lockout if usage of STAT Tests is set to “Not Used” (see 4.4.2 Patient Test Settings) or if the number of STAT Tests performed has reached the max. limit allowed.
The Information text (2) indicates the types of QC Tests required to unlock the QC Lockout.
a) To enter the QC Test procedure, press the QC Test button (3). FIGURE 8-6 will be displayed.
1 QC Lockout2 Information text3 QC Test button
08/09/03 10:55 AM
JAMES SMITHRun QCL, QCN
1
3
2
177
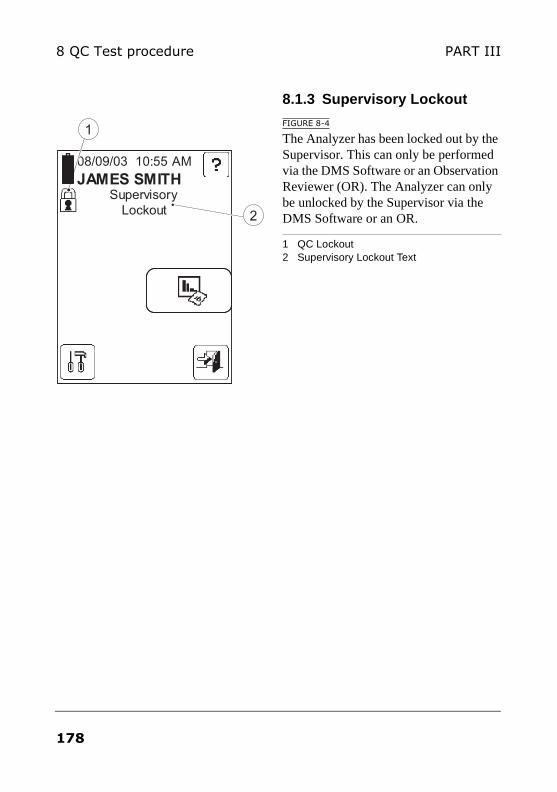
8 QC Test procedure PART III
8.1.3 Supervisory Lockout
FIGURE 8-4
The Analyzer has been locked out by the Supervisor. This can only be performed via the DMS Software or an Observation Reviewer (OR). The Analyzer can only be unlocked by the Supervisor via the DMS Software or an OR.
1 QC Lockout2 Supervisory Lockout Text
08/09/03 10:55 AM
JAMES SMITHSupervisory
Lockout
1
2
178
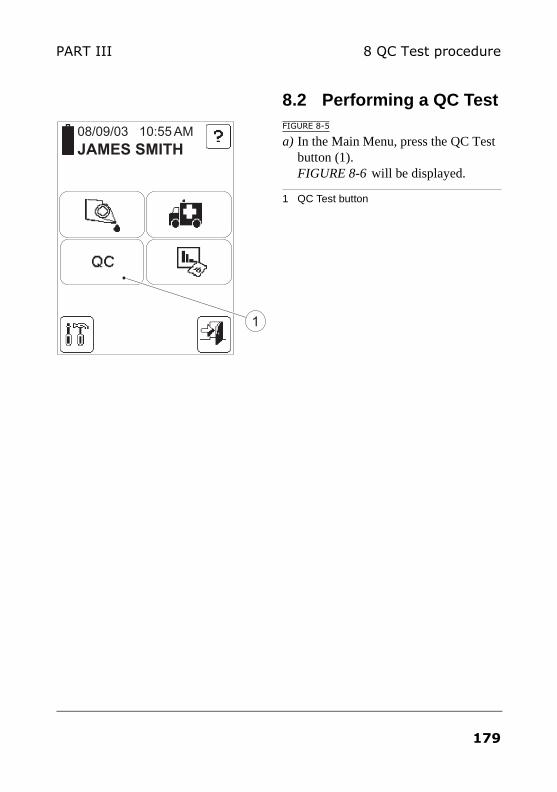
8 QC Test procedurePART III
8.2 Performing a QC TestFIGURE 8-5
a) In the Main Menu, press the QC Test button (1). FIGURE 8-6 will be displayed.
1 QC Test button
08/09/03 10:55 AM
JAMES SMITH
1
179
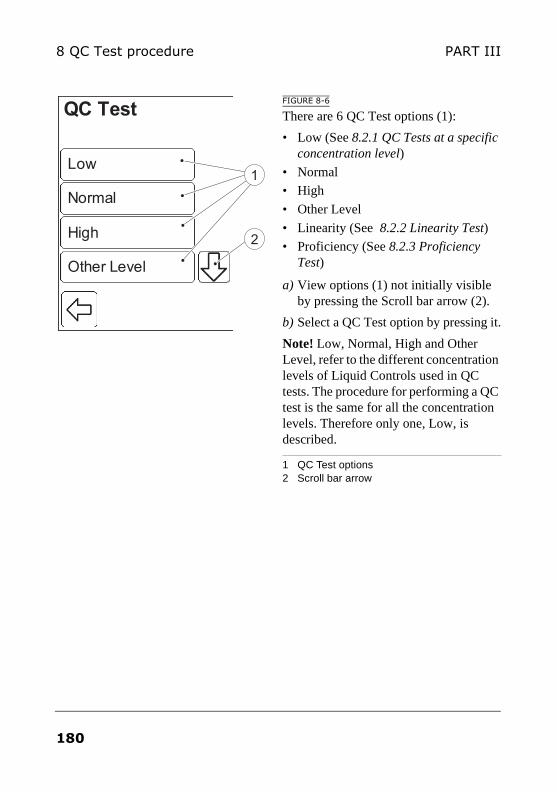
8 QC Test procedure PART III
FIGURE 8-6
There are 6 QC Test options (1):
• Low (See 8.2.1 QC Tests at a specific concentration level)
• Normal
• High
• Other Level
• Linearity (See 8.2.2 Linearity Test)
• Proficiency (See 8.2.3 Proficiency Test)
a) View options (1) not initially visible by pressing the Scroll bar arrow (2).
b) Select a QC Test option by pressing it.
Note! Low, Normal, High and Other Level, refer to the different concentration levels of Liquid Controls used in QC tests. The procedure for performing a QC test is the same for all the concentration levels. Therefore only one, Low, is described.
1 QC Test options2 Scroll bar arrow
NormalNormal
HighHigh
Other LevelOther Level
QC Test
LowLow
2
1
180
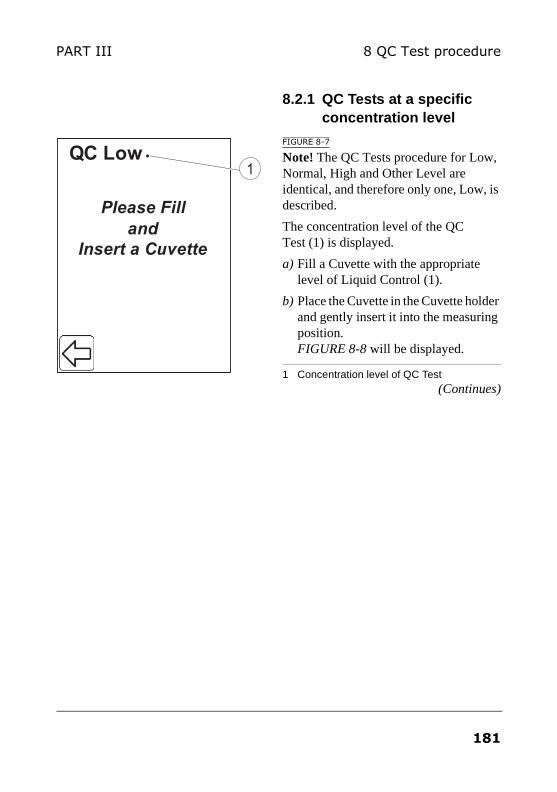
8 QC Test procedurePART III
8.2.1 QC Tests at a specific concentration level
FIGURE 8-7
Note! The QC Tests procedure for Low, Normal, High and Other Level are identical, and therefore only one, Low, is described.
The concentration level of the QC Test (1) is displayed.
a) Fill a Cuvette with the appropriate level of Liquid Control (1).
b) Place the Cuvette in the Cuvette holder and gently insert it into the measuring position. FIGURE 8-8 will be displayed.
1 Concentration level of QC Test(Continues)
Please Fill
and
Insert a Cuvette
QC Low1
181
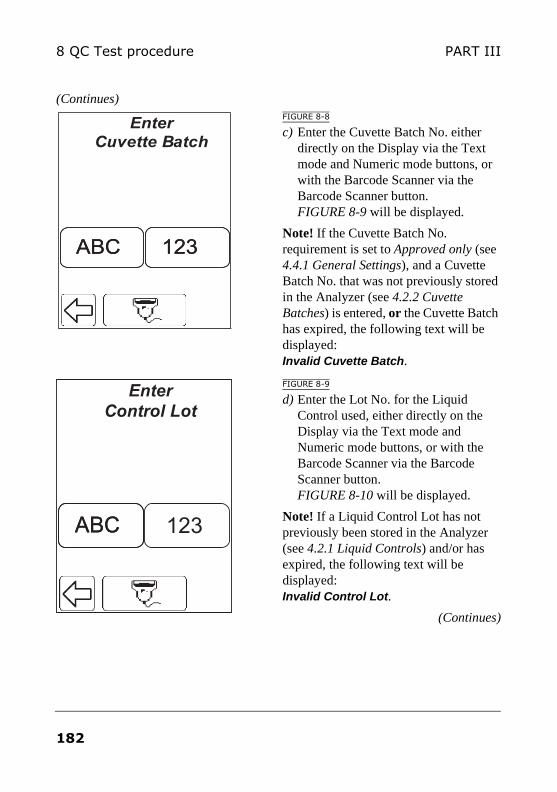
8 QC Test procedure PART III
(Continues)FIGURE 8-8
c) Enter the Cuvette Batch No. either directly on the Display via the Text mode and Numeric mode buttons, or with the Barcode Scanner via the Barcode Scanner button. FIGURE 8-9 will be displayed.
Note! If the Cuvette Batch No. requirement is set to Approved only (see 4.4.1 General Settings), and a Cuvette Batch No. that was not previously stored in the Analyzer (see 4.2.2 Cuvette Batches) is entered, or the Cuvette Batch has expired, the following text will be displayed: Invalid Cuvette Batch.
FIGURE 8-9
d) Enter the Lot No. for the Liquid Control used, either directly on the Display via the Text mode and Numeric mode buttons, or with the Barcode Scanner via the Barcode Scanner button. FIGURE 8-10 will be displayed.
Note! If a Liquid Control Lot has not previously been stored in the Analyzer (see 4.2.1 Liquid Controls) and/or has expired, the following text will be displayed: Invalid Control Lot.
(Continues)
Enter
Cuvette Batch
123123ABCABC
Enter
Cuvette Batch
123123ABCABC
Enter
Control Lot
123ABCABC
182
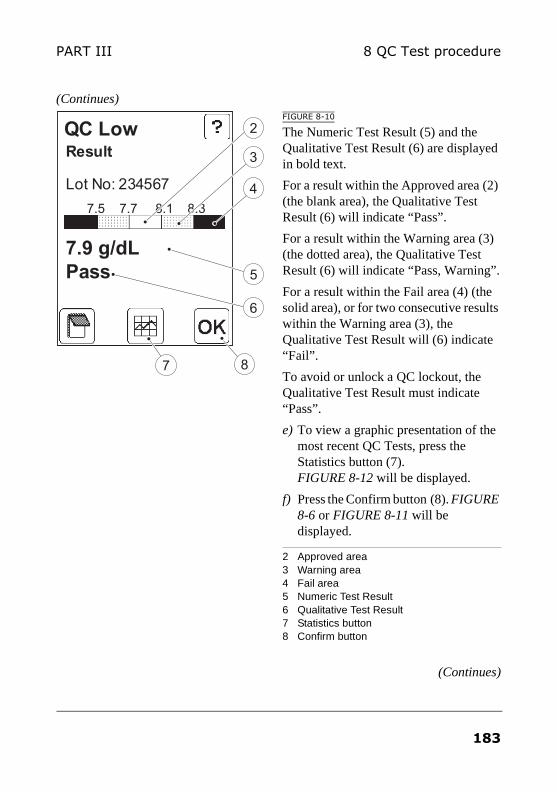
8 QC Test procedurePART III
(Continues)FIGURE 8-10
The Numeric Test Result (5) and the Qualitative Test Result (6) are displayed in bold text.
For a result within the Approved area (2) (the blank area), the Qualitative Test Result (6) will indicate “Pass”.
For a result within the Warning area (3) (the dotted area), the Qualitative Test Result (6) will indicate “Pass, Warning”.
For a result within the Fail area (4) (the solid area), or for two consecutive results within the Warning area (3), the Qualitative Test Result will (6) indicate “Fail”.
To avoid or unlock a QC lockout, the Qualitative Test Result must indicate “Pass”.
e) To view a graphic presentation of the most recent QC Tests, press the Statistics button (7). FIGURE 8-12 will be displayed.
f) Press the Confirm button (8). FIGURE 8-6 or FIGURE 8-11 will be displayed.
2 Approved area3 Warning area4 Fail area5 Numeric Test Result6 Qualitative Test Result7 Statistics button8 Confirm button
(Continues)
QC Low
Lot No: 234567
Result
7.9 g/dL
Pass
7.5 7.7 8.1 8.3
6
2
3
5
4
7 8
183
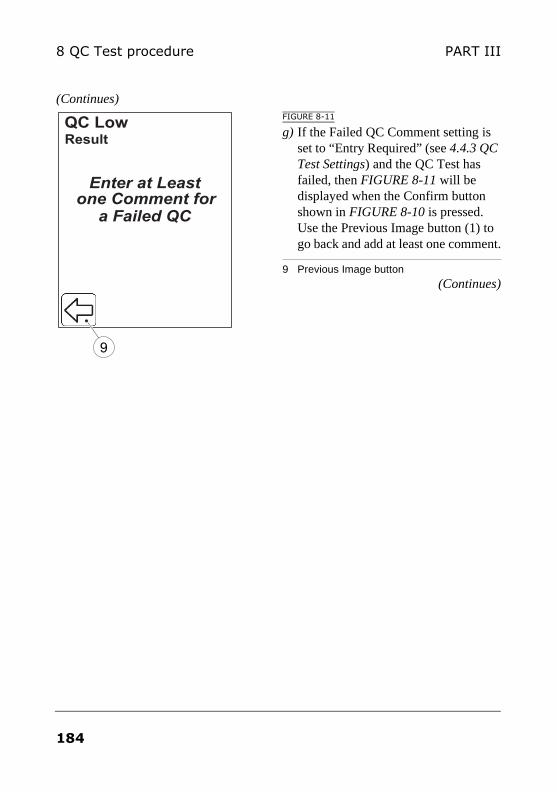
8 QC Test procedure PART III
(Continues)FIGURE 8-11
g) If the Failed QC Comment setting is set to “Entry Required” (see 4.4.3 QC Test Settings) and the QC Test has failed, then FIGURE 8-11 will be displayed when the Confirm button shown in FIGURE 8-10 is pressed. Use the Previous Image button (1) to go back and add at least one comment.
9 Previous Image button(Continues)
QC Low Result
a Failed QC
Enter at Leastone Comment for
9
184
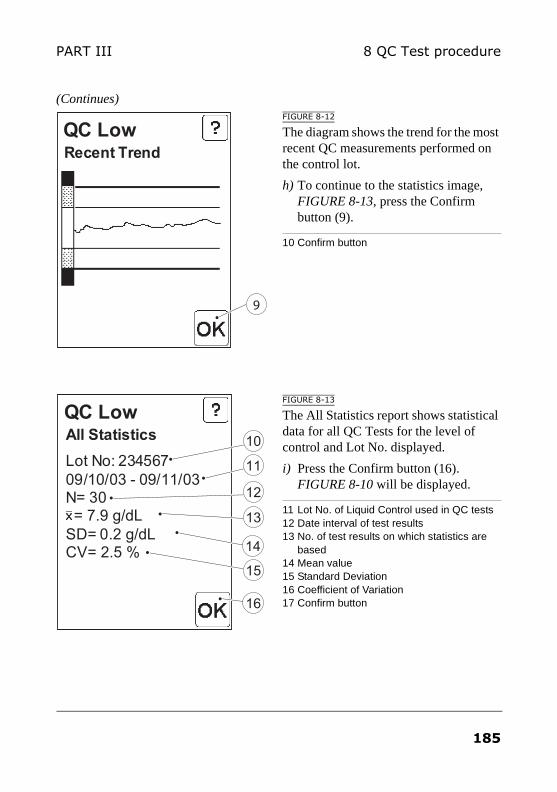
8 QC Test procedurePART III
(Continues)FIGURE 8-12
The diagram shows the trend for the most recent QC measurements performed on the control lot.
h) To continue to the statistics image, FIGURE 8-13, press the Confirm button (9).
10 Confirm button
FIGURE 8-13
The All Statistics report shows statistical data for all QC Tests for the level of control and Lot No. displayed.
i) Press the Confirm button (16). FIGURE 8-10 will be displayed.
11 Lot No. of Liquid Control used in QC tests12 Date interval of test results13 No. of test results on which statistics are
based14 Mean value15 Standard Deviation16 Coefficient of Variation17 Confirm button
QC LowRecent Trend
9
QC LowAll Statistics
Lot No: 234567
09/10/03 - 09/11/03N= 30= 7.9 g/dL
SD= 0.2 g/dL CV= 2.5 %
10
11
12
13
14
15
16
185
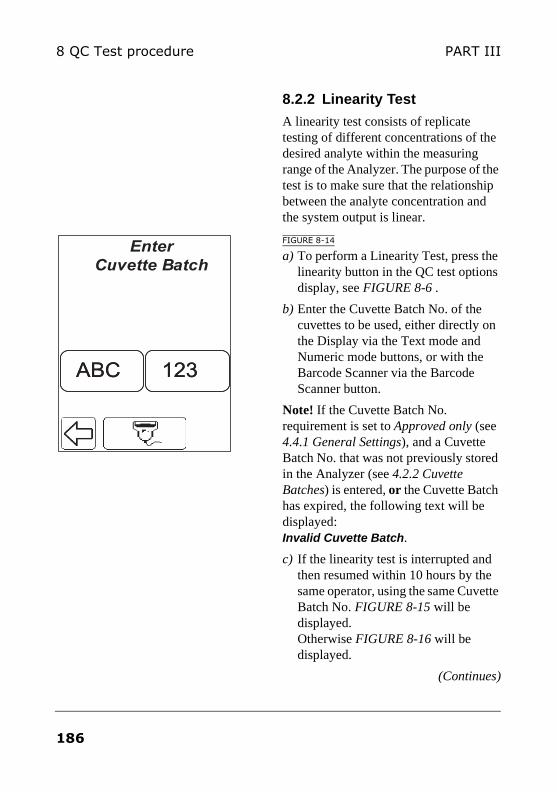
8 QC Test procedure PART III
8.2.2 Linearity Test
A linearity test consists of replicate testing of different concentrations of the desired analyte within the measuring range of the Analyzer. The purpose of the test is to make sure that the relationship between the analyte concentration and the system output is linear.
FIGURE 8-14
a) To perform a Linearity Test, press the linearity button in the QC test options display, see FIGURE 8-6 .
b) Enter the Cuvette Batch No. of the cuvettes to be used, either directly on the Display via the Text mode and Numeric mode buttons, or with the Barcode Scanner via the Barcode Scanner button.
Note! If the Cuvette Batch No. requirement is set to Approved only (see 4.4.1 General Settings), and a Cuvette Batch No. that was not previously stored in the Analyzer (see 4.2.2 Cuvette Batches) is entered, or the Cuvette Batch has expired, the following text will be displayed: Invalid Cuvette Batch.
c) If the linearity test is interrupted and then resumed within 10 hours by the same operator, using the same Cuvette Batch No. FIGURE 8-15 will be displayed. Otherwise FIGURE 8-16 will be displayed.
(Continues)
Enter
Cuvette Batch
123123ABCABC
186
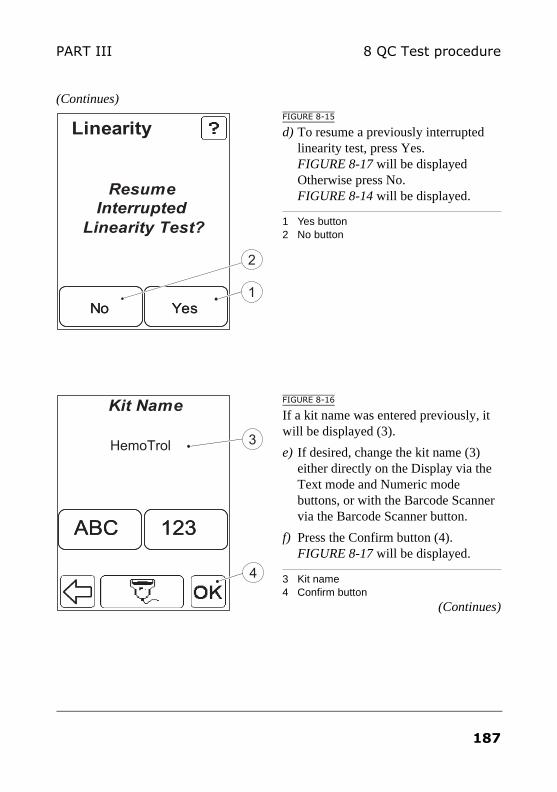
8 QC Test procedurePART III
(Continues)FIGURE 8-15
d) To resume a previously interrupted linearity test, press Yes. FIGURE 8-17 will be displayed Otherwise press No. FIGURE 8-14 will be displayed.
1 Yes button2 No button
FIGURE 8-16
If a kit name was entered previously, it will be displayed (3).
e) If desired, change the kit name (3) either directly on the Display via the Text mode and Numeric mode buttons, or with the Barcode Scanner via the Barcode Scanner button.
f) Press the Confirm button (4). FIGURE 8-17 will be displayed.
3 Kit name4 Confirm button
(Continues)
Linearity
NoNo YesYes
Resume
Interrupted
Linearity Test?
1
2
Kit Name
123123ABCABC
4
3HemoTrol
187
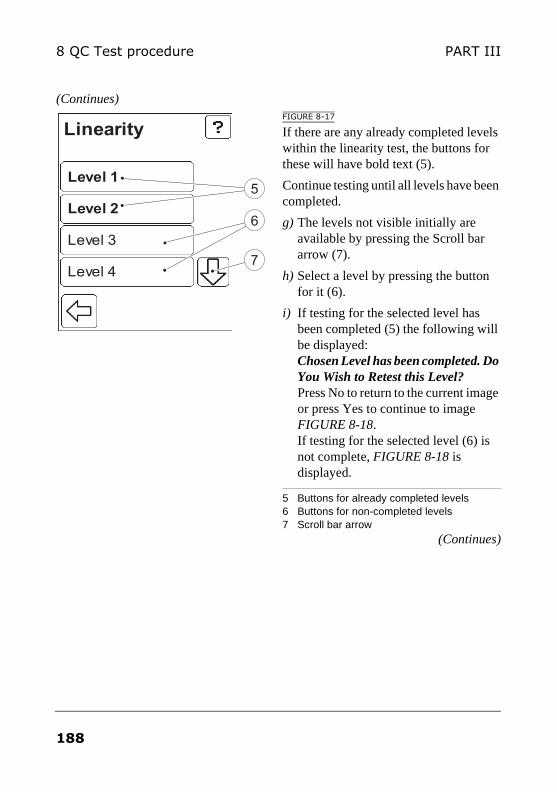
8 QC Test procedure PART III
(Continues)FIGURE 8-17
If there are any already completed levels within the linearity test, the buttons for these will have bold text (5).
Continue testing until all levels have been completed.
g) The levels not visible initially are available by pressing the Scroll bar arrow (7).
h) Select a level by pressing the button for it (6).
i) If testing for the selected level has been completed (5) the following will be displayed: Chosen Level has been completed. Do You Wish to Retest this Level? Press No to return to the current image or press Yes to continue to image FIGURE 8-18. If testing for the selected level (6) is not complete, FIGURE 8-18 is displayed.
5 Buttons for already completed levels6 Buttons for non-completed levels7 Scroll bar arrow
(Continues)
Level 2Level 2
Level 3Level 3
Level 4Level 4
Linearity
Level 1Level 15
7
6
188
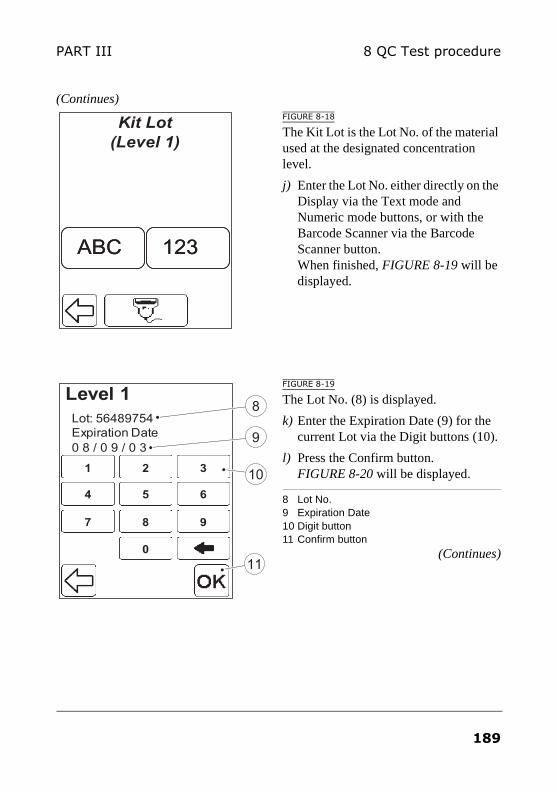
8 QC Test procedurePART III
(Continues)FIGURE 8-18
The Kit Lot is the Lot No. of the material used at the designated concentration level.
j) Enter the Lot No. either directly on the Display via the Text mode and Numeric mode buttons, or with the Barcode Scanner via the Barcode Scanner button. When finished, FIGURE 8-19 will be displayed.
FIGURE 8-19
The Lot No. (8) is displayed.
k) Enter the Expiration Date (9) for the current Lot via the Digit buttons (10).
l) Press the Confirm button. FIGURE 8-20 will be displayed.
8 Lot No.9 Expiration Date10 Digit button11 Confirm button
(Continues)
Kit Lot
(Level 1)
123123ABCABC
Level 1
Lot: 56489754
Expiration Date
0 8 / 0 9 / 0 3
1
5
2
87
4 6
9
3
0
11
55
22
8877
44 66
99
33
00
8
9
10
11
189
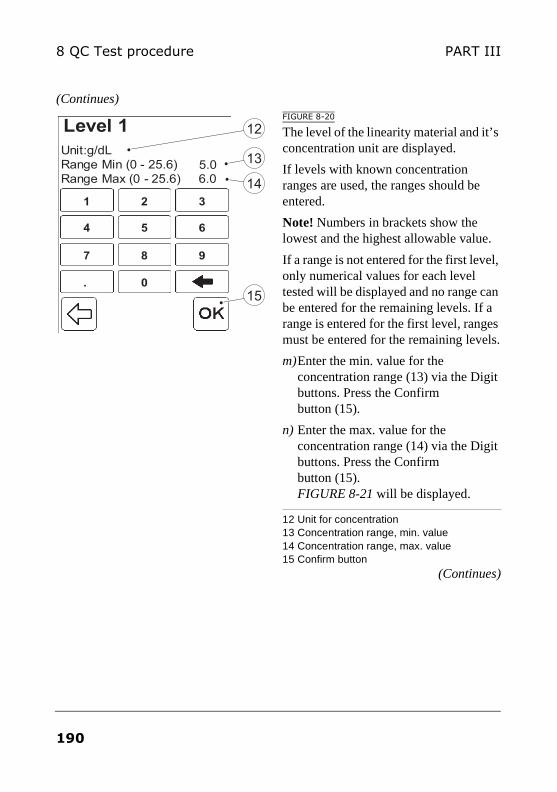
8 QC Test procedure PART III
(Continues)FIGURE 8-20
The level of the linearity material and it’s concentration unit are displayed.
If levels with known concentration ranges are used, the ranges should be entered.
Note! Numbers in brackets show the lowest and the highest allowable value.
If a range is not entered for the first level, only numerical values for each level tested will be displayed and no range can be entered for the remaining levels. If a range is entered for the first level, ranges must be entered for the remaining levels.
m)Enter the min. value for the concentration range (13) via the Digit buttons. Press the Confirm button (15).
n) Enter the max. value for the concentration range (14) via the Digit buttons. Press the Confirm button (15). FIGURE 8-21 will be displayed.
12 Unit for concentration13 Concentration range, min. value14 Concentration range, max. value15 Confirm button
(Continues)
Unit:g/dL
Range Min (0 - 25.6)
Range Max (0 - 25.6) 6.0
Level 1
1
5
2
87
4 6
9
3
0
11
55
22
8877
44 66
99
33
00..
14
13
12
5.0
15
190
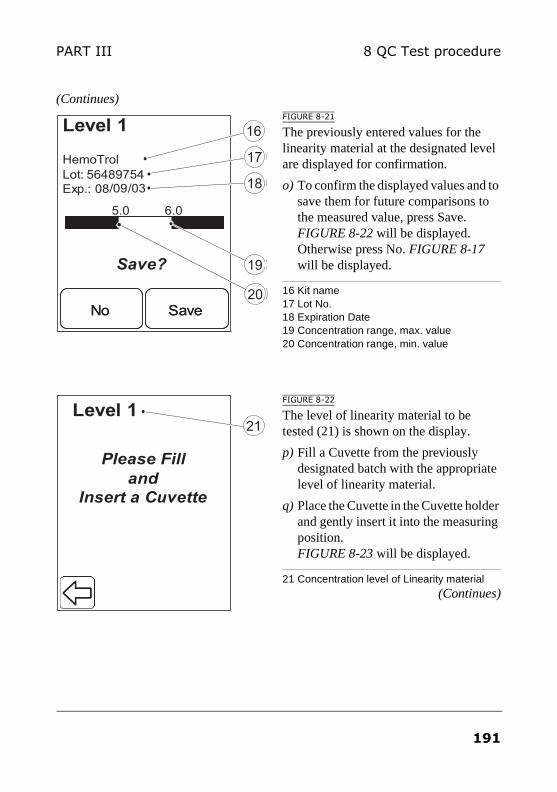
8 QC Test procedurePART III
(Continues)FIGURE 8-21
The previously entered values for the linearity material at the designated level are displayed for confirmation.
o) To confirm the displayed values and to save them for future comparisons to the measured value, press Save. FIGURE 8-22 will be displayed. Otherwise press No. FIGURE 8-17 will be displayed.
16 Kit name17 Lot No.18 Expiration Date19 Concentration range, max. value20 Concentration range, min. value
FIGURE 8-22
The level of linearity material to be tested (21) is shown on the display.
p) Fill a Cuvette from the previously designated batch with the appropriate level of linearity material.
q) Place the Cuvette in the Cuvette holder and gently insert it into the measuring position. FIGURE 8-23 will be displayed.
21 Concentration level of Linearity material(Continues)
Level 1
HemoTrol
Lot: 56489754
Exp.: 08/09/03
Save?
NoNo SaveSave
5.0 6.0
17
18
19
20
16Level 1
HemoTrol
Lot: 56489754
Exp.: 08/09/03
Save?
NoNo SaveSave
5.0 6.0
17
18
19
20
16
Please Fill
and
Insert a Cuvette
Level 121
191
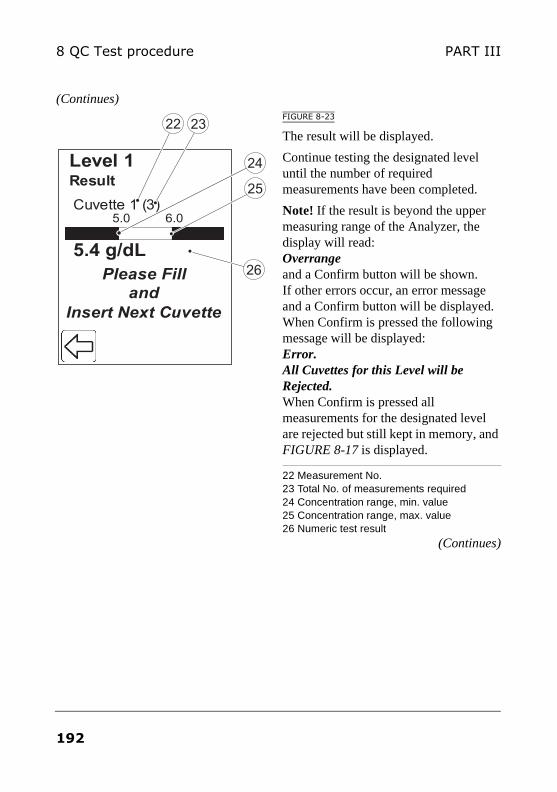
8 QC Test procedure PART III
(Continues)FIGURE 8-23
The result will be displayed.
Continue testing the designated level until the number of required measurements have been completed.
Note! If the result is beyond the upper measuring range of the Analyzer, the display will read: Overrange and a Confirm button will be shown. If other errors occur, an error message and a Confirm button will be displayed. When Confirm is pressed the following message will be displayed: Error. All Cuvettes for this Level will be Rejected. When Confirm is pressed all measurements for the designated level are rejected but still kept in memory, and FIGURE 8-17 is displayed.
22 Measurement No.23 Total No. of measurements required24 Concentration range, min. value25 Concentration range, max. value26 Numeric test result
(Continues)
Level 1
Cuvette 1 (3)
Result
Please Fill
and
Insert Next Cuvette
5.4 g/dL
5.0 6.0
22 23
26
25
24
192
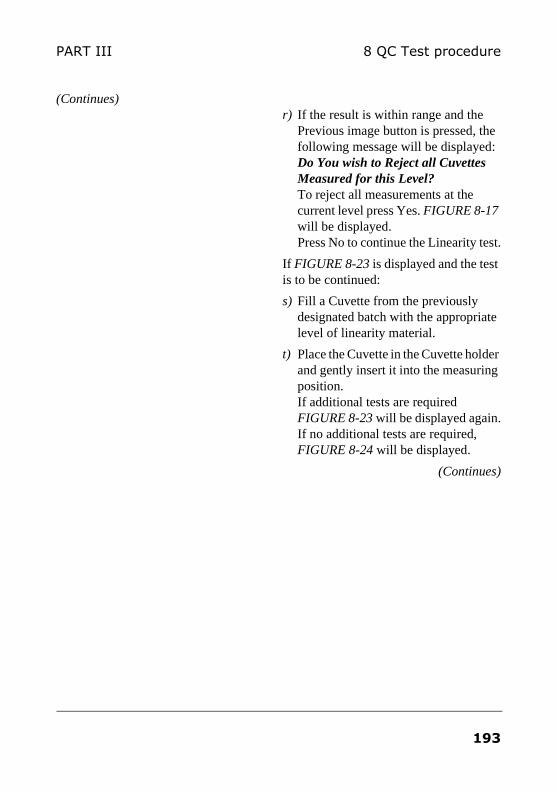
8 QC Test procedurePART III
(Continues)r) If the result is within range and the
Previous image button is pressed, the following message will be displayed: Do You wish to Reject all Cuvettes Measured for this Level? To reject all measurements at the current level press Yes. FIGURE 8-17 will be displayed. Press No to continue the Linearity test.
If FIGURE 8-23 is displayed and the test is to be continued:
s) Fill a Cuvette from the previously designated batch with the appropriate level of linearity material.
t) Place the Cuvette in the Cuvette holder and gently insert it into the measuring position. If additional tests are required FIGURE 8-23 will be displayed again. If no additional tests are required, FIGURE 8-24 will be displayed.
(Continues)
193
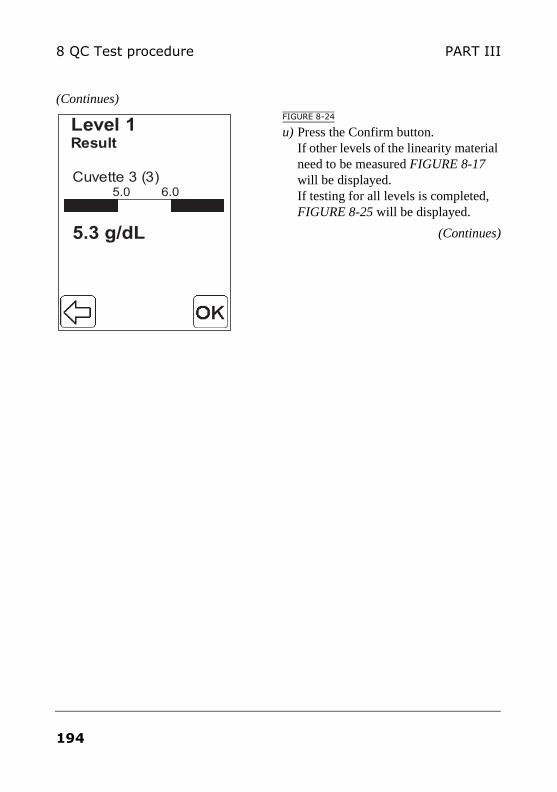
8 QC Test procedure PART III
(Continues)FIGURE 8-24
u) Press the Confirm button. If other levels of the linearity material need to be measured FIGURE 8-17 will be displayed. If testing for all levels is completed, FIGURE 8-25 will be displayed.
(Continues)
Level 1
5.3 g/dL
Result
Cuvette 3 (3) 5.0 6.0
194
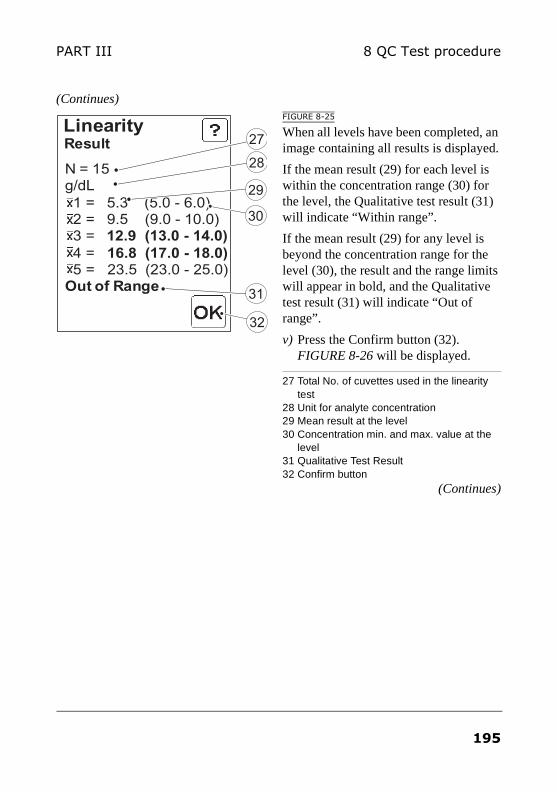
8 QC Test procedurePART III
(Continues)FIGURE 8-25
When all levels have been completed, an image containing all results is displayed.
If the mean result (29) for each level is within the concentration range (30) for the level, the Qualitative test result (31) will indicate “Within range”.
If the mean result (29) for any level is beyond the concentration range for the level (30), the result and the range limits will appear in bold, and the Qualitative test result (31) will indicate “Out of range”.
v) Press the Confirm button (32). FIGURE 8-26 will be displayed.
27 Total No. of cuvettes used in the linearity test
28 Unit for analyte concentration29 Mean result at the level30 Concentration min. and max. value at the
level31 Qualitative Test Result32 Confirm button
(Continues)
LinearityResult
N = 15g/dL
1 = 5.3 (5.0 - 6.0) 2 = 9.5 (9.0 - 10.0) 3 = 12.9 (13.0 - 14.0)
4 = 16.8 (17.0 - 18.0)
5 = 23.5 (23.0 - 25.0) Out of Range
27
31
29
30
28
32
195
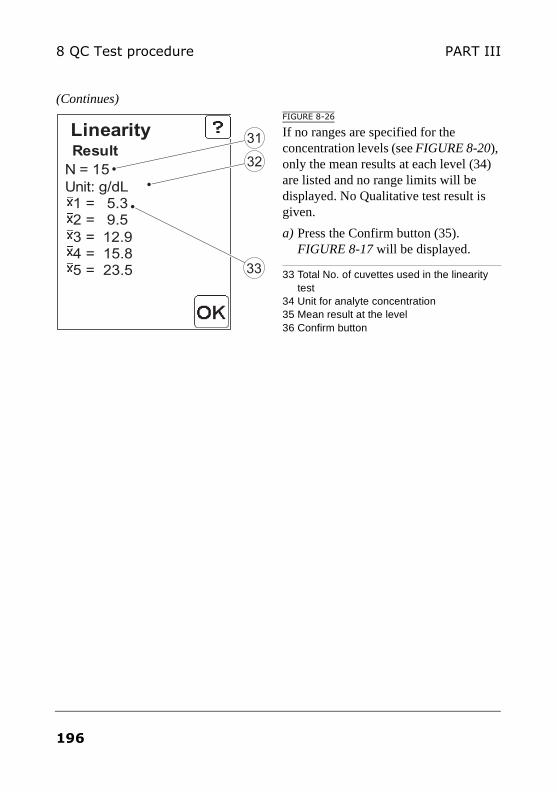
8 QC Test procedure PART III
(Continues)FIGURE 8-26
If no ranges are specified for the concentration levels (see FIGURE 8-20), only the mean results at each level (34) are listed and no range limits will be displayed. No Qualitative test result is given.
a) Press the Confirm button (35). FIGURE 8-17 will be displayed.
33 Total No. of cuvettes used in the linearity test
34 Unit for analyte concentration35 Mean result at the level36 Confirm button
LinearityResult
N = 15
Unit: g/dL1 = 5.3 2 = 9.5
3 = 12.9 4 = 15.85 = 23.5
32
31
33
196
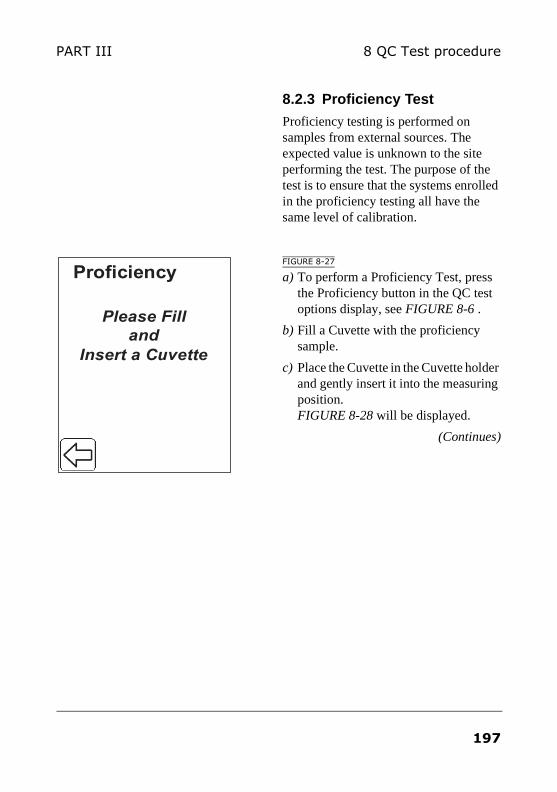
8 QC Test procedurePART III
8.2.3 Proficiency Test
Proficiency testing is performed on samples from external sources. The expected value is unknown to the site performing the test. The purpose of the test is to ensure that the systems enrolled in the proficiency testing all have the same level of calibration.
FIGURE 8-27
a) To perform a Proficiency Test, press the Proficiency button in the QC test options display, see FIGURE 8-6 .
b) Fill a Cuvette with the proficiency sample.
c) Place the Cuvette in the Cuvette holder and gently insert it into the measuring position. FIGURE 8-28 will be displayed.
(Continues)
Please Filland
Insert a Cuvette
Proficiency
197
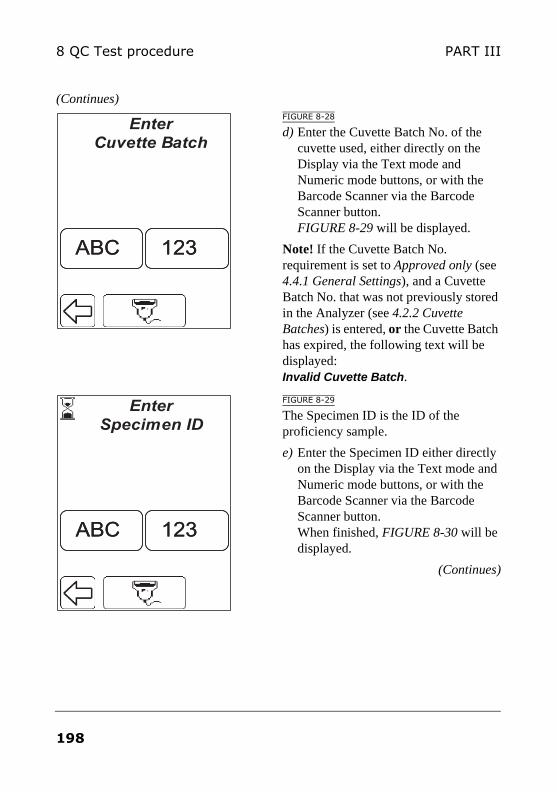
8 QC Test procedure PART III
(Continues)FIGURE 8-28
d) Enter the Cuvette Batch No. of the cuvette used, either directly on the Display via the Text mode and Numeric mode buttons, or with the Barcode Scanner via the Barcode Scanner button. FIGURE 8-29 will be displayed.
Note! If the Cuvette Batch No. requirement is set to Approved only (see 4.4.1 General Settings), and a Cuvette Batch No. that was not previously stored in the Analyzer (see 4.2.2 Cuvette Batches) is entered, or the Cuvette Batch has expired, the following text will be displayed: Invalid Cuvette Batch.
FIGURE 8-29
The Specimen ID is the ID of the proficiency sample.
e) Enter the Specimen ID either directly on the Display via the Text mode and Numeric mode buttons, or with the Barcode Scanner via the Barcode Scanner button. When finished, FIGURE 8-30 will be displayed.
(Continues)
Enter
Cuvette Batch
123123ABCABC
Enter
Specimen ID
123123ABCABC
198
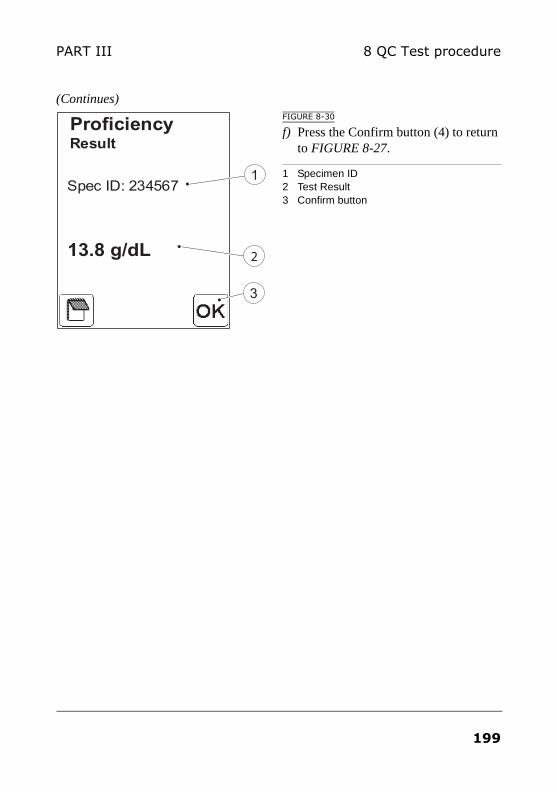
8 QC Test procedurePART III
(Continues)FIGURE 8-30
f) Press the Confirm button (4) to return to FIGURE 8-27.
1 Specimen ID2 Test Result3 Confirm button
Proficiency
Spec ID: 234567
13.8 g/dL
Result
1
2
3
199

8 QC Test procedure PART III
This page intentionally left blank
200
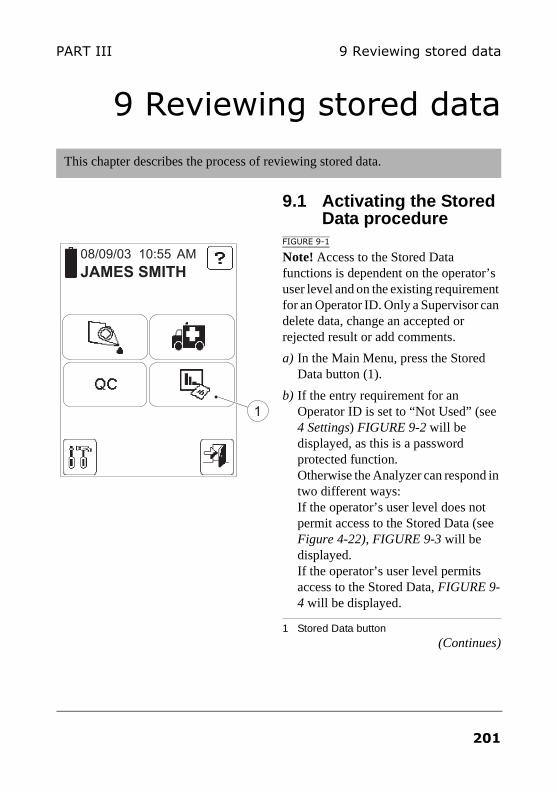
9 Reviewing stored dataPART III
9 Reviewing stored data
9.1 Activating the Stored Data procedure
FIGURE 9-1
Note! Access to the Stored Data functions is dependent on the operator’s user level and on the existing requirement for an Operator ID. Only a Supervisor can delete data, change an accepted or rejected result or add comments.
a) In the Main Menu, press the Stored Data button (1).
b) If the entry requirement for an Operator ID is set to “Not Used” (see 4 Settings) FIGURE 9-2 will be displayed, as this is a password protected function. Otherwise the Analyzer can respond in two different ways: If the operator’s user level does not permit access to the Stored Data (see Figure 4-22), FIGURE 9-3 will be displayed. If the operator’s user level permits access to the Stored Data, FIGURE 9-4 will be displayed.
1 Stored Data button(Continues)
This chapter describes the process of reviewing stored data.
08/09/03 10:55 AM
JAMES SMITH
1
201
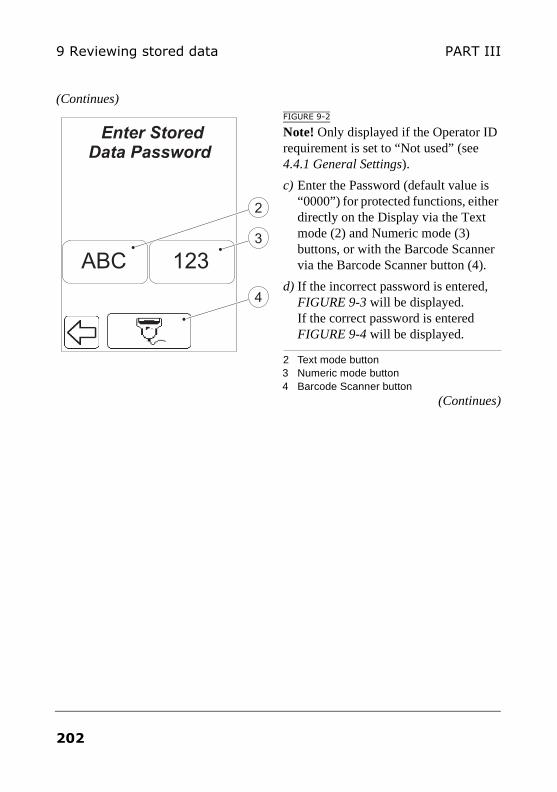
9 Reviewing stored data PART III
(Continues)FIGURE 9-2
Note! Only displayed if the Operator ID requirement is set to “Not used” (see 4.4.1 General Settings).
c) Enter the Password (default value is “0000”) for protected functions, either directly on the Display via the Text mode (2) and Numeric mode (3) buttons, or with the Barcode Scanner via the Barcode Scanner button (4).
d) If the incorrect password is entered, FIGURE 9-3 will be displayed. If the correct password is entered FIGURE 9-4 will be displayed.
2 Text mode button3 Numeric mode button4 Barcode Scanner button
(Continues)
Enter StoredData Password
123ABC
4
3
2
202
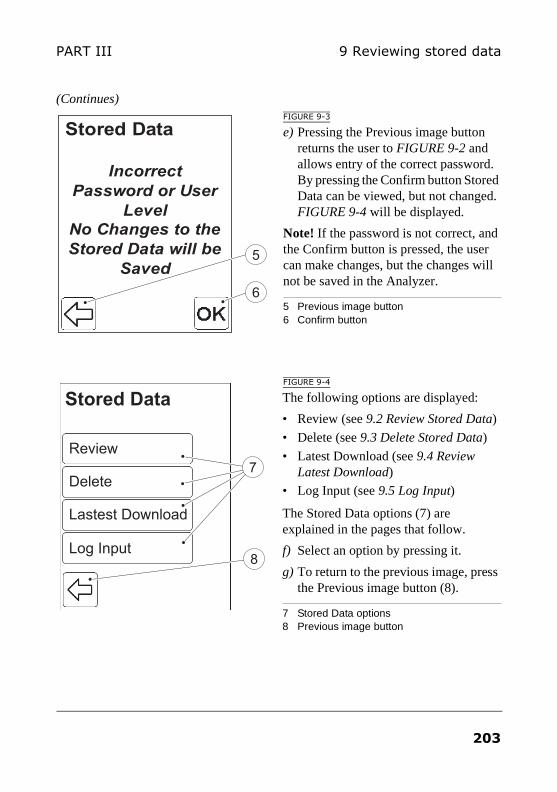
9 Reviewing stored dataPART III
(Continues)FIGURE 9-3
e) Pressing the Previous image button returns the user to FIGURE 9-2 and allows entry of the correct password. By pressing the Confirm button Stored Data can be viewed, but not changed. FIGURE 9-4 will be displayed.
Note! If the password is not correct, and the Confirm button is pressed, the user can make changes, but the changes will not be saved in the Analyzer.
5 Previous image button6 Confirm button
FIGURE 9-4
The following options are displayed:
• Review (see 9.2 Review Stored Data)
• Delete (see 9.3 Delete Stored Data)
• Latest Download (see 9.4 Review Latest Download)
• Log Input (see 9.5 Log Input)
The Stored Data options (7) are explained in the pages that follow.
f) Select an option by pressing it.
g) To return to the previous image, press the Previous image button (8).
7 Stored Data options8 Previous image button
Stored Data
Incorrect
Password or User
Level
No Changes to the
Stored Data will be
Saved
6
5
Liquid ControlsReview
Cuvette BatchesDelete
Define OperatorsLastest Download
Stored Data
Define CommentsLog Input
7
8
203
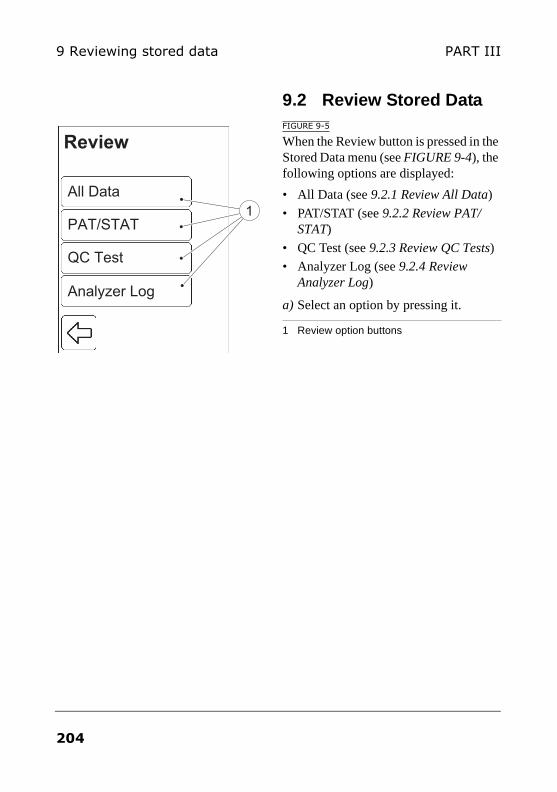
9 Reviewing stored data PART III
9.2 Review Stored DataFIGURE 9-5
When the Review button is pressed in the Stored Data menu (see FIGURE 9-4), the following options are displayed:
• All Data (see 9.2.1 Review All Data)
• PAT/STAT (see 9.2.2 Review PAT/STAT)
• QC Test (see 9.2.3 Review QC Tests)
• Analyzer Log (see 9.2.4 Review Analyzer Log)
a) Select an option by pressing it.
1 Review option buttons
Liquid ControlsAll Data
Cuvette BatchesPAT/STAT
Define OperatorsQC Test
Review
Define CommentsAnalyzer Log
1
204
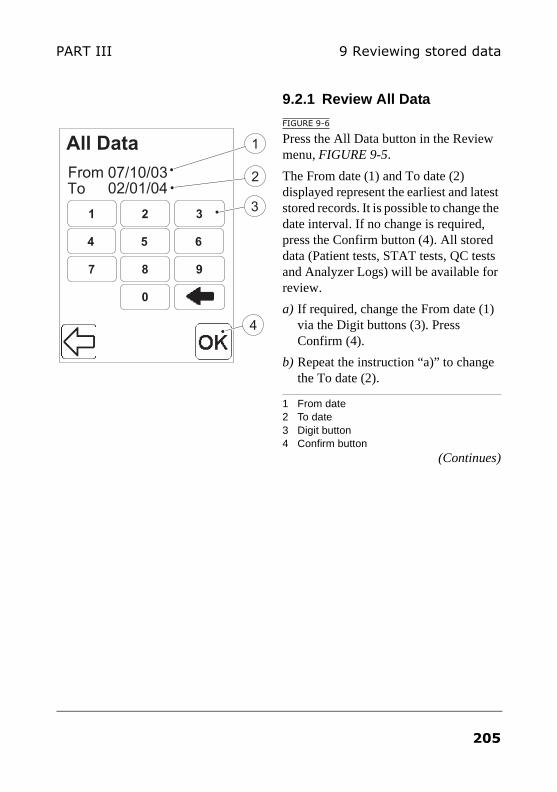
9 Reviewing stored dataPART III
9.2.1 Review All Data
FIGURE 9-6
Press the All Data button in the Review menu, FIGURE 9-5.
The From date (1) and To date (2) displayed represent the earliest and latest stored records. It is possible to change the date interval. If no change is required, press the Confirm button (4). All stored data (Patient tests, STAT tests, QC tests and Analyzer Logs) will be available for review.
a) If required, change the From date (1) via the Digit buttons (3). Press Confirm (4).
b) Repeat the instruction “a)” to change the To date (2).
1 From date2 To date3 Digit button4 Confirm button
(Continues)
0
7 98
4 65
1 32
All Data
From
4
To07/10/0302/01/04
1
3
2
205
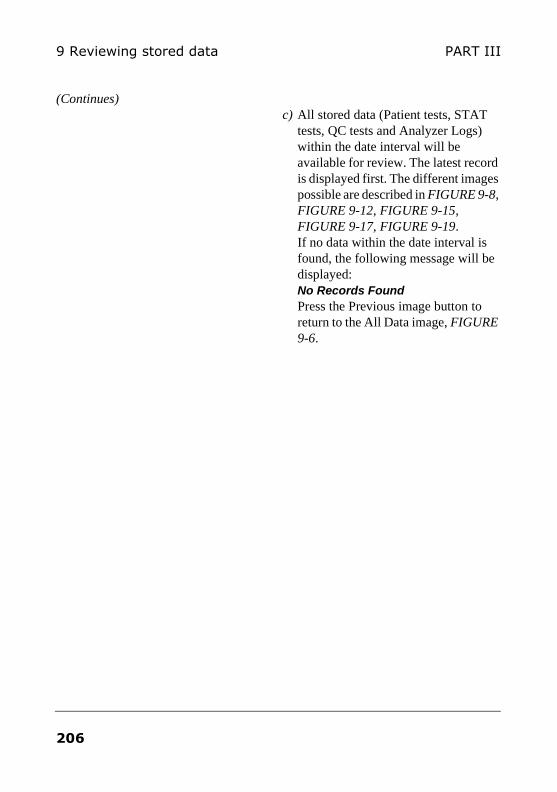
9 Reviewing stored data PART III
(Continues)c) All stored data (Patient tests, STAT
tests, QC tests and Analyzer Logs) within the date interval will be available for review. The latest record is displayed first. The different images possible are described in FIGURE 9-8, FIGURE 9-12, FIGURE 9-15, FIGURE 9-17, FIGURE 9-19. If no data within the date interval is found, the following message will be displayed: No Records Found Press the Previous image button to return to the All Data image, FIGURE 9-6.
206
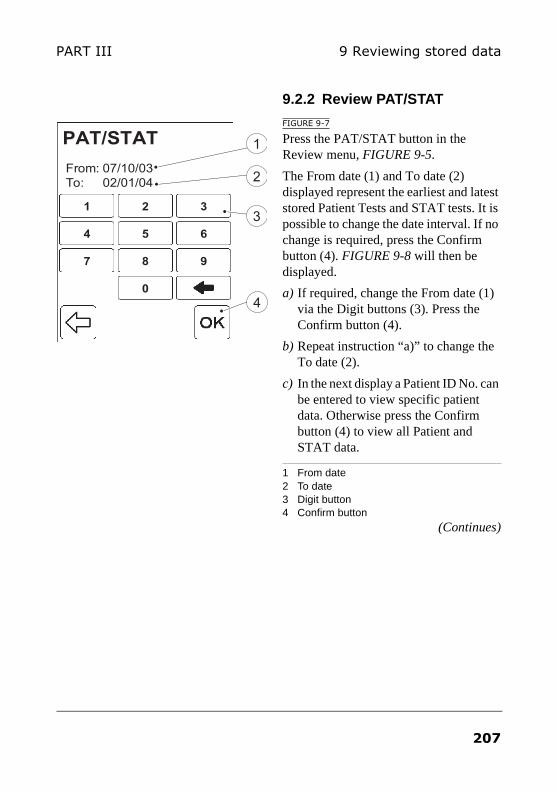
9 Reviewing stored dataPART III
9.2.2 Review PAT/STAT
FIGURE 9-7
Press the PAT/STAT button in the Review menu, FIGURE 9-5.
The From date (1) and To date (2) displayed represent the earliest and latest stored Patient Tests and STAT tests. It is possible to change the date interval. If no change is required, press the Confirm button (4). FIGURE 9-8 will then be displayed.
a) If required, change the From date (1) via the Digit buttons (3). Press the Confirm button (4).
b) Repeat instruction “a)” to change the To date (2).
c) In the next display a Patient ID No. can be entered to view specific patient data. Otherwise press the Confirm button (4) to view all Patient and STAT data.
1 From date2 To date3 Digit button4 Confirm button
(Continues)
From: 07/10/03
To: 02/01/04
PAT/STAT
1
5
2
87
4 6
9
3
0
11
55
22
8877
44 66
99
33
00
4
1
2
3
207
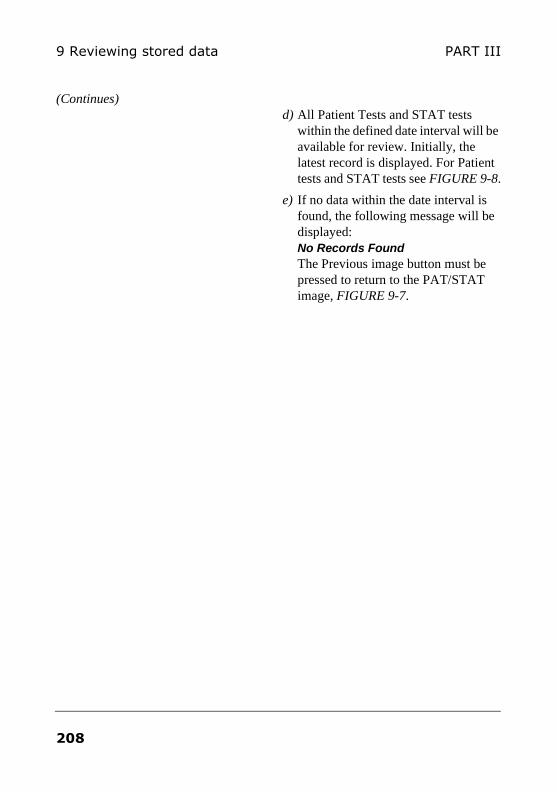
9 Reviewing stored data PART III
(Continues)d) All Patient Tests and STAT tests
within the defined date interval will be available for review. Initially, the latest record is displayed. For Patient tests and STAT tests see FIGURE 9-8.
e) If no data within the date interval is found, the following message will be displayed: No Records Found The Previous image button must be pressed to return to the PAT/STAT image, FIGURE 9-7.
208
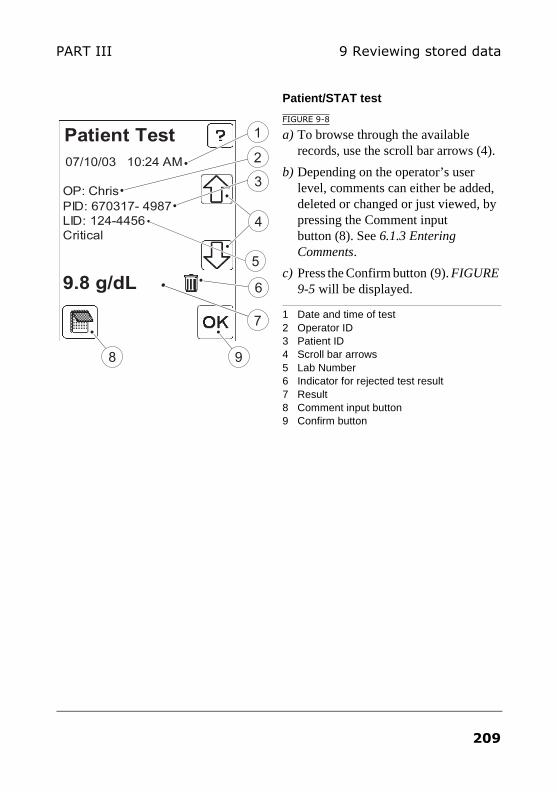
9 Reviewing stored dataPART III
Patient/STAT test
FIGURE 9-8
a) To browse through the available records, use the scroll bar arrows (4).
b) Depending on the operator’s user level, comments can either be added, deleted or changed or just viewed, by pressing the Comment input button (8). See 6.1.3 Entering Comments.
c) Press the Confirm button (9). FIGURE 9-5 will be displayed.
1 Date and time of test2 Operator ID3 Patient ID4 Scroll bar arrows5 Lab Number 6 Indicator for rejected test result7 Result8 Comment input button9 Confirm button
Patient Test
07/10/03 10:24 AM
OP: Chris
PID: 670317- 4987
LID: 124-4456
Critical
9.8 g/dL
4
1
2
3
5
8 9
6
7
209
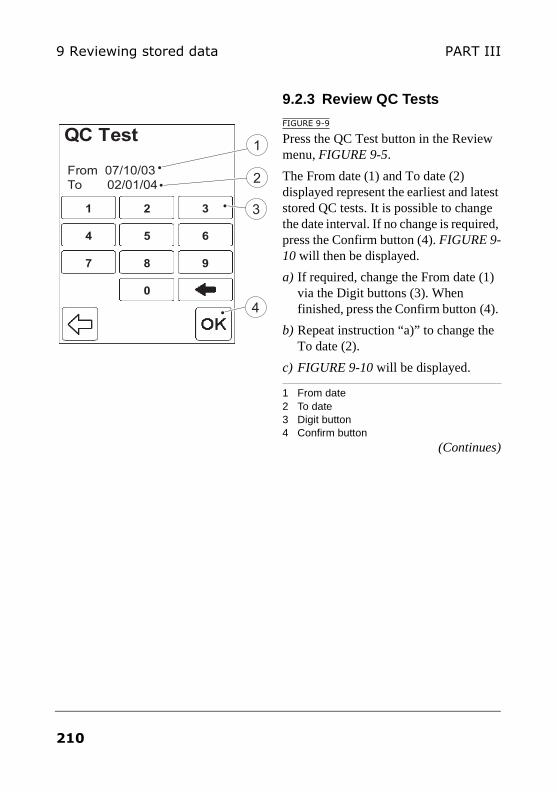
9 Reviewing stored data PART III
9.2.3 Review QC Tests
FIGURE 9-9
Press the QC Test button in the Review menu, FIGURE 9-5.
The From date (1) and To date (2) displayed represent the earliest and latest stored QC tests. It is possible to change the date interval. If no change is required, press the Confirm button (4). FIGURE 9-10 will then be displayed.
a) If required, change the From date (1) via the Digit buttons (3). When finished, press the Confirm button (4).
b) Repeat instruction “a)” to change the To date (2).
c) FIGURE 9-10 will be displayed.
1 From date2 To date3 Digit button4 Confirm button
(Continues)
From 07/10/03
To 02/01/04
QC Test
1
5
2
87
4 6
9
3
0
11
55
22
8877
44 66
99
33
00
1
2
3
4
210
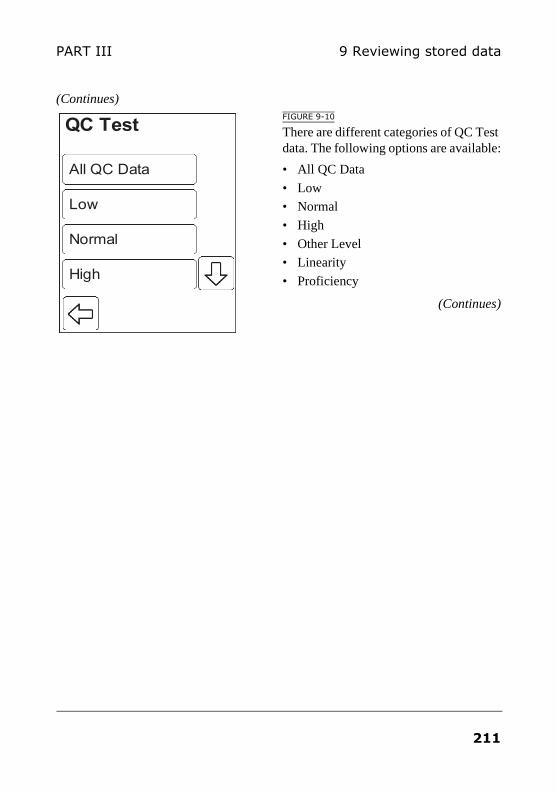
9 Reviewing stored dataPART III
(Continues)FIGURE 9-10
There are different categories of QC Test data. The following options are available:
• All QC Data
• Low
• Normal
• High
• Other Level
• Linearity
• Proficiency
(Continues)
LowLow
NormalNormal
HighHigh
QC Test
All QC DataAll QC Data
211
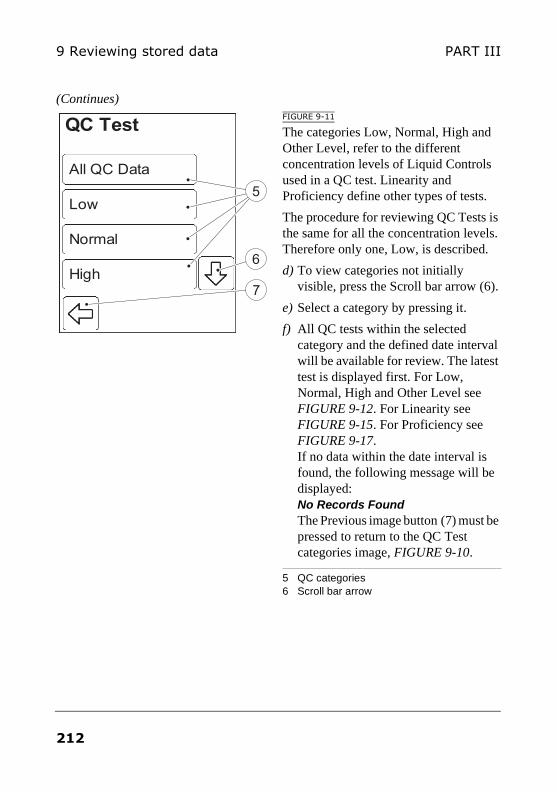
9 Reviewing stored data PART III
(Continues)FIGURE 9-11
The categories Low, Normal, High and Other Level, refer to the different concentration levels of Liquid Controls used in a QC test. Linearity and Proficiency define other types of tests.
The procedure for reviewing QC Tests is the same for all the concentration levels. Therefore only one, Low, is described.
d) To view categories not initially visible, press the Scroll bar arrow (6).
e) Select a category by pressing it.
f) All QC tests within the selected category and the defined date interval will be available for review. The latest test is displayed first. For Low, Normal, High and Other Level see FIGURE 9-12. For Linearity see FIGURE 9-15. For Proficiency see FIGURE 9-17. If no data within the date interval is found, the following message will be displayed: No Records Found The Previous image button (7) must be pressed to return to the QC Test categories image, FIGURE 9-10.
5 QC categories6 Scroll bar arrow
LowLow
NormalNormal
HighHigh
QC Test
All QC DataAll QC Data
5
6
7
212
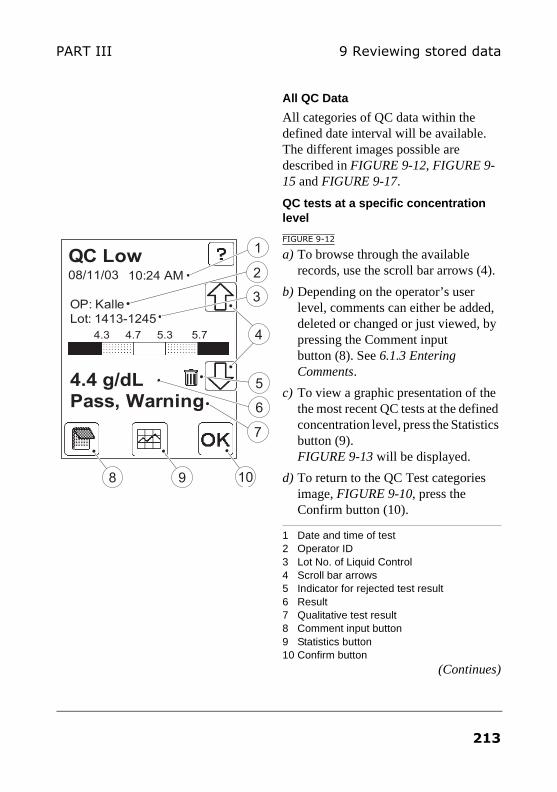
9 Reviewing stored dataPART III
All QC Data
All categories of QC data within the defined date interval will be available. The different images possible are described in FIGURE 9-12, FIGURE 9-15 and FIGURE 9-17.
QC tests at a specific concentration level
FIGURE 9-12
a) To browse through the available records, use the scroll bar arrows (4).
b) Depending on the operator’s user level, comments can either be added, deleted or changed or just viewed, by pressing the Comment input button (8). See 6.1.3 Entering Comments.
c) To view a graphic presentation of the the most recent QC tests at the defined concentration level, press the Statistics button (9). FIGURE 9-13 will be displayed.
d) To return to the QC Test categories image, FIGURE 9-10, press the Confirm button (10).
1 Date and time of test2 Operator ID3 Lot No. of Liquid Control4 Scroll bar arrows5 Indicator for rejected test result6 Result7 Qualitative test result8 Comment input button9 Statistics button10 Confirm button
(Continues)
QC Low
4.4 g/dL
Pass, Warning
08/11/03 10:24 AM
OP: Kalle
Lot: 1413-1245
4
8
1
2
9
4.3 4.7 5.3 5.7
10
3
6
5
7
213
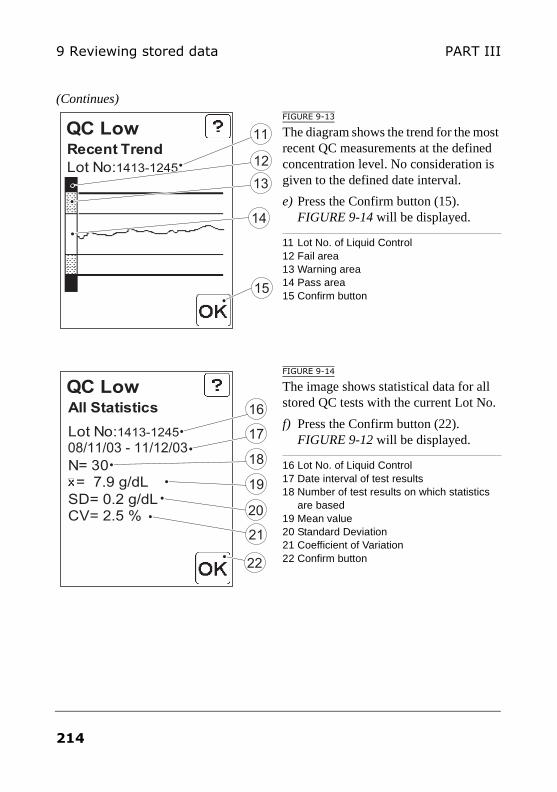
9 Reviewing stored data PART III
(Continues)FIGURE 9-13
The diagram shows the trend for the most recent QC measurements at the defined concentration level. No consideration is given to the defined date interval.
e) Press the Confirm button (15). FIGURE 9-14 will be displayed.
11 Lot No. of Liquid Control 12 Fail area13 Warning area14 Pass area15 Confirm button
FIGURE 9-14
The image shows statistical data for all stored QC tests with the current Lot No.
f) Press the Confirm button (22). FIGURE 9-12 will be displayed.
16 Lot No. of Liquid Control 17 Date interval of test results18 Number of test results on which statistics
are based19 Mean value20 Standard Deviation21 Coefficient of Variation22 Confirm button
QC LowRecent Trend
Lot No:1413-1245
11
15
13
14
12
QC LowAll Statistics
Lot No:1413-1245
N= 30= 7.9 g/dL
SD= 0.2 g/dLCV= 2.5 %
16
18
19
21
08/11/03 - 11/12/0317
22
20
214
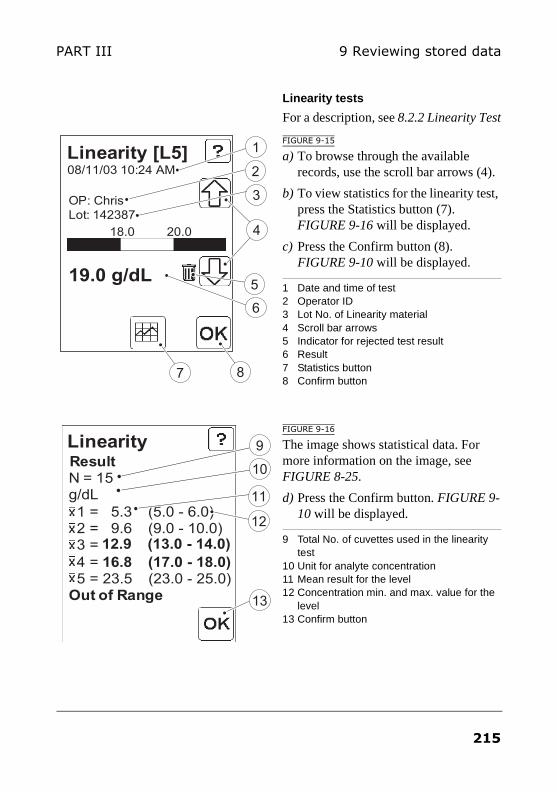
9 Reviewing stored dataPART III
Linearity tests
For a description, see 8.2.2 Linearity Test
FIGURE 9-15
a) To browse through the available records, use the scroll bar arrows (4).
b) To view statistics for the linearity test, press the Statistics button (7). FIGURE 9-16 will be displayed.
c) Press the Confirm button (8). FIGURE 9-10 will be displayed.
1 Date and time of test2 Operator ID3 Lot No. of Linearity material4 Scroll bar arrows5 Indicator for rejected test result6 Result7 Statistics button8 Confirm button
FIGURE 9-16
The image shows statistical data. For more information on the image, see FIGURE 8-25.
d) Press the Confirm button. FIGURE 9-10 will be displayed.
9 Total No. of cuvettes used in the linearity test
10 Unit for analyte concentration11 Mean result for the level12 Concentration min. and max. value for the
level13 Confirm button
Linearity [L5]
19.0 g/dL
18.0 20.0
08/11/03 10:24 AM
OP: Chris
Lot: 142387
4
1
2
7
3
6
5
8
Linearity Result
N = 15g/dL
1 = 5.3 (5.0 - 6.0) 2 = 9.6 (9.0 - 10.0)3 = 12.9 (13.0 - 14.0)
4 = 16.8 (17.0 - 18.0)
5 = 23.5 (23.0 - 25.0) Out of Range
9
11
12
10
13
215
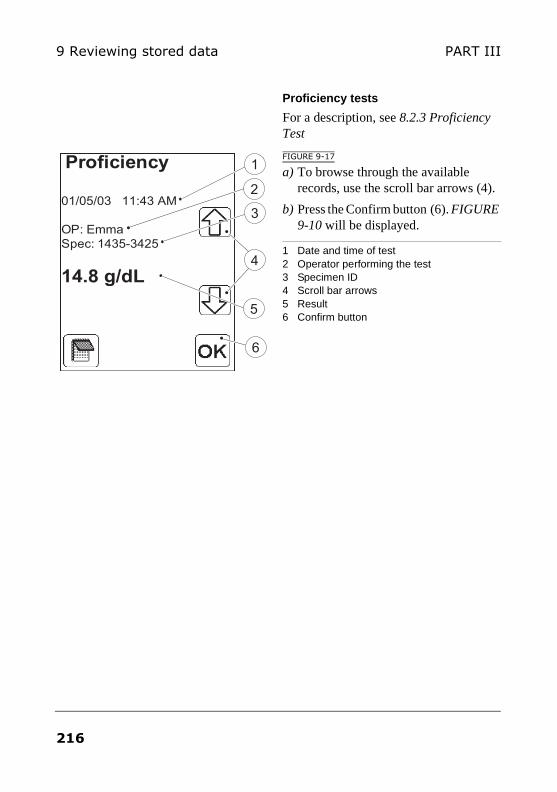
9 Reviewing stored data PART III
Proficiency tests
For a description, see 8.2.3 Proficiency Test
FIGURE 9-17
a) To browse through the available records, use the scroll bar arrows (4).
b) Press the Confirm button (6). FIGURE 9-10 will be displayed.
1 Date and time of test2 Operator performing the test3 Specimen ID4 Scroll bar arrows5 Result6 Confirm button
Proficiency
01/05/03 11:43 AM
OP: Emma
Spec: 1435-3425
14.8 g/dL4
1
2
3
5
6
216
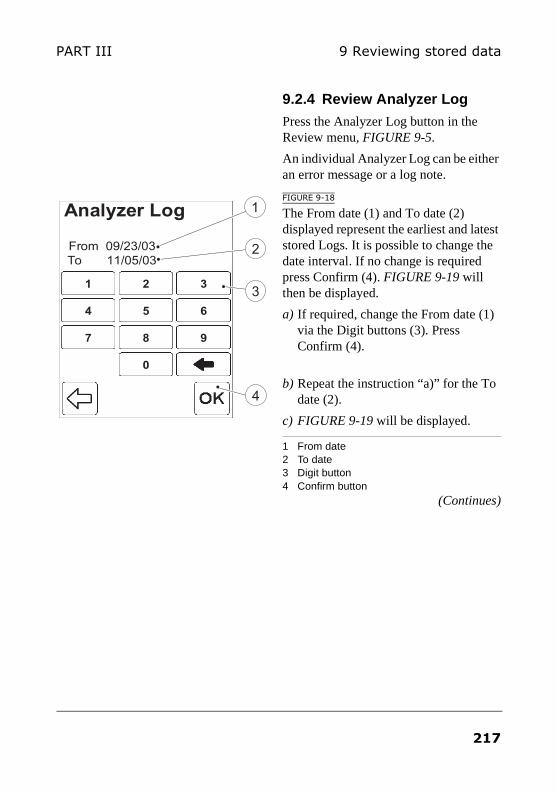
9 Reviewing stored dataPART III
9.2.4 Review Analyzer Log
Press the Analyzer Log button in the Review menu, FIGURE 9-5.
An individual Analyzer Log can be either an error message or a log note.
FIGURE 9-18
The From date (1) and To date (2) displayed represent the earliest and latest stored Logs. It is possible to change the date interval. If no change is required press Confirm (4). FIGURE 9-19 will then be displayed.
a) If required, change the From date (1) via the Digit buttons (3). Press Confirm (4).
b) Repeat the instruction “a)” for the To date (2).
c) FIGURE 9-19 will be displayed.
1 From date2 To date3 Digit button4 Confirm button
(Continues)
From 09/23/03
To 11/05/03
Analyzer Log
1
5
2
87
4 6
9
3
0
11
55
22
8877
44 66
99
33
00
2
3
4
1
217
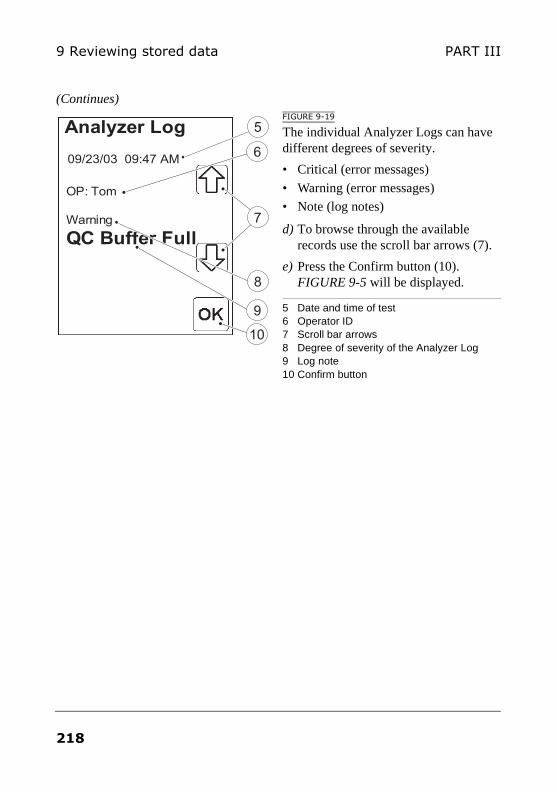
9 Reviewing stored data PART III
(Continues)FIGURE 9-19
The individual Analyzer Logs can have different degrees of severity.
• Critical (error messages)
• Warning (error messages)
• Note (log notes)
d) To browse through the available records use the scroll bar arrows (7).
e) Press the Confirm button (10). FIGURE 9-5 will be displayed.
5 Date and time of test6 Operator ID7 Scroll bar arrows8 Degree of severity of the Analyzer Log9 Log note10 Confirm button
Analyzer Log
OP: Tom
Warning
QC Buffer Full
7
5
6
9
8
09/23/03 09:47 AM
10
218
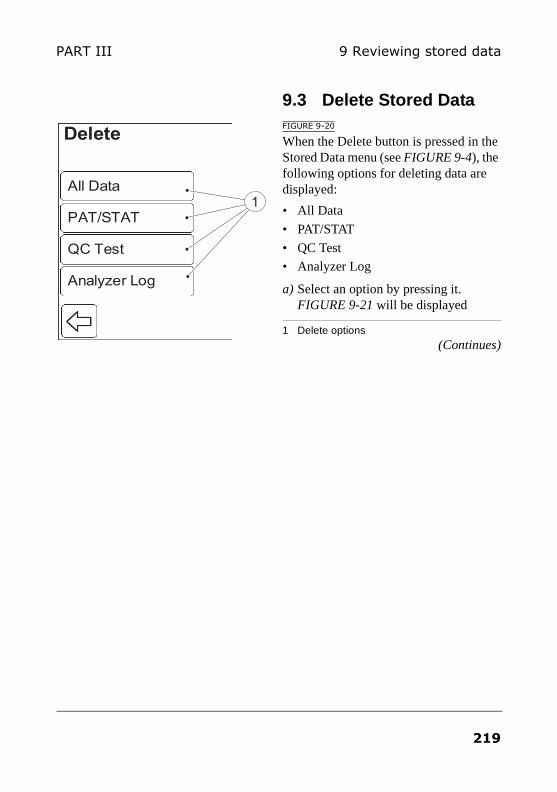
9 Reviewing stored dataPART III
9.3 Delete Stored DataFIGURE 9-20
When the Delete button is pressed in the Stored Data menu (see FIGURE 9-4), the following options for deleting data are displayed:
• All Data
• PAT/STAT
• QC Test
• Analyzer Log
a) Select an option by pressing it. FIGURE 9-21 will be displayed
1 Delete options(Continues)
PAT/STATPAT/STAT
QC TestQC Test
Analyser LogAnalyzer Log
Delete
All DataAll Data1
219
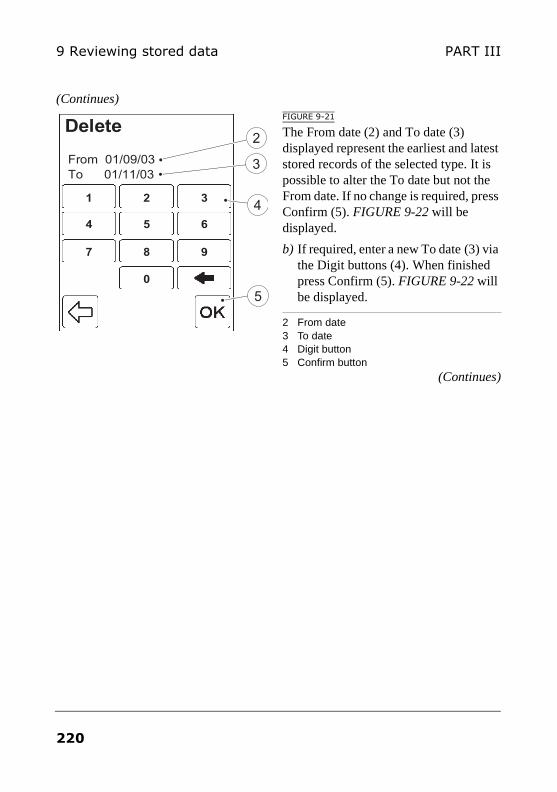
9 Reviewing stored data PART III
(Continues)FIGURE 9-21
The From date (2) and To date (3) displayed represent the earliest and latest stored records of the selected type. It is possible to alter the To date but not the From date. If no change is required, press Confirm (5). FIGURE 9-22 will be displayed.
b) If required, enter a new To date (3) via the Digit buttons (4). When finished press Confirm (5). FIGURE 9-22 will be displayed.
2 From date3 To date4 Digit button5 Confirm button
(Continues)
From 01/09/03
To 01/11/03
Delete
1
5
2
87
4 6
9
3
0
11
55
22
8877
44 66
99
33
00
5
2
3
4
220
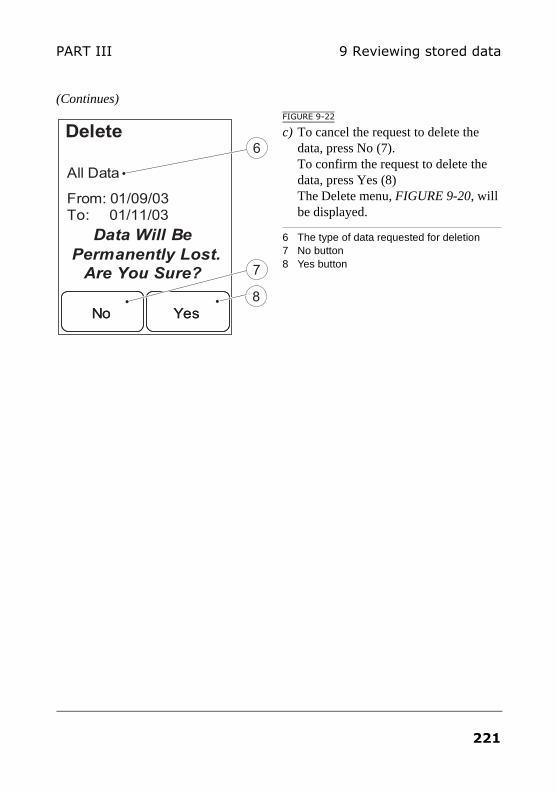
9 Reviewing stored dataPART III
(Continues)FIGURE 9-22
c) To cancel the request to delete the data, press No (7). To confirm the request to delete the data, press Yes (8) The Delete menu, FIGURE 9-20, will be displayed.
6 The type of data requested for deletion7 No button8 Yes button
Delete
NoNo YesYes
Data Will Be
Permanently Lost.
Are You Sure?
All Data
From: 01/09/03To: 01/11/03
8
6
7
221
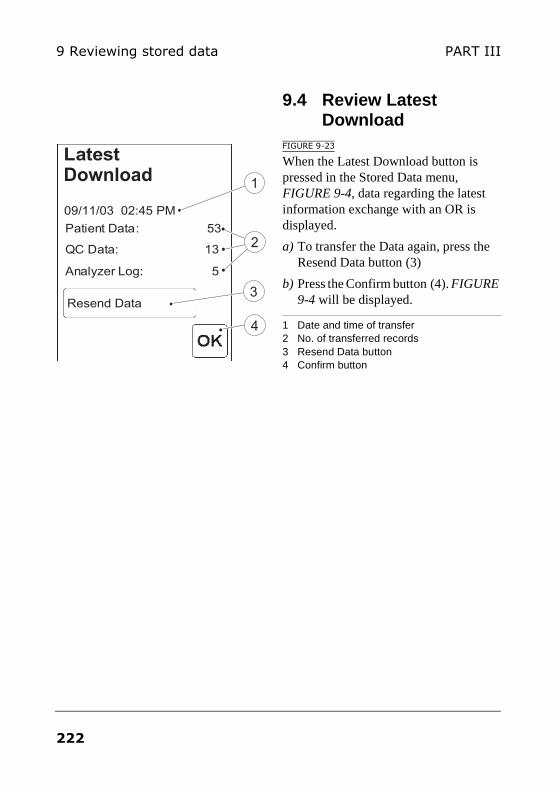
9 Reviewing stored data PART III
9.4 Review Latest Download
FIGURE 9-23
When the Latest Download button is pressed in the Stored Data menu, FIGURE 9-4, data regarding the latest information exchange with an OR is displayed.
a) To transfer the Data again, press the Resend Data button (3)
b) Press the Confirm button (4). FIGURE 9-4 will be displayed.
1 Date and time of transfer2 No. of transferred records 3 Resend Data button4 Confirm button
Latest
Patient Data: 53
QC Data: 13
Analyzer Log: 5
1
2
09/11/03 02:45 PM
Resend Data
4
3
Download
222
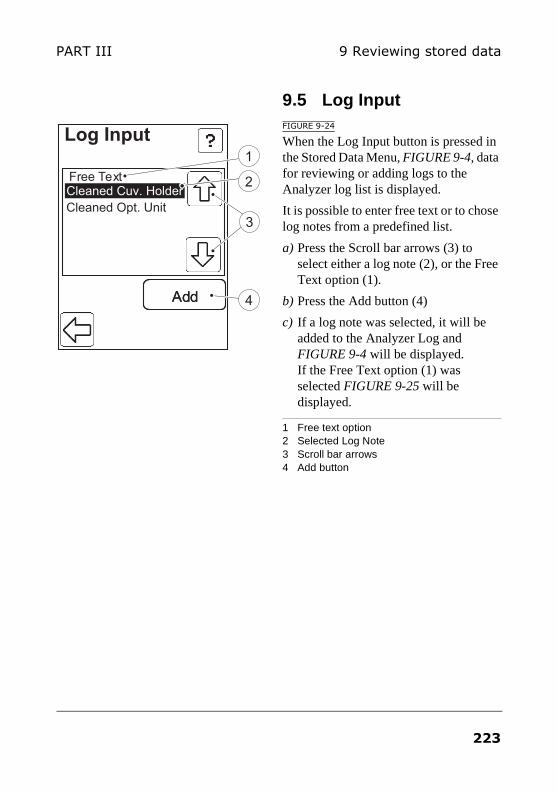
9 Reviewing stored dataPART III
9.5 Log InputFIGURE 9-24
When the Log Input button is pressed in the Stored Data Menu, FIGURE 9-4, data for reviewing or adding logs to the Analyzer log list is displayed.
It is possible to enter free text or to chose log notes from a predefined list.
a) Press the Scroll bar arrows (3) to select either a log note (2), or the Free Text option (1).
b) Press the Add button (4)
c) If a log note was selected, it will be added to the Analyzer Log and FIGURE 9-4 will be displayed. If the Free Text option (1) was selected FIGURE 9-25 will be displayed.
1 Free text option2 Selected Log Note3 Scroll bar arrows4 Add button
Log Input
AddAdd
Free Text
Cleaned Opt. Unit
Free TextCleaned Cuv. Holder
1
4
3
2
223
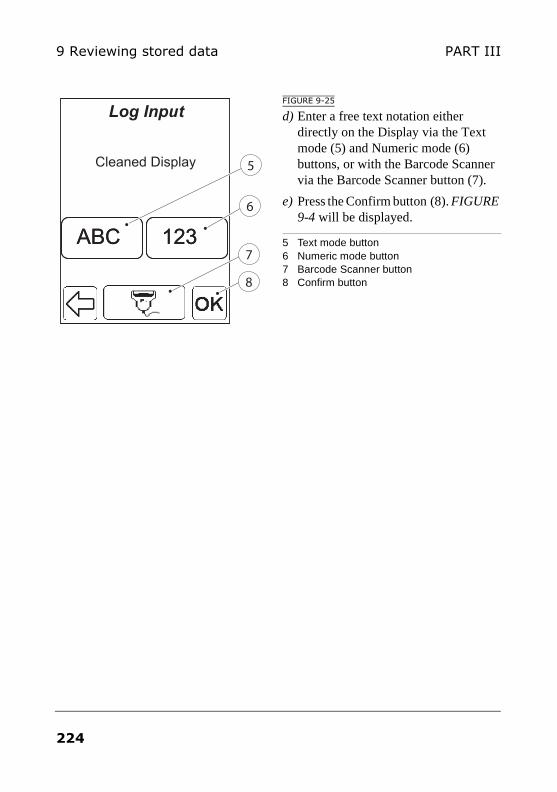
9 Reviewing stored data PART III
FIGURE 9-25
d) Enter a free text notation either directly on the Display via the Text mode (5) and Numeric mode (6) buttons, or with the Barcode Scanner via the Barcode Scanner button (7).
e) Press the Confirm button (8). FIGURE 9-4 will be displayed.
5 Text mode button6 Numeric mode button7 Barcode Scanner button8 Confirm button
Log Input
123123ABCABC
5
6
7
8
Cleaned Display
224
10 Data communicationsPART III
10 Data communications
10.1 Interaction Application – Analyzer
Specially developed DMS Software is necessary to provide full data management for the Analyzers. Results of measurement are transferred to the DMS Software for storage and evaluation. Settings in an Analyzer can be updated from the DMS Software.
The Analyzer must be placed in a Docking Station that is connencted to a PC or to an Observation Reviewer (OR) to facilitate communication with the DMS Software or OR.
Depending on the settings, one or several Analyzers can be connected and administered by the same PC via the Docking Stations (see 10.2 Docking station setup).
This chapter briefly describes the data communication between the Analyzers and the DMS Software.
225
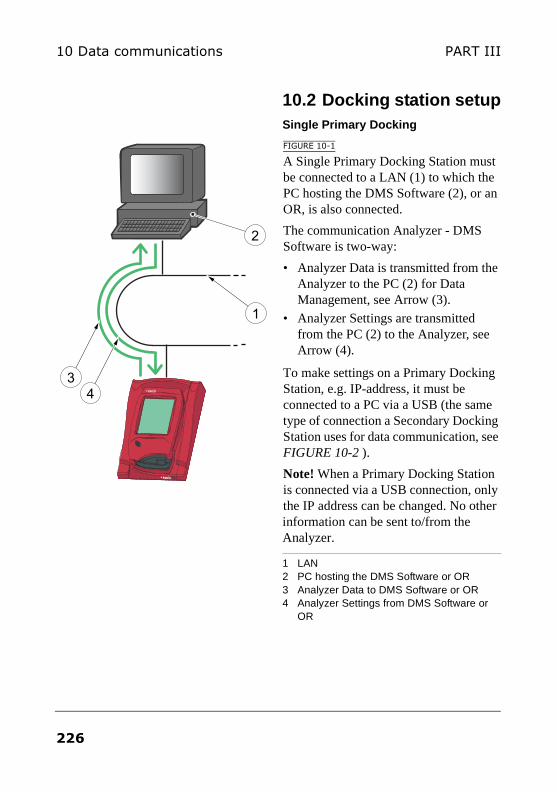
10 Data communications PART III
10.2 Docking station setupSingle Primary Docking
FIGURE 10-1
A Single Primary Docking Station must be connected to a LAN (1) to which the PC hosting the DMS Software (2), or an OR, is also connected.
The communication Analyzer - DMS Software is two-way:
• Analyzer Data is transmitted from the Analyzer to the PC (2) for Data Management, see Arrow (3).
• Analyzer Settings are transmitted from the PC (2) to the Analyzer, see Arrow (4).
To make settings on a Primary Docking Station, e.g. IP-address, it must be connected to a PC via a USB (the same type of connection a Secondary Docking Station uses for data communication, see FIGURE 10-2 ).
Note! When a Primary Docking Station is connected via a USB connection, only the IP address can be changed. No other information can be sent to/from the Analyzer.
1 LAN2 PC hosting the DMS Software or OR3 Analyzer Data to DMS Software or OR4 Analyzer Settings from DMS Software or
OR
34
1
2
226
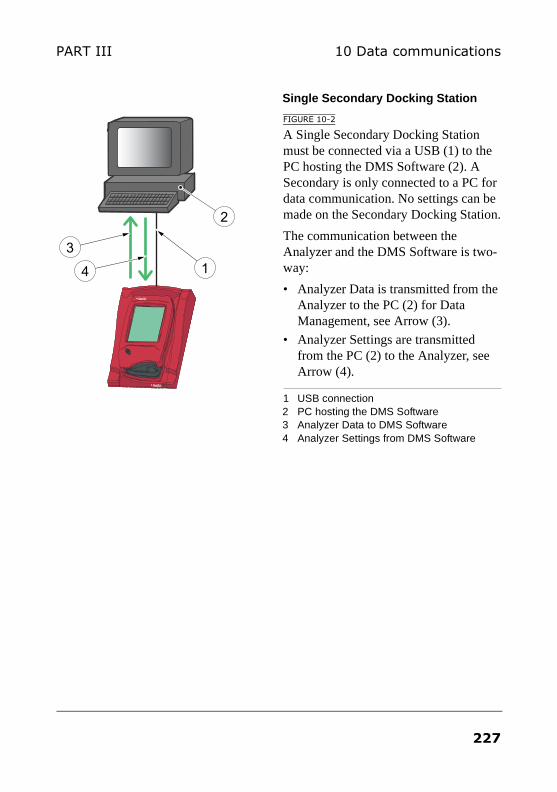
10 Data communicationsPART III
Single Secondary Docking Station
FIGURE 10-2
A Single Secondary Docking Station must be connected via a USB (1) to the PC hosting the DMS Software (2). A Secondary is only connected to a PC for data communication. No settings can be made on the Secondary Docking Station.
The communication between the Analyzer and the DMS Software is two-way:
• Analyzer Data is transmitted from the Analyzer to the PC (2) for Data Management, see Arrow (3).
• Analyzer Settings are transmitted from the PC (2) to the Analyzer, see Arrow (4).
1 USB connection2 PC hosting the DMS Software3 Analyzer Data to DMS Software4 Analyzer Settings from DMS Software
2
1
3
4
227
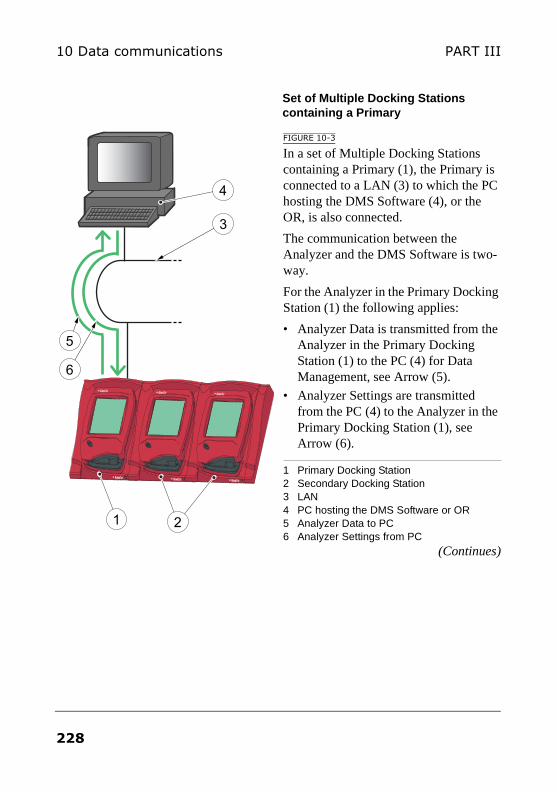
10 Data communications PART III
Set of Multiple Docking Stations containing a Primary
FIGURE 10-3
In a set of Multiple Docking Stations containing a Primary (1), the Primary is connected to a LAN (3) to which the PC hosting the DMS Software (4), or the OR, is also connected.
The communication between the Analyzer and the DMS Software is two-way.
For the Analyzer in the Primary Docking Station (1) the following applies:
• Analyzer Data is transmitted from the Analyzer in the Primary Docking Station (1) to the PC (4) for Data Management, see Arrow (5).
• Analyzer Settings are transmitted from the PC (4) to the Analyzer in the Primary Docking Station (1), see Arrow (6).
1 Primary Docking Station2 Secondary Docking Station3 LAN4 PC hosting the DMS Software or OR5 Analyzer Data to PC6 Analyzer Settings from PC
(Continues)
1
6
5
4
2
3
228
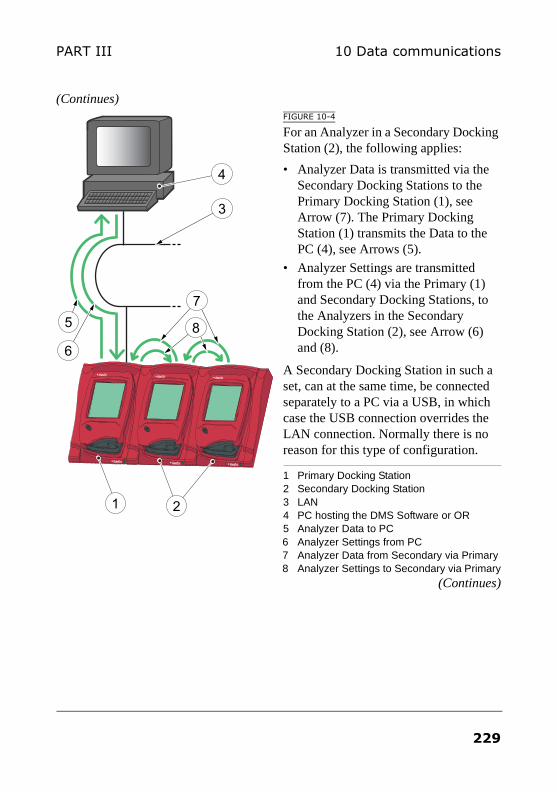
10 Data communicationsPART III
(Continues)FIGURE 10-4
For an Analyzer in a Secondary Docking Station (2), the following applies:
• Analyzer Data is transmitted via the Secondary Docking Stations to the Primary Docking Station (1), see Arrow (7). The Primary Docking Station (1) transmits the Data to the PC (4), see Arrows (5).
• Analyzer Settings are transmitted from the PC (4) via the Primary (1) and Secondary Docking Stations, to the Analyzers in the Secondary Docking Station (2), see Arrow (6) and (8).
A Secondary Docking Station in such a set, can at the same time, be connected separately to a PC via a USB, in which case the USB connection overrides the LAN connection. Normally there is no reason for this type of configuration.
1 Primary Docking Station2 Secondary Docking Station3 LAN4 PC hosting the DMS Software or OR5 Analyzer Data to PC6 Analyzer Settings from PC7 Analyzer Data from Secondary via Primary8 Analyzer Settings to Secondary via Primary
(Continues)
1
6
5
4
2
3
7
8
229
10 Data communications PART III
(Continues)To make settings on the Primary Docking Station in such a set, e.g. the IP-address, it must be directly connected to a PC via a USB (the same type of connection a Secondary Docking Station uses for data communication, see FIGURE 10-2).
230
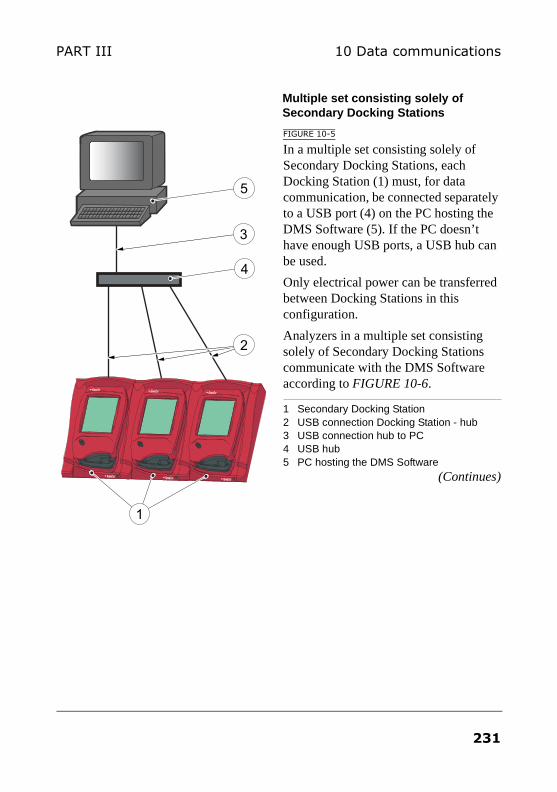
10 Data communicationsPART III
Multiple set consisting solely of Secondary Docking Stations
FIGURE 10-5
In a multiple set consisting solely of Secondary Docking Stations, each Docking Station (1) must, for data communication, be connected separately to a USB port (4) on the PC hosting the DMS Software (5). If the PC doesn’t have enough USB ports, a USB hub can be used.
Only electrical power can be transferred between Docking Stations in this configuration.
Analyzers in a multiple set consisting solely of Secondary Docking Stations communicate with the DMS Software according to FIGURE 10-6.
1 Secondary Docking Station2 USB connection Docking Station - hub3 USB connection hub to PC4 USB hub5 PC hosting the DMS Software
(Continues)
5
1
4
2
3
231
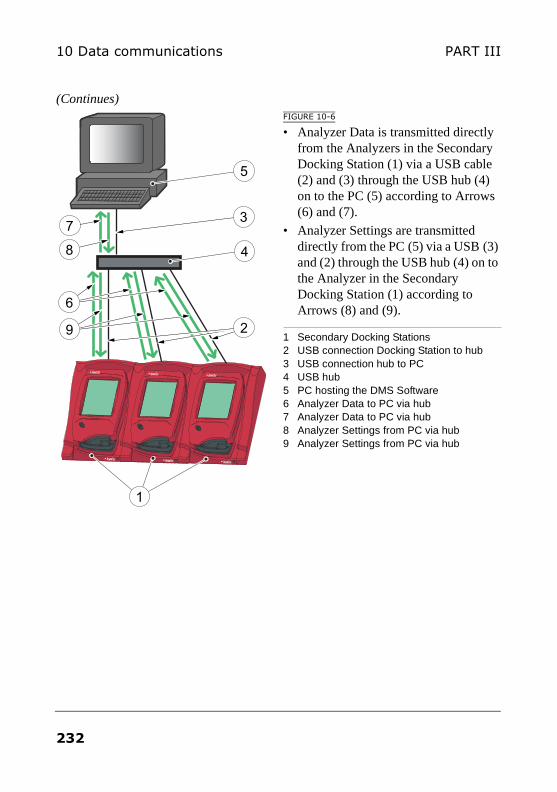
10 Data communications PART III
(Continues)FIGURE 10-6
• Analyzer Data is transmitted directly from the Analyzers in the Secondary Docking Station (1) via a USB cable (2) and (3) through the USB hub (4) on to the PC (5) according to Arrows (6) and (7).
• Analyzer Settings are transmitted directly from the PC (5) via a USB (3) and (2) through the USB hub (4) on to the Analyzer in the Secondary Docking Station (1) according to Arrows (8) and (9).
1 Secondary Docking Stations2 USB connection Docking Station to hub3 USB connection hub to PC4 USB hub5 PC hosting the DMS Software6 Analyzer Data to PC via hub7 Analyzer Data to PC via hub 8 Analyzer Settings from PC via hub9 Analyzer Settings from PC via hub
5
1
4
6
29
37
8
232
10 Data communicationsPART III
10.3 Data transferAnalyzers can be administered by the DMS Software from a central PC. The central PC can communicate with several Analyzers at the same time. The communication between the DMS Software and the Analyzer is two-way, using the POCT1-A standard (also known as the CIC standard).
Data transfer from the PC to an Analyzer is activated manually from the DMS Software.
Data transfer from an Analyzer to the PC is activated automatically when a data communications connection is established by placing an Analyzer in a docking station connected to the PC. If the Analyzer is busy with a measurement when the connection is established, data transfer will start as soon as the measurement is completed.
Data transfer from an Analyzer to the PC will always contain measurement results not already transferred.
During the activation and data exchange process a number of images can/will appear on the Analyzer Display.
233
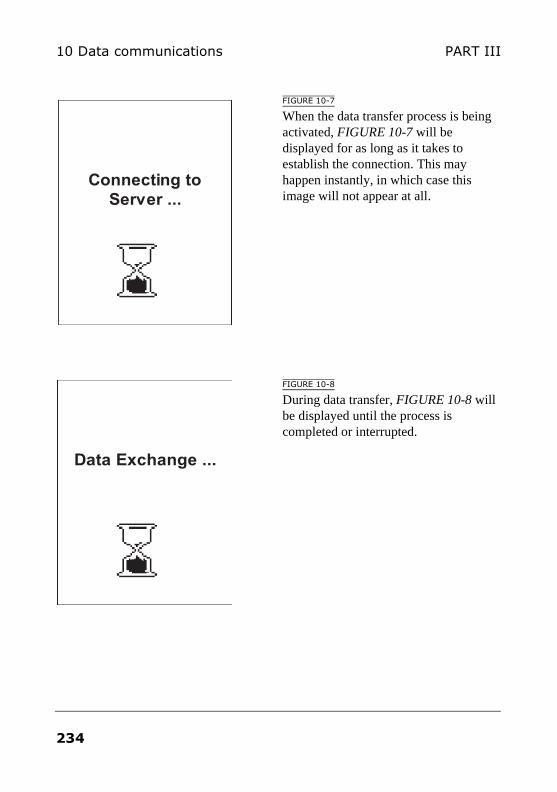
10 Data communications PART III
FIGURE 10-7
When the data transfer process is being activated, FIGURE 10-7 will be displayed for as long as it takes to establish the connection. This may happen instantly, in which case this image will not appear at all.
FIGURE 10-8
During data transfer, FIGURE 10-8 will be displayed until the process is completed or interrupted.
Connecting to
Server ...
Data Exchange ...
234
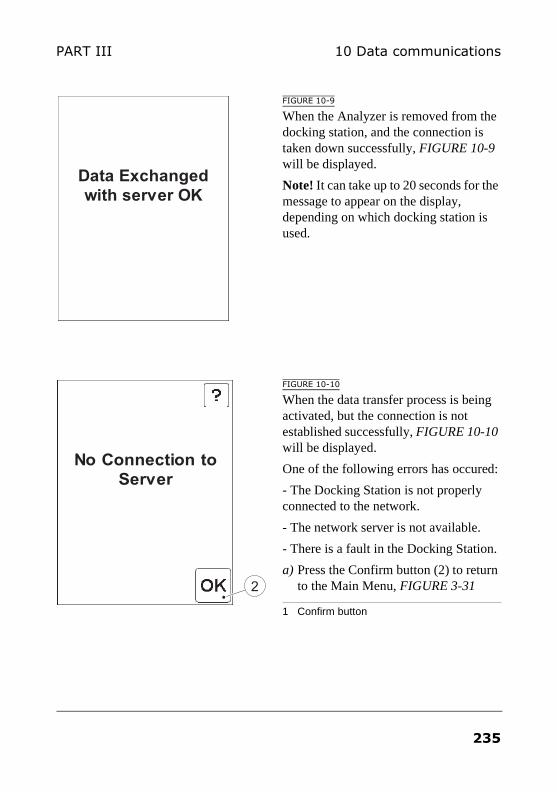
10 Data communicationsPART III
FIGURE 10-9
When the Analyzer is removed from the docking station, and the connection is taken down successfully, FIGURE 10-9 will be displayed.
Note! It can take up to 20 seconds for the message to appear on the display, depending on which docking station is used.
FIGURE 10-10
When the data transfer process is being activated, but the connection is not established successfully, FIGURE 10-10 will be displayed.
One of the following errors has occured:
- The Docking Station is not properly connected to the network.
- The network server is not available.
- There is a fault in the Docking Station.
a) Press the Confirm button (2) to return to the Main Menu, FIGURE 3-31
1 Confirm button
Data Exchanged
with server OK
No Connection to
Server
2
235
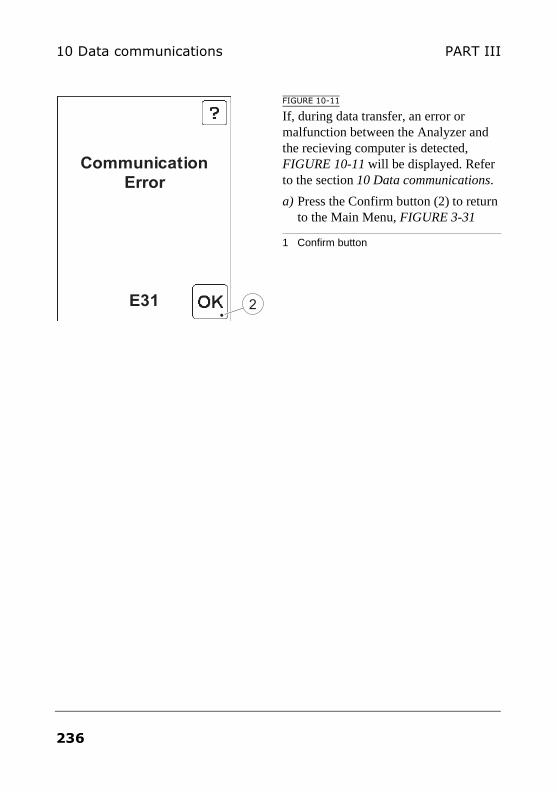
10 Data communications PART III
FIGURE 10-11
If, during data transfer, an error or malfunction between the Analyzer and the recieving computer is detected, FIGURE 10-11 will be displayed. Refer to the section 10 Data communications.
a) Press the Confirm button (2) to return to the Main Menu, FIGURE 3-31
1 Confirm button
Communication
Error
E31 2
236

PART IV Other actions
QC Memory Full. No more QC datacan be saved
E27
QC Memory Full. No more QC datacan be saved
E27 OK
?
Hb 201 DM

PART IV
This page intentionally left blank
238
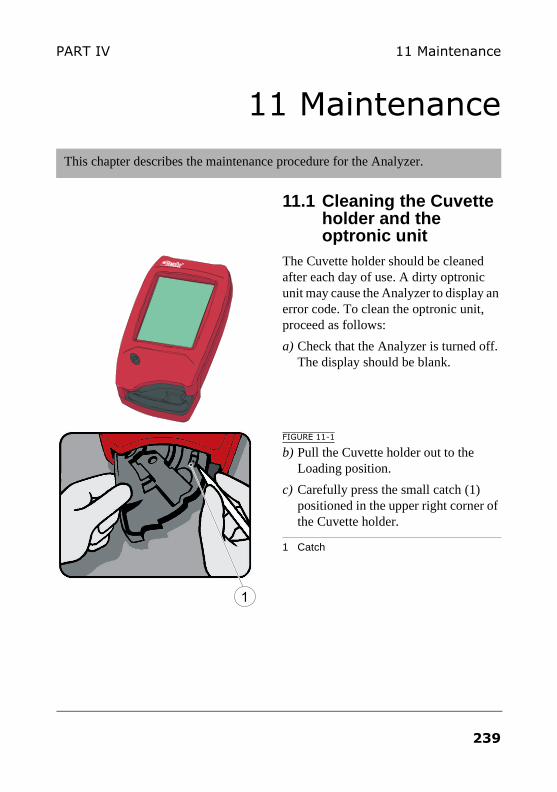
11 MaintenancePART IV
11 Maintenance
11.1 Cleaning the Cuvette holder and the optronic unit
The Cuvette holder should be cleaned after each day of use. A dirty optronic unit may cause the Analyzer to display an error code. To clean the optronic unit, proceed as follows:
a) Check that the Analyzer is turned off. The display should be blank.
FIGURE 11-1
b) Pull the Cuvette holder out to the Loading position.
c) Carefully press the small catch (1) positioned in the upper right corner of the Cuvette holder.
1 Catch
This chapter describes the maintenance procedure for the Analyzer.
1
239
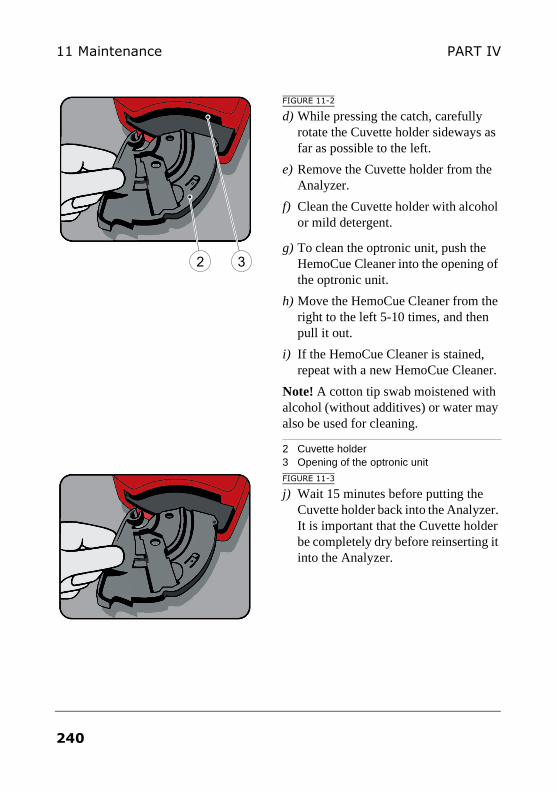
11 Maintenance PART IV
FIGURE 11-2
d) While pressing the catch, carefully rotate the Cuvette holder sideways as far as possible to the left.
e) Remove the Cuvette holder from the Analyzer.
f) Clean the Cuvette holder with alcohol or mild detergent.
g) To clean the optronic unit, push the HemoCue Cleaner into the opening of the optronic unit.
h) Move the HemoCue Cleaner from the right to the left 5-10 times, and then pull it out.
i) If the HemoCue Cleaner is stained, repeat with a new HemoCue Cleaner.
Note! A cotton tip swab moistened with alcohol (without additives) or water may also be used for cleaning.
2 Cuvette holder3 Opening of the optronic unit
FIGURE 11-3
j) Wait 15 minutes before putting the Cuvette holder back into the Analyzer. It is important that the Cuvette holder be completely dry before reinserting it into the Analyzer.
2 3
240
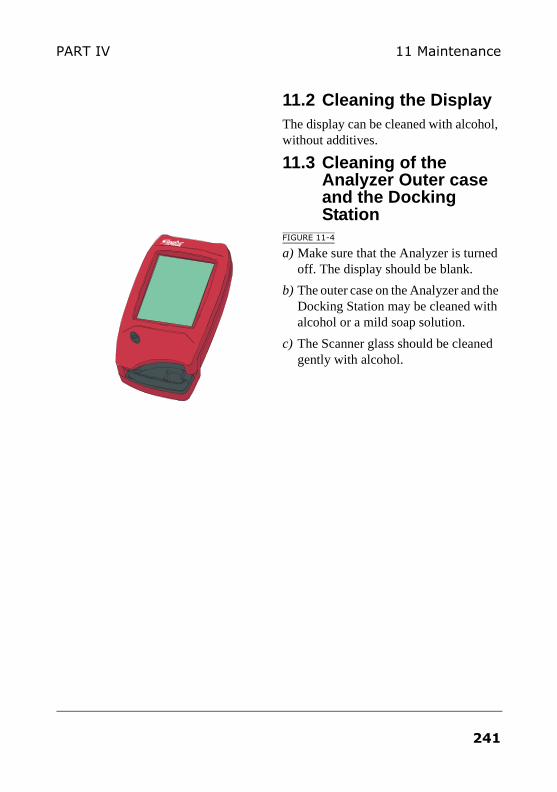
11 MaintenancePART IV
11.2 Cleaning the DisplayThe display can be cleaned with alcohol, without additives.
11.3 Cleaning of the Analyzer Outer case and the Docking Station
FIGURE 11-4
a) Make sure that the Analyzer is turned off. The display should be blank.
b) The outer case on the Analyzer and the Docking Station may be cleaned with alcohol or a mild soap solution.
c) The Scanner glass should be cleaned gently with alcohol.
241
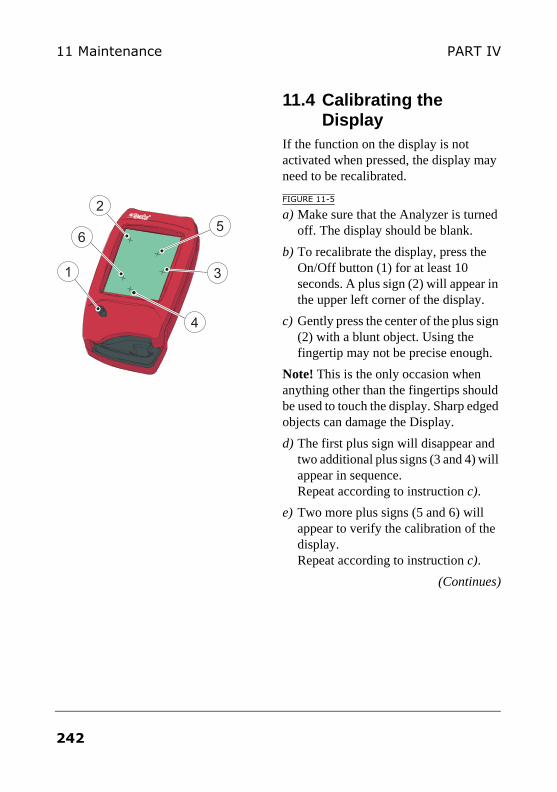
11 Maintenance PART IV
11.4 Calibrating the Display
If the function on the display is not activated when pressed, the display may need to be recalibrated.
FIGURE 11-5
a) Make sure that the Analyzer is turned off. The display should be blank.
b) To recalibrate the display, press the On/Off button (1) for at least 10 seconds. A plus sign (2) will appear in the upper left corner of the display.
c) Gently press the center of the plus sign (2) with a blunt object. Using the fingertip may not be precise enough.
Note! This is the only occasion when anything other than the fingertips should be used to touch the display. Sharp edged objects can damage the Display.
d) The first plus sign will disappear and two additional plus signs (3 and 4) will appear in sequence. Repeat according to instruction c).
e) Two more plus signs (5 and 6) will appear to verify the calibration of the display. Repeat according to instruction c).
(Continues)
1
2
4
3
56
242
11 MaintenancePART IV
(Continues)f) If the verification of the calibration is
successful, the Analyzer will continue with the normal startup. If the verification of the calibration fails, then the display calibration procedure will start over again. If the procedure fails more than five times the normal startup procedure will continue, but the Analyzer probably needs service
1 On/Off button2 Plus sign3 Plus sign4 Plus sign5 Plus sign6 Plus sign
243

11 Maintenance PART IV
This page intentionally left blank
244
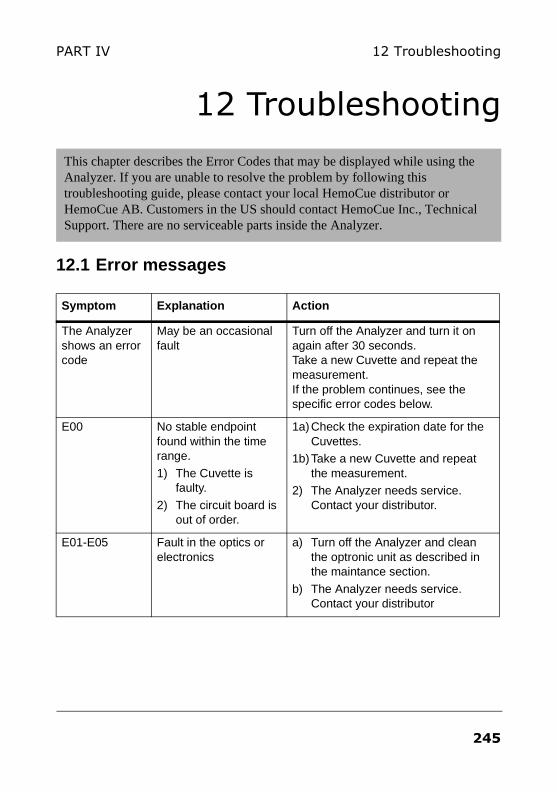
12 TroubleshootingPART IV
12 Troubleshooting
12.1 Error messages
This chapter describes the Error Codes that may be displayed while using the Analyzer. If you are unable to resolve the problem by following this troubleshooting guide, please contact your local HemoCue distributor or HemoCue AB. Customers in the US should contact HemoCue Inc., Technical Support. There are no serviceable parts inside the Analyzer.
Symptom Explanation Action
The Analyzer shows an error code
May be an occasional fault
Turn off the Analyzer and turn it on again after 30 seconds. Take a new Cuvette and repeat the measurement. If the problem continues, see the specific error codes below.
E00 No stable endpoint found within the time range.
1) The Cuvette is faulty.
2) The circuit board is out of order.
1a)Check the expiration date for the Cuvettes.
1b)Take a new Cuvette and repeat the measurement.
2) The Analyzer needs service. Contact your distributor.
E01-E05 Fault in the optics or electronics
a) Turn off the Analyzer and clean the optronic unit as described in the maintance section.
b) The Analyzer needs service. Contact your distributor
245
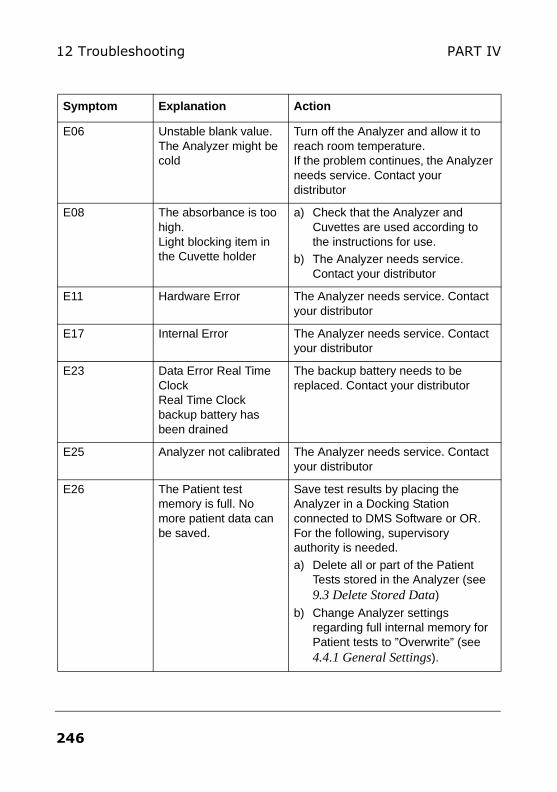
12 Troubleshooting PART IV
E06 Unstable blank value. The Analyzer might be cold
Turn off the Analyzer and allow it to reach room temperature. If the problem continues, the Analyzer needs service. Contact your distributor
E08 The absorbance is too high.Light blocking item in the Cuvette holder
a) Check that the Analyzer and Cuvettes are used according to the instructions for use.
b) The Analyzer needs service. Contact your distributor
E11 Hardware Error The Analyzer needs service. Contact your distributor
E17 Internal Error The Analyzer needs service. Contact your distributor
E23 Data Error Real Time Clock Real Time Clock backup battery has been drained
The backup battery needs to be replaced. Contact your distributor
E25 Analyzer not calibrated The Analyzer needs service. Contact your distributor
E26 The Patient test memory is full. No more patient data can be saved.
Save test results by placing the Analyzer in a Docking Station connected to DMS Software or OR. For the following, supervisory authority is needed.
a) Delete all or part of the Patient Tests stored in the Analyzer (see 9.3 Delete Stored Data)
b) Change Analyzer settings regarding full internal memory for Patient tests to ”Overwrite” (see 4.4.1 General Settings).
Symptom Explanation Action
246
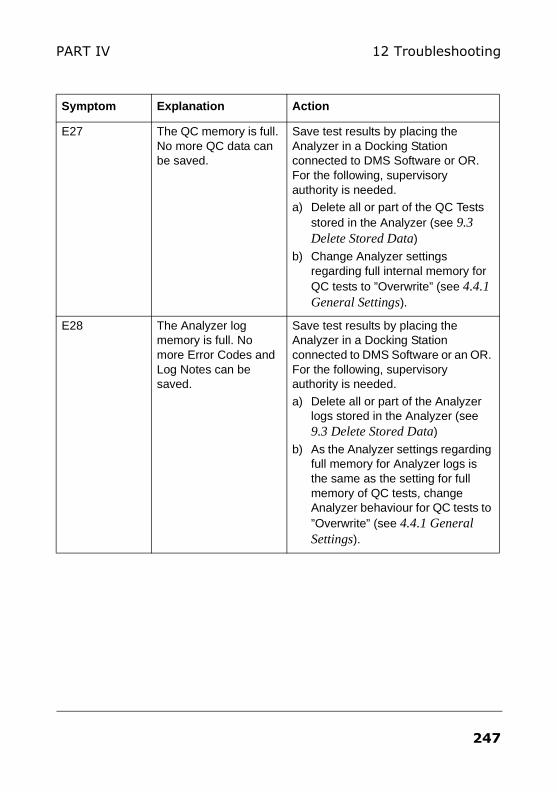
12 TroubleshootingPART IV
E27 The QC memory is full. No more QC data can be saved.
Save test results by placing the Analyzer in a Docking Station connected to DMS Software or OR. For the following, supervisory authority is needed.a) Delete all or part of the QC Tests
stored in the Analyzer (see 9.3 Delete Stored Data)
b) Change Analyzer settings regarding full internal memory for QC tests to ”Overwrite” (see 4.4.1 General Settings).
E28 The Analyzer log memory is full. No more Error Codes and Log Notes can be saved.
Save test results by placing the Analyzer in a Docking Station connected to DMS Software or an OR. For the following, supervisory authority is needed.
a) Delete all or part of the Analyzer logs stored in the Analyzer (see 9.3 Delete Stored Data)
b) As the Analyzer settings regarding full memory for Analyzer logs is the same as the setting for full memory of QC tests, change Analyzer behaviour for QC tests to ”Overwrite” (see 4.4.1 General Settings).
Symptom Explanation Action
247
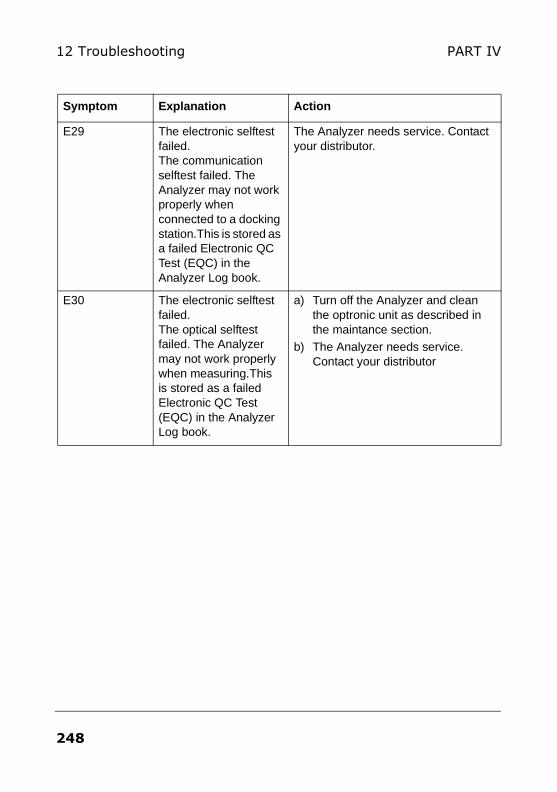
12 Troubleshooting PART IV
E29 The electronic selftest failed. The communication selftest failed. The Analyzer may not work properly when connected to a docking station.This is stored as a failed Electronic QC Test (EQC) in the Analyzer Log book.
The Analyzer needs service. Contact your distributor.
E30 The electronic selftest failed. The optical selftest failed. The Analyzer may not work properly when measuring.This is stored as a failed Electronic QC Test (EQC) in the Analyzer Log book.
a) Turn off the Analyzer and clean the optronic unit as described in the maintance section.
b) The Analyzer needs service. Contact your distributor
Symptom Explanation Action
248
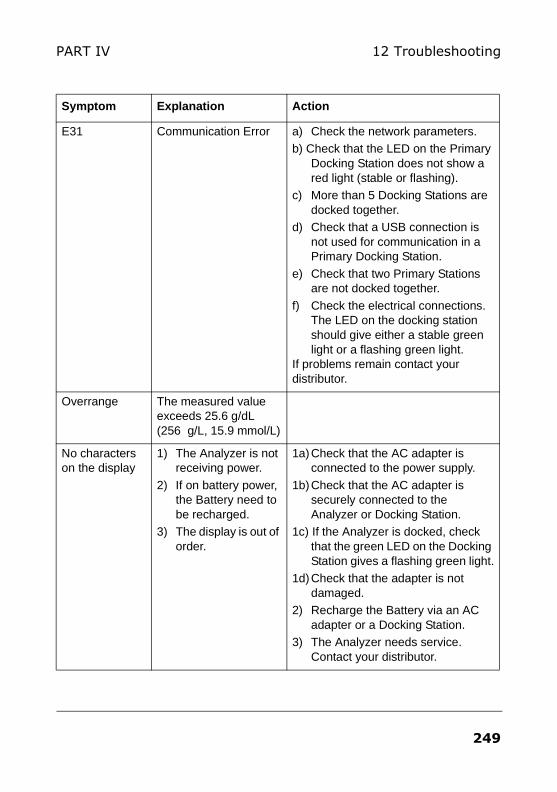
12 TroubleshootingPART IV
E31 Communication Error a) Check the network parameters.b) Check that the LED on the Primary
Docking Station does not show a red light (stable or flashing).
c) More than 5 Docking Stations are docked together.
d) Check that a USB connection is not used for communication in a Primary Docking Station.
e) Check that two Primary Stations are not docked together.
f) Check the electrical connections. The LED on the docking station should give either a stable green light or a flashing green light.
If problems remain contact your distributor.
Overrange The measured value exceeds 25.6 g/dL (256 g/L, 15.9 mmol/L)
No characters on the display
1) The Analyzer is not receiving power.
2) If on battery power, the Battery need to be recharged.
3) The display is out of order.
1a)Check that the AC adapter is connected to the power supply.
1b)Check that the AC adapter is securely connected to the Analyzer or Docking Station.
1c) If the Analyzer is docked, check that the green LED on the Docking Station gives a flashing green light.
1d)Check that the adapter is not damaged.
2) Recharge the Battery via an AC adapter or a Docking Station.
3) The Analyzer needs service. Contact your distributor.
Symptom Explanation Action
249
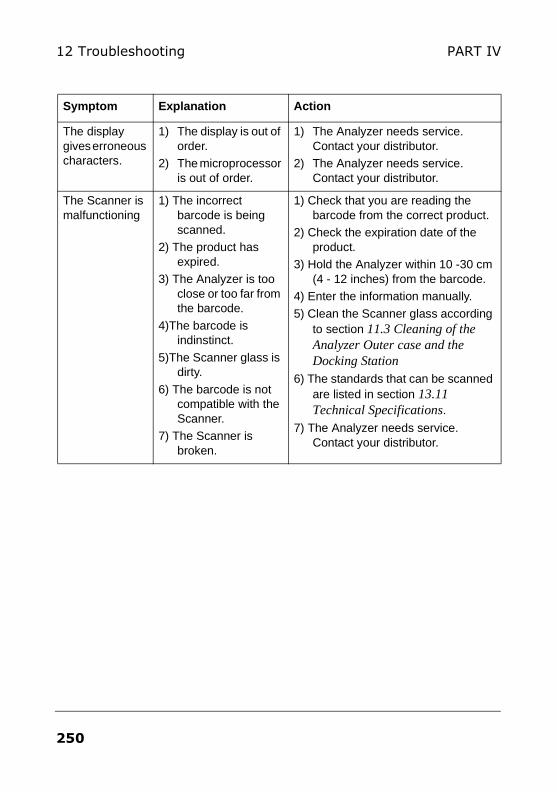
12 Troubleshooting PART IV
The display gives erroneous characters.
1) The display is out of order.
2) The microprocessor is out of order.
1) The Analyzer needs service. Contact your distributor.
2) The Analyzer needs service. Contact your distributor.
The Scanner is malfunctioning
1) The incorrect barcode is being scanned.
2) The product has expired.
3) The Analyzer is too close or too far from the barcode.
4)The barcode is indinstinct.
5)The Scanner glass is dirty.
6) The barcode is not compatible with the Scanner.
7) The Scanner is broken.
1) Check that you are reading the barcode from the correct product.
2) Check the expiration date of the product.
3) Hold the Analyzer within 10 -30 cm (4 - 12 inches) from the barcode.
4) Enter the information manually.
5) Clean the Scanner glass according to section 11.3 Cleaning of the Analyzer Outer case and the Docking Station
6) The standards that can be scanned are listed in section 13.11 Technical Specifications.
7) The Analyzer needs service. Contact your distributor.
Symptom Explanation Action
250
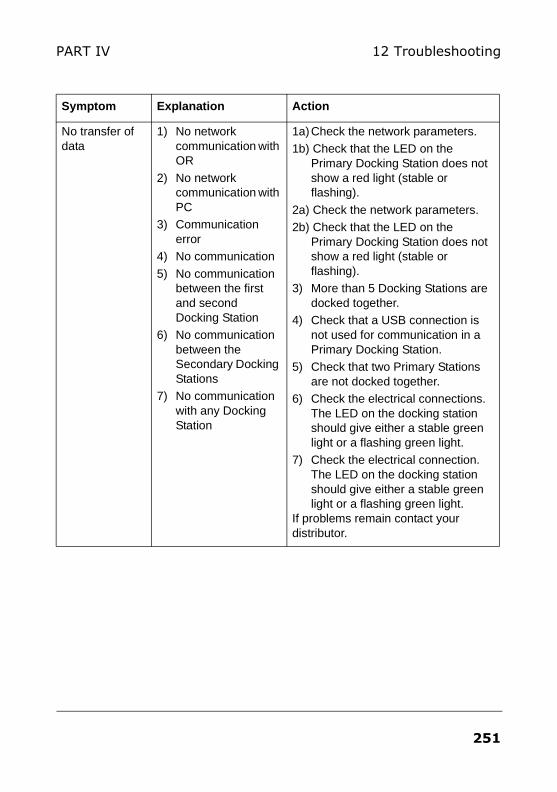
12 TroubleshootingPART IV
No transfer of data
1) No network communication with OR
2) No network communication with PC
3) Communication error
4) No communication
5) No communication between the first and second Docking Station
6) No communication between the Secondary Docking Stations
7) No communication with any Docking Station
1a)Check the network parameters.1b) Check that the LED on the
Primary Docking Station does not show a red light (stable or flashing).
2a) Check the network parameters.2b) Check that the LED on the
Primary Docking Station does not show a red light (stable or flashing).
3) More than 5 Docking Stations are docked together.
4) Check that a USB connection is not used for communication in a Primary Docking Station.
5) Check that two Primary Stations are not docked together.
6) Check the electrical connections. The LED on the docking station should give either a stable green light or a flashing green light.
7) Check the electrical connection. The LED on the docking station should give either a stable green light or a flashing green light.
If problems remain contact your distributor.
Symptom Explanation Action
251
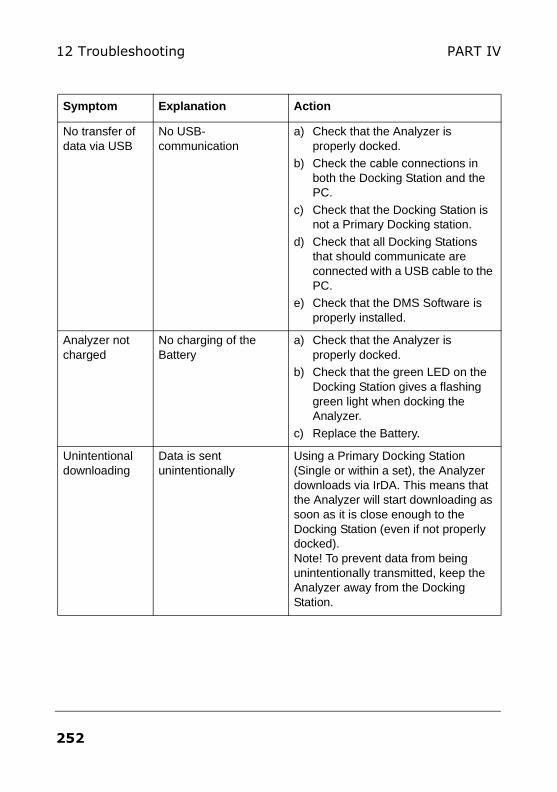
12 Troubleshooting PART IV
No transfer of data via USB
No USB-communication
a) Check that the Analyzer is properly docked.
b) Check the cable connections in both the Docking Station and the PC.
c) Check that the Docking Station is not a Primary Docking station.
d) Check that all Docking Stations that should communicate are connected with a USB cable to the PC.
e) Check that the DMS Software is properly installed.
Analyzer not charged
No charging of the Battery
a) Check that the Analyzer is properly docked.
b) Check that the green LED on the Docking Station gives a flashing green light when docking the Analyzer.
c) Replace the Battery.
Unintentional downloading
Data is sent unintentionally
Using a Primary Docking Station (Single or within a set), the Analyzer downloads via IrDA. This means that the Analyzer will start downloading as soon as it is close enough to the Docking Station (even if not properly docked). Note! To prevent data from being unintentionally transmitted, keep the Analyzer away from the Docking Station.
Symptom Explanation Action
252

PART V Miscellaneous
Hb 201 DM

PART V
This page intentionally left blank
254

APPENDICES

PART V
This page intentionally left blank
256
13 Technical specificationsPART V
13 Technical specifications
13.1 GeneralThe HemoCue Hb 201 DM is a system used for the determination of the total amount of hemoglobin in whole blood. The system consists of a specially designed Analyzer with specially designed microcuvettes containing dry reagents. The microcuvette serves as pipette, reaction vessel and as a measuring microcuvette. No dilution is required. The hemoglobin measurements takes place in the Analyzer, which follows the progress of the reaction until the end point has been reached. The system is factory calibrated against the hemoglobincyanide (HiCN) method, the international reference method for the determination of hemoglobin concentrations in blood.
13.2 Intended purpose/ Intended UseQuantitative determination of hemoglobin in capillary, venous or arterial blood, using a specially designed Analyzer, the HemoCue Hb 201 DM Analyzer, and specially designed microcuvettes, the HemoCue Hb 201 Microcuvettes.
The HemoCue Hb 201 Microcuvettes are for In Vitro Diagnostic use only.
The HemoCue Hb 201 DM Analyzer is only to be used with HemoCue Hb 201 Microcuvettes.
13.3 TheoryThe reaction in the microcuvette is a modified azidemethemoglobin reaction. The erythrocyte membranes are disintegrated by sodium deoxycholate, releasing the hemoglobin. Sodium nitrite converts the hemoglobin iron from ferrous to the ferric state to form methemoglobin, which then combines with azide to form azidemet-hemoglobin.
This chapter contains the technical specifications for the System Components in the HemoCue Hb 201 DM System.
257
13 Technical specifications PART V
13.4 Reagents40 % w/w Sodium Deoxycholate, 18 % w/w Sodium Azide, 20 % w/w Sodium Nitrite, 22 % w/w nonreactive substances.
13.5 Sample material Capillary, venous or arterial blood may be used. Appropriate anticoagulants in solid form (eg EDTA, heparin or heparin/flouride) may be used. Mix all samples thoroughly on a mechanical mixer for at least 2 minutes or invert 8-10 times by hand. Alternativly, follow local recommendations. Hemoglobin remains unchanged for days, provided that the blood does not become infected. If the specimen has been stored in a refrigerator, it will be viscid and the blood should be allowed to warm up to room tempreture before mixing.
13.6 Storage and environmental requirementsHemoCue Hb 201 Microcuvettes
Use the HemoCue Hb 201 Microcuvettes prior to their expiration date. The expiration date is printed on each package.
Storage of microcuvettes kept in a vial
The microcuvettes are to be stored in room tempreture (15 - 30 °C, 59 - 86 °F). Do not refrigerate. The microcuvettes are stable for two years from the date of manufacture. Once the seal is broken, the microcuvettes are stable for three months. Always keep the container properly sealed.
Storage of the individually packaged microcuvettes
The microcuvettes are to be stored in room tempreture (15 - 30 °C, 59 - 86 °F). Do not refrigerate. The microcuvettes are stable for fifteen months from the date of manufacture.
HemoCue Hb 201 DM Analyzer and HemoCue DM Docking Station.
The Analyzer and Docking Station can be stored at 0 - 50 °C (32 - 122 °F). Operating temperature is 18 - 30 °C (64 - 86 °F). Allow the Analyzer and Docking Station to reach ambient temperature before use. The Analyzer and the Docking Staion should not be operated at high (i.e. > 90 % non-condensing) humidity.
258
13 Technical specificationsPART V
13.7 Quality ControlThe HemoCue Hb 201 DM Analyzer has an internal electronic "Selftest". Every time the Analyzer is turned on, it will automatically verify the performance of the optronic unit of the Analyzer. This test is performed every eighth hour if the Analyzer is left turned on. The result of the selftest is stored as an EQC (Electronic Quality Control).
If quality control checks are required for regulatory reasons, they should be performed using Liquid Controls recommended by HemoCue.
13.8 Measuring range
13.8.1 Whole Blood
0 - 25.6 g/dL (0 - 256 g/L, 0 - 15.9 mmol/L).
Results above 25.6 g/dL (256 g/L, 15.9 mmol/L) will be displayed as overrange. Values above 23.5 g/dL (235 g/L, 14.6 mmol/L) must be confirmed using a suitable laboratory method.
13.9 LimitationsHemoCue Hb 201 Microcuvettes are for in vitro diagnostic use only. The HemoCue Hb 201 DM Analyzer is only to be used together with HemoCue Hb 201 Micro-cuvettes. For further limitations of the procedure, see the HemoCue Hb 201 Microcuvettes package insert.
13.10 Expected valuesAdult Males 13.0 - 17.0 g/dL (130 - 170 g/L, 8.1 - 10.5 mmol/L)
Adult Females 12.0 - 15.0 g/dL (120 - 150 g/L, 7.4 - 9.3 mmol/L)
Infants, after neonatal period 11.0 - 14.0 g/dL (110 - 140 g/L, 6.8 - 8.7 mmol/L) Children, two years to teenage: gradual increase to adult normals. Due to a wide range of conditions (dietary, geographical, etc.) which affect normal values, it is recommended that each laboratory establish its own normal ranges.
259
13 Technical specifications PART V
13.11Technical Specifications Analyzer
Dimensions: 170 x 93 x 50 mm (6.70 x 3.66 x 1.97 inches)
Weight: 350 g (0.77 pounds)
AC adapter: Egston
Mod. No.: N2UFMW3 (US)
Mod. No.: N2EFMW3 (EU)
Mod. No.: N2GFMW3 (GB)
Input: 100 - 240 VAC, 50 - 60 Hz
Output: 6VDC, 2.5 A
Only use adapters recommended by HemoCue.
Barcodes that can be scanned: UPC/EAN (UPC-A; UPC/E; EAN-8; EAN-13)
Code 128 (USS-128; UCC/EAN-128; ISBT 128) Code 39 Interleaved 2 of 5 Codabar
Pollution degree: 2
Overvoltage category: II
Atmospheric pressure: 700 hPa to 1060 hPa
Equipment not suitable for use in the presence of flammable mixtures
The instrument is tested according to EN 61010-1/IEC 61010-1 and amendments 1 and 2, EN 60601-1-2 and complies with the IVD Medical Device Directive 98/79/EC. The instrument is CE marked. This product is covered by one or more of U.S. patents, 4,758,717; 5,130,520; 5,262,628; 5,396,055; and 5,532,469.
(Continues)
260
13 Technical specificationsPART V
(Continues)
Docking Station
Dimensions: 206x135x61 mm (8.10 x 5.30 x 2.40 inches)
Weight: 566 g (1.24 pounds)
AC adapter: Egston
Mod. No.: N2UFMW3 (US)
Mod. No.: N2EFMW3 (EU)
Mod. No.: N2GFMW3 (GB)
Input: 100 - 240 VAC, 50 - 60 Hz
Output: 6VDC, 2.5 A
Only use adapters recommended by HemoCue.
Pollution degree: 2
Over voltage category: II
Atmospheric pressure: 700 hPa to 1060 hPa
Equipment not suitable for use in the presence of flammable mixtures
The instrument is tested according to EN 61010-1/IEC 61010-1 and amendments 1 and 2, EN 60601-1-2 and complies with the IVD Medical Device Directive 98/79/EC. The instrument is CE marked.
13.12 Signal input and signal output connectionsAccessory equipment connected to the analog and digital interfaces must be certified according to the respective UL standards (i.e. UL 60950-1 for data processing equipment and IEC 60601-1 for medical equipment). Furthermore all configurations must comply with the system standard, IEC 60601-1-1. Connections of additional equipment to the signal input or signal output connections is deemed to be “configuring a medical system”, and therefore assumes responsiblity for the systems compliance within the requirements of IEC 60601-1-1. If in doubt, consult the technical service department or your local representative.
261
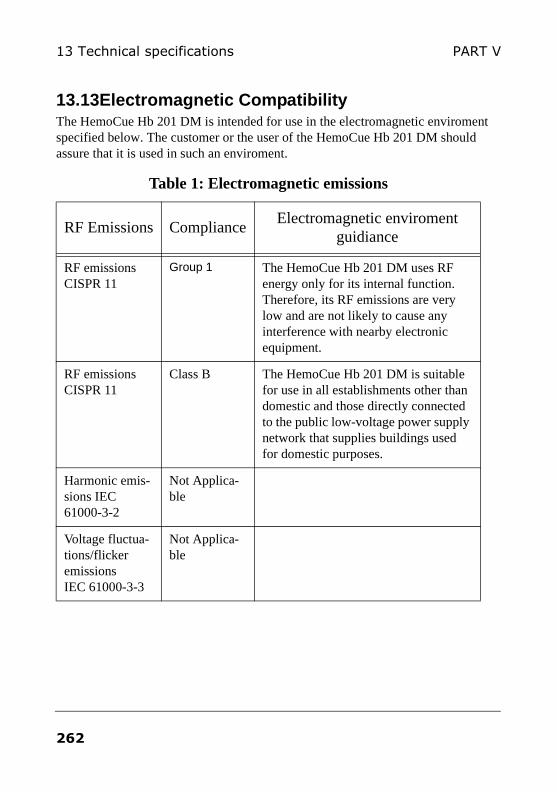
13 Technical specifications PART V
13.13Electromagnetic CompatibilityThe HemoCue Hb 201 DM is intended for use in the electromagnetic enviroment specified below. The customer or the user of the HemoCue Hb 201 DM should assure that it is used in such an enviroment.
Table 1: Electromagnetic emissions
RF Emissions ComplianceElectromagnetic enviroment
guidiance
RF emissionsCISPR 11
Group 1 The HemoCue Hb 201 DM uses RF energy only for its internal function. Therefore, its RF emissions are very low and are not likely to cause any interference with nearby electronic equipment.
RF emissionsCISPR 11
Class B The HemoCue Hb 201 DM is suitable for use in all establishments other than domestic and those directly connected to the public low-voltage power supply network that supplies buildings used for domestic purposes.
Harmonic emis-sions IEC61000-3-2
Not Applica-ble
Voltage fluctua-tions/flicker emissionsIEC 61000-3-3
Not Applica-ble
262
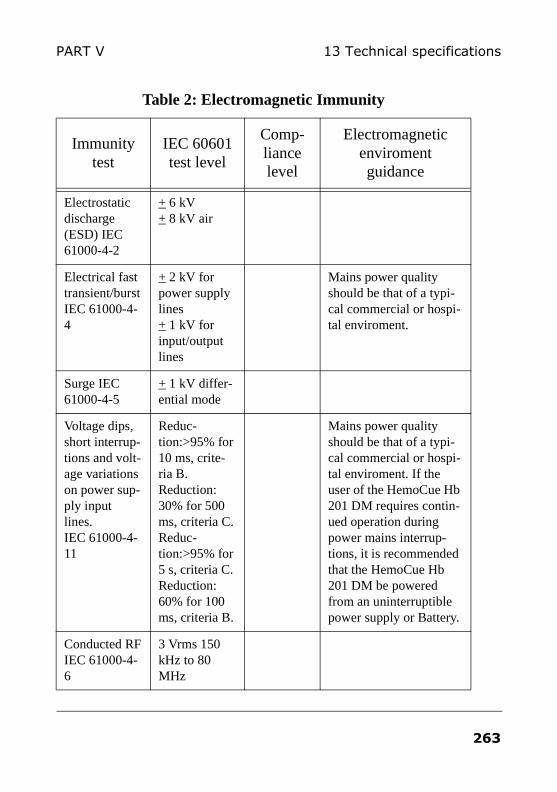
13 Technical specificationsPART V
Table 2: Electromagnetic Immunity
Immunity test
IEC 60601 test level
Comp-liance level
Electromagnetic enviromentguidance
Electrostatic discharge(ESD) IEC 61000-4-2
+ 6 kV+ 8 kV air
Electrical fast transient/burstIEC 61000-4-4
+ 2 kV for power supply lines+ 1 kV for input/output lines
Mains power quality should be that of a typi-cal commercial or hospi-tal enviroment.
Surge IEC 61000-4-5
+ 1 kV differ-ential mode
Voltage dips, short interrup-tions and volt-age variations on power sup-ply input lines. IEC 61000-4-11
Reduc-tion:>95% for 10 ms, crite-ria B.Reduction: 30% for 500 ms, criteria C.Reduc-tion:>95% for 5 s, criteria C.Reduction: 60% for 100 ms, criteria B.
Mains power quality should be that of a typi-cal commercial or hospi-tal enviroment. If the user of the HemoCue Hb 201 DM requires contin-ued operation during power mains interrup-tions, it is recommended that the HemoCue Hb 201 DM be powered from an uninterruptible power supply or Battery.
Conducted RFIEC 61000-4-6
3 Vrms 150 kHz to 80 MHz
263
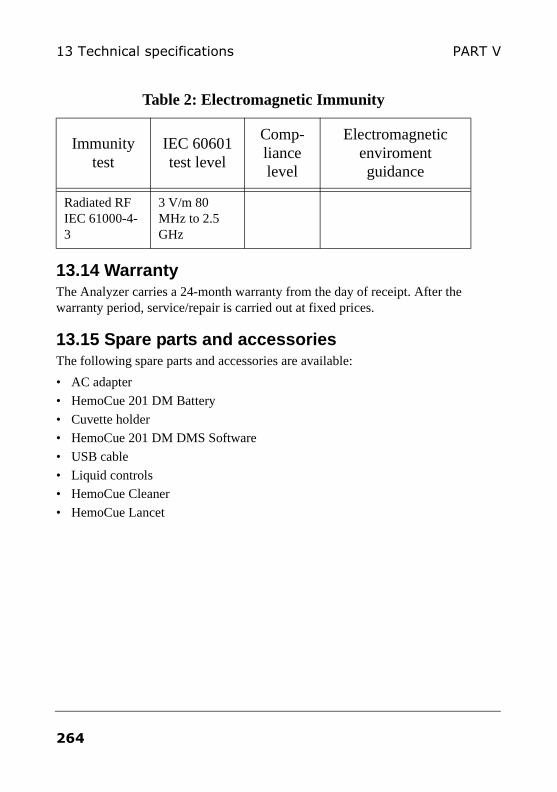
13 Technical specifications PART V
13.14 WarrantyThe Analyzer carries a 24-month warranty from the day of receipt. After the warranty period, service/repair is carried out at fixed prices.
13.15 Spare parts and accessoriesThe following spare parts and accessories are available:
• AC adapter
• HemoCue 201 DM Battery
• Cuvette holder
• HemoCue 201 DM DMS Software
• USB cable
• Liquid controls
• HemoCue Cleaner
• HemoCue Lancet
Radiated RFIEC 61000-4-3
3 V/m 80 MHz to 2.5 GHz
Table 2: Electromagnetic Immunity
Immunity test
IEC 60601 test level
Comp-liance level
Electromagnetic enviromentguidance
264
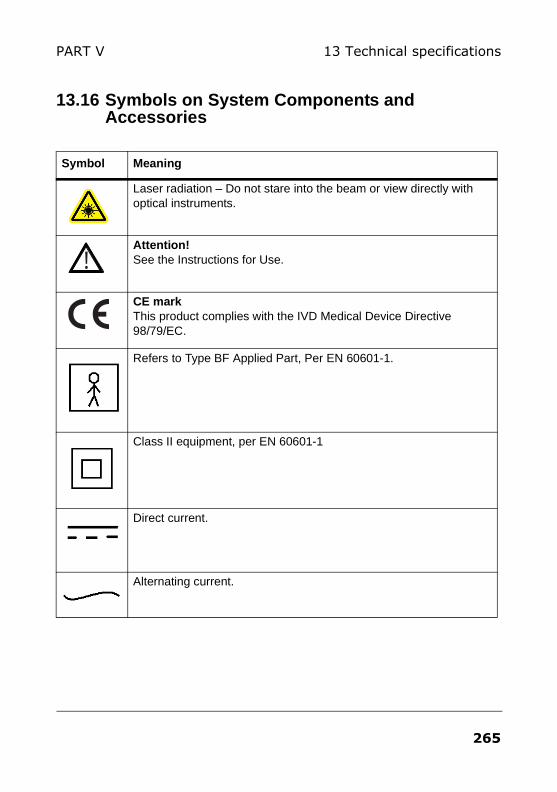
13 Technical specificationsPART V
13.16 Symbols on System Components and Accessories
Symbol Meaning
Laser radiation – Do not stare into the beam or view directly with optical instruments.
Attention!See the Instructions for Use.
CE markThis product complies with the IVD Medical Device Directive 98/79/EC.
Refers to Type BF Applied Part, Per EN 60601-1.
Class II equipment, per EN 60601-1
Direct current.
Alternating current.
!
265
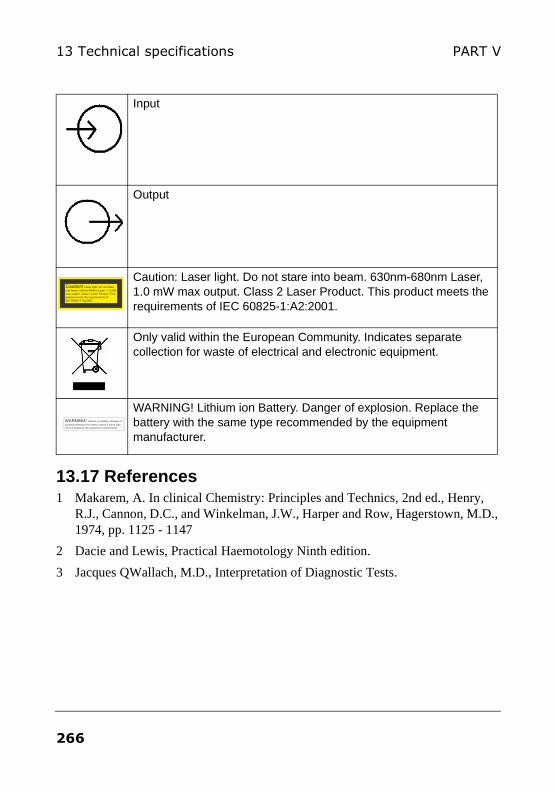
13 Technical specifications PART V
13.17 References1 Makarem, A. In clinical Chemistry: Principles and Technics, 2nd ed., Henry,
R.J., Cannon, D.C., and Winkelman, J.W., Harper and Row, Hagerstown, M.D., 1974, pp. 1125 - 1147
2 Dacie and Lewis, Practical Haemotology Ninth edition.
3 Jacques QWallach, M.D., Interpretation of Diagnostic Tests.
Input
Output
Caution: Laser light. Do not stare into beam. 630nm-680nm Laser, 1.0 mW max output. Class 2 Laser Product. This product meets the requirements of IEC 60825-1:A2:2001.
Only valid within the European Community. Indicates separate collection for waste of electrical and electronic equipment.
WARNING! Lithium ion Battery. Danger of explosion. Replace the battery with the same type recommended by the equipment manufacturer.
Caution! Laser light. Do not stare
into beam. 630nm-680nm Laser, 1.0 mW
max output. Class 2 Laser Product. This
product meets the requirements of
IEC 60825-1:A2:2001.
WARNING! Lithium ion battery. Danger of
explosion.Replace the battery with the same type
recommended by the equipment manufacturer.
266
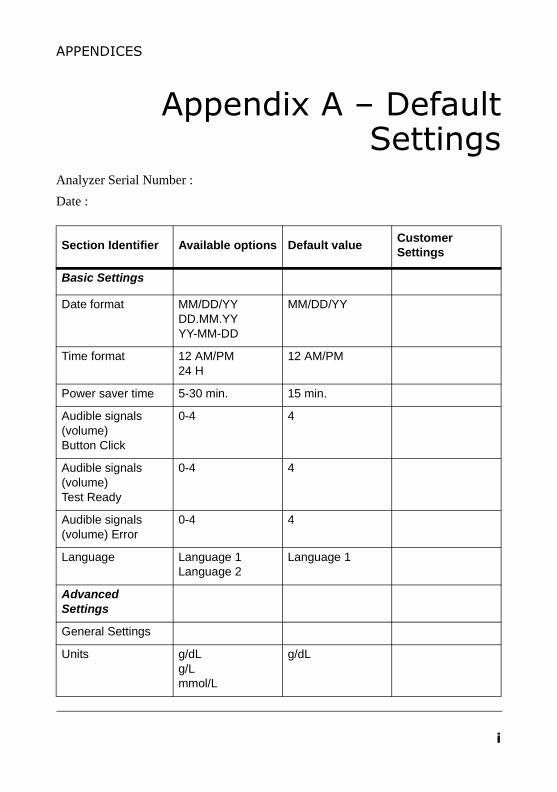
APPENDICES
Appendix A – Default Settings
Analyzer Serial Number :
Date :
Section Identifier Available options Default valueCustomer Settings
Basic Settings
Date format MM/DD/YY DD.MM.YY YY-MM-DD
MM/DD/YY
Time format 12 AM/PM 24 H
12 AM/PM
Power saver time 5-30 min. 15 min.
Audible signals (volume) Button Click
0-4 4
Audible signals (volume) Test Ready
0-4 4
Audible signals (volume) Error
0-4 4
Language Language 1 Language 2
Language 1
Advanced Settings
General Settings
Units g/dL g/L mmol/L
g/dL
i
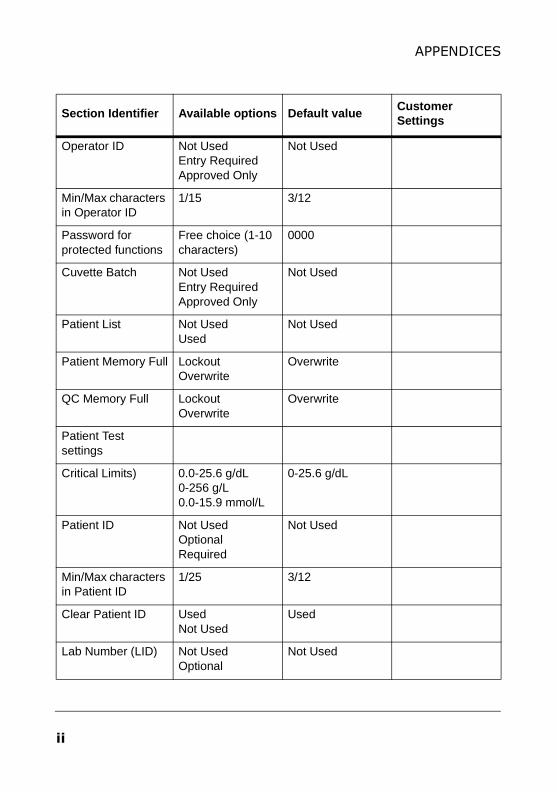
APPENDICES
Operator ID Not Used Entry Required Approved Only
Not Used
Min/Max characters in Operator ID
1/15 3/12
Password for protected functions
Free choice (1-10 characters)
0000
Cuvette Batch Not Used Entry Required Approved Only
Not Used
Patient List Not UsedUsed
Not Used
Patient Memory Full Lockout Overwrite
Overwrite
QC Memory Full Lockout Overwrite
Overwrite
Patient Test settings
Critical Limits) 0.0-25.6 g/dL0-256 g/L 0.0-15.9 mmol/L
0-25.6 g/dL
Patient ID Not Used Optional Required
Not Used
Min/Max characters in Patient ID
1/25 3/12
Clear Patient ID Used Not Used
Used
Lab Number (LID) Not Used Optional
Not Used
Section Identifier Available options Default valueCustomer Settings
ii
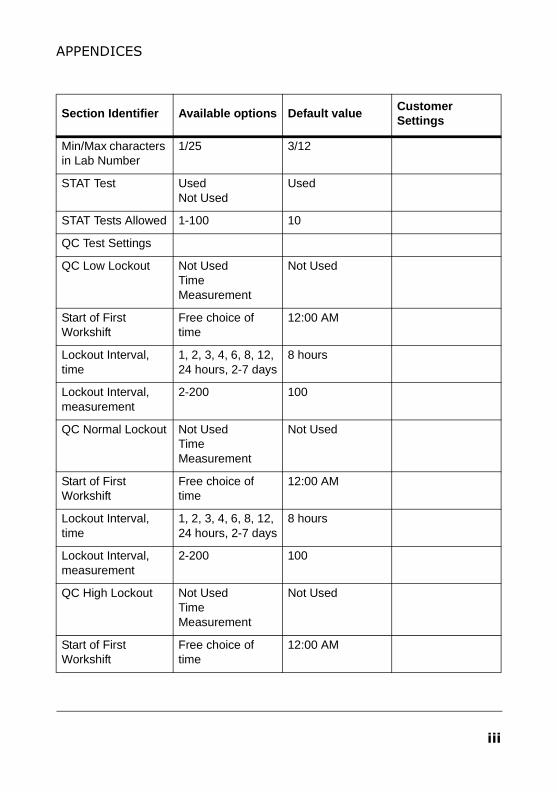
APPENDICES
Min/Max characters in Lab Number
1/25 3/12
STAT Test Used Not Used
Used
STAT Tests Allowed 1-100 10
QC Test Settings
QC Low Lockout Not Used Time Measurement
Not Used
Start of First Workshift
Free choice of time
12:00 AM
Lockout Interval, time
1, 2, 3, 4, 6, 8, 12, 24 hours, 2-7 days
8 hours
Lockout Interval, measurement
2-200 100
QC Normal Lockout Not Used Time Measurement
Not Used
Start of First Workshift
Free choice of time
12:00 AM
Lockout Interval, time
1, 2, 3, 4, 6, 8, 12, 24 hours, 2-7 days
8 hours
Lockout Interval, measurement
2-200 100
QC High Lockout Not Used Time Measurement
Not Used
Start of First Workshift
Free choice of time
12:00 AM
Section Identifier Available options Default valueCustomer Settings
iii
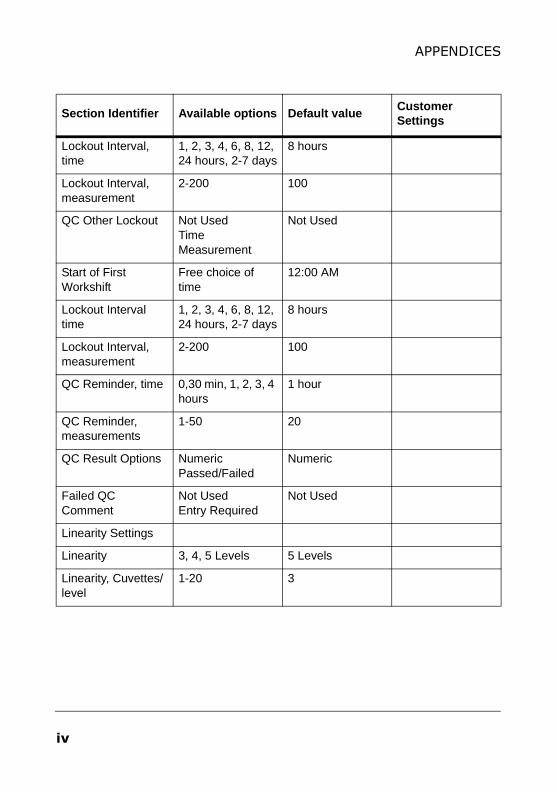
APPENDICES
Lockout Interval, time
1, 2, 3, 4, 6, 8, 12, 24 hours, 2-7 days
8 hours
Lockout Interval, measurement
2-200 100
QC Other Lockout Not Used Time Measurement
Not Used
Start of First Workshift
Free choice of time
12:00 AM
Lockout Interval time
1, 2, 3, 4, 6, 8, 12, 24 hours, 2-7 days
8 hours
Lockout Interval, measurement
2-200 100
QC Reminder, time 0,30 min, 1, 2, 3, 4 hours
1 hour
QC Reminder, measurements
1-50 20
QC Result Options Numeric Passed/Failed
Numeric
Failed QC Comment
Not UsedEntry Required
Not Used
Linearity Settings
Linearity 3, 4, 5 Levels 5 Levels
Linearity, Cuvettes/level
1-20 3
Section Identifier Available options Default valueCustomer Settings
iv

Manufacturer HemoCue AB Box 1204 SE - 262 23 ÄngelholmSweden Phone: + 46 431 45 82 00 Fax: + 46 431 45 82 25 E-mail: [email protected] www.hemocue.com
HemoCue Distributor USAHemoCue Inc.40 Empire DriveLake Forest, CA 92630Phone 949-859-2630Order 800-323-1674Technical support 800-426-7256Fax 949-859-3066 901111 060130