Hello. Spatial Analysis of Elephant Poaching Incidents to Identity High Risk Poaching Areas to...
23
Hello
-
Upload
vernon-houston -
Category
Documents
-
view
217 -
download
1
Transcript of Hello. Spatial Analysis of Elephant Poaching Incidents to Identity High Risk Poaching Areas to...
Hello
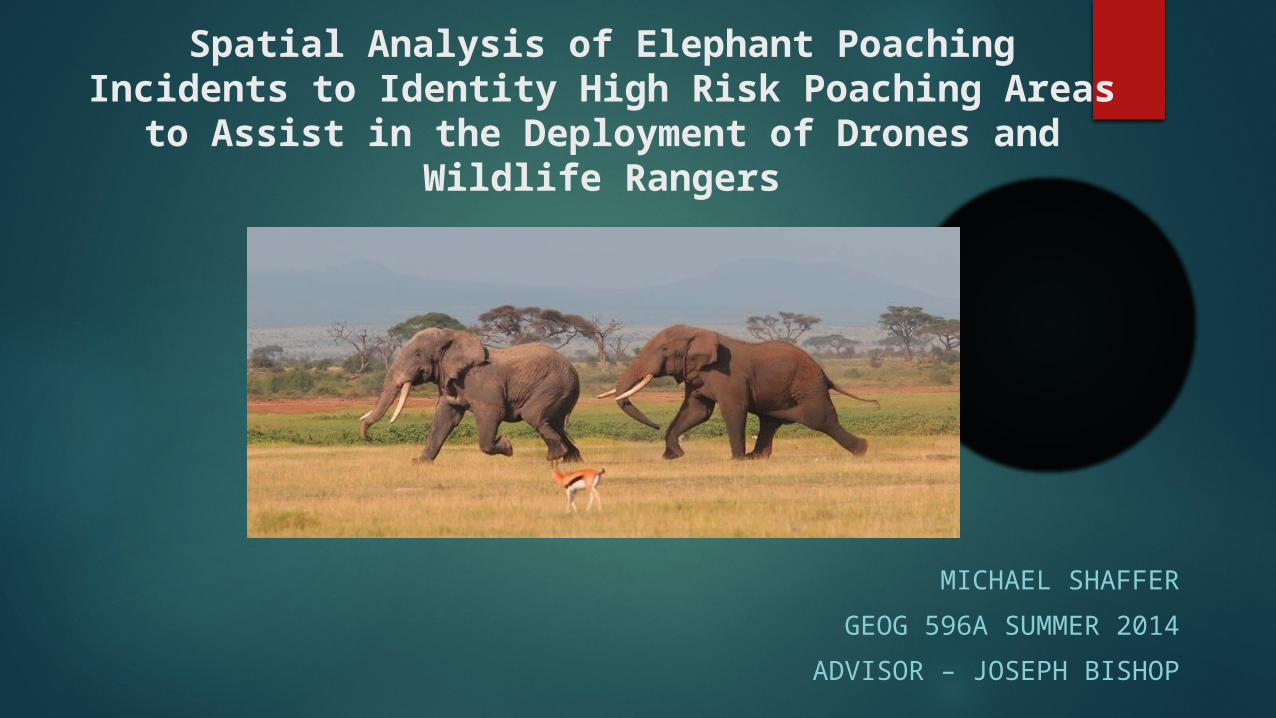
Spatial Analysis of Elephant Poaching Incidents to Identity High Risk Poaching Areas to Assist in the Deployment of Drones and Wildlife Rangers
MICHAEL SHAFFER
GEOG 596A SUMMER 2014
ADVISOR – JOSEPH BISHOP
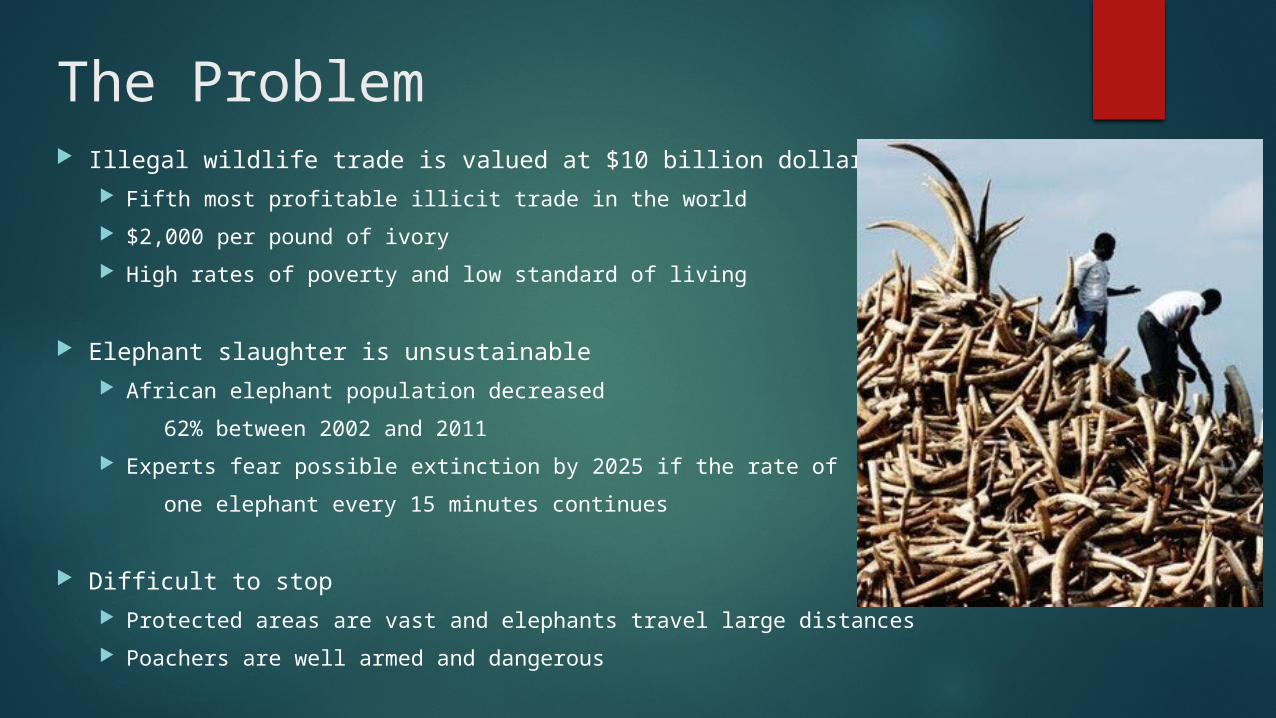
The Problem Illegal wildlife trade is valued at $10 billion dollars
Fifth most profitable illicit trade in the world
$2,000 per pound of ivory
High rates of poverty and low standard of living
Elephant slaughter is unsustainable African elephant population decreased
62% between 2002 and 2011
Experts fear possible extinction by 2025 if the rate of
one elephant every 15 minutes continues
Difficult to stop Protected areas are vast and elephants travel large distances
Poachers are well armed and dangerous
The Solution
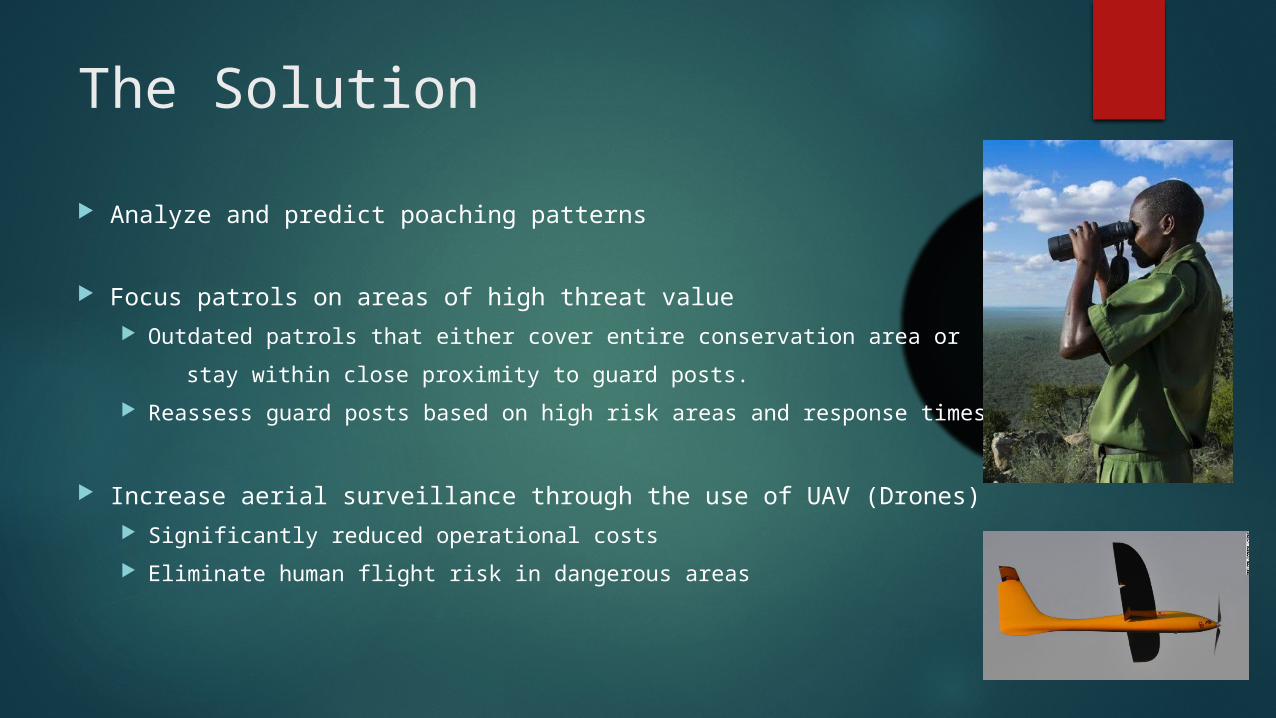
Analyze and predict poaching patterns
Focus patrols on areas of high threat value Outdated patrols that either cover entire conservation area or
stay within close proximity to guard posts.
Reassess guard posts based on high risk areas and response times
Increase aerial surveillance through the use of UAV (Drones) Significantly reduced operational costs
Eliminate human flight risk in dangerous areas
Project Goal: Support anti-poaching elephant conservation by identifying high
risk poaching areas, calculating drone flight paths to model achievable surveillance areas, and locate wildlife ranger guard stations based on the location of high risk areas.
Objectives: 1. Perform point pattern analysis on elephant poaching data
2. Identify high risk poaching areas through geospatial analysis of environment
3. Model surveillance drone flight paths to optimize coverage for high risk areas
4. Locate guard stations based on terrain and proximity to high risk areas
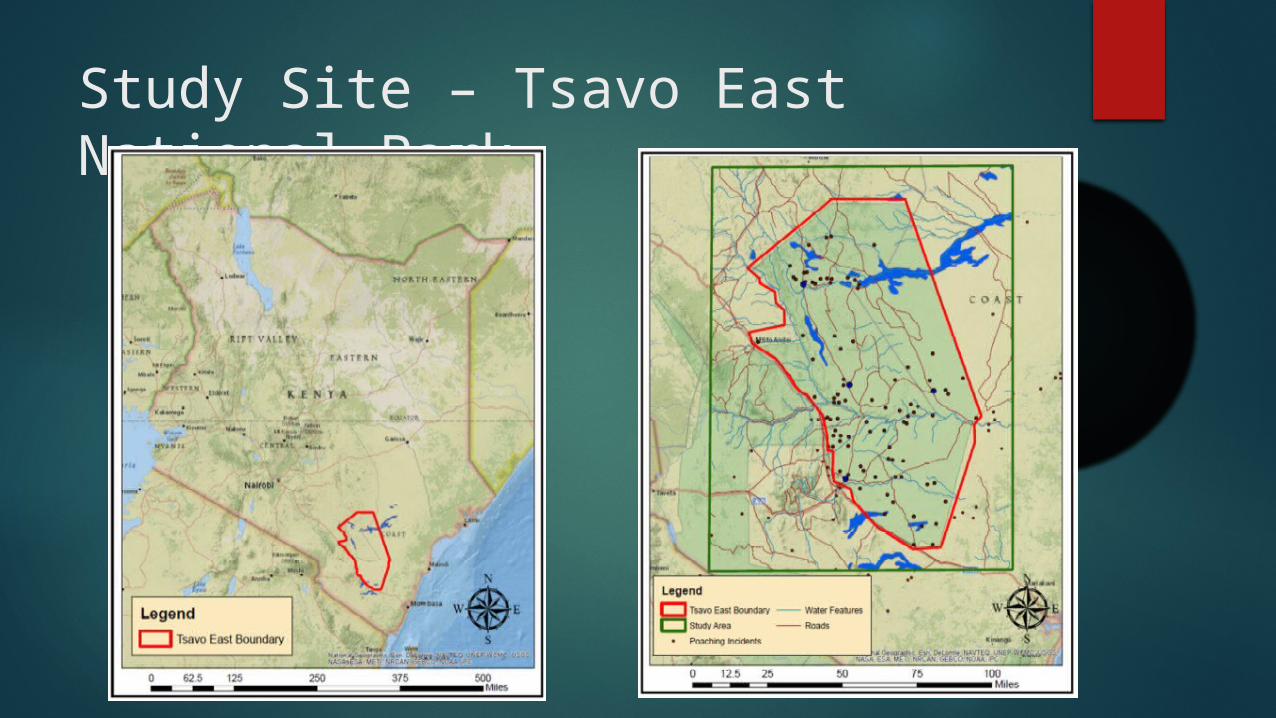
Study Site – Tsavo East National Park
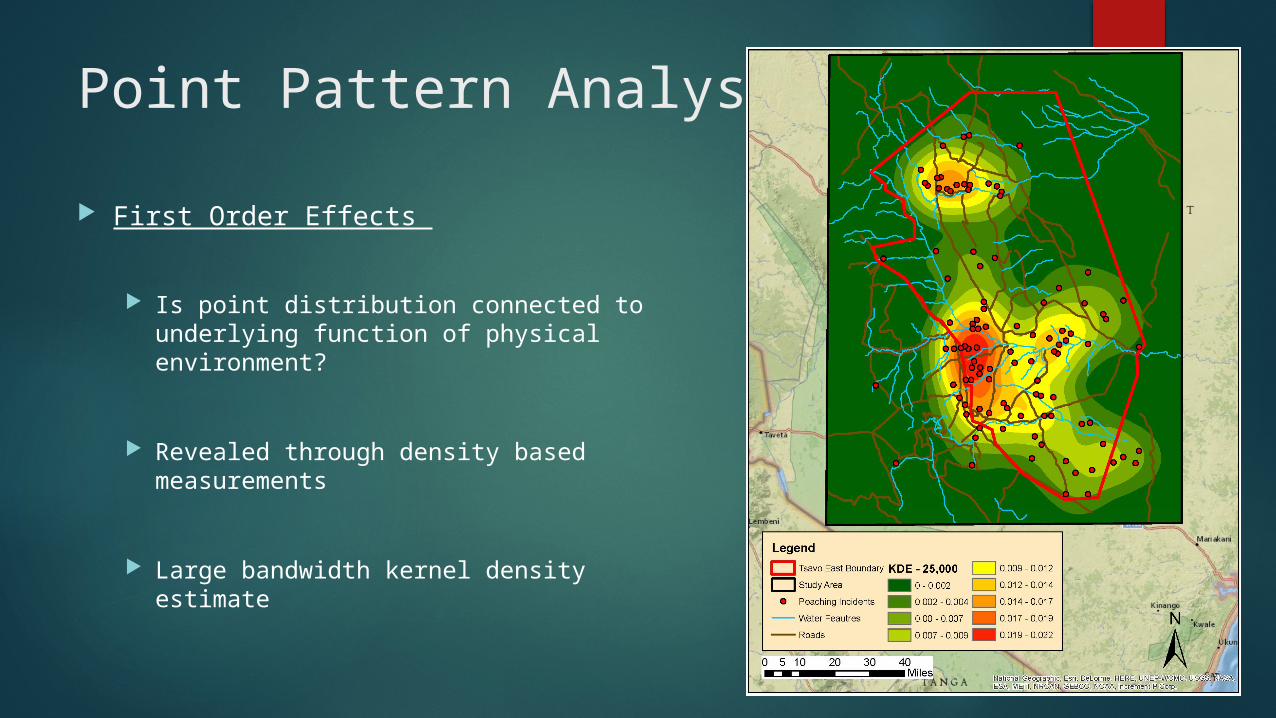
Point Pattern Analysis
First Order Effects
Is point distribution connected to underlying function of physical environment?
Revealed through density based measurements
Large bandwidth kernel density estimate
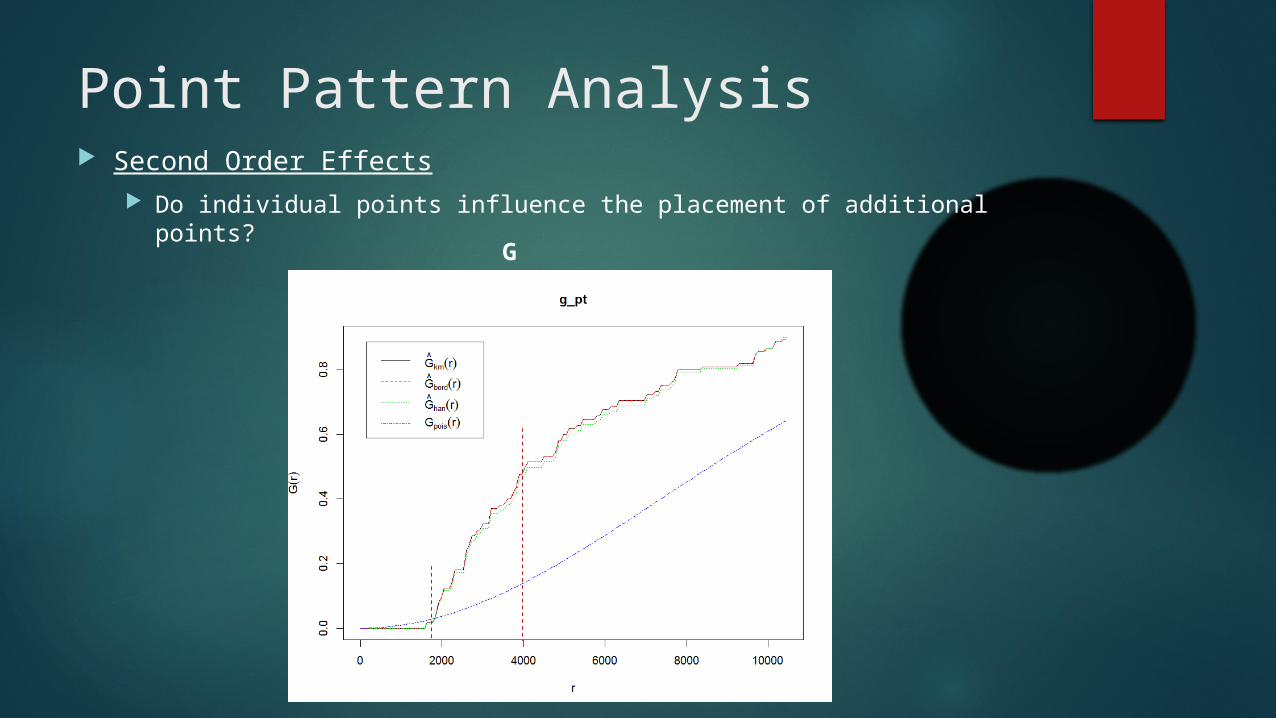
Point Pattern Analysis Second Order Effects
Do individual points influence the placement of additional points?
G Function

Point Pattern Analysis Deterministic or Stochastic Process
Monte Carlo Procedure and IRP/CSR (Independent Random Process/Complete Spatial Randomness)
G Function
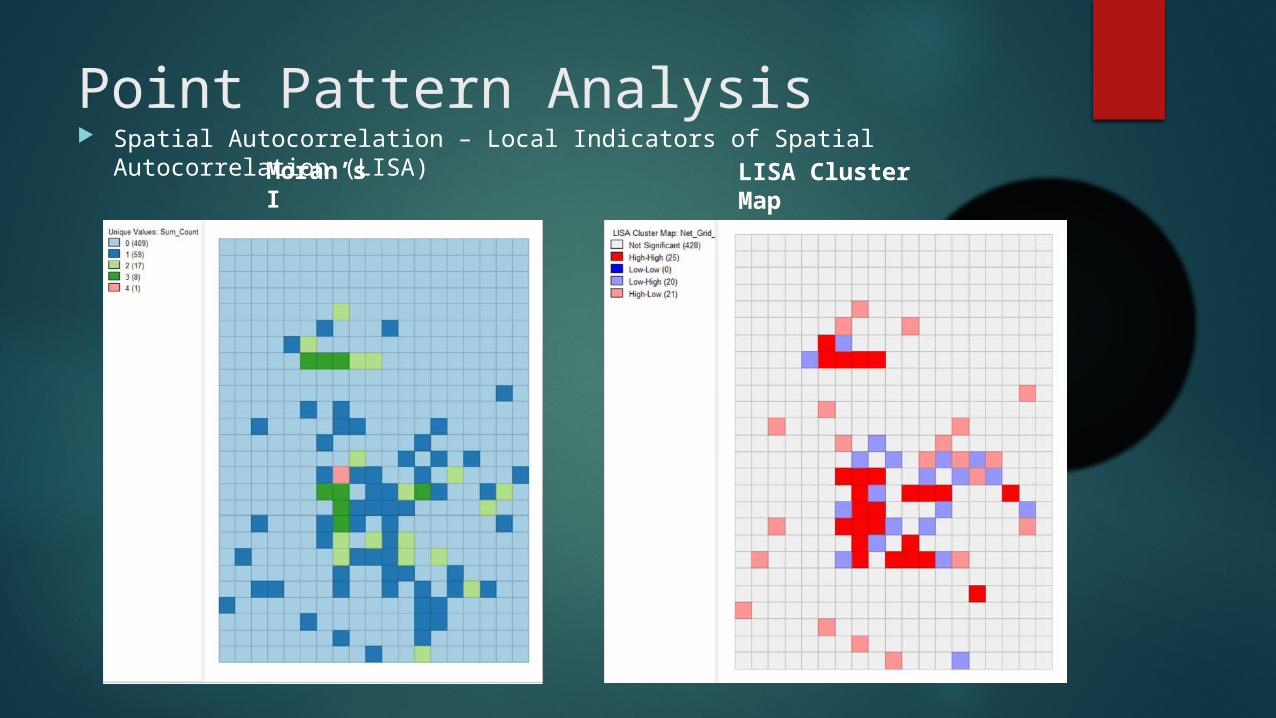
Point Pattern AnalysisMoran’s I
Spatial Autocorrelation – Local Indicators of Spatial Autocorrelation (LISA)LISA Cluster Map
Risk Analysis
Identify risk based on physical environment Determine correlation between physical features and poaching incidents
Land cover type
Distance proximity to water sources
Distance proximity to roads
Identify risk from existing poaching intensity
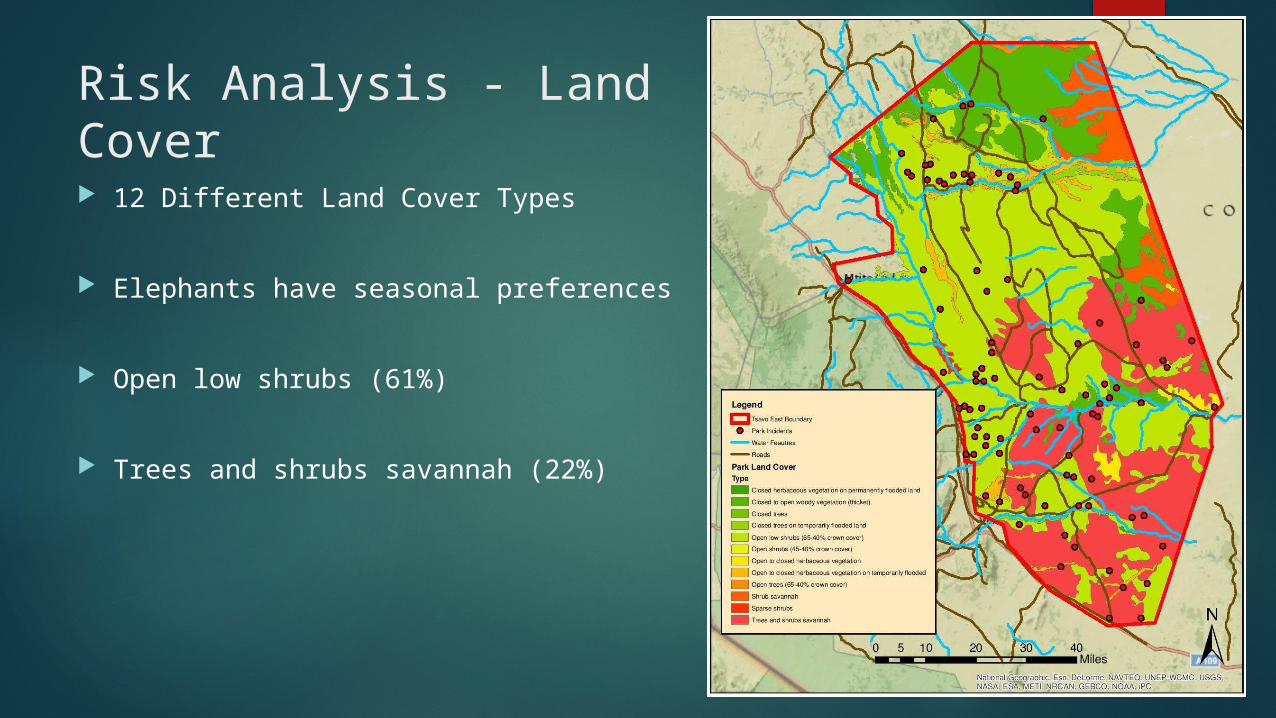
Risk Analysis - Land Cover
12 Different Land Cover Types
Elephants have seasonal preferences
Open low shrubs (61%)
Trees and shrubs savannah (22%)
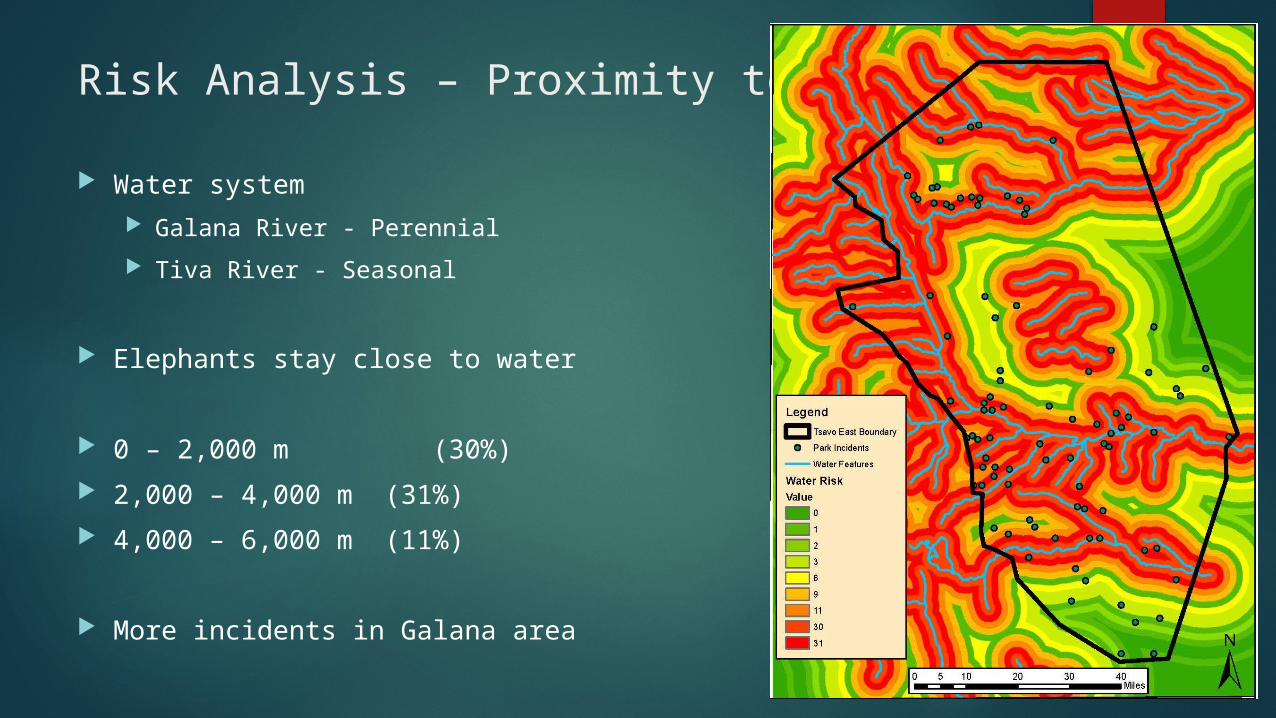
Risk Analysis – Proximity to Water
Water system Galana River - Perennial
Tiva River - Seasonal
Elephants stay close to water
0 – 2,000 m (30%)
2,000 – 4,000 m (31%)
4,000 – 6,000 m (11%)
More incidents in Galana area

Risk Analysis – Proximity to Roads
Elephants show no avoidance behavior
Poachers need for quick escape
0 – 2,000 m (33%)
2,000 – 4,000 m (21%)
4,000 – 6,000 m (17%)
6,000 – 8,000 m (13%)
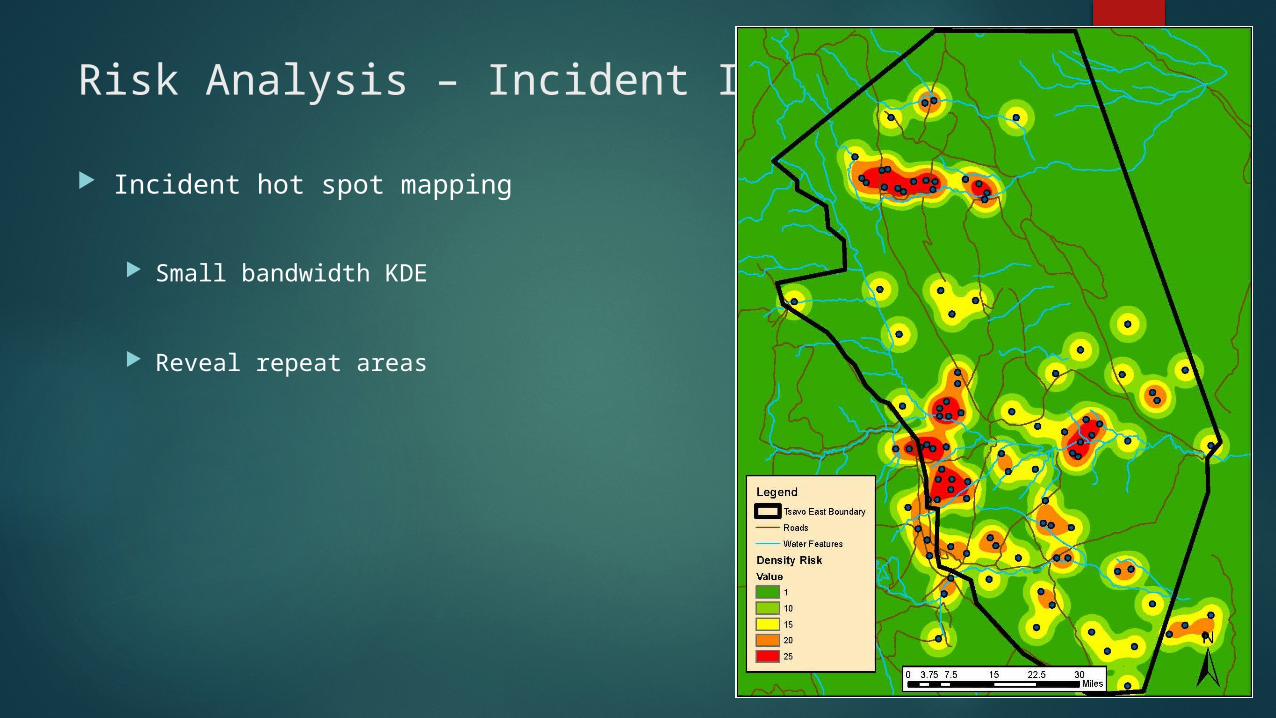
Risk Analysis – Incident Intensity
Incident hot spot mapping
Small bandwidth KDE
Reveal repeat areas
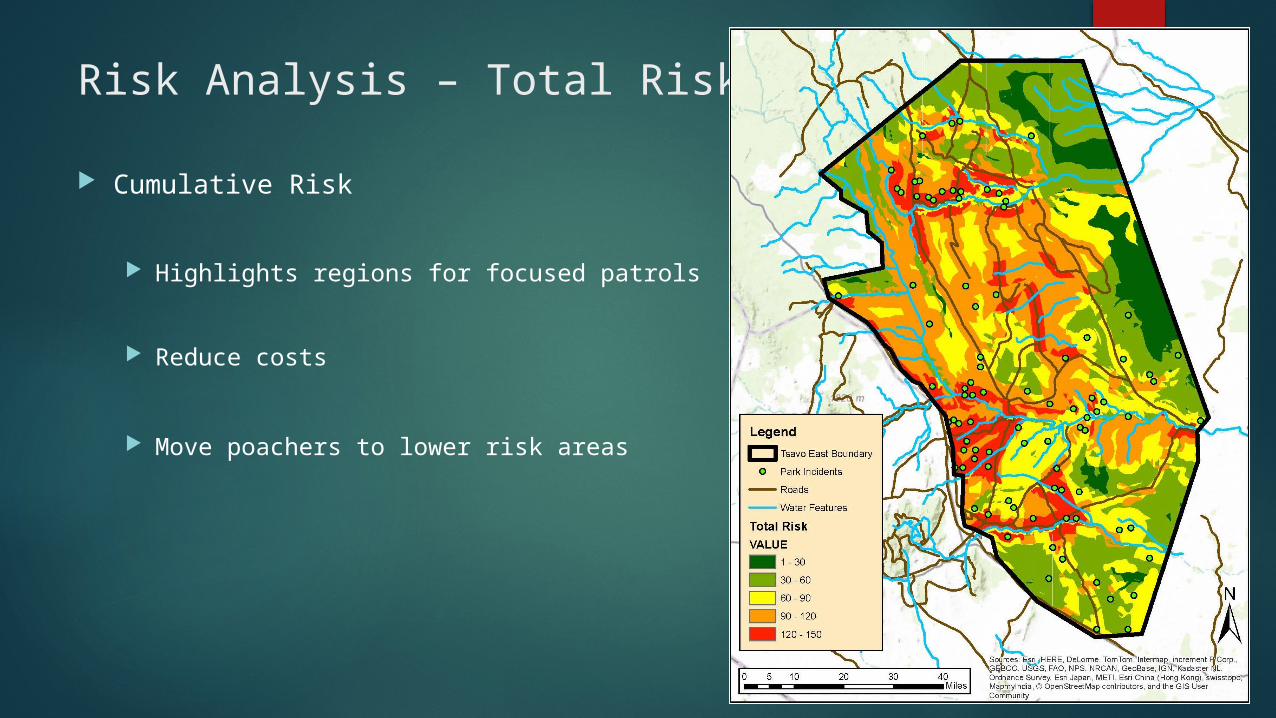
Risk Analysis – Total Risk
Cumulative Risk
Highlights regions for focused patrols
Reduce costs
Move poachers to lower risk areas
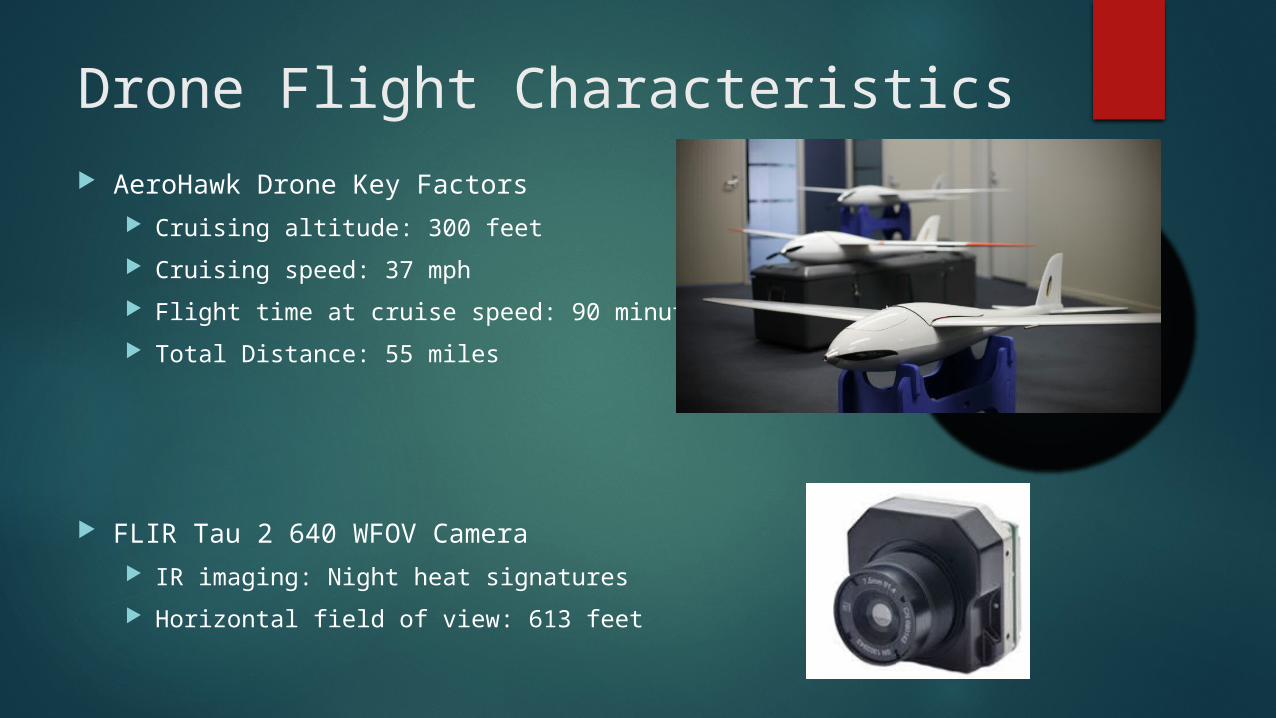
Drone Flight Characteristics AeroHawk Drone Key Factors
Cruising altitude: 300 feet
Cruising speed: 37 mph
Flight time at cruise speed: 90 minutes
Total Distance: 55 miles
FLIR Tau 2 640 WFOV Camera IR imaging: Night heat signatures
Horizontal field of view: 613 feet
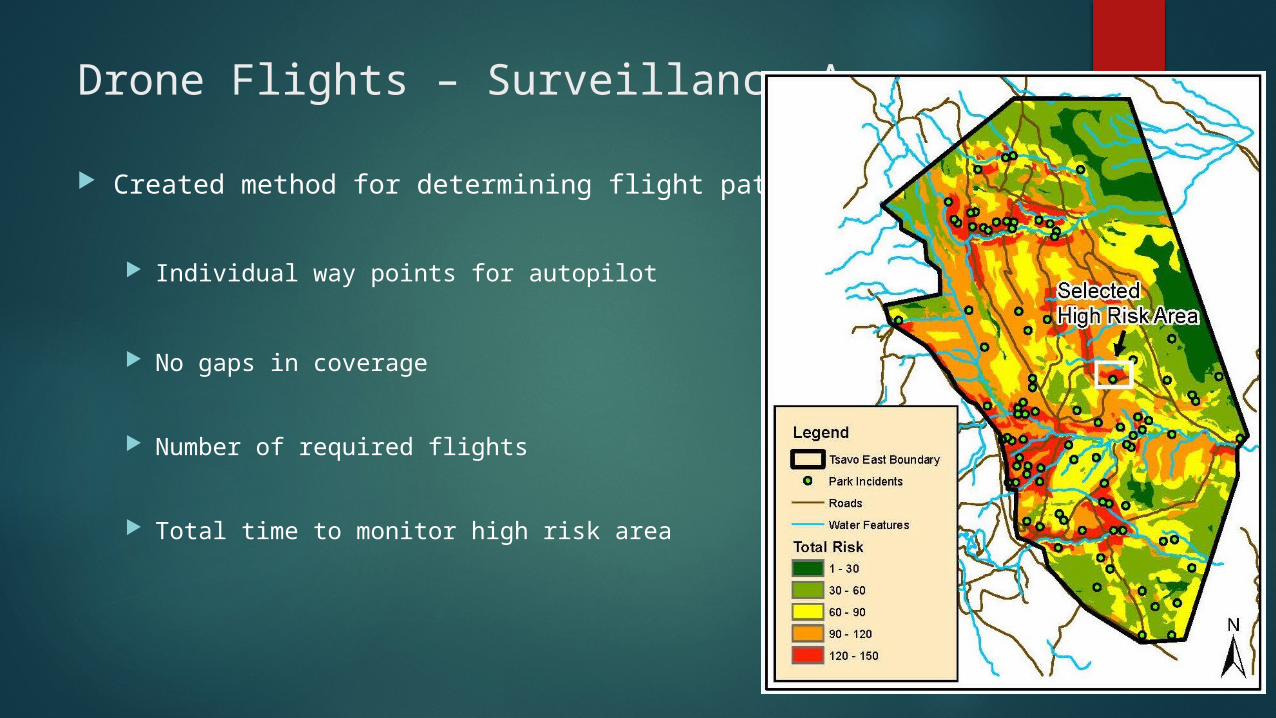
Drone Flights – Surveillance Area
Created method for determining flight path
Individual way points for autopilot
No gaps in coverage
Number of required flights
Total time to monitor high risk area
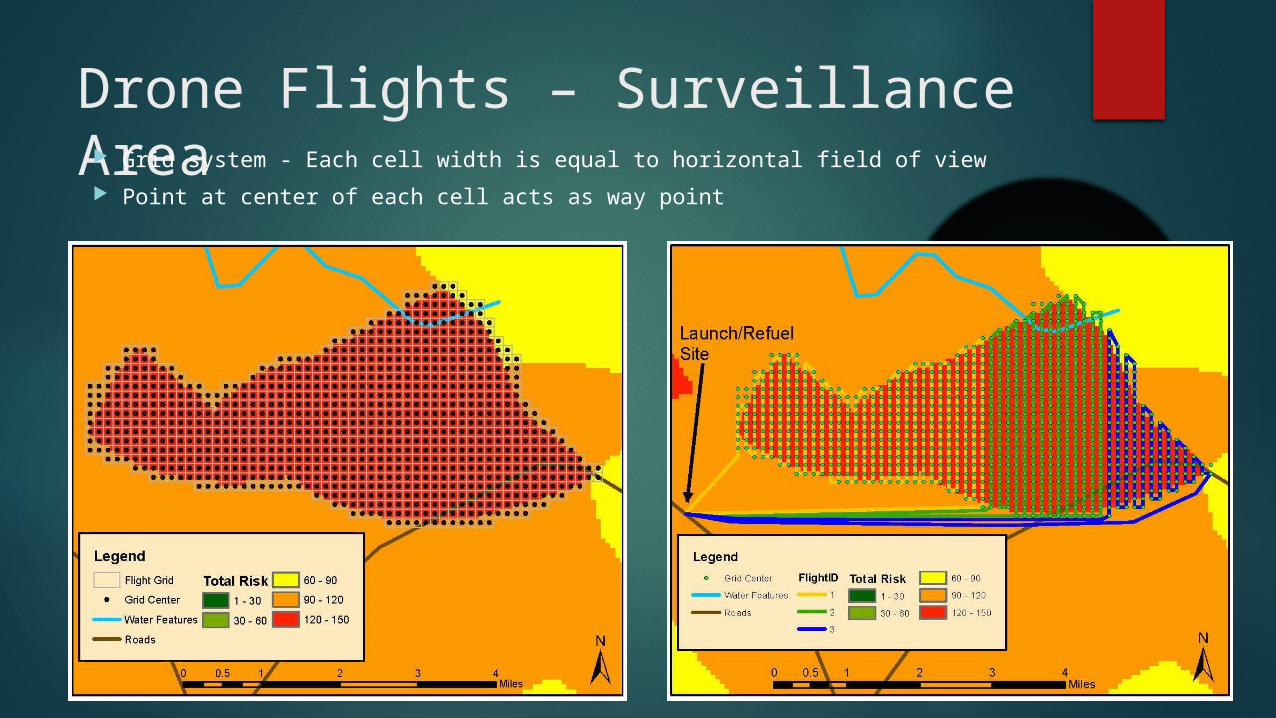
Drone Flights – Surveillance Area Grid system - Each cell width is equal to horizontal field of view
Point at center of each cell acts as way point
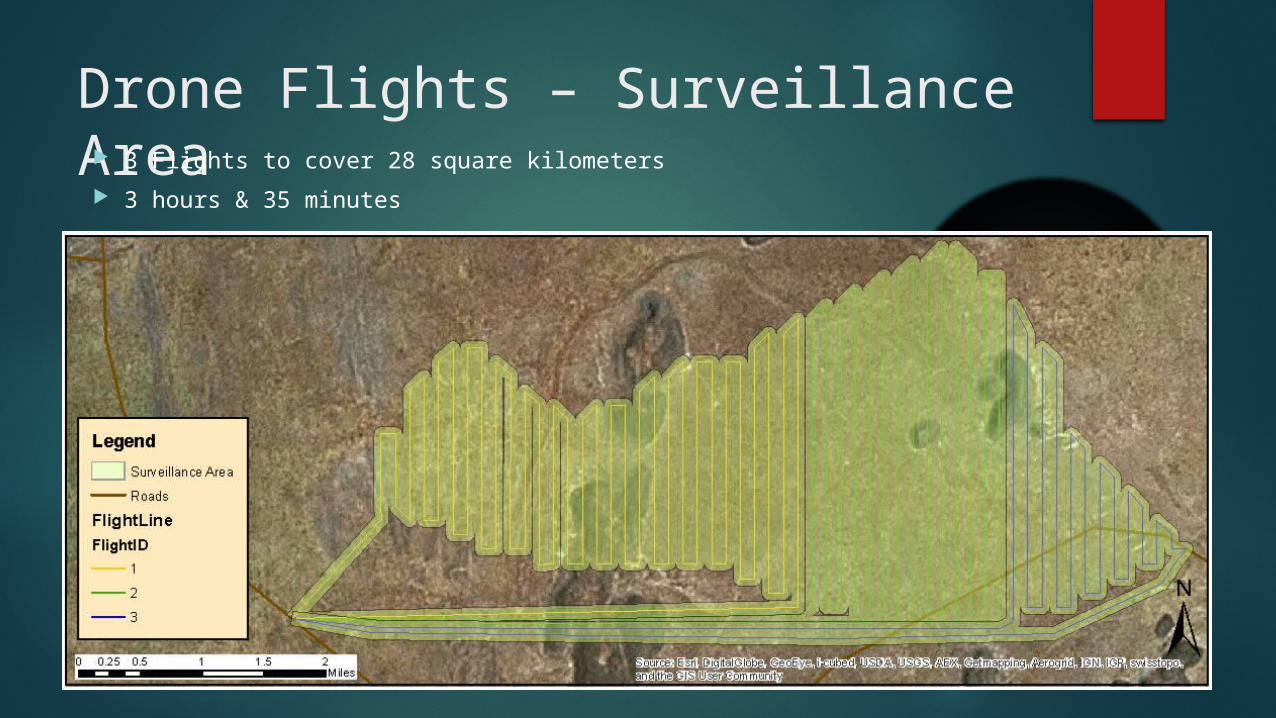
Drone Flights – Surveillance Area 3 Flights to cover 28 square kilometers
3 hours & 35 minutes
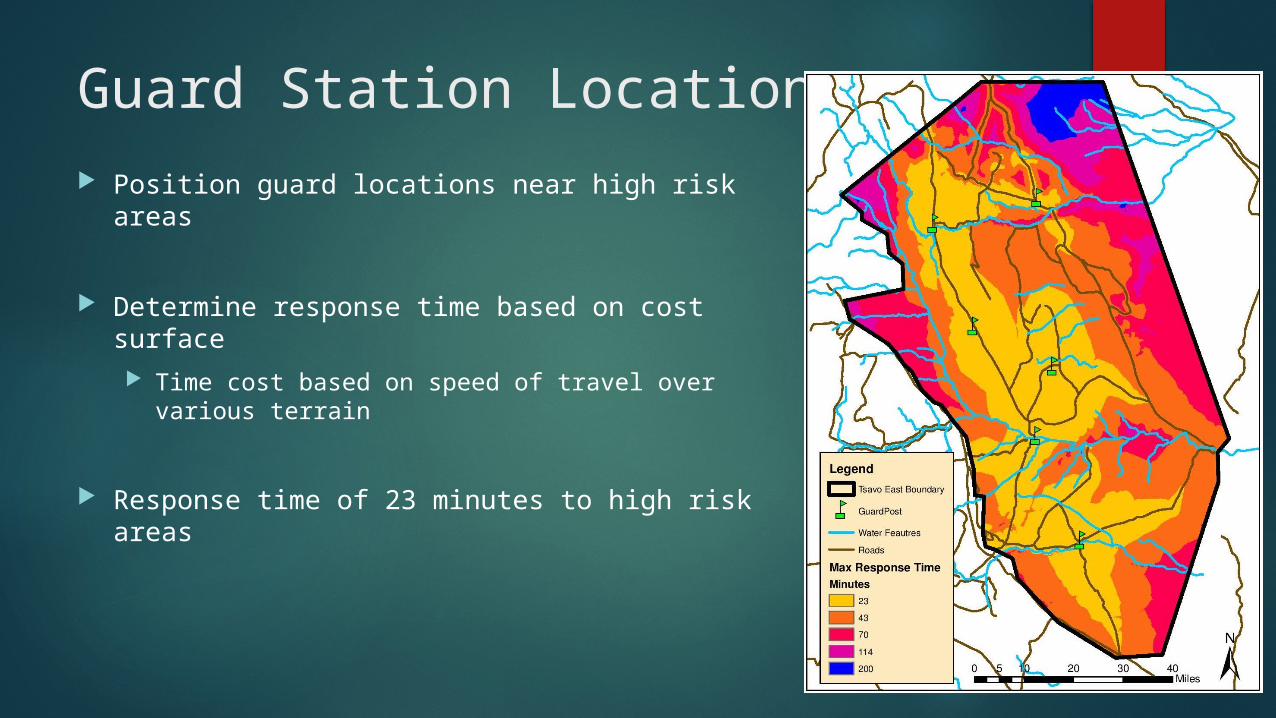
Guard Station Locations Position guard locations near high risk areas
Determine response time based on cost surface Time cost based on speed of travel over various
terrain
Response time of 23 minutes to high risk areas
Timeline Take GEOG 596B during the Fall 2 Quarter
Expanded analysis for complete data set August
Find possible journal for publication September
Conservation Biology
PlosOne Journal
Tropical Conservation Science
Refine paper to meet journal standards October through November
Submit article December
Acknowledgements MGIS peers and professors
Justine Blanford
Joseph Bishop and the “Why” question
Elephant conservation groups and rangers
David Sheldrick Wildlife Trust
Friends and family
John Wilkinson
Questions?