HEDL Information Disclosure Accounts - Year Ended 31 … · FS1 - Regulatory Profit Statement b)....
27
Information Disclosure prepared according to subpart 3 of Part 4A of the Commerce Act 1986 For the Year Ended 31 March 2008
Transcript of HEDL Information Disclosure Accounts - Year Ended 31 … · FS1 - Regulatory Profit Statement b)....

Information Disclosure prepared according tosubpart 3 of Part 4A of the Commerce Act 1986
For the Year Ended 31 March 2008

Contents
1. Introduction
2. Schedules
a). FS1 - Regulatory Profit Statement
b). FS2 - Asset and Financing Statement
c). FS3 - Regulatory Tax Allowance
d). AV1 - Regulatory Valuation Report
e). AV2 - Regulatory Value by Asset Class
f). AV3 - System Fixed Assets Replacement Cost Roll-Forward Report - 2008
g). AV3 - System Fixed Assets Replacement Cost Roll-Forward Report - 2007
h). AV3 - System Fixed Assets Replacement Cost Roll-Forward Report - 2006
i). AV3 - System Fixed Assets Replacement Cost Roll-Forward Report - 2005
j). AV4 - Business Merger, Acquisition for Sale - Regulatory Asset Base Disclosure
k). MP1 - Network Information
l). MP2 - Performance Measures
m). MP3 - Price and Quality Measures
n). AM1 - Expenditure Forecasts and Reconciliation
3. Related Party Note
4. Transitional Provisions

1. Introduction
These Information Disclosure documents are submitted by Horizon Energy Distribution Ltd pursuant to subpart 3 of Part 4A of the Commerce Act 1986 in accordance with:
- The Electricity Information Disclosure Requirements issued 31 March 2004, consolidating all amendments to 31 October 2008,
- The Electricity Distribution (Information Disclosure) Requirements 2008,
- The Electricity Information Disclosure Handbook (as amended 31 October 2008), and
- The Handbook for Optimised Deprival Valuation of System Fixed Assets of Electricity Lines Businesses (30 August 2004)

REPORT FS1: REGULATORY PROFIT STATEMENT
ref Electricity Distribution Business:
5 For Year Ended 20086 Income7 ($000)
8 Net Line Charge Revenue Received 25,202 9 plus Discretionary Discounts and Customer Rebates - FS1a
10 Gross Line Charge Income 25,202 11
12
13 Capital Contributions 1,064 14 plus Net Value of Vested Assets - 15 Total Capital Contributions and Vested Assets 1,064 16
17 AC Loss Rental Rebates Received 123 18 less AC Loss Rental Rebates Passed On 100 19 Net AC loss rental income (deficit) 24 20
21
22 Other Income 169 23 169 24
25 Total regulatory income 26,459 26
27
28 Expenses29
30 Transmission Charges - Payments to Transpower 5,476 31 plus Avoided Transmission Charges - payments to parties other than Transpower 2,181 32 Total Transmission Costs 7,657 33
34 Operational Expenditure:35 General Management, Administration and Overheads36 System Management and Operations - 37 Routine and Preventative Maintenance - to AM1
38 Refurbishment and Renewal Maintenance - to AM1
39 Fault and Emergency Maintenance - to AM1
40 Pass-through Costs 170 41 Other 6,289 42 Total Operational Expenditure 6,459 to MP2
43
44
45 Operational earnings 12,343 46
47
48 Regulatory Depreciation of System Fixed Assets (incl. value of assets decommissioned) 3,232 from AV1
49 plus Depreciation of Non-System Fixed Assets (incl. value of assets decommissioned) 877 from AV1
50 Total Regulatory Depreciation 4,109 to FS3
51
52
53 Earnings before interest and tax (EBIT) 8,234 to FS3
54
55 less Regulatory Tax Allowance 2,190 from FS3
56
57 plus Indexed Revaluation (of System Fixed Assets) 2,733 from AV1
58 plus Revaluations of Non-System Fixed Assets - from AV1
59
60 Regulatory profit / loss (pre-financing and distributions) 8,778 to MP2
Horizon Energy

REPORT FS1: REGULATORY PROFIT STATEMENT (cont)
Notes to Regulatory Profit Statement
69 FS1a: Discretionary Discounts: Customer Rebates and other line charge adjustments ($000)70 Customer Rebates - 71 Line Charge Holidays and other Discretionary Discounts - 72 Total Discretionary Discounts and Customer Rebates -
75 FS1b: Related party expenditure - summary ($000)76 Avoided Transmission Charges 229 77 Operational Expenditure 818
78 Subvention Payment - 79 Other related party expenditure - 80 Total Related Party Expenditure 1,046 81
82
83
N.B.: The additional Related Party information that is required to be disclosed in accordance with Section 3 of the Information Disclosure Handbook is to be disclosed by way of a separate note to this Schedule and forms part of this Schedule.
84
87 FS1c: Operational Expenditure notes ($000)
88
89 Merger and Acquisition Expenses
90 Merger and Acquisition Expenses (not to be included in Operational Expenditure) -
91
92 Material items (if greater than 10% of the Operational Expenditure line item)
93 Material item amount 1 1,676 Notes to be provided separately
94 within expenditure category:
95
96 Material item amount 2 1,712 Notes to be provided separately
97 within expenditure category:
98
99 Material item amount 3 Notes to be provided separately
100 within expenditure category:101
102 (further disclosures to be provided on separate page if required)
103
106 FS1d: Vested Assets ($000)107 Consideration Paid for Vested Assets
110 FS1e: Reclassified items in Operational Expenditure ($000)
111 Value of items which have been reclassified since previous disclosure (if greater than 10% of any affected line item)
112 Previous classification:
113 New classification:114
115 ($000)
116 Value of items which have been reclassified since previous disclosure (if greater than 10% of any affected line item)
117 Previous classification:
118 New classification:119
120 ($000)
121 Value of items which have been reclassified since previous disclosure (if greater than 10% of any affected line item)
122 Previous classification:
123 New classification:124
to be repeated as required for multiple reclassifications
Select one
Select one
Select one
Select one
Select one
Select one
Other
Other
Select one
FS1 (c) Material Item 1 $1,676,000 For Salaries and WagesMaterial Item 2 $1,712,000 For System Maintenance

REPORT FS2: REGULATORY ASSET AND FINANCING STATEMENT
ref Electricity Distribution Business:
5 For Year Ended 20086
7 Capital Expenditure on System Fixed Assets (by primary purpose) ($000)
8 Customer Connection - to AM1
9 System Growth - to AM1
10 Reliability, Safety and Environment - to AM1
11 Asset Replacement and Renewal - to AM1
12 Asset Relocations 2,799 to AM1
13 Total Capital Expenditure on System Fixed Assets 2,799 to AM1
14
15
16 Capital Expenditure on Non-System Fixed Assets 188 from AV1
17
18
19 Capital works roll-forward (for System Fixed Assets)20 Works Under Construction at Beginning of Year -
21 plus Total Capital Expenditure on System Fixed Assets 2,799
22 less Assets Commissioned in Year 2,220 from AV1
23 Works under construction at year end 579
24
25
26 Regulatory Investment Value calculation27 System Fixed Assets: regulatory value at end of Previous Year 81,197 from AV1
28 Non-System Fixed Assets: regulatory value at end of Previous Year 1,416 from AV1
29 Finance During Construction Allowance (on System Fixed assets) 1,989 2.45%
30 Total Regulatory Asset Base value at beginning of Current Financial Year 84,602
31
32 plus (System Fixed Assets Commissioned in Year 2,220 from AV1
33 System Fixed Assets Acquired From (Sold to) a Non-EDB in Year - from AV1
34 Non-System Fixed Assets: Asset Additions 188 from AV1
35 Regulatory Asset Base investment in Current Financial Year - total 2,408
36 Regulatory Asset Base investment in Current Financial Year - average 1,204
37
38 plus (minus) where a merger or acquisition has taken place within the year
39 Adjustment for merger, acquisition or sale to another EDB - from AV4
40
41 Regulatory Investment Value 85,806 to MP2
Horizon Energy
ref 11 & 12 All Capital Expenditure on System Fixed Assets has been included in the “Asset Relocations”category. Under the Transitional Provisions, the primary purpose allocations are not required inthe current year and the “total” is a blocked cell from editing.
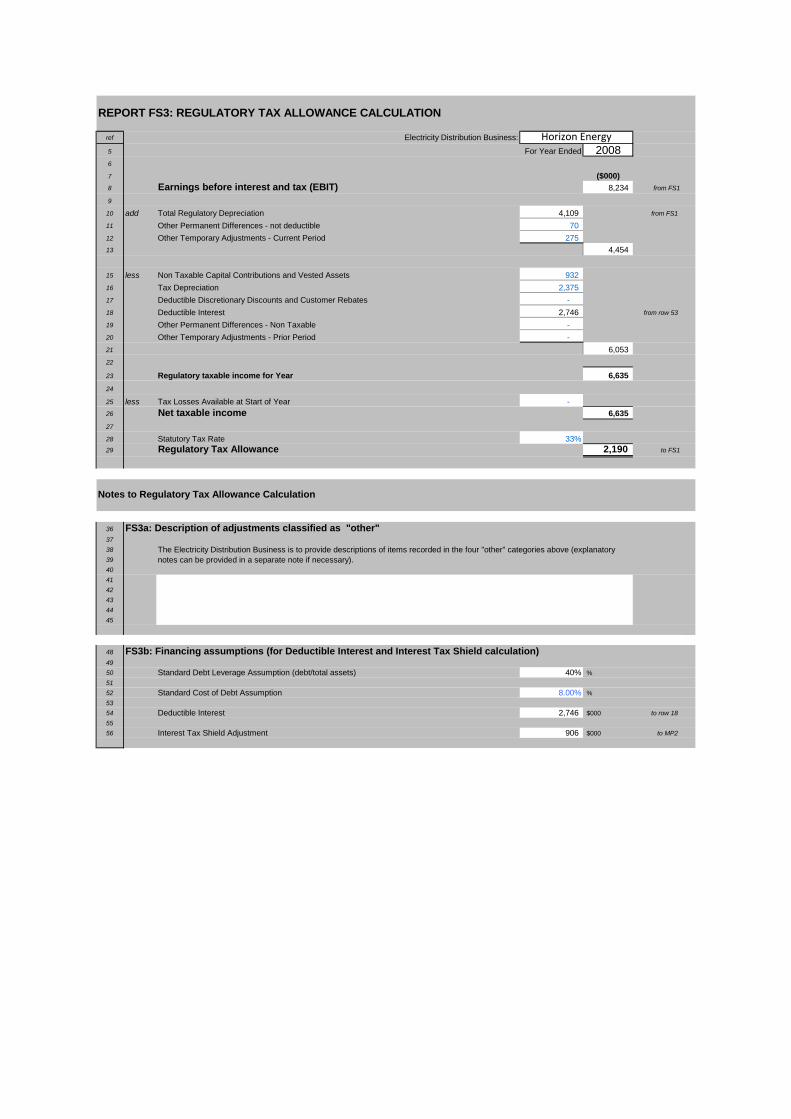
REPORT FS3: REGULATORY TAX ALLOWANCE CALCULATION
ref Electricity Distribution Business:
5 For Year Ended 20086
7 ($000)
8 Earnings before interest and tax (EBIT) 8,234 from FS1
9
10 add Total Regulatory Depreciation 4,109 from FS1
11 Other Permanent Differences - not deductible 70
12 Other Temporary Adjustments - Current Period 275
13 4,454
15 less Non Taxable Capital Contributions and Vested Assets 932
16 Tax Depreciation 2,375
17 Deductible Discretionary Discounts and Customer Rebates -
18 Deductible Interest 2,746 from row 53
19 Other Permanent Differences - Non Taxable -
20 Other Temporary Adjustments - Prior Period -
21 6,053
22
23 Regulatory taxable income for Year 6,635
24
25 less Tax Losses Available at Start of Year -
26 Net taxable income 6,635
27
28 Statutory Tax Rate 33%29 Regulatory Tax Allowance 2,190 to FS1
Notes to Regulatory Tax Allowance Calculation
36 FS3a: Description of adjustments classified as "other"37
38
39
40
41
42
43
44
45
48 FS3b: Financing assumptions (for Deductible Interest and Interest Tax Shield calculation)49
50 Standard Debt Leverage Assumption (debt/total assets) 40% %
51
52 Standard Cost of Debt Assumption 8.00% %
53
54 Deductible Interest 2,746 $000 to row 18
55
56 Interest Tax Shield Adjustment 906 $000 to MP2
Horizon Energy
The Electricity Distribution Business is to provide descriptions of items recorded in the four "other" categories above (explanatory notes can be provided in a separate note if necessary).
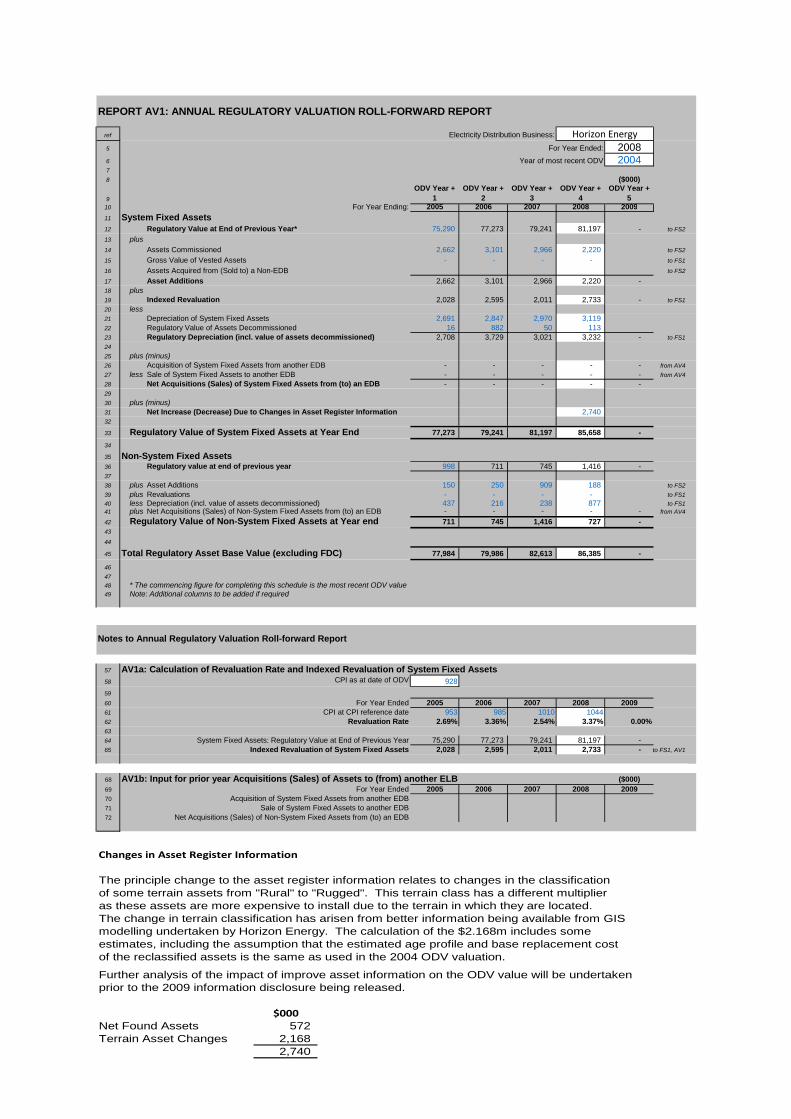
REPORT AV1: ANNUAL REGULATORY VALUATION ROLL-FORWARD REPORT
ref Electricity Distribution Business:
5 For Year Ended: 20086 Year of most recent ODV 20047
8 ($000)
9
ODV Year + 1
ODV Year + 2
ODV Year + 3
ODV Year + 4
ODV Year + 5
10 For Year Ending: 2005 2006 2007 2008 2009
11 System Fixed Assets
12 Regulatory Value at End of Previous Year* 75,290 77,273 79,241 81,197 - to FS2
13 plus14 Assets Commissioned 2,662 3,101 2,966 2,220 to FS2
15 Gross Value of Vested Assets - - - - to FS1
16 Assets Acquired from (Sold to) a Non-EDB to FS2
17 Asset Additions 2,662 3,101 2,966 2,220 - 18 plus19 Indexed Revaluation 2,028 2,595 2,011 2,733 - to FS1
20 less21 Depreciation of System Fixed Assets 2,691 2,847 2,970 3,119 22 Regulatory Value of Assets Decommissioned 16 882 50 113 23 Regulatory Depreciation (incl. value of assets decommissioned) 2,708 3,729 3,021 3,232 - to FS1
24
25 plus (minus)26 Acquisition of System Fixed Assets from another EDB - - - - - from AV4
27 less Sale of System Fixed Assets to another EDB - - - - - from AV4
28 Net Acquisitions (Sales) of System Fixed Assets from (to) an EDB - - - - - 29
30 plus (minus)31 Net Increase (Decrease) Due to Changes in Asset Register Information 2,740 32
33 Regulatory Value of System Fixed Assets at Year End 77,273 79,241 81,197 85,658 -
34
35 Non-System Fixed Assets36 Regulatory value at end of previous year 998 711 745 1,416 - 37
38 plus Asset Additions 150 250 909 188 to FS2
39 plus Revaluations - - - - to FS1
40 less Depreciation (incl. value of assets decommissioned) 437 216 238 877 to FS141 plus Net Acquisitions (Sales) of Non-System Fixed Assets from (to) an EDB - - - - - from AV4
42 Regulatory Value of Non-System Fixed Assets at Year end 711 745 1,416 727 - 43
44
45 Total Regulatory Asset Base Value (excluding FDC) 77,984 79,986 82,613 86,385 -
46
47
48 * The commencing figure for completing this schedule is the most recent ODV value49 Note: Additional columns to be added if required
Notes to Annual Regulatory Valuation Roll-forward Report
57 AV1a: Calculation of Revaluation Rate and Indexed Revaluation of System Fixed Assets58 CPI as at date of ODV 928
59
60 For Year Ended 2005 2006 2007 2008 200961 CPI at CPI reference date 953 985 1010 104462 Revaluation Rate 2.69% 3.36% 2.54% 3.37% 0.00%63
64 System Fixed Assets: Regulatory Value at End of Previous Year 75,290 77,273 79,241 81,197 - 65 Indexed Revaluation of System Fixed Assets 2,028 2,595 2,011 2,733 - to FS1, AV1
68 AV1b: Input for prior year Acquisitions (Sales) of Assets to (from) another ELB ($000)69 For Year Ended 2005 2006 2007 2008 200970 Acquisition of System Fixed Assets from another EDB71 Sale of System Fixed Assets to another EDB72 Net Acquisitions (Sales) of Non-System Fixed Assets from (to) an EDB
Horizon Energy
Changes in Asset Register Information
The principle change to the asset register information relates to changes in the classificationof some terrain assets from "Rural" to "Rugged". This terrain class has a different multiplieras these assets are more expensive to install due to the terrain in which they are located.The change in terrain classification has arisen from better information being available from GISmodelling undertaken by Horizon Energy. The calculation of the $2.168m includes someestimates, including the assumption that the estimated age profile and base replacement cost of the reclassified assets is the same as used in the 2004 ODV valuation.
Further analysis of the impact of improve asset information on the ODV value will be undertaken prior to the 2009 information disclosure being released.
$000Net Found Assets 572 Terrain Asset Changes 2,168
2,740

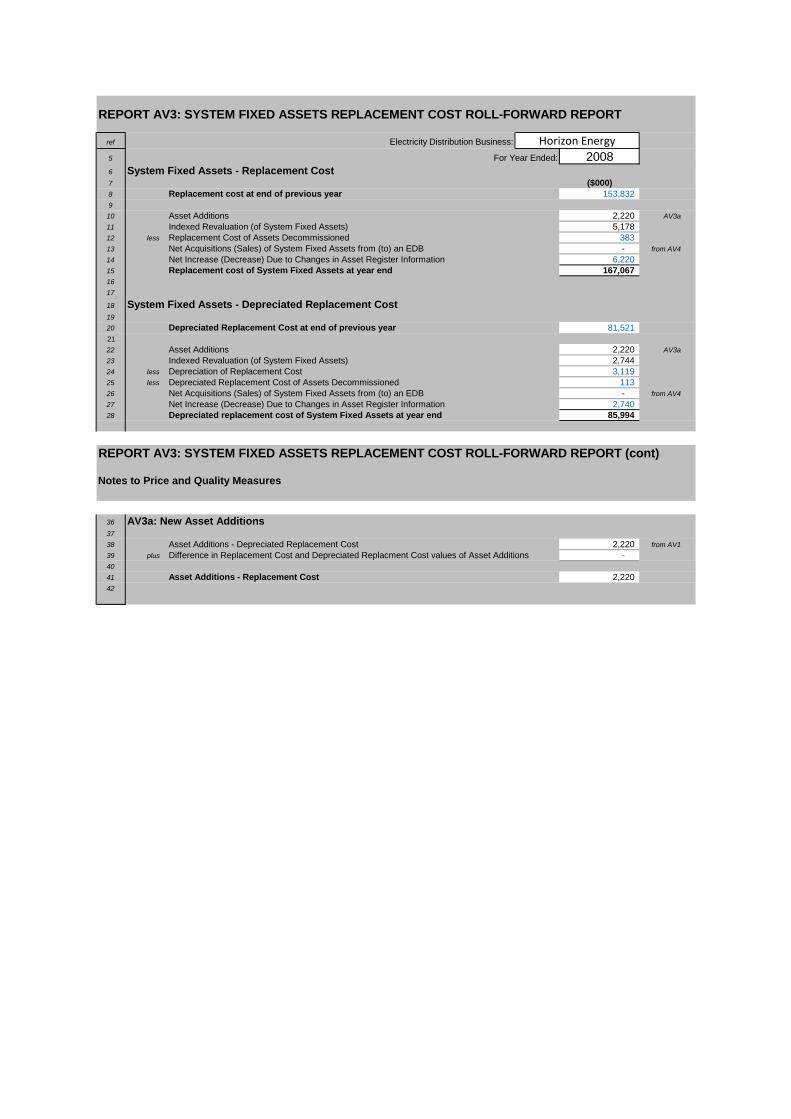
REPORT AV3: SYSTEM FIXED ASSETS REPLACEMENT COST ROLL-FORWARD REPORT
ref Electricity Distribution Business:
5 For Year Ended: 20086 System Fixed Assets - Replacement Cost7 ($000)8 Replacement cost at end of previous year 153,832 9
10 Asset Additions 2,220 AV3a
11 Indexed Revaluation (of System Fixed Assets) 5,178 12 less Replacement Cost of Assets Decommissioned 383 13 Net Acquisitions (Sales) of System Fixed Assets from (to) an EDB - from AV4
14 Net Increase (Decrease) Due to Changes in Asset Register Information 6,220 15 Replacement cost of System Fixed Assets at year end 167,067 16
17
18 System Fixed Assets - Depreciated Replacement Cost19
20 Depreciated Replacement Cost at end of previous year 81,521 21
22 Asset Additions 2,220 AV3a
23 Indexed Revaluation (of System Fixed Assets) 2,744 24 less Depreciation of Replacement Cost 3,119 25 less Depreciated Replacement Cost of Assets Decommissioned 113 26 Net Acquisitions (Sales) of System Fixed Assets from (to) an EDB - from AV4
27 Net Increase (Decrease) Due to Changes in Asset Register Information 2,740 28 Depreciated replacement cost of System Fixed Assets at year end 85,994
REPORT AV3: SYSTEM FIXED ASSETS REPLACEMENT COST ROLL-FORWARD REPORT (cont)
Notes to Price and Quality Measures
36 AV3a: New Asset Additions37
38 Asset Additions - Depreciated Replacement Cost 2,220 from AV1
39 plus Difference in Replacement Cost and Depreciated Replacment Cost values of Asset Additions - 40
41 Asset Additions - Replacement Cost 2,220 42
Horizon Energy

REPORT AV3: SYSTEM FIXED ASSETS REPLACEMENT COST ROLL-FORWARD REPORT
ref Electricity Distribution Business:
5 For Year Ended: 20076 System Fixed Assets - Replacement Cost7 ($000)8 Replacement cost at end of previous year 147,283 9
10 Asset Additions 2,966 AV3a
11 Indexed Revaluation (of System Fixed Assets) 3,738 12 less Replacement Cost of Assets Decommissioned 156 13 Net Acquisitions (Sales) of System Fixed Assets from (to) an EDB - from AV4
14 Net Increase (Decrease) Due to Changes in Asset Register Information - 15 Replacement cost of System Fixed Assets at year end 153,832 16
17
18 System Fixed Assets - Depreciated Replacement Cost19
20 Depreciated Replacement Cost at end of previous year 79,557 21
22 Asset Additions 2,966 AV3a
23 Indexed Revaluation (of System Fixed Assets) 2,019 24 less Depreciation of Replacement Cost 2,970 25 less Depreciated Replacement Cost of Assets Decommissioned 50 26 Net Acquisitions (Sales) of System Fixed Assets from (to) an EDB - from AV4
27 Net Increase (Decrease) Due to Changes in Asset Register Information - 28 Depreciated replacement cost of System Fixed Assets at year end 81,521
REPORT AV3: SYSTEM FIXED ASSETS REPLACEMENT COST ROLL-FORWARD REPORT (cont)
Notes to Price and Quality Measures
36 AV3a: New Asset Additions37
38 Asset Additions - Depreciated Replacement Cost 2,966 from AV1
39 plus Difference in Replacement Cost and Depreciated Replacment Cost values of Asset Additions - 40
41 Asset Additions - Replacement Cost 2,966 42
Horizon Energy

REPORT AV3: SYSTEM FIXED ASSETS REPLACEMENT COST ROLL-FORWARD REPORT
ref Electricity Distribution Business:
5 For Year Ended: 20066 System Fixed Assets - Replacement Cost7 ($000)8 Replacement cost at end of previous year 141,501 9
10 Asset Additions 3,101 AV3a
11 Indexed Revaluation (of System Fixed Assets) 4,751 12 less Replacement Cost of Assets Decommissioned 2,070 13 Net Acquisitions (Sales) of System Fixed Assets from (to) an EDB - from AV4
14 Net Increase (Decrease) Due to Changes in Asset Register Information - 15 Replacement cost of System Fixed Assets at year end 147,283 16
17
18 System Fixed Assets - Depreciated Replacement Cost19
20 Depreciated Replacement Cost at end of previous year 77,580 21
22 Asset Additions 3,101 AV3a
23 Indexed Revaluation (of System Fixed Assets) 2,605 24 less Depreciation of Replacement Cost 2,847 25 less Depreciated Replacement Cost of Assets Decommissioned 882 26 Net Acquisitions (Sales) of System Fixed Assets from (to) an EDB - from AV4
27 Net Increase (Decrease) Due to Changes in Asset Register Information - 28 Depreciated replacement cost of System Fixed Assets at year end 79,557
REPORT AV3: SYSTEM FIXED ASSETS REPLACEMENT COST ROLL-FORWARD REPORT (cont)
Notes to Price and Quality Measures
36 AV3a: New Asset Additions37
38 Asset Additions - Depreciated Replacement Cost 3,101 from AV1
39 plus Difference in Replacement Cost and Depreciated Replacment Cost values of Asset Additions - 40
41 Asset Additions - Replacement Cost 3,101 42
Horizon Energy
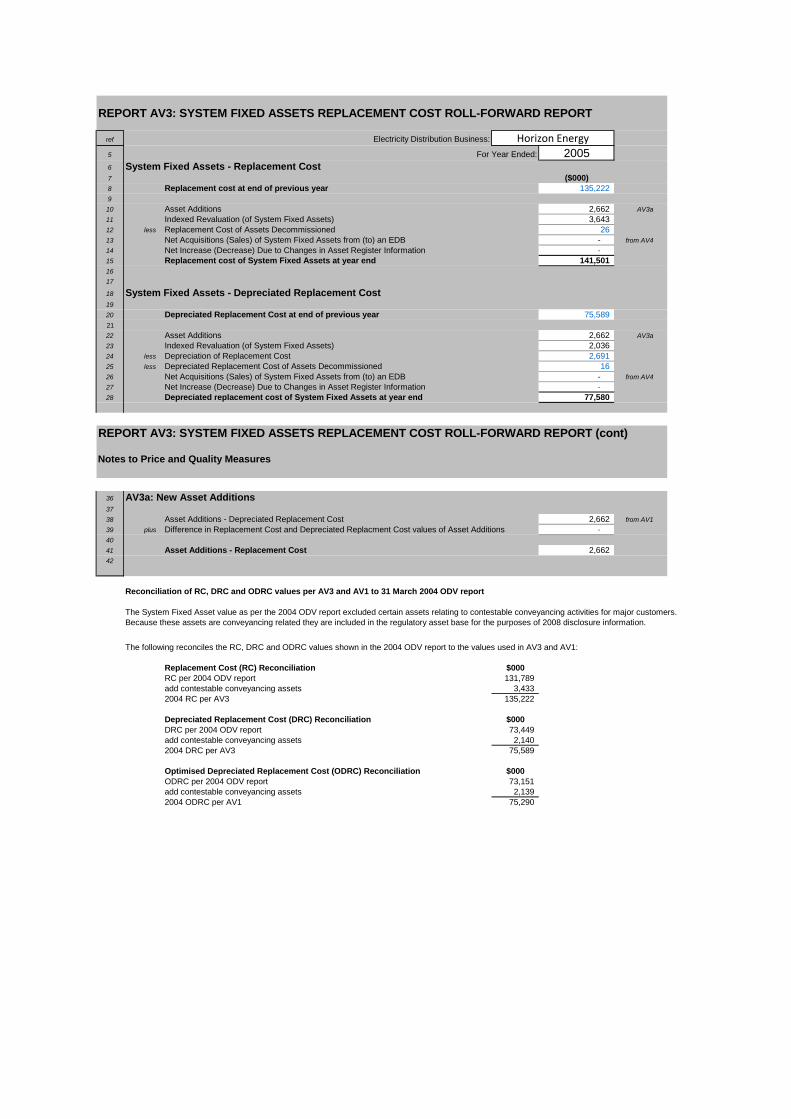
REPORT AV3: SYSTEM FIXED ASSETS REPLACEMENT COST ROLL-FORWARD REPORT
ref Electricity Distribution Business:
5 For Year Ended: 20056 System Fixed Assets - Replacement Cost7 ($000)8 Replacement cost at end of previous year 135,222 9
10 Asset Additions 2,662 AV3a
11 Indexed Revaluation (of System Fixed Assets) 3,643 12 less Replacement Cost of Assets Decommissioned 26 13 Net Acquisitions (Sales) of System Fixed Assets from (to) an EDB - from AV4
14 Net Increase (Decrease) Due to Changes in Asset Register Information - 15 Replacement cost of System Fixed Assets at year end 141,501 16
17
18 System Fixed Assets - Depreciated Replacement Cost19
20 Depreciated Replacement Cost at end of previous year 75,589 21
22 Asset Additions 2,662 AV3a
23 Indexed Revaluation (of System Fixed Assets) 2,036 24 less Depreciation of Replacement Cost 2,691 25 less Depreciated Replacement Cost of Assets Decommissioned 16 26 Net Acquisitions (Sales) of System Fixed Assets from (to) an EDB - from AV4
27 Net Increase (Decrease) Due to Changes in Asset Register Information - 28 Depreciated replacement cost of System Fixed Assets at year end 77,580
REPORT AV3: SYSTEM FIXED ASSETS REPLACEMENT COST ROLL-FORWARD REPORT (cont)
Notes to Price and Quality Measures
36 AV3a: New Asset Additions37
38 Asset Additions - Depreciated Replacement Cost 2,662 from AV1
39 plus Difference in Replacement Cost and Depreciated Replacment Cost values of Asset Additions - 40
41 Asset Additions - Replacement Cost 2,662 42
Reconciliation of RC, DRC and ODRC values per AV3 and AV1 to 31 March 2004 ODV report
The System Fixed Asset value as per the 2004 ODV report excluded certain assets relating to contestable conveyancing activities for major customers.Because these assets are conveyancing related they are included in the regulatory asset base for the purposes of 2008 disclosure information.
The following reconciles the RC, DRC and ODRC values shown in the 2004 ODV report to the values used in AV3 and AV1:
Replacement Cost (RC) Reconciliation $000RC per 2004 ODV report 131,789 add contestable conveyancing assets 3,433 2004 RC per AV3 135,222
Depreciated Replacement Cost (DRC) Reconciliation $000DRC per 2004 ODV report 73,449 add contestable conveyancing assets 2,140 2004 DRC per AV3 75,589
Optimised Depreciated Replacement Cost (ODRC) Reconciliation $000ODRC per 2004 ODV report 73,151 add contestable conveyancing assets 2,139 2004 ODRC per AV1 75,290
Horizon Energy
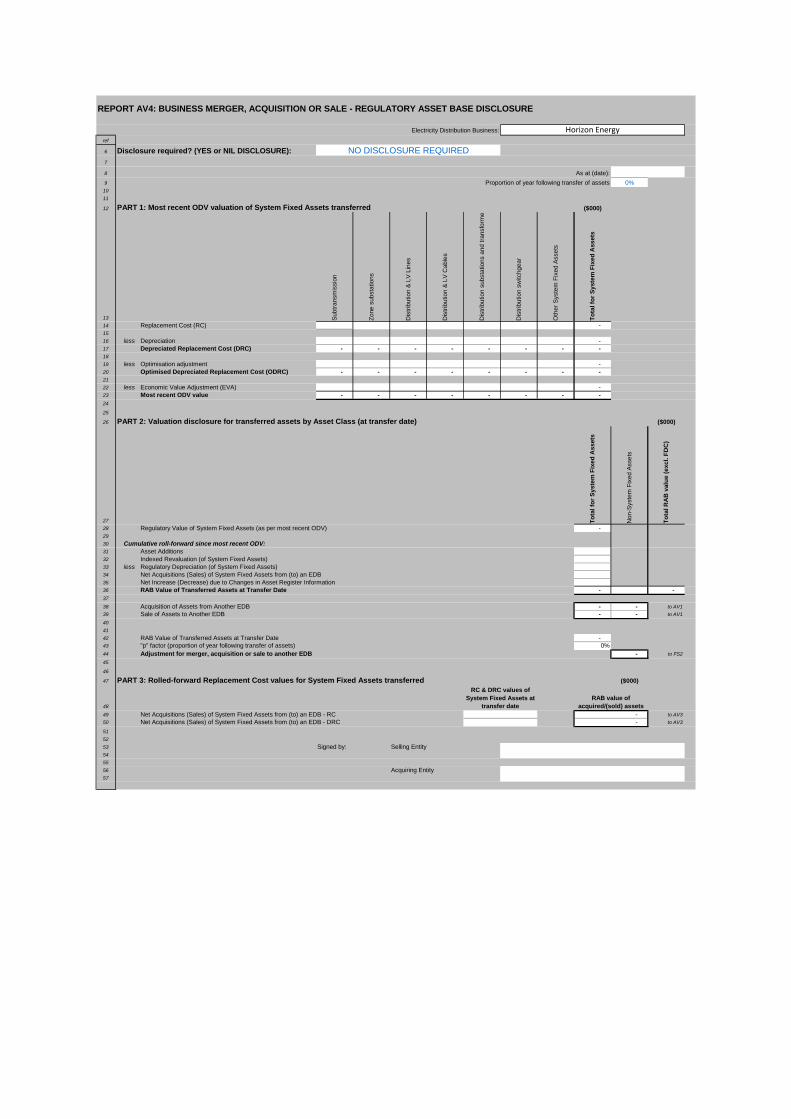
REPORT AV4: BUSINESS MERGER, ACQUISITION OR SALE - REGULATORY ASSET BASE DISCLOSURE
Electricity Distribution Business:
ref
6 Disclosure required? (YES or NIL DISCLOSURE):
7
8 As at (date):
9 Proportion of year following transfer of assets 0%10
11
12 PART 1: Most recent ODV valuation of System Fixed Assets transferred ($000)
13 Sub
tra
nsm
issi
on
Zon
e s
ubs
tatio
ns
Dis
trib
utio
n &
LV
Lin
es
Dis
trib
utio
n &
LV
Cab
les
Dis
trib
utio
n su
bsta
tions
and
tra
nsfo
rme
Dis
trib
utio
n sw
itchg
ear
Oth
er S
yste
m F
ixed
Ass
ets
To
tal f
or
Sy
ste
m F
ixe
d A
sset
s
14 Replacement Cost (RC) - 15
16 less Depreciation - 17 Depreciated Replacement Cost (DRC) - - - - - - - - 18
19 less Optimisation adjustment - 20 Optimised Depreciated Replacement Cost (ODRC) - - - - - - - - 21
22 less Economic Value Adjustment (EVA) - 23 Most recent ODV value - - - - - - - - 24
25
26 PART 2: Valuation disclosure for transferred assets by Asset Class (at transfer date) ($000)
27 To
tal f
or
Sy
ste
m F
ixe
d A
sset
s
No
n-S
yste
m F
ixed
Ass
ets
To
tal R
AB
val
ue
(exc
l. F
DC
)
28 Regulatory Value of System Fixed Assets (as per most recent ODV) - 29
30 Cumulative roll-forward since most recent ODV:31 Asset Additions32 Indexed Revaluation (of System Fixed Assets)33 less Regulatory Depreciation (of System Fixed Assets)34 Net Acquisitions (Sales) of System Fixed Assets from (to) an EDB35 Net Increase (Decrease) due to Changes in Asset Register Information36 RAB Value of Transferred Assets at Transfer Date - - 37
38 Acquisition of Assets from Another EDB - - to AV1
39 Sale of Assets to Another EDB - - to AV1
40
41
42 RAB Value of Transferred Assets at Transfer Date - 43 "p" factor (proportion of year following transfer of assets) 0%44 Adjustment for merger, acquisition or sale to another EDB - to FS2
45
46
47 PART 3: Rolled-forward Replacement Cost values for System Fixed Assets transferred ($000)
48
49 Net Acquisitions (Sales) of System Fixed Assets from (to) an EDB - RC to AV3
50 Net Acquisitions (Sales) of System Fixed Assets from (to) an EDB - DRC to AV3
51
52
53 Signed by: Selling Entity54
55
56 Acquiring Entity57
-
Horizon Energy
NO DISCLOSURE REQUIRED
RC & DRC values of System Fixed Assets at
transfer dateRAB value of
acquired/(sold) assets-
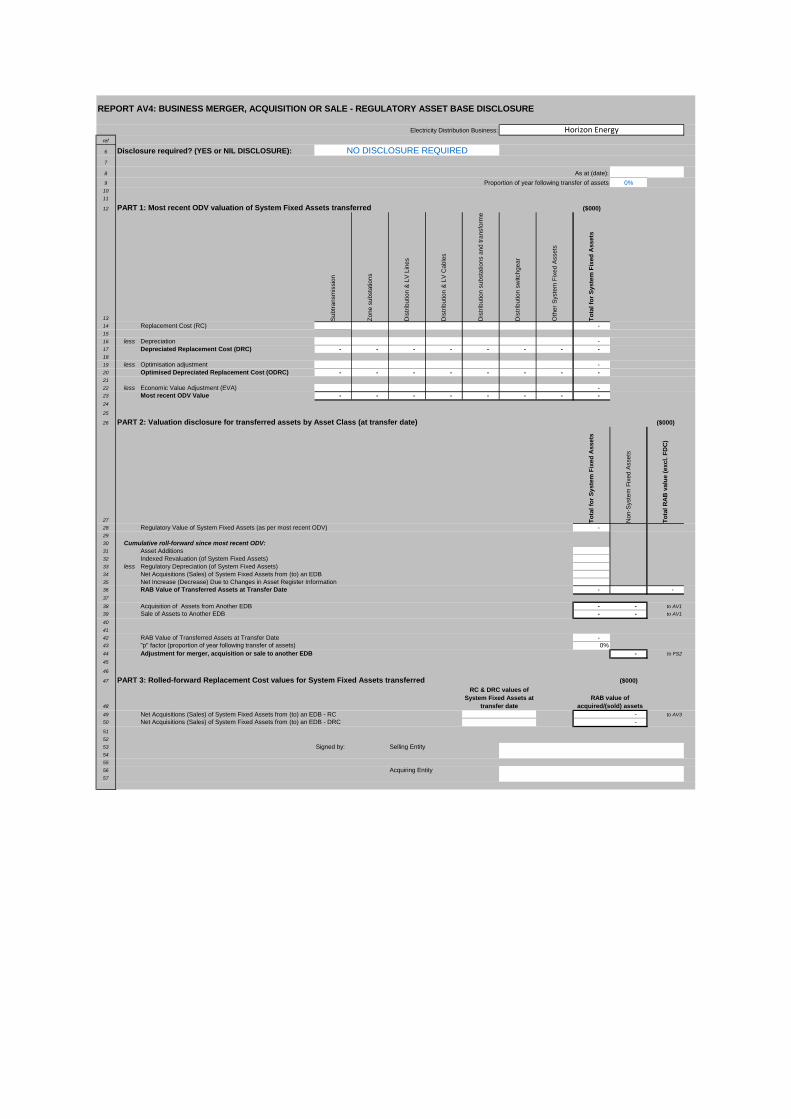
REPORT AV4: BUSINESS MERGER, ACQUISITION OR SALE - REGULATORY ASSET BASE DISCLOSURE
Electricity Distribution Business:
ref
6 Disclosure required? (YES or NIL DISCLOSURE):
7
8 As at (date):
9 Proportion of year following transfer of assets 0%10
11
12 PART 1: Most recent ODV valuation of System Fixed Assets transferred ($000)
13 Su
btra
nsm
issi
on
Zon
e su
bsta
tion
s
Dis
trib
utio
n &
LV
Lin
es
Dis
trib
utio
n &
LV
Cab
les
Dis
trib
utio
n s
ubs
tatio
ns
and
tra
nsfo
rme
Dis
trib
utio
n s
witc
hge
ar
Oth
er
Sys
tem
Fix
ed
Ass
ets
To
tal f
or
Sys
tem
Fix
ed A
sset
s
14 Replacement Cost (RC) - 15
16 less Depreciation - 17 Depreciated Replacement Cost (DRC) - - - - - - - - 18
19 less Optimisation adjustment - 20 Optimised Depreciated Replacement Cost (ODRC) - - - - - - - - 21
22 less Economic Value Adjustment (EVA) - 23 Most recent ODV Value - - - - - - - - 24
25
26 PART 2: Valuation disclosure for transferred assets by Asset Class (at transfer date) ($000)
27 To
tal
for
Sy
stem
Fix
ed
As
sets
Non
-Sys
tem
Fix
ed
Ass
ets
To
tal
RA
B v
alu
e (
exc
l. F
DC
)
28 Regulatory Value of System Fixed Assets (as per most recent ODV) - 29
30 Cumulative roll-forward since most recent ODV:31 Asset Additions32 Indexed Revaluation (of System Fixed Assets)33 less Regulatory Depreciation (of System Fixed Assets)34 Net Acquisitions (Sales) of System Fixed Assets from (to) an EDB35 Net Increase (Decrease) Due to Changes in Asset Register Information36 RAB Value of Transferred Assets at Transfer Date - - 37
38 Acquisition of Assets from Another EDB - - to AV1
39 Sale of Assets to Another EDB - - to AV1
40
41
42 RAB Value of Transferred Assets at Transfer Date - 43 "p" factor (proportion of year following transfer of assets) 0%44 Adjustment for merger, acquisition or sale to another EDB - to FS2
45
46
47 PART 3: Rolled-forward Replacement Cost values for System Fixed Assets transferred ($000)
48
49 Net Acquisitions (Sales) of System Fixed Assets from (to) an EDB - RC to AV3
50 Net Acquisitions (Sales) of System Fixed Assets from (to) an EDB - DRC
51
52
53 Signed by: Selling Entity54
55
56 Acquiring Entity57
Horizon Energy
NO DISCLOSURE REQUIRED
- -
RC & DRC values of System Fixed Assets at
transfer dateRAB value of
acquired/(sold) assets

REPORT AV4: BUSINESS MERGER, ACQUISITION OR SALE - REGULATORY ASSET BASE DISCLOSURE
Electricity Distribution Business:
ref
6 Disclosure required? (YES or NIL DISCLOSURE):
7
8 As at (date):
9 Proportion of year following transfer of assets 0%10
11
12 PART 1: Most recent ODV valuation of System Fixed Assets transferred ($000)
13 Sub
tra
nsm
issi
on
Zon
e su
bsta
tions
Dis
trib
utio
n &
LV
Lin
es
Dis
trib
utio
n &
LV
Cab
les
Dis
trib
utio
n su
bsta
tions
and
tra
nsfo
rme
Dis
trib
utio
n sw
itch
gea
r
Oth
er S
yste
m F
ixed
Ass
ets
To
tal f
or
Sy
ste
m F
ixe
d A
sset
s
14 Replacement Cost (RC) - 15
16 less Depreciation - 17 Depreciated Replacement Cost (DRC) - - - - - - - - 18
19 less Optimisation adjustment - 20 Optimised Depreciated Replacement Cost (ODRC) - - - - - - - - 21
22 less Economic Value Adjustment (EVA) - 23 Most recent ODV Value - - - - - - - - 24
25
26 PART 2: Valuation disclosure for transferred assets by Asset Class (at transfer date) ($000)
27 To
tal f
or
Sy
ste
m F
ixe
d A
sset
s
No
n-S
yste
m F
ixed
Ass
ets
To
tal R
AB
val
ue
(exc
l. F
DC
)
28 Regulatory Value of System Fixed Assets (as per most recent ODV) - 29
30 Cumulative roll-forward since most recent ODV:31 Asset Additions32 Indexed Revaluation (of System Fixed Assets)33 less Regulatory Depreciation (of System Fixed Assets)34 Net Acquisitions (Sales) of System Fixed Assets from (to) an EDB35 Net Increase (Decrease) Due to Changes in Asset Register Information36 RAB Value of Transferred Assets at Transfer Date - - 37
38 Acquisition of Assets from another EDB - - to AV1
39 Sale of Assets to another EDB - - to AV1
40
41
42 RAB Value of Transferred Assets at Transfer Date - 43 "p" factor (proportion of year following transfer of assets) 0%44 Adjustment for merger, acquisition or sale to another EDB - to FS2
45
46
47 PART 3: Rolled-forward Replacement Cost values for System Fixed Assets transferred ($000)
48
49 Net Acquisitions (Sales) of System Fixed Assets from (to) an EDB - RC to AV3
50 Net Acquisitions (Sales) of System Fixed Assets from (to) an EDB - DRC to AV3
51
52
53 Signed by: Selling Entity54
55
56 Acquiring Entity57
Horizon Energy
NO DISCLOSURE REQUIRED
- -
RC & DRC values of System Fixed Assets at
transfer dateRAB value of
acquired/(sold) assets

REPORT MP1: NETWORK INFORMATION (Separate report required for each Non-Contiguous Network)
ref Electricity Distribution Business:
6 For Year Ended: 20087 Network Name: (enter "Total Business" or name of network)
Disclosure:9
10 Circuit Length by Operating Line Voltage (at year end) Overhead Underground Total11 (km) (km) (km)
12 > 66kV - - - 13 50kV & 66kV - - - 14 33kV 178 3 181 15 SWER (all SWER voltages) 63 63 16 22kV (other than SWER) - - - 17 6.6kV to 11kV (inclusive - other than SWER) 1,449 161 1,610 18 Low Voltage (< 1kV) 228 260 488 19 Total circuit length (for Supply) 1,918 424 2,342 to MP2
20
21 Dedicated Street Lighting Circuit Length - 22
23 Overhead Circuit Length by Terrain (at year end) (km) (%)24 Urban (only) 243 13%25 Rural (only) 1,096 57%26 Remote (only) 29 1%27 Rugged (only) 517 27%28 Rural & rugged (only) - 0%29 Remote & rugged (only) 34 2%30 Unallocated overhead lines - 0%31 Total overhead length 1,918 100%32 -
33
34 Transformer capacity (at year end) Previous Year
35 Distribution Transformer Capacity (EDB Owned) 244 MVA 244
36 Distribution Transformer Capacity (Non-EDB Owned, Estimated) 41 MVA 41
37 Total Distribution Transformer Capacity 284 MVA (to MP2) 284
38
39 Zone Substation Transformer Capacity 97 MVA 97
40
41 System Fixed Assets age (at year end)
42 Average Age of System Fixed Assets 25 Years
43 Average Expected Total Life of System Fixed Assets 52 Years
44 Average Age as a Proportion of Average Expected Total Life 49% %
45
46 Estimated Proportion of Assets (by Replacement Cost) within 10 years of Total Life 8% %
47
48
49 Maximum50 coincident Non-coincident
51 Electricity demand system Sum of maximum52 demand (MW) demands (MW)53 GXP Demand 77 90 54 plus Embedded Generation Output at HV and Above 19 55 Maximum System Demand 96 56 less Net Transfers to (from) Other EDBs at HV and Above - 57 Demand on system for supply to customers' Connection Points 96 58 less Subtransmission Customers' Connection Point Demand 18 21 59 Maximum Distribution Transformer Demand 78 to MP2
60
61 GXP Demand not Supplied at Subtransmission Level 22 62 Embedded Generation Output - Connected to Subtransmission System 6 12 63 Net Transfers to (from) Other EDBs at Subtransmission Level Only - - 64
65 Estimated Controlled Load Shed at Time of Maximum System Demand (MW) 10 66 67 Five-Year System Maximum Demand Growth Forecast 1.9 % p.a.
68
69 Electricity volumes carried (GWh)70 Electricity Supplied from GXPs 438 71 less Electricity Exports to GXPs - 72 plus Electricity Supplied from Embedded Generators 127 73 less Net Electricity Supplied to (from) Other EDBs - 74 Electricity entering system for supply to customers' Connection Points 565 75 less Electricity Supplied to Customers' Connection Points 541 to MP2
76 Electricity Losses (loss ratio) 24 4.3% %
77
78 Electricity Supplied to Customers' Connection Points 541 79 less Electricity Supplied to Largest 5 Connection Points 295 80 Electricity supplied other than to Largest 5 Connection Points 246 45% %
81
82 Load Factor 67% %
83
84 Number of Connection Points (at year end) 24,220 ICPs to MP2
85
86 Intensity of service requirements87 Demand Density (Maximum Distribution Transformer Demand / Total circuit length) 33 kW/km
88 Volume Density (Electricity Supplied to Customers' Connection Points / Total circuit length) 231 MWh/km
89 Connection Point Density (ICPs / Total circuit length) 10 ICP/km
90 Energy Intensity (Electricity Supplied to Customers' Connection Points / ICP) 22,318 kWh/ICP
Horizon Energy
Horizon Energy
Annual Disclosure - Requirement 6(1)
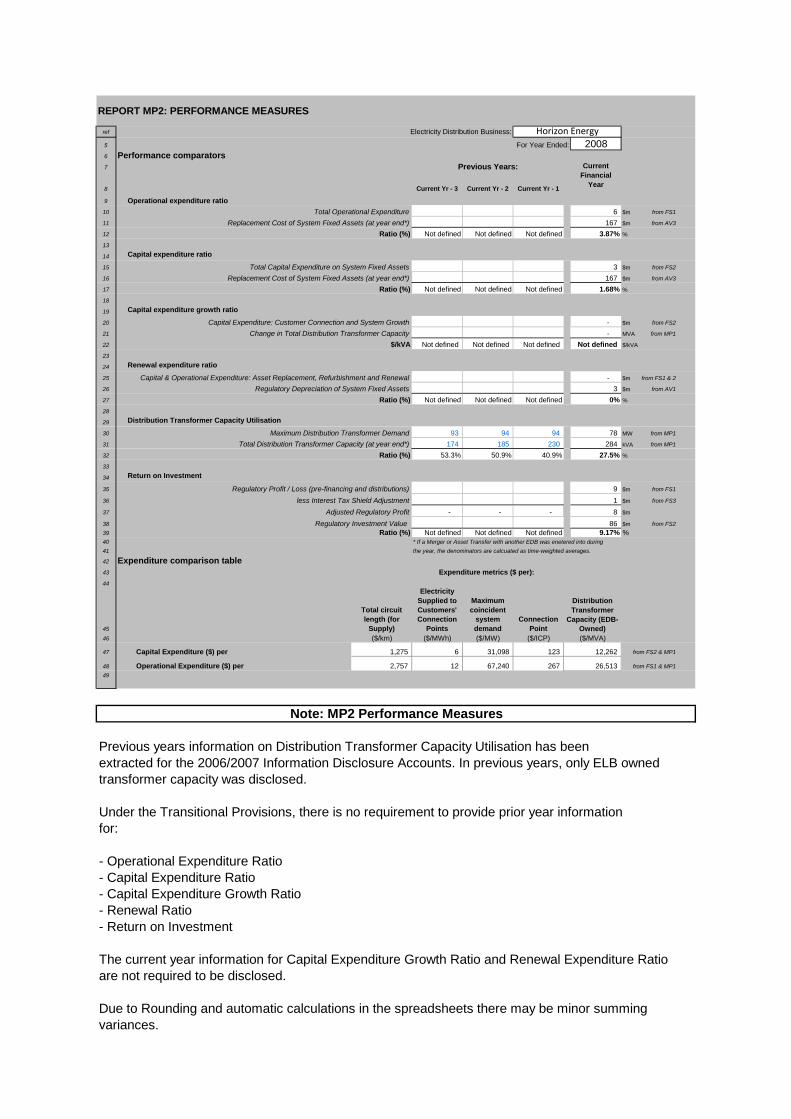
REPORT MP2: PERFORMANCE MEASURES
ref Electricity Distribution Business:
5 For Year Ended: 20086 Performance comparators7
8 Current Yr - 3 Current Yr - 2 Current Yr - 1
9 Operational expenditure ratio
10 6 $m from FS1
11 167 $m from AV3
12 Ratio (%) Not defined Not defined Not defined 3.87% %
13
14 Capital expenditure ratio
15 3 $m from FS2
16 167 $m from AV3
17 Ratio (%) Not defined Not defined Not defined 1.68% %
18
19 Capital expenditure growth ratio
20 - $m from FS2
21 - MVA from MP1
22 $/kVA Not defined Not defined Not defined Not defined $/kVA
23
24 Renewal expenditure ratio
25 - $m from FS1 & 2
26 3 $m from AV1
27 Ratio (%) Not defined Not defined Not defined 0% %
28
29 Distribution Transformer Capacity Utilisation
30 93 94 94 78 MW from MP1
31 174 185 230 284 kVA from MP1
32 Ratio (%) 53.3% 50.9% 40.9% 27.5% %
33
34 Return on Investment
35 9 $m from FS1
36 1 $m from FS3
37 - - - 8 $m
38 86 $m from FS2
39 Ratio (%) Not defined Not defined Not defined 9.17% %40 * If a Merger or Asset Transfer with another EDB was enetered into during
41 the year, the denominators are calcuated as time-weighted averages.
42 Expenditure comparison table43
44
45
Total circuit length (for
Supply)
Electricity Supplied to Customers' Connection
Points
Maximum coincident
system demand
Connection Point
46 ($/km) ($/MWh) ($/MW) ($/ICP)
47 Capital Expenditure ($) per 1,275 6 31,098 123 from FS2 & MP1
48 Operational Expenditure ($) per 2,757 12 67,240 267 from FS1 & MP1
49
($/MVA)
Regulatory Investment Value
Regulatory Depreciation of System Fixed Assets
less Interest Tax Shield Adjustment
Capital & Operational Expenditure: Asset Replacement, Refurbishment and Renewal
Adjusted Regulatory Profit
Previous Years: Current Financial
Year
Regulatory Profit / Loss (pre-financing and distributions)
Maximum Distribution Transformer Demand
Total Capital Expenditure on System Fixed Assets
Replacement Cost of System Fixed Assets (at year end*)
26,513
Distribution Transformer
Capacity (EDB-Owned)
Expenditure metrics ($ per):
Horizon Energy
Capital Expenditure: Customer Connection and System Growth
Change in Total Distribution Transformer Capacity
Total Operational Expenditure
Replacement Cost of System Fixed Assets (at year end*)
12,262
Total Distribution Transformer Capacity (at year end*)
Previous years information on Distribution Transformer Capacity Utilisation has beenextracted for the 2006/2007 Information Disclosure Accounts. In previous years, only ELB ownedtransformer capacity was disclosed.
Under the Transitional Provisions, there is no requirement to provide prior year informationfor:
- Operational Expenditure Ratio- Capital Expenditure Ratio- Capital Expenditure Growth Ratio- Renewal Ratio- Return on Investment
The current year information for Capital Expenditure Growth Ratio and Renewal Expenditure Ratioare not required to be disclosed.
Due to Rounding and automatic calculations in the spreadsheets there may be minor summingvariances.
Note: MP2 Performance Measures

REPORT MP3: PRICE & QUALITY MEASURES(Separate report required for each Non-contiguous Network)
ref Electricity Distribution Business:
6 For Year Ended: 20087 Network Name:
Disclosure:
9
10 QUALITY11
12 Interruptions13 Interruptions by class14 Class A 3 planned interruptions by Transpower:
15 Class B 62 planned interruptions on the network
16 Class C 76 unplanned interruptions on the network
17 Class D 9 unplanned interruptions by Transpower
18 Class E - unplanned interruptions of network owned generation
19 Class F 3 unplanned interruptions of generation (non-network)
20 Class G - unplanned interruptions caused by other electricity industry participant
21 Class H - planned interruptions caused by other electricity industry participant
22 Total 153 Total of above
23
24 Interruption targets for Forecast Year 2009 Current Financial Year +125 Class B 45 planned interruptions on the network
26 Class C 100 unplanned interruptions on the network
27
28 Average interruption targets for 5 Forecast Years 2009-2013 Current Financial Year +1 to +529 Class B 45 planned interruptions on the network
30 Class C 100 unplanned interruptions on the network
31
32 Class C interruptions restored within ≤3Hrs >3hrs33 64 12 34
35 Faults36 Faults per 100 circuit kilometres37 The total number of faults for Current Financial Year 4.07 2008
38 The total number of faults forecast for the Forecast Year 5.00 2009
39 The average annual number of faults forecast for the 5 Forecast Years 5.00 2009-2013
40
41 Fault Information per 100 circuit kilometres by Voltage and Type
42
6.6kV & 11kV non-
SWER22kV non-
SWER SWER 33kV 50kV & 66kV >66kV43 Is this voltage part of the EDB system? Yes No No Yes No No44 Current Financial Year 4.38 1.11 45 Forecast Year 5.00 2.00 46 Average annual for 5 Forecast Years 5.00 2.00 47
48 Fault Information per 100 circuit kilometres by Voltage and Type
49
6.6kV & 11kV non-
SWER22kV non-
SWER SWER 33kV 50kV & 66kV >66kV50 Underground 1.80 - 51 Overhead 4.67 1.12 52
53 Reliability54 Overall reliability SAIDI SAIFI CAIDI55 Based on the total number of interruptions 345.52 2.45 141.03 56
57 Reliability by interruption class SAIDI SAIFI CAIDI58 Class B 26.52 0.15 182.43 59 Class C 116.56 1.42 82.08 60
61 Targets for Forecast Year SAIDI SAIFI CAIDI62 Class B 45.00 0.30 150.00 63 Class C 100.00 1.50 67.00 64
65 Average targets for 5 Forecast Years SAIDI SAIFI CAIDI66 Class B 45.00 0.30 150.00 67 Class C 100.00 1.50 67.00 68
69
70 PRICES71
72 Price information by Connection Point Class73
74
75
Small Connection
Points
Medium Connection
Points
Large Connection
Points
Largest 5 Connection
Points Total
76 Gross line charge income ($000) 12,149 5,061 4,306.61 3,685 25,202 from FS1
77 Electricity Supplied to Customers' Connection Points (MWh) 127,933 58,142 59,510 294,950 540,535 Error (MP1)
78 Number of Connection Points (ICPs) at year end 20,636 3,260 319 5 24,220 from MP1
79 Unit Price (cents/kWh) 9.5 8.7 7.2 1.2 4.7
80 Relative Unit Price Index 1.00 0.92 0.76 0.13 0.49
81
Annual Disclosure - Requirement 6(1)
Connection Point Class
Horizon Energy
Horizon Energy
in year
in year
average over years

REPORT MP3: PRICE AND QUALITY (cont)
Notes to Price and Quality Measures
89 MP3a: Connection Point Class breakpoints90
91 Connection Point Class breakpoints methodology 92
93 kVA based breakpoints - additional disclosure94 Breakpoint between small and medium classes 20 kVA95 Breakpoint between large and medium classes 69 kVA96
kVA based breakpoints

REPORT AM1: EXPENDITURE FORECASTS AND RECONCILIATION
ref Electricity Distribution Business:
5 For Year Ended 20086 A) Five year forecasts of expenditure ($000)
7 From most recent Asset Management Plan
8
Actual for Current
Financial Year year 1 year 2 year 3 year 4 year 5
9 for year ended 2008 2009 2010 2011 2012 2013
10 Capital Expenditure: Customer Connection - from FS2
11 Capital Expenditure: System Growth - from FS2
12 Capital Expenditure: Reliability, Safety and Environment - from FS2
13 Capital Expenditure: Asset Replacement and Renewal 2,799 from FS2
14 Capital Expenditure: Asset Relocations - - from FS2
15 Subtotal - Capital Expenditure on asset management 2,799 - - - - -
16
17 Operational Expenditure: Routine and Preventative Maintenance - from FS1
18 Operational Expenditure: Refurbishment and Renewal Maintenance - from FS1
19 Operational Expenditure: Fault and Emergency Maintenance - from FS1
20 Subtotal - Operational Expenditure on asset management - - - - - -
21
22 Total direct expenditure on distribution network 2,799 - - - - -
23
24 Overhead to Underground Conversion Expenditure
26
27
28
30
B) Variance between Previous Forecast for the Current Financial Year, and Actual Expenditure
32
Actual for Current
Financial Year
Previous forecast for
Current Financial
Year % Variance
33 (a) (b) (a)/(b)-1
34 Capital Expenditure: Customer Connection - Not defined from row 10
35 Capital Expenditure: System Growth - Not defined from row 11
36 Capital Expenditure: Asset Replacement and Renewal - Not defined from row 12
Capital Expenditure: Reliability, Safety and Environment 2,799 Not defined from row 13
38 Capital Expenditure: Asset Relocations - Not defined from row 14
39 Subtotal - Capital Expenditure on asset management 2,799 - Not defined
40
41 Operational Expenditure: Routine and Preventative Maintenance - Not defined from row 17
42 Operational Expenditure: Refurbishment and Renewal Maintenance - Not defined from row 18
43 Operational Expenditure: Fault and Emergency Maintenance - Not defined from row 19
44 Subtotal - Operational Expenditure on asset management - - Not defined
45
46 Total direct expenditure on distribution network 2,799 - Not defined
47
48
49 Explanation of variances
50 Distribution Business must provide a brief explanation for any line item variance of more than 10%51
52 Explanatory notes (can be provided in a separate note if necessary):53
54
55
56
57
58
59
60
61
62
63
Horizon Energy
Forecast Years
The Electricity Distribution Business is to provide the amount of Overhead to Underground Conversion Expenditure included in each of the above Expenditure Categories (explanatory notes can be provided in a separate note if necessary).
The above tables do not contain any figures relating to "Actual for Current Financial Year" for operational expenditure as Horizon Energy has taken the exemption available for report FS1 line 42 which is the basis for the values in this report. The total operational expenditure for the 2008 year per FS1 is $6,459,000.
There is an error in the lookup on line 37 above in that it looks to the wrong criteria in line 13.

HORIZON ENERGY DISTRIBUTION LIMITED
NOTES TO THE FINANCIAL STATEMENTS
FOR THE YEAR ENDED 31 MARCH 2008
RELATED PARTY TRANSACTIONS
The following transactions were carried out with related parties:
a) Transactions between the Parent and Horizon Energy Investments LimitedHorizon Energy Distribution Limited "Line Business" consists of line activities conducted in Horizon Energy Distribution Limited and its 100% owned subsidiary Horizon Energy Investments Limited. Horizon Energy Distribution Limited "other Business"consists of other or non-line activities conducted in Horizon Energy Distribution Limited and its 100% owned subsidiary Horizon Energy Investments Limited.
All related party transactions between Horizon Energy Distribution Limited Line Business and Horizon Energy Investments LimitedLine Business have been eliminated in the preparation of the financial statements.
The following services are purchased by the Parent on an arms length basis at commercial terms and conditionsthat are available to third parties. Each contract is negotiated on a cost-plus basis.
2008$000
Horizon Energy Investments Limited
Construction of
- Transformers 3
- Zone Substations 4
- Distribution & LV Lines 119
- Switchgear 4
- Distribution & LV Cables 57
- Other System Fixed Assets 15
- Line Maintenance Projects 615817
There were no amounts owing as at balance date.
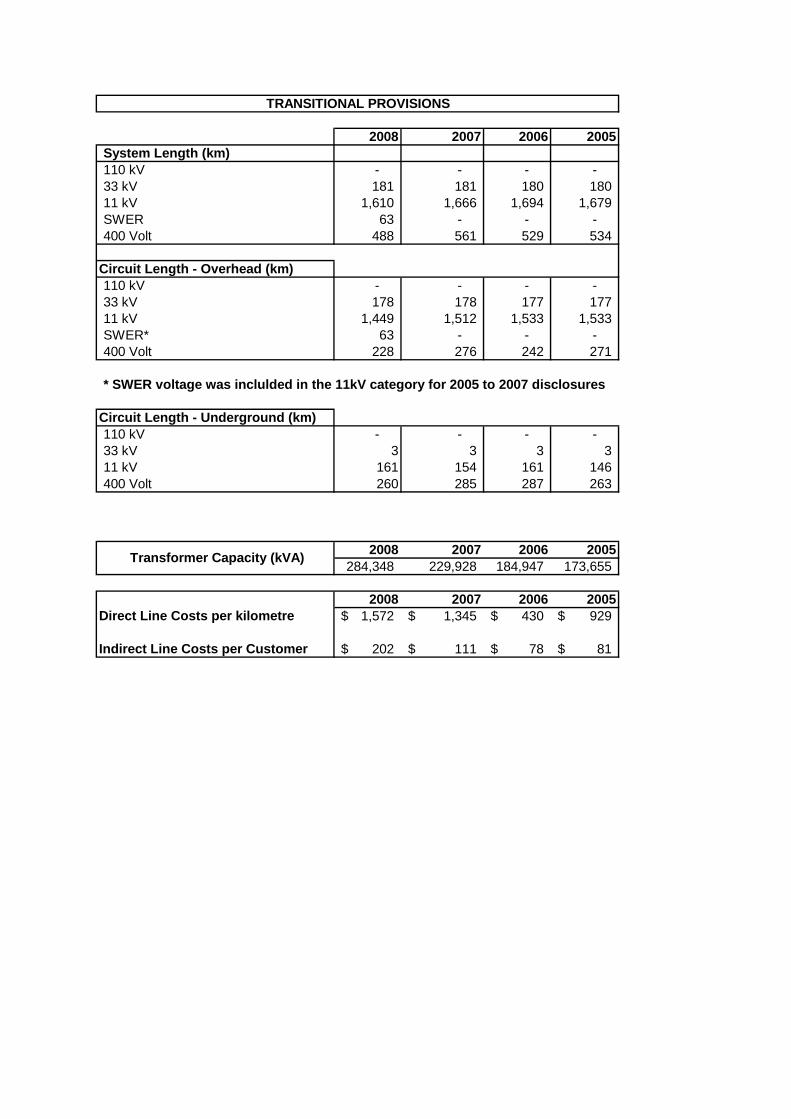
2008 2007 2006 2005System Length (km)110 kV - - - - 33 kV 181 181 180 180 11 kV 1,610 1,666 1,694 1,679 SWER 63 - - - 400 Volt 488 561 529 534
Circuit Length - Overhead (km)110 kV - - - - 33 kV 178 178 177 177 11 kV 1,449 1,512 1,533 1,533 SWER* 63 - - - 400 Volt 228 276 242 271
* SWER voltage was inclulded in the 11kV category for 2005 to 2007 disclosures
Circuit Length - Underground (km)110 kV - - - - 33 kV 3 3 3 3 11 kV 161 154 161 146 400 Volt 260 285 287 263
2008 2007 2006 2005284,348 229,928 184,947 173,655
2008 2007 2006 2005Direct Line Costs per kilometre 1,572$ 1,345$ 430$ 929$
Indirect Line Costs per Customer 202$ 111$ 78$ 81$
Transformer Capacity (kVA)
TRANSITIONAL PROVISIONS

CERTIFICATE FOR DISCLOSED INFORMATIONPursuant to Requirements 11(1)
We, ROBERT TAIT and JOHN McDONALD, directors of HORIZON ENERGYDISTRIBUTION LIMITED certify that, having made all reasonable enquiry, to the best of ourknowledge, the following attached audited information of HORIZON ENERGYDISTRIBUTION LIMITED prepared for the purposes of requirements 3, 4, 6 and 7(5) of theCommerce Commission's Electricity Distribution (Information Disclosure) Requirements2008 complies with those requirements:
¡it,,'.
... ~.~......................
Date:
ROBERT T AIT
(i)
(ii)
Report FS1" Regulatory Profit Report;
Report FS2: Regulatory Asset and Financing Report;
Report FS3: Regulatory Tax Allowances Report;(iii)
(iv)
(v)
Report AV1. Annual Regulatory Valuation Roll-Forward Report;
Report AV2: Valuation Disclosure by Asset Class (for System Fixed Assets);
(vi) Report A V3: System Fixed Assets Replacement Cost Roll-Forward Report;
(vii) Report AV4: Merger or Acquisition Regulatory Asset Base Disclosure;
(viii) Report MP1: Network Information Report;
(ix)
(x)
Report MP2: Performance Measures Report;
Report MP3: Price and Quality Report; and
(xi) Report AM1. Expenditure Forecasts and Reconcilation.
2DR day of 2009
ro0l


![FS2-2 썎 V [ ݊ [ h])](https://static.fdocuments.us/doc/165x107/61900dd5f1cf294ceb1e809a/fs2-2-v-h.jpg)