
Heavy-Duty Truck and Bus Natural Gas Vehicle Technology...
65
Heavy-Duty Truck and Bus Natural Gas Vehicle Technology Roadmap FINAL VERSION – June 2014
Transcript of Heavy-Duty Truck and Bus Natural Gas Vehicle Technology...

Heavy-Duty Truck and Bus Natural Gas Vehicle Technology Roadmap
FINAL VERSION – June 2014
rrodrigu
New Stamp

Contents • Background
– Key Findings – Key Recommendations – Purpose – Market Forecast – Drivers of Change
• Pathways
– Natural Gas Engine Technology – Fuels, Storage & Infrastructure – Policy – Range Extended Electric Vehicles and Hybrid Vehicles – Pathways by Vehicle Application
• Appendix
– Detailed engine/driveline technology descriptions and an assessment of their potential emissions & CO2 improvements
– Analysis of future paybacks for range extended electric drayage trucks
FINAL VERSION June 2014

Key Findings • Market for heavy-duty natural gas trucks in So Cal Gas
territory expected to grow 5X by 2020 and 15X by 2030, reaching 115,000 trucks by 2030 – recent release of 11.9L NG engine is a key enabler
• Regional/local delivery and line haul are forecasted to be the key growth markets
• Natural gas will have a majority market share in transit and refuse applications
• New federal fuel economy and greenhouse gas regulations for trucks will be enacted for 2019 and beyond that will drive technology development of advanced drivetrains – positive impact for NG
Key
Fin
ding
s K
ey
Rec
omm
enda
tions
Pu
rpos
e M
arke
t Fo
reca
st
Dri
vers
of C
hang
e
FINAL VERSION June 2014

Key Recommendations - Technology • Work with MTA and others to become early adopter of low-NOx NG
engines to secure early beachhead market for low NOx engine makers (see Engines section)
• Deploy 65-100 new stations strategically in service area to support long-haul markets – enables greater use of CNG in this application (see Infrastructure section)
• Demonstrate and validate the performance of “NG in a box” modular stations to allow greater usage of localized natural gas for LNG & CNG (see infrastructure section)
• Help to secure best possible outcome for NG range extenders in drayage applications to meet needs of Zero Emissions Corridor and Zones to be implemented around 2020 (I-710 and POLB/POLA) (see Port Drayage section)
• Participate in CEC M-HD demo activity as it relates to NG range extenders demonstrations
• Work with CEC-PIER to determine funding interest • Build partnerships and encourage development of NG-turbine range
extender electrified drivelines to provide NG option for California Zero Emission Bus regulations (see Transit section)
Key
Fin
ding
s K
ey
Rec
omm
enda
tions
Pu
rpos
e M
arke
t Fo
reca
st
Dri
vers
of C
hang
e
FINAL VERSION June 2014

Key Recommendations - Policy
• Support use of CA cap-and-trade funds for vehicle purchases & infrastructure development (see Policy section)
• Work to encourage CEC to make NG truck incentives more transparent by adopting HVIP-like voucher structure (see Policy section)
• Weigh in with NHTSA/EPA on Phase 2 fuel economy standards to insure fair recognition of natural gas (see Engines section)
• Track and weigh in on state & federal LCFS/RIN (RFS renewable identification number) proceedings (see Fuels section)
Key
Fin
ding
s K
ey
Rec
omm
enda
tions
Pu
rpos
e M
arke
t Fo
reca
st
Dri
vers
of C
hang
e
FINAL VERSION June 2014

Roadmap Purpose • Goal: To Develop a Natural Gas Vehicle Technology Roadmap
Commercialization Class 7/8 Heavy Duty Vehicles in the SoCalGas territory – The significant price advantage and abundant supplies of natural gas reinforce the notion
that it will remain and grow as a major part of the clean transportation portfolio for at least the next fifteen to twenty-five years.
– NG a Significant Enabler for California and the SoCalGas region to enable a reduction in the use of petroleum as well as reduce criteria emissions in heavy duty vehicles
• The CalHEAT’s “Market Transformation Roadmap for M-HD Trucks” addressed NG as a key component and Enabler in its goal to developed a pathway for the state to reduce petroleum use, reduce GHG as well as NOx emissions/Near Zero Technology
• Roadmap Approach – Develop a series of stepping stones towards commercial product offerings in the year
2023 for regions serviced by the Southern California Gas Company. – Provide SoCalGas and NG Industry with pathways for investment and adoptions to
further support the successful deployment of NG technologies • Engine • Drive Train • NG and Other NG Derived Fuels • Infrastructure • NG Storage
Key
Fin
ding
s K
ey
Rec
omm
enda
tions
Pu
rpos
e M
arke
t Fo
reca
st
Dri
vers
of C
hang
e
FINAL VERSION June 2014

Baseline Inventory of Natural Gas Trucks and Buses In SoCalGas Territory
Citation: CalHEAT
Refuse Transit Buses Drayage Regional Beverage Delivery Line-Haul Grand Totals
LNG 1,070 333 900 100 245 2,648
CNG 816 4,066 5 - - 4,887
Subtotals 1,886 4,399 905 100 245 7,535
Truck / Bus Life 12 years 12 years 10 years 12 years 5 years -
Addressable Market 6,732 6,396 13,080 51,392 112,501 190,101
NG Market Share 28.8% 68.8% 6.9% 0.2% 0.2% 4.0%
1,886
4,399
905
100 245
Refuse
Transit Buses
Drayage
Regional / Beverage / Delivery
Line Haul
Note: market forecast figures are currently undergoing final revisions in conjunction with ENVIRON
Key
Fin
ding
s K
ey
Rec
omm
enda
tions
Pu
rpos
e M
arke
t Fo
reca
st
Dri
vers
of C
hang
e
FINAL VERSION June 2014

CNG v. LNG Based on 2013 NG Vehicle Population
Estimate
65% CNG 35% LNG
NG Trucks Compared to 2013
Addressable Market 4% NG
96% Conventional
Citation: CalHEAT
0
1,000
2,000
3,000
4,000
5,000
6,000
7,000
8,000
Refuse TransitBuses
Drayage RegionalBeverageDelivery
Line Haul GrandTotals
CNG
LNG
0
50,000
100,000
150,000
200,000
250,000
Refuse TransitBuses
Drayage RegionalBeverageDelivery
Line Haul GrandTotals
Addressable Mkt
NG Trucks/Bus Totals
Baseline Inventory of Natural Gas Trucks and Buses In SoCalGas Territory (Continued) K
ey F
indi
ngs
Key
R
ecom
men
datio
ns
Purp
ose
Mar
ket
Fore
cast
D
rive
rs o
f Cha
nge
FINAL VERSION June 2014

CY 2013 CY 2020 CY2023 CY2030 Refuse 1886 4594 4704 6411 Transit 4399 4620 4760 5050
Drayage Trucks POLB / POLA 905 1075 3525 4077 Regional / Beverage / Delivery 100 3265 6087 15518
Line Haul 245 14313 19133 41798 Total NG 7535 27868 38210 72853
Potential Market Growth Scenario Using ACT and CalHEAT Inventory
Market Share Scenarios CY2013 CY2020 CY2023 CY2030 Refuse 28.0% 55.5% 53.2% 62.4% Transit 68.8% 68.8% 68.8% 68.8%
Drayage POLA / POLB 6.9% 6.9% 21.5% 22.1% Regional / Beverage / Delivery 0.2% 5.5% 10.5% 24.5%
Line Haul 0.2% 8.7% 11.1% 21.3% Total 4.0% 10.9% 14.5% 24.6%
NG as a Percentage of the Total or Addressable market Citations: CalHEAT and ACT Note: market forecast figures are currently undergoing final revisions in conjunction with other parties
Key
Fin
ding
s K
ey
Rec
omm
enda
tions
Pu
rpos
e M
arke
t Fo
reca
st
Dri
vers
of C
hang
e
FINAL VERSION June 2014

Drivers of Change
The following section addresses the three primary drivers of change from now through 2023 These are: • Continuation of low natural gas prices • Increasing regulatory pressure on lowering NOx
Emissions • Increasing regulatory pressure on greenhouse
gases and truck efficiency
Key
Fin
ding
s K
ey
Rec
omm
enda
tions
Pu
rpos
e M
arke
t Fo
reca
st
Dri
vers
of C
hang
e
FINAL VERSION June 2014

Natural Gas Compelling Long Term Fuel For Vehicles
• New fracturing technology allows economical access to natural gas
• Current and future production projected to outstrip demand
• US has some of the largest NG reserves in the world
• Frost and Sullivan and ACT projecting significant adoption in the heavy duty vehicle market
• Fleets seek price certainty & stability
Key
Fin
ding
s K
ey
Rec
omm
enda
tions
Pu
rpos
e M
arke
t Fo
reca
st
Dri
vers
of C
hang
e
Source: E-Controls FINAL VERSION June 2014

Natural Gas Pump Price Low Price Volatility
A doubling of the price of natural gas increases prices at the pump only $0.50
per GGE
Key
Fin
ding
s K
ey
Rec
omm
enda
tions
Pu
rpos
e M
arke
t Fo
reca
st
Dri
vers
of C
hang
e
Source: So Cal Gas Co. FINAL VERSION June 2014

Federal Ozone Regulations Requiring South Coast and Central Valley to Reduce
NOx Emissions • South Coast Air Basin must reduce Nitrogen Oxides
from 319 tons per day (t/d) to: – 115 t/d by 2023 - a 64% reduction – 80 t/d by 2033 - a 75% reduction
• San Joaquin Valley APCD must reduce Nitrogen Oxides from 257 t/d to: – 160 t/d by 2023 - a 38% reduction
• Heavy duty diesel trucks are the number one target for both regions
Key
Fin
ding
s K
ey
Rec
omm
enda
tions
Pu
rpos
e M
arke
t Fo
reca
st
Dri
vers
of C
hang
e
FINAL VERSION June 2014

by 2023
by 2032
0
50
100
150
200
250
300
350Commerical Harbor CraftService/CommercialResidential CombustionMedium-Duty TrucksLight-Duty TrucksLight-Duty CarsHeavy-Duty Gasoline TrucksManufacturing and IndustrialHeavy Duty BusesAircraftLocomotivesLarge StationaryOcean Going VesselsOff-Road EquipmentHeavy-Duty Diesel Trucks
Nitrogen Oxides Emissions in
2023*
*Based on the SCAQMD 2012 AQMP Top 15 = 298 out of 319 tons/day NOx
Additional Needed Emission Reductions
tons per day
South Coast Carrying capacity for 80 ppb ozone standard
= 115 t/d NOx
South Coast Carrying capacity For 75 ppb ozone standard
≈ 80 t/d NOx
Major NOx Emission Sources in South Coast Air Basin K
ey F
indi
ngs
Key
R
ecom
men
datio
ns
Purp
ose
Mar
ket
Fore
cast
D
rive
rs o
f Cha
nge
Source: So Cal Gas Co.

Major NOx Emission Sources in San Joaquin Valley
0
50
100
150
200
250
300Service And CommercialAircraftMedium Duty TrucksFood And Agricultural ProcessingRecreational BoatsManaged Burning And DisposalCogenerationFood And AgricultureOil And Gas ProductionGlass And Related ProductsFarm EquipmentOff-Road EquipmentTrainsManufacturing And IndustrialHeavy Duty Diesel Trucks
*Based on the SJVAPCD 2007 AQMP and ARB on-road and off-road emissions models Top 15 = 226 out of 257 tons/day NOx
tons per day
Nitrogen Oxides Emissions in
2023*
Additional Needed Emission Reductions
SJV Carrying capacity for 80 ppb ozone standard
= 160 t/d NOx
by 2023
Key
Fin
ding
s K
ey
Rec
omm
enda
tions
Pu
rpos
e M
arke
t Fo
reca
st
Dri
vers
of C
hang
e
Source: So Cal Gas Co. FINAL VERSION June 2014

0
10
20
30
40
50
60
Hea
vy-D
uty
Die
sel T
ruck
s
Off-
Roa
dE
quip
men
t
Oce
an G
oing
Ves
sels
RE
CLA
IM (l
arge
stat
iona
ry)
Loco
mot
ives
Airc
raft
Hea
vy-D
uty
Bus
es
Man
ufac
turin
gan
d In
dust
rial
Hea
vy-D
uty
Gas
olin
e Tr
ucks
Ligh
t-Dut
y C
ars
Ligh
t-Dut
y Tr
ucks
Med
ium
-Dut
yTr
ucks
Res
iden
tial
Com
bust
ion
Ser
vice
/Com
mer
cial
Com
mer
ical
Har
bor C
raft
SCAQ
MD
Su
mm
er N
Ox
(tons
/day
)
Low Potential
Some Potential
High Potential
Top 15 NOx Source Categories (SCAQMD and SJVAPCD) Targets for Emissions Reductions
0
10
20
30
40
50
Hea
vy D
uty
Die
sel T
ruck
s
Man
ufac
turin
gA
nd In
dust
rial
Trai
ns
Off-
Roa
dE
quip
men
t
Farm
Equ
ipm
ent
Gla
ss A
ndR
elat
edP
rodu
cts
Oil
And
Gas
Pro
duct
ion
(Com
bust
ion)
Food
And
Agr
icul
ture
Cog
ener
atio
n
Man
aged
Bur
ning
And
Dis
posa
l
Rec
reat
iona
lB
oats
Food
And
Agr
icul
tura
lP
roce
ssin
g
Med
ium
Dut
yTr
ucks
Airc
raft
Ser
vice
And
Com
mer
cial
SJVA
PCD
Su
mm
er N
Ox
(ton/
day)
Notes: 1. Heavy-Duty Trucks include Light-Heavy Duty, Medium-Heavy Duty, Heavy-Heavy Duty Trucks 2. Emissions for on-road mobile sources are based on EMFAC2011 output for San Joaquin Valley Air Basin 3. Emissions for off-road equipment are based on 2011 CARB inventory models 4. Emissions for stationary sources, area sources, and other off-road mobile sources are based on CARB Staff Report, Analysis of the 2007 8-hour Ozone SIP
(298 tons/day out of total 319 tons/day)
(226 tons/day out of total 257 tons/day)
Key
Fin
ding
s K
ey
Rec
omm
enda
tions
Pu
rpos
e M
arke
t Fo
reca
st
Dri
vers
of C
hang
e
Source: So Cal Gas Co. FINAL VERSION June 2014

Carbon Dioxide as a Major Contributor to Greenhouse Gases will be Driven Significantly
Downward
• California’s AB 32 and Executive Orders #B-016-2012 & S-03-2005 require a 20% reduction in greenhouse gases (GHG) by 2020 and 80% by 2050 in order to reach levels that are 80% lower than 1990 – this is not mandated yet
• EPA/NHTSA CAFÉ Regulations for Trucks Require C02 Reductions through Fuel Economy Regulations – Phase 1 10-23% reduction required model year 2014-2018 – Phase 2 Under development and to be announced by 2015
expected to requires more aggressive fuel economy
Key
Fin
ding
s K
ey
Rec
omm
enda
tions
Pu
rpos
e M
arke
t Fo
reca
st
Dri
vers
of C
hang
e
FINAL VERSION June 2014

CalHEAT Pathways for CO2 Reductions
• CalHEAT research has determined a pathway for meeting a 70% reduction within the medium- and heavy-duty inventory of trucks in California – Class 8 over-the-road and regional tractors represent 56%
of the CO2 in the truck inventory – NG trucks will have to become significantly more efficient
• Up to 65 % by 2023 • Renewable fuels derived from natural gas are an equal contributor
in reducing C02
Key
Fin
ding
s K
ey
Rec
omm
enda
tions
Pu
rpos
e M
arke
t Fo
reca
st
Dri
vers
of C
hang
e
FINAL VERSION June 2014

AB 32 Driving Change
Note: the 2050 GHG target is still an Executive Order and is not yet law
Key
Fin
ding
s K
ey
Rec
omm
enda
tions
Pu
rpos
e M
arke
t Fo
reca
st
Dri
vers
of C
hang
e
Source: CALSTART FINAL VERSION June 2014

Broader Approach Needed to Reach State and Regional Targets K
ey F
indi
ngs
Key
R
ecom
men
datio
ns
Purp
ose
Mar
ket
Fore
cast
D
rive
rs o
f Cha
nge

CO2 Reduction from CalHEAT Roadmap K
ey F
indi
ngs
Key
R
ecom
men
datio
ns
Purp
ose
Mar
ket
Fore
cast
D
rive
rs o
f Cha
nge
Source: CalHEAT FINAL VERSION June 2014

NOx Reduction from CalHEAT Roadmap K
ey F
indi
ngs
Key
R
ecom
men
datio
ns
Purp
ose
Mar
ket
Fore
cast
D
rive
rs o
f Cha
nge
Source: CalHEAT FINAL VERSION June 2014
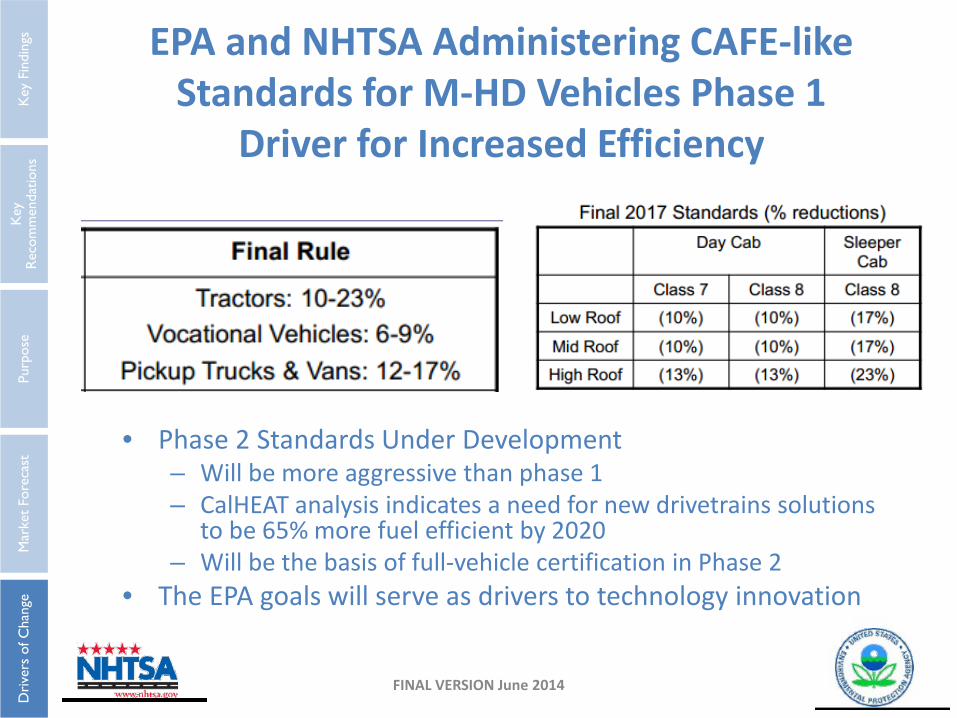
EPA and NHTSA Administering CAFE-like Standards for M-HD Vehicles Phase 1
Driver for Increased Efficiency
• Phase 2 Standards Under Development – Will be more aggressive than phase 1 – CalHEAT analysis indicates a need for new drivetrains solutions
to be 65% more fuel efficient by 2020 – Will be the basis of full-vehicle certification in Phase 2
• The EPA goals will serve as drivers to technology innovation
Key
Fin
ding
s K
ey
Rec
omm
enda
tions
Pu
rpos
e M
arke
t Fo
reca
st
Dri
vers
of C
hang
e
FINAL VERSION June 2014

Roadmap &
Technology Pathways
NG
Eng
ine
Tec
hnol
ogy
Ran
ge E
xten
ded
EV
& H
ybri
d V
ehic
les
Fuel
s, St
orag
e &
In
fras
truc
ture
Po
licy
Path
way
s by
Veh
icle
A
pplic
atio
n

Roadmap Pathways Overview NG Fuel Related Strategies for Criteria Emissions, Greenhouse Gas Reductions
and Fuel Efficiency
Natural Gas Engine Technology
Range Extended Electric Vehicles and Hybrid Vehicles
Policy and Other
Fuels, Storage & Infrastructure Primarily driven by brake thermal efficiency (BTE) improvements and catalyst improvements for emission reductions. Enhanced combustion strategies, transmissions, waste heat recovery, and new technologies based on DOE Supertruck experience will be integrated into future engines and drivelines. New and innovative engine types may emerge by 2023
Primarily driven by need for zero emissions in the Port regions and productivity improvements in the refuse market. Range extension strategies using new zero- and low-emission power plants will be developed and used to extend the range of an electric driveline. Full and mild hybrids will also be deployed.
Primarily driven by increasing availability of renewable fuels, lighter weight and less expensive storage systems and increased availability of public infrastructure
Driven by the Federal, state and local regulations discussed as drivers. There are major opportunities for development funding and buy down incentives within the state of California
NG
Eng
ine
Tec
hnol
ogy
Ran
ge E
xten
ded
EV
& H
ybri
d V
ehic
les
Fuel
s, St
orag
e &
In
fras
truc
ture
Po
licy
Path
way
s by
Veh
icle
A
pplic
atio
n
FINAL VERSION June 2014

Natural Gas Engine Trend Overview
• Stage 1/Current Status: Limited manufacturers & engine options but portfolio growing; mostly diesel variants; still some reliability, durability & power concerns
• Stage 2: More stakeholders & choices; purposeful designs for NG engines; improved ignition controls, thermal controls & air handling
• Stage 3: Continued emissions, performance & efficiency gains; increasing use of NG turbines
NG
Eng
ine
Tec
hnol
ogy
Ran
ge E
xten
ded
EV
& H
ybri
d V
ehic
les
Fuel
s, St
orag
e &
In
fras
truc
ture
Po
licy
Path
way
s by
Veh
icle
A
pplic
atio
n
FINAL VERSION June 2014

NG
Eng
ine
Tec
hnol
ogy
Ran
ge E
xten
ded
EV
& H
ybri
d V
ehic
les
Fuel
s, St
orag
e &
In
fras
truc
ture
Po
licy
Path
way
s by
Veh
icle
A
pplic
atio
n
Stage 1 Current Status ( Limited Engine Size Availability) • NOx Emissions slightly better that 2010 Standards • EPA/NHTSA Phase 1 Compliant for GHG • Engines Approaching 45% Brake Thermal Efficiency • Expensive technologies replaced by engines that provide 1-3 year
payback for 100,000 miles use • Use primarily diesel engine blocks ISL-G 8.9L (CWI) • Stoichiometric spark-ignited with 3-way catalyst • Workhorse for refuse & transit and emerging drayage & regional
delivery markets • Payback: 1-3 years – little cost difference vs. diesel for engine
components – main costs are gas storage • No DPF and SCR needed • SCAQMD requires use for refuse & transit applications • Emissions level: 2013 • CAFÉ Ph.1 compliant
ISX-12G (CWI) (New offering) • 11.9L stoichiometric spark-ignited with 3-way catalyst – emerging
for refuse, drayage, regional delivery & OTR • Payback – 1.5 to 3 years • Emissions level: 2013 • No DPF and SCR needed • CAFÉ Ph.1 compliant
HD15 (Westport) (discontinued production end of 2013 but still in use) • 15L high-pressure direct injection compression ignition with diesel
pilot – limited currently to OTR market • Payback 4 years • Requires diesel pilot + aftertreatment (SCR) • Emissions level: 2010 • CAFÉ Ph.1 compliant • Production phasing out - ends early 2014 • Best match for LNG applications Doosan 8.9L • Lean burn SI engine – currently used in some transit applications • Developing 11.9L version
Stage 2 (Increased engine offerings including purposefully designed NG engine blocks) • 75% less NOx vs. 2010 Standards • NHTSA Ph 2 GHG targets for CO2 (10%
improvement?) • Engine brake thermal efficiency approaching
48% through implementation of new Supertruck technologies
ISL 8.9L and ISX 12G • Similar architecture to current but with
advanced catalysts & combustion properties – 75% lower NOx than 2010 standards
Volvo 13L HPDI • Emissions level: 2013 • Efficiency: same as diesel • CAFÉ Ph.1 compliant • Payback – 2-3 yrs?
Cummins 15L SI (2016) – in development now • Improved performance, reliability & fuel
economy • Purposeful block
Volvo DME – NG-derived fuel • Requires minor modifications to D13 engine • 0 PM – no DPF required • 95% lower CO2 emissions than diesel when
DME is derived from biosources • Lower pressure than NG, infrastructure
similar to propane • Performance similar to diesel Quantum/Ricardo/PSI PIER engine – class 3-7, 8.8L base engine - 20% fuel economy gain, 16% power density gain (proposed but not certain) Westport HDPI 2.0 (replaces HD15) • Range of sizes up to locomotives • Optimized combustion • Redesigned electric controls
Stage 3 (Continued Emission , GHG and break thermal efficiency gains) • 90% less NOx vs 2010 standards • Engines starting to exceed 50%
brake thermal efficiencies • GHG Reductions (increasing
reductions approx. additional 10% vs. stage 2)
GHG/fuel efficiency gains (hybrids, range extenders, more electrification) Compression ignition (not HPDI) Methane catalysts, especially for HPDI configurations CWI ISL-G 8.9L - .02g • Better controls & catalysts
Cummins 15L S.I. (near-zero) - Purposeful design - Better ignition controls, fuel
injection, thermal management & air handling, waste heat recovery
- Commercialization will be dependent on adoption of optional NOx standards
Innovative Engine Solutions Camless engines: • Commercial production • Using NG to obtain decreased NOx
(0.02 g/bhp-h) Opposed Piston and free-piston engines: • Demonstrations including 21%
improved fuel efficiency HCCI: • Demonstrations ICRC (Brayton) – traction engine not range-extender
Natural Gas Engine Technology
TECHNOLOGY
2013 2018 2023 FINAL VERSION June 2014

Recommendations for Engines • Continue participation and tracking of low-NOx
engine development programs by SCAQMD and others
• Work to secure incentives for low-NOx deployments through CEC & air districts
• Investigate and encourage the use of NG in new engine development activities such as the Achates opposed piston engines
• Weigh in with NHTSA/EPA on Phase 2 CAFE standards to insure fair recognition of natural gas
• Consider developing & demonstrating low-NOx DME engines for regional class 8 applications
NG
Eng
ine
Tec
hnol
ogy
Ran
ge E
xten
ded
EV
& H
ybri
d V
ehic
les
Fuel
s, St
orag
e &
In
fras
truc
ture
Po
licy
Path
way
s by
Veh
icle
A
pplic
atio
n
FINAL VERSION June 2014

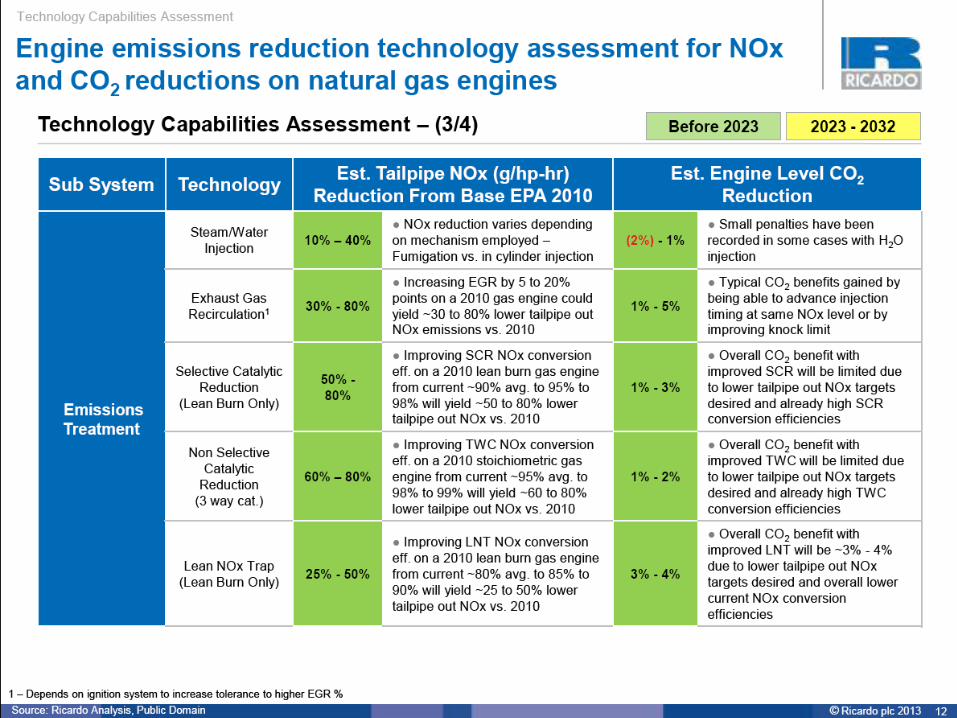
Engine and Vehicle Technology Capabilities Assessment
• The following chart summarizes select system benefits for emissions & CO2 reductions over the periods to 2023 & 2023+
• See detailed appendix for technology descriptions and associated benefits of the following components/systems – Air system - Ignition system – Combustion - Design – Fuel system - Friction & parasitic – Waste heat recovery - Vehicle system – Emissions treatment - Powertrain
NG
Eng
ine
Tec
hnol
ogy
Ran
ge E
xten
ded
EV
& H
ybri
d V
ehic
les
Fuel
s, St
orag
e &
In
fras
truc
ture
Po
licy
Path
way
s by
Veh
icle
A
pplic
atio
n
FINAL VERSION June 2014

See appendix for technology descriptions
Select NG Engine and Vehicle Technology Advancement Potentials for Lower NOx & CO2 Emissions
NG
Eng
ine
Tec
hnol
ogy
Ran
ge E
xten
ded
EV
& H
ybri
d V
ehic
les
Fuel
s, St
orag
e &
In
fras
truc
ture
Po
licy
Path
way
s by
Veh
icle
A
pplic
atio
n
FINAL VERSION June 2014

Fuels Trend Overview • Stage 1/Current status: Stable supply of pipeline gas
used for CNG & LNG; shale gas & fracking should insure consistent supplies; cost is 50-60% less than diesel; forecasts are for costs to remain low through continued abundant supplies
• Stage 2: More renewable content to lower GHG impact; full implementation of RIN (RFS renewable identification number) & LCFS schemes will affect renewables; increased H2 use including blends & possibly pipeline injection; DME may play significant role; EPA brings certainty to system-wide methane leakage allowances
NG
Eng
ine
Tec
hnol
ogy
Ran
ge E
xten
ded
EV
& H
ybri
d V
ehic
les
Fuel
s, St
orag
e &
In
fras
truc
ture
Po
licy
Path
way
s by
Veh
icle
A
pplic
atio
n
FINAL VERSION June 2014

NG
Eng
ine
Tec
hnol
ogy
Ran
ge E
xten
ded
EV
& H
ybri
d V
ehic
les
Fuel
s, St
orag
e &
In
fras
truc
ture
Po
licy
Path
way
s by
Veh
icle
A
pplic
atio
n
Stage 1 - Current Status • Minimal renewable NG use and availability • Initial RNG use in California currently through Clean
Energy’s ReDeem • Pipeline NG – compressed and dispensed as CNG • Liquefied NG – liquefied at remote site, trucked to
dispensing location – limited “shelf” life due to boil-off, operational issues (safety equipment required)
• CNG from pipeline NG 33% less carbon content than diesel
LNG 17-28% less carbon than diesel
• Hydrogen – 33% renewable requirement for transportation uses
• 5% reduction of GHG for CNG
• Focus on WTW methane leakage – EDF study recommends 2.5% systemwide cap
Stage 2 – Goal is maximizing renewable content (GHG) • RNG – greater production, increased pipeline injection –
will the credits be actual or paper? –Utility acceptance of RNG injection?
• More RNG produced in-state from landfills & dairies (see policy section)
• RIN+LCFS credits for RNG – currently $0.28/gallon California LCFS + $0.75/gallon Federal RIN – who will get them remains unclear (ReDEEM pump price = regular CNG price – will that continue?)
• RNG – carbon intensity values 86-89% less than diesel –Will there be a new CO2 metric for pipeline gas?
• Renewable H2 pipeline injection? - what will be the limit – 5%, 10%?
• Bio-DME • Methanation of H2 Overall Trends: • Consistent NG supplies and low costs • Supply security - Growing NG supply through shale
discoveries/hydraulic fracturing – how will fracking and systemwide leakage issues affect future supplies & prices? Will there be penalties for released methane?
• Consistent gas quality standards (MN-88+?) • DME (low comparative energy content, high cost,
lubricity issues w/ injectors) -2015 • Renewable H2 – 30% of H2 in transport must be
renewable
FUELS
2013 2018
Fuels
2023 FINAL VERSION June 2014

Recommendations for Fuels
• Track and weigh in on CPUC proceedings re: pipeline injection of RNG
• Track and weigh in on federal & state LCFS/RIN proceedings
• Collaborate with and invest in potential RNG producers to increase future supplies with support of PIER and AB 118 funds
NG
Eng
ine
Tec
hnol
ogy
Ran
ge E
xten
ded
EV
& H
ybri
d V
ehic
les
Fuel
s, St
orag
e &
In
fras
truc
ture
Po
licy
Path
way
s by
Veh
icle
A
pplic
atio
n
FINAL VERSION June 2014

Onboard Gas Storage Trend Overview
• Stage 1/Current status: New placement configurations allowing greater onboard storage capacity of CNG; long-haul tractors can now carry up to 140 DGE; LNG is still preferable for long-haul limited only by operational issues & infrastructure
• Stage 2: Reduced weight penalties through lighter tanks & support materials; lower storage pressures through use of gas adsorption or pellets; also potentially higher storage pressures
NG
Eng
ine
Tec
hnol
ogy
Ran
ge E
xten
ded
EV
& H
ybri
d V
ehic
les
Fuel
s, St
orag
e &
In
fras
truc
ture
Po
licy
Path
way
s by
Veh
icle
A
pplic
atio
n
FINAL VERSION June 2014

NG
Eng
ine
Tec
hnol
ogy
Ran
ge E
xten
ded
EV
& H
ybri
d V
ehic
les
Fuel
s, St
orag
e &
In
fras
truc
ture
Po
licy
Path
way
s by
Veh
icle
A
pplic
atio
n
STORAGE
Gas Storage
Stage 1 - Current Status and Near-Term Trends – Premium remains for NG vs. diesel storage CNG • Framerail mounted (capacity up to 100 DGE/vehicle – 47
DGE/tank) • Horizontally mounted behind cab (capacity up to 140
DGE/vehicle) • Cost is ~ $300/DGE • Weight – 10-20 lbs/DGE net • Materials – carbon fiber >> aluminum • Volume – increasing diameter for greater capacity • Weight - ~200 lb. weight penalty vs. diesel • CNG tanks 5:1 size for same range as diesel; LNG 2.3:1 LNG • Cryogenic ($300/DGE) • Weight – 5 lbs/DGE net increase • Capacities (up to 150 DGE/vehicle) • LNG storage costs higher than CNG
Stage 2 - Lower Cost, Greater Capacity, Lower weight , better materials • Lower cost storage – closer to $100/DGE • Lighter-weight materials • Optimized designs • More research into lower-pressure storage - Pellets
adsorption (BASF) • Low-pressure storage – less than 1,000 psi (probably
2023+) • High-pressure storage (6,000 to 10,000 psi) • 90” long to 120” long tanks for CNG • Better chassis design to incorporate more tanks • Gas adsorption • Conformable tanks • Incorporating tanks into chassis (2023+) • Bladders for CNG • Phase-change materials to offset fill losses • Smaller tanks and less capacity needed in connection
with range extenders
2013 2018 2023 FINAL VERSION June 2014

Recommendations for Gas Storage
• Contribute to development of standards for gas storage support materials
• Contribute to industry efforts to develop innovative storage tanks that are integrated into the rails or chassis
• Support demonstrations of new low-pressure and conformable storage technologies
NG
Eng
ine
Tec
hnol
ogy
Ran
ge E
xten
ded
EV
& H
ybri
d V
ehic
les
Fuel
s, St
orag
e &
In
fras
truc
ture
Po
licy
Path
way
s by
Veh
icle
A
pplic
atio
n
FINAL VERSION June 2014

Infrastructure Trend Overview
• Stage 1/Current status: Growing state & nationwide network of public access stations
• Stage 2: More standardized station designs; increased dispensing efficiencies; better controls, including for time-fill; more opportunities for “NG in a box” solutions with smaller footprint, lower cost
NG
Eng
ine
Tec
hnol
ogy
Ran
ge E
xten
ded
EV
& H
ybri
d V
ehic
les
Fuel
s, St
orag
e &
In
fras
truc
ture
Po
licy
Path
way
s by
Veh
icle
A
pplic
atio
n
FINAL VERSION June 2014

NG
Eng
ine
Tec
hnol
ogy
Ran
ge E
xten
ded
EV
& H
ybri
d V
ehic
les
Fuel
s, St
orag
e &
In
fras
truc
ture
Po
licy
Path
way
s by
Veh
icle
A
pplic
atio
n
TECHNOLOGY
Infrastructure
Stage 1 - Current Status ~130 public stations in California CNG - uses solely pipeline gas • Station Costs - $500K to $2.5M • Dispensing Capacity - up to 20 DGE/minute • Siting - Private Fleet or Public Corridors • Fast fill for transit, drayage, delivery & long-haul • Slow fill – ideal application is refuse & school buses LNG - Some local and mostly non-local pipeline gas used for liquefaction • Stations Costs - $2-$4M+ • On-site Storage Capacity – up to 18K gallons storage • Siting- Primarily public/corridors, proximity to liquefaction plants
(250 mi. radius) • Transportation - Cost of transporting LNG to stations by truck • Limitations – shelf-life ~7 days due to boil-off • Operational issues – safety equipment required L/CNG – vaporize & compress LNG – dispense as CNG Compact skid-mounted fueling stations (CNG in a box) – GE/Galileo Public access vs. Fleet / cardlock access DME – lower pressures, infrastructure similar to LPG and inexpensive as compared to CNG/LNG H2 – limited availability & high cost
Stage 2 – More station availability (250+ public stations in California), lower costs, better controls • Quicker dispensing for high-volume applications such
as transit • Increased capacity & compression efficiency at
stations • More efficient dispensers • Better balance between faster dispensing & more
storage • Standardized and Modular designs • Better controls for time-fill to take advantage of TOU
rates • Small-scale liquefaction
• 5000 public access stations needed nationwide to get
to 25% market penetration • Highway network of LNG stations needed to sustain
OTR market, even within Calif. • Lower cost, modular L/CNG stations • Lower cost time-fill
• More “NG in a box” capabilities for CNG & LNG –
lower cost, greater use of local pipeline NG for liquefaction onsite
2013 2018 2023 FINAL VERSION June 2014

Recommendations for Infrastructure
• Support use of CA cap-and-trade funds for infrastructure development
• Deploy 65-100 new stations strategically in service area to support long-haul markets – enables greater use of CNG in this application
• Support and invest in “CNG in a box” systems to enable mores stations with smaller footprints
• Support and invest in “LNG in a box” systems which would allow for the use of localized NG supplies
• Support industry efforts to increase standardized station designs and modularity
NG
Eng
ine
Tec
hnol
ogy
Ran
ge E
xten
ded
EV
& H
ybri
d V
ehic
les
Fuel
s, St
orag
e &
In
fras
truc
ture
Po
licy
Path
way
s by
Veh
icle
A
pplic
atio
n
FINAL VERSION June 2014

Electrification & Hybridization Trend Overview
• Stage 1/Current Status: Limited demos of fuel cell/range extenders for transit buses; some turbine demos; costs still high but decreasing; limited durability
• Stage 2: More fuel cell range extender deployments especially at ports & transit; greater use of NG-fueled turbines; battery-dominant fuel cells for transit; lower costs & higher durability
NG
Eng
ine
Tec
hnol
ogy
Ran
ge E
xten
ded
EV
& H
ybri
d V
ehic
les
Fuel
s, St
orag
e &
In
fras
truc
ture
Po
licy
Path
way
s by
Veh
icle
A
pplic
atio
n
FINAL VERSION June 2014

NG
Eng
ine
Tec
hnol
ogy
Ran
ge E
xten
ded
EV
& H
ybri
d V
ehic
les
Fuel
s, St
orag
e &
In
fras
truc
ture
Po
licy
Path
way
s by
Veh
icle
A
pplic
atio
n Range Extended Electrics using Alternative Power Plants
for Electrified Drivetrain Solutions
Stage 2: (Los Angeles area ports mainstreaming of zero emission miles capable drayage trucks and California zero emission transit bus regulation enforced) – commercial production Stage 2 builds off Stage 1... Technical characteristics may include: • Lower Costs • Improved range extenders where applicable • Cost effective electric accessories • Cost effective and larger motors Performance goals may include: • Greater than 50% petroleum reduction • Zero-emission driving variant available – more ZE miles Stage 2 economic goal: 5-8 year simple payback (with incentives for drayage & transit) POWERPLANTS Fuel cells: • Move to becoming more battery-dominant – sizes the same • Start deployment in trucks & buses (mostly range extenders) • Reliability – 30,000 hrs • Price reduced to $100/kW • Manufacturers: same as stage 1 Turbines • 30 kW, 65 kW • Purposely-designed automotive –quality turbines • Used in transit & drayage primarily range-extender • Early demos , uncertain as to final configuration – should meet drayage &
transit needs due to pending low-emission regulations – zero-emission miles possible
• Emissions 75% lower than 2010 cert level • ~30% efficiency • Payback: ~3 years • No after-treatment necessary • Manufacturers: Capstone, Metis Design, Ricardo, Hybine
DRIVELINES • Improved integration and HEV-plug-in optimization • Optimized and downsized engines • CA OBD compliant CWI ISB 6.7G - 2016 • Not applicable for conventional NG engine for HD but as a range extender
range extender for class 7&8
Stage 1: Current Status:(pre-commercial demonstrations ongoing) APPLICATIONS - Transit bus applications and drayage demonstrators of fuel cell and stationary designed turbines as generators for electric drivelines. Stage 1 technical characteristics may include: • Zero emissions (fuel cells) and near-zero emissions (turbines) • Used in series hybrid-electric configurations • Fuel cell hybrids can double fuel economy • NG storage becomes less of an issue in range-extenders due to lower fuel need PERFORMANCE GOALS: • 50% petroleum reduction • Expanded work site idle reduction • Noise reduction • Productivity gain from idle-free; allows expanded hours of operation POWERPLANTS Fuel cells • Derived from H2 (reformed from NG) – 30, 50, 90, 100, 150 kW systems • Manufacturers: Hydrogenics, Ballard, US Hybrid, Nuvera, • Cost approaching $300/kW now , reliability approaching 20,000 hours of operation • Cummins-Westport 6.7L NG engine as range extender Turbines • Large sizes now (350 kW now, moving toward 30 kW & 65 kW) • Off-the-shelf components for utility & stationary apps • Used in transit & drayage primarily range-extender • Early demos , uncertain as to final configuration – should meet drayage & transit
needs due to pending low-emission regulations – zero-emission miles possible • Emissions 75% lower than 2010 cert level • ~30% efficiency • Payback: ~3 years • No after-treatment necessary • Manufacturers: Capstone, Brayton
Conventional Engine Gen Sets US Hybrid/GTI CNG range extender – ISL-G + 100 kWh battery for 30 mile all-electric operation - demo underway DRIVELINES (PLUG-IN AND TRADITIONAL) • ZE driving capability demonstrated through plug-in configuration • Dual-mode and range-extenders in drayage as second applications
(supports pathway for ZE goods movement) • Limited export power • e accessories optimized and customized for this application
TECHNOLOGY
FINAL VERSION June 2014

Recommendations for Range-Extended Electrics using Alternative Power Plants
• Work with Capstone and other turbine manufacturers to foster transportation applications – Collect voice of customer data on more purposeful
NG designs for trucks and buses • Understand and investigate other opportunities for
NG power plants such as 6.7-liter engine and other turbine providers
• Participate in Advisory Committee with FTA/CALSTART’s H2 Infrastructure Station Publication to understand the best NG scenarios – an enabler for Port Drayage and Transit
NG
Eng
ine
Tec
hnol
ogy
Ran
ge E
xten
ded
EV
& H
ybri
d V
ehic
les
Fuel
s, St
orag
e &
In
fras
truc
ture
Po
licy
Path
way
s by
Veh
icle
A
pplic
atio
n
FINAL VERSION June 2014

Natural Gas Hybrids Trend Overview
• Stage 1/Current Status: Limited fleet trials with Autocar entering NG hydraulic-hybrid refuse truck market; development & prototyping spurred by interest and PIER funding of NG hybrid drivetrains for trucks; anticipated prototype NG-fueled topologies include hybrid-electric drivetrains for refuse, milder hybridization of transit buses
• Stage 2: Commercial offerings of hydraulic hybrid refuse trucks; mild hybridization using NG deployed in regional delivery and transit buses; prototyping and fleet trials of NG mild hybrid refuse trucks
NG
Eng
ine
Tec
hnol
ogy
Ran
ge E
xten
ded
EV
& H
ybri
d V
ehic
les
Fuel
s, St
orag
e &
In
fras
truc
ture
Po
licy
Path
way
s by
Veh
icle
A
pplic
atio
n
FINAL VERSION June 2014

NG
Eng
ine
Tec
hnol
ogy
Ran
ge E
xten
ded
EV
& H
ybri
d V
ehic
les
Fuel
s, St
orag
e &
In
fras
truc
ture
Po
licy
Path
way
s by
Veh
icle
A
pplic
atio
n Natural Gas Fuelled Hybrids (includes Hydraulic Hybrids)
Stage 1 – Current Status Limited fleet trials of NG-hydraulic hybrid refuse trucks Stage 1 performance goals may include: • 22-38% GHG-C02 reduction (and petroleum reduction)
Stage 1 Applications: New York Sanitation NG hybrid refuse truck demo Economic goals Technical characteristics __________________________ Natural Gas Hydraulic Hybrid Technology Stage 1 Parallel Limited Feet Trials (Autocar & Parker Hannifin) Hydraulic hybrid economic goals: • 5 year payback without incentives in refuse; Hydraulic hybrid performance goals may include: • 10-25% fuel economy improvement for parallel system; • 4-5X brake life • Increased productivity (e.g., stops per day in a refuse truck) Hydraulic hybrid technical capabilities may include: • Regenerative braking system only • Axial piston pump/motor with single speed gearbox (parallel) • Bladder accumulator (steel)
Stage 2 Stage 2 builds off Stage 1... More commercial offerings, full deployment of NG-hydraulic hybrid refuse trucks, potential for hybrid-electric refuse applications, mild-hybrid trucks in other applications Stage 2 performance goals may include: • NG hybrid 27-54% GHG-C02 reduction, 100% petroleum reduction) • Increased low-speed torque in hybrid system (beyond conventional
hybrid design) to compensate for lower torque NG engines Stage 2 economic goal: 3-5 year payback, accounting for non-fuel savings in these specific applications (fuel savings ROI alone may not get economic model to work); benefits include productivity gains (more stops per hour) and maintenance savings (significant brake job cost savings) Stage 2 technical characteristics may include: • NG hybrid refuse truck with right sized NG tanks and battery storage
or hydraulic storage • Mild hybrid & high electrification in bus or truck • Opportunities for down-sized engines ____________________________________________________________ Natural Gas Hydraulic Hybrid Technology Stage 2 Series, Enhanced Parallel and Dual Mode (Power Split) Stage 2 economic goals: • 3 year payback (mature) without incentives in refuse Stage 2 performance goals may include: • 35-100% fuel economy improvement • Significantly longer brake life (up to 4-5X in refuse, lower in less
aggressive drive cycles) • Also targeting trials in package delivery vehicles, yard hostlers, and
city transit buses
Stage 2 technical capabilities may include: • Full Series: no mechanical connections between engine and wheels • Dual mode series hydraulic hybrid at low speed, switches to
mechanical transmission at highway speed • Parallel: improved transmission efficiency and system integration • Potential for engine off operation • OBD Compliant
TECHNOLOGY
2016 2014 2018 2023 FINAL VERSION June 2014

Recommendations for Natural Gas Fuelled Hybrids
(includes Hydraulic Hybrids)
• Weigh in on CNG engine OBD compliance Issues
• Consider funding demonstrations of hydraulic-hybrid technology in new applications areas such as transit
NG
Eng
ine
Tec
hnol
ogy
Ran
ge E
xten
ded
EV
& H
ybri
d V
ehic
les
Fuel
s, St
orag
e &
In
fras
truc
ture
Po
licy
Path
way
s by
Veh
icle
A
pplic
atio
n
FINAL VERSION June 2014

NG
Eng
ine
Tec
hnol
ogy
Ran
ge E
xten
ded
EV
& H
ybri
d V
ehic
les
Fuel
s, St
orag
e &
In
fras
truc
ture
Po
licy
Path
way
s by
Veh
icle
A
pplic
atio
n
POLICY / OTHER
2013 2018
Policy/Other
Current Status and Near-Term Trends
FEDERAL Mandates/regulations • Development of NHTSA/EPA Phase 2 fuel economy standards Incentives • FTA research grants • DOE EERE funding • FTA MAP-21 NOLO deployment funding • Development of next-gen MAP-21 program (2015-2019) Other relevant federal issues • RIN/LCFS credits for RNG • Systemwide NG leakage studies
STATE/LOCAL Mandates/regulations • CARB voluntary low-NOx standards • Zero-emission bus regulation under review – how will this affect
potential of NG range-extenders? • California cap-and-trade funds for heavy-duty transportation • Potential for Calif. carbon tax – how will it affect cap & trade
revenues? • SJVAPCD/SCAQMD NOx standards Incentives • CEC/PIER program $3M NG hybrid development program for
trucks • CEC NGV incentive program for trucks • CEC Biofuel and RNG demo programs in development • Continuation of AB 118 funding for demos Other relevant state/local issues • CPUC determination of RNG pipeline injection • AB 118 funding for infrastructure • CARB undergoing planning on their sustainable freight strategy • POLA/POLB roadmapping and planning for zero-emission freight
corridor
Mid-Term Trends FEDERAL • Adoption of NHTSA/EPA phase 2 GHG/mileage standards
– will require better vehicle/engine design optimization • MAP-21 may include GHG performance-based metrics • Will the federal government or other state governments
bring changes to allowable vehicle lengths and weights to better balance reduced payload due to heavier tanks?
• The establishment of a mature, robust re-sale market for NG trucks could bring more stability to the overall NGV market and increase fleet adoption
STATE/LOCAL • CARB voluntary GHG regulations adopted • Zero-emission bus regulations implemented • Cap and trade revenues used for transportation • Renewable content standards - when will they apply to
NG for transportation? Will it be imposed on pipeline in general or just to transportation? – need to monitor both
• CARB ultra-low NOx voluntary standards adopted • CPUC regulations on pipeline injection of RNG – will this
bring better access by producers ? • Will CPUC bring consistency to fuel quality standards
(possibly higher methane numbers)? • How will the settlement of California OBD issues affect
AFVs? • Passage of AB 8 will bring more funds for more
infrastructure, vehicles & the development of RNG • Port zero-emission freight corridor implementation
2023 FINAL VERSION June 2014

Recommendations for Policy
• Support use of CA cap-and-trade funds for NG vehicle & infrastructure development
• Insure that NHTSA/EPA Phase 2 fuel economy standards give fair recognition to natural gas
• Track and weigh in on federal & state RIN/LCFS proceedings to promote greater use of RNG and to mitigate risk for producers
• Track and weigh in on CPUC proceedings re: pipeline injection of RNG
• Weigh in on systemwide NG leakage studies • Monitor & contribute to issues affecting NG engine OBD
compliance issues • Work to encourage CEC to make NG truck incentives more
transparent by adopting HVIP-like voucher structure
NG
Eng
ine
Tec
hnol
ogy
Ran
ge E
xten
ded
EV
& H
ybri
d V
ehic
les
Fuel
s, St
orag
e &
In
fras
truc
ture
Po
licy
Path
way
s by
Veh
icle
A
pplic
atio
n
FINAL VERSION June 2014

Technology Trends by Heavy-Duty Application
• Transit: early adopter of NG; moving toward implementation of zero- and near zero-emission solutions such as NG range-extenders & mild-hybrids
• Refuse: another early adopter; best candidate application for RNG and hydraulic-hybrid/NG configurations
• Port drayage: POLB/POLA funded some early deployments of NG; zero-emission zones will encourage NG range extenders
• Local/regional delivery: currently untapped market; good candidate for mild hybrids
• Over-the-Road: fast growing LNG market due to infrastructure but hampered by limited engine options; new efficiencies possible with SuperTruck technologies and possibly DME
NG
Eng
ine
Tec
hnol
ogy
Ran
ge E
xten
ded
EV
& H
ybri
d V
ehic
les
Fuel
s, St
orag
e &
In
fras
truc
ture
Po
licy
Path
way
s by
Veh
icle
A
pplic
atio
n
FINAL VERSION June 2014

NG
Eng
ine
Tec
hnol
ogy
Ran
ge E
xten
ded
EV
& H
ybri
d V
ehic
les
Fuel
s, St
orag
e &
In
fras
truc
ture
Po
licy
Path
way
s by
Veh
icle
A
pplic
atio
n
Current Status - Primarily using CNG - Adequate onboard storage capacities - Large-scale fueling operations required - Primarily using 8.9L, may see some 11.9L engines - Manufacturers: New Flyer, NABI, Gillig, Novabus, El Dorado,
Designline might reenter market with turbine electric
Projected Trends - Zero emissions bus regulations will drive the use of hydrogen
battery electric buses (up to 15% per year new purchases) - Opportunity exists for a NG range extender drive system ( CARB
Open to this under ZEB regulations) - Likely early deployment of near zero emissions (8.9liters) due to
municipal fleet rules by SCAQMD - Opportunity for very Mild Hybridization
Buses
Refuse
Port Drayage
Regional/local
Delivery
Over the Road
Trucks
2013 2018
By Application Type
Current Status − 75-100 DGE onboard CNG storage is typical, could use 50-60 DGE in
some apps − Placement of tanks/increased storage sometimes an issue − Some LNG applications − New deployments of hydraulic hybrids − Mostly utilizing 8.9L but 11.9L will make inroads − Excellent application for time-fill − Autocar/Cummins Westport Class 7 cab-over-chassis − Manufacturers : Autocar, Crane Carrier, Freightliner, Kenworth, Mack
Projected Trends - Anticipate growing use of RNG -excellent application due to
proximity of fuel source, i.e. Waste Management & Republic Services.
- Increasing use of LNG though CNG stays dominant - More NG/hydraulic hybrid combos as well as a potential for Hybrid
Electric combos due to productivity gains associated with the technology
Current Status - Use of NG picked up in 2011-2013 due to incentives but will flatten out due to significant early turnovers driven by CARB regulations - Using CNG & LNG via POLB/POLA clean trucks program - Limited need for range and HP- - Mostly utilizing 8.9L but 11.9L will make inroads - Manufacturers : Freightliner, Volvo, Kenworth, Peterbilt, Navistar
Projected Trends - Growing interest will re-occur in CNG - Zero Emission Zone at POLA/POLB will drive new range-
extender NG + fuel cell –battery dominant solutions - H2 + BEV could compete
Current Status - Primarily using CNG - Main alternative competitors are hybrid & BEV - Mostly utilizing 8.9L now but 11.9L will make inroads - Manufacturers : Freightliner, Volvo, Kenworth, Peterbilt, Navistar
Projected Trends - Potential for very mild NG hybrids - NG/BEV range extenders could compete - Opportunity for LNG infrastructure to support local use of
NG Pipeline - Need to further develop innovative CNG storage for less
space and shorter tractors on regional trucks
Current Status - Best application for LNG due to need for longer range - Still captive to infrastructure availability - 15L HPDI current best fit but should be able to handle 13L & 15L SI - Manufacturers : Freightliner, Kenworth, Volvo
Projected Trends - DME use - Aerodynamics/light-weighing - Increased range for CNG
2023 FINAL VERSION June 2014

Recommendations by Application
Transit Buses • Build partnerships and encourage development of NG-
turbine range extender electrified drivelines to provide NG option for California Zero Emission Bus regulations
• Work with MTA and others to become early adopter of low-NOx NG engines to secure early beachhead market for low NOx engine makers
• Work with technology partners to develop ultra-mild hybrid/electrified accessory NG driveline to drive down GHGs from conventional NG buses
NG
Eng
ine
Tec
hnol
ogy
Ran
ge E
xten
ded
EV
& H
ybri
d V
ehic
les
Fuel
s, St
orag
e &
In
fras
truc
ture
Po
licy
Path
way
s by
Veh
icle
A
pplic
atio
n
FINAL VERSION June 2014

Recommendations by Application Refuse Collection
• Weigh in with CEC on PIER funding for NG-hybrid refuse trucks - excellent early market. May be potential to add SCAQMD funding
• Participate in M-HD CEC pre-commercial demonstration project with NG Hybrid technology providers
• Work with technical partners like Parker Hannifin and BAE to garner Cummins support for providing appropriate engine to allow commercialization of NG-hybrid trucks
• Analyze best way to support and invest in growth of RNG as it relates to refuse by cooperating with producers such as Waste Management
NG
Eng
ine
Tec
hnol
ogy
Ran
ge E
xten
ded
EV
& H
ybri
d V
ehic
les
Fuel
s, St
orag
e &
In
fras
truc
ture
Po
licy
Path
way
s by
Veh
icle
A
pplic
atio
n
FINAL VERSION June 2014

Recommendations by Application
Port Drayage • Help to secure best possible outcome for NG
range extenders in drayage applications to meet needs of Zero Emissions Corridor and Zones to be implemented around 2020 (I-710 and POLB/POLA) • Participate in CEC M-HD demo activity as it
relates to NG range extenders demonstrations • Work with CEC-PIER to determine funding
interest
NG
Eng
ine
Tec
hnol
ogy
Ran
ge E
xten
ded
EV
& H
ybri
d V
ehic
les
Fuel
s, St
orag
e &
In
fras
truc
ture
Po
licy
Path
way
s by
Veh
icle
A
pplic
atio
n
FINAL VERSION June 2014

Recommendations by Application
Regional and Local Delivery Class 8 Trucks • Track and understand the adoption of the
new 11.9 liter engines, a major enabling pathway for greater use of NG in this class
• Understand and investigate innovative shorter length truck configurations that can enable the greater use of CNG
NG
Eng
ine
Tec
hnol
ogy
Ran
ge E
xten
ded
EV
& H
ybri
d V
ehic
les
Fuel
s, St
orag
e &
In
fras
truc
ture
Po
licy
Path
way
s by
Veh
icle
A
pplic
atio
n
FINAL VERSION June 2014

Recommendations by Application
Over the Road Trucks • Encourage and sponsor NG Users Group in order
to share early findings and learnings • Work with major truck makers and major fleets
to mitigate risk of adoption of new larger NG engines as part of user group activities
• Sponsor or encourage deployment of more new NG stations on major highways
NG
Eng
ine
Tec
hnol
ogy
Ran
ge E
xten
ded
EV
& H
ybri
d V
ehic
les
Fuel
s, St
orag
e &
In
fras
truc
ture
Po
licy
Path
way
s by
Veh
icle
A
pplic
atio
n
FINAL VERSION June 2014

Appendix
• Detailed engine/driveline technology descriptions and an assessment of their potential emissions & CO2 improvements
• CALSTART analysis of future paybacks for range extended electric drayage trucks
FINAL VERSION June 2014

FINAL VERSION June 2014

FINAL VERSION June 2014

FINAL VERSION June 2014

FINAL VERSION June 2014

FINAL VERSION June 2014
FINAL VERSION June 2014

FINAL VERSION June 2014

PROMISE of Payback • Initial analysis shows the promise of acceptable ROI, but
needs more study – verify assumptions and estimates • CNG REEV, then FC REEV, then BEV esp. for short routes
Total Range
(ZE Range)
Daily Driving
Simple Payback Period (years)
Incentive for 5-year
Payback Period
10-yr. O&M
savings
2020 Truck Incremental
Cost
($ per truck)
Infrastructure Cost ($ per
truck)
#1 BEV 100 (100)
100 17 $87,708 $67,798 $100,000 $25,000
#2L CNG REEV
Low Utilization 200 (50)
100 13 $42,983 $43,051 $60,000 $8,400
#2H CNG REEV
High Utilization 200 (50)
200 7 $20,692 $74,507 $60,000 $8,400
#3L Fuel Cell REEV
Low Utilization 200
(200) 100 16 $23,808 $14,907 $31,500 $3,350
#3H Fuel Cell REEV
High Utilization 200
(200) 200 10 $17,142 $19,879 $31,500 $3,350
Summary of Business Case Analysis Results Source: CALSTART
FINAL VERSION June 2014

Appendix – Stakeholders Engaged for this Study
Adsorbed Natural Gas Products, Inc. Robert Bonelli American Gas Alliance Katherine Clay Autocar Trevor Bridges Brayton Energy Jim Kesseli California Natural Gas Vehicle Coalition Tim Carmichael Capstone Steve Gillette Chesapeake Energy Sarie Joubert Chesapeake Energy Tim Denny Clean Energy Mike Eaves Cummins Westport Charlie Ker Cummins Westport Mustafa Kamel Cummins Westport Scott Baker E-Controls Kenon Guglielmo Freightliner Trucks Greg Treinen Freightliner Trucks Brian Daniels Gas Technology Institute William Liss Gas Technology Institute Tony Lindsey Kenworth Kevin Baney Lincoln Composites Jack Schimenti Mack Trucks Roy Horton Natural Gas Vehicles America Rich Kolodziej Oberon Fuels Rebecca Boudreaux Paccar, Inc. Graham Weller Peterbilt Frank Schneck Quantum Technologies David Mazaika Sturman Industries Joe Vollmer Trillium CNG Bill Zobel University of Missouri Peter Pfeiffer Volvo Trucks Sam McLaughlin Ward Alternative Energy Paul Nelson Waste Management Chuck White Westport Technologies Tahra Jutt Westport Technologies Valerie Parr Westport Technologies Mark Dunn Westport Technologies Patric Oulette FINAL VERSION June 2014

Possible Next Steps
• Marine & rail pathways • CalHEAT Advisory Committee Review • Industry outreach via technology forum • RNG roadmap • CEC NG-hybrid solicitation • Other issues
FINAL VERSION June 2014


