Heat Transfer of Liquid/ Solid Fluidized Beds for Newtonian …€¦ · · 2018-04-10Heat...
12
Vol. 23, No. 1, 2004 Iran. J. Chem. & Chem. Eng. Heat Transfer of Liquid/ Solid Fluidized Beds for Newtonian and Non-Newtonian Fluids Aghajani, Masoud* + Faculty of Petroleum Engineering, Petroleum University of Technology, Ahwaz, I.R. IRAN Müller-Steinhagen, H. Institute for Thermodynamics & Thermal Engineering, University of Stuttgart, GERMANY Jamialahmadi, Mohammad Faculty of Petroleum Engineering, Petroleum University of Technology, Ahwaz, I.R. IRAN ABSTRACT: The excellent performance of fluidized bed heat exchangers is due to the interaction between particles and heat transfer surface and to the mixing effects in the viscous sublayer. In this paper, the results of experimental investigations on heat transfer for a wide range of Newtonian and non-Newtonian (shear-thinning power law) fluids are presented. New design equations have been developed for the prediction of heat transfer coefficient. The predictions of these correlations and of numerous correlations recommended by other authors are compared with a large database compiled from the literature. KEY WORDS: Fluidized bed, Non-Newtonian fluid, Heat transfer, Bed voidage INTRODUCTION Liquid/solid fluidized beds are used throughout the process industry for hydrometallurgical operations, catalytic cracking, crystallization and sedimentation. In recent years, liquid/solid fluidized beds also find increasing applications in the treatment of aqueous wastes, heavy oil cracking, polymerization, biotechnology, fermentation, and food processing. Here, the liquid phase is viscous with non-Newtonian behavior. Several methods have been developed during the past years to reduce the formation of deposits in heat exchangers by chemical or mechanical means. One of the most promising concepts is the fluidized bed heat exchanger. To apply fluidized bed heat exchangers more widely, one has to be able to predict the heat transfer coefficient for a given condition through the knowledge and understanding of the mechanisms involved. Investigations on the hydrodynamic behaviour of Newtonian systems have been documented and discussed by Jamialahmadi and Müller-Steinhagen [1]. The aim of the present investigation is, to measure the heat transfer parameters over a wide range of particle * To whom correspondence should be addressed. + E-mail: m.aghajani@ put.ac.ir 1021-9986/04/1/119 12/$/3.2 119
Transcript of Heat Transfer of Liquid/ Solid Fluidized Beds for Newtonian …€¦ · · 2018-04-10Heat...
Vol. 23, No. 1, 2004 Heat Transfer of Liquid / … Iran. J. Chem. & Chem. Eng.
Heat Transfer of Liquid/ Solid Fluidized Beds for
Newtonian and Non-Newtonian Fluids
Aghajani, Masoud*+
Faculty of Petroleum Engineering, Petroleum University of Technology, Ahwaz, I.R. IRAN
Müller-Steinhagen, H.
Institute for Thermodynamics & Thermal Engineering, University of Stuttgart, GERMANY
Jamialahmadi, Mohammad
Faculty of Petroleum Engineering, Petroleum University of Technology, Ahwaz, I.R. IRAN
ABSTRACT: The excellent performance of fluidized bed heat exchangers is due to the interaction
between particles and heat transfer surface and to the mixing effects in the viscous sublayer. In this
paper, the results of experimental investigations on heat transfer for a wide range of Newtonian and
non-Newtonian (shear-thinning power law) fluids are presented. New design equations have been
developed for the prediction of heat transfer coefficient. The predictions of these correlations and
of numerous correlations recommended by other authors are compared with a large database
compiled from the literature.
KEY WORDS: Fluidized bed, Non-Newtonian fluid, Heat transfer, Bed voidage
INTRODUCTION
Liquid/solid fluidized beds are used throughout the
process industry for hydrometallurgical operations,
catalytic cracking, crystallization and sedimentation.
In recent years, liquid/solid fluidized beds also
find increasing applications in the treatment of
aqueous wastes, heavy oil cracking, polymerization,
biotechnology, fermentation, and food processing. Here,
the liquid phase is viscous with non-Newtonian behavior.
Several methods have been developed during the past
years to reduce the formation of deposits in heat
exchangers by chemical or mechanical means. One of the
most promising concepts is the fluidized bed heat
exchanger.
To apply fluidized bed heat exchangers more widely, one has to be able to predict the heat transfer
coefficient for a given condition through the knowledge
and understanding of the mechanisms involved.
Investigations on the hydrodynamic behaviour of
Newtonian systems have been documented and discussed
by Jamialahmadi and Müller-Steinhagen [1].
The aim of the present investigation is, to measure the
heat transfer parameters over a wide range of particle
* To whom correspondence should be addressed.
+ E-mail: m.aghajani@ put.ac.ir
1021-9986/04/1/119 12/$/3.2
119
Vol. 23, No. 1, 2004 Aghajani, M., et. al. Iran. J. Chem. & Chem. Eng.
size, density and shape using liquids with Newtonian
and non-Newtonian behavior. The predictions of
various published correlations are compared with
these experimental data and new correlations and
methodologies are presented for the predictions of the
heat transfer coefficient in beds which are fluidized with
Newtonian and non-Newtonian liquids.
EXPERIMENTAL EQUIPMENT AND PROCEDURE
Test Rig for Measuring Heat Transfer Coefficients
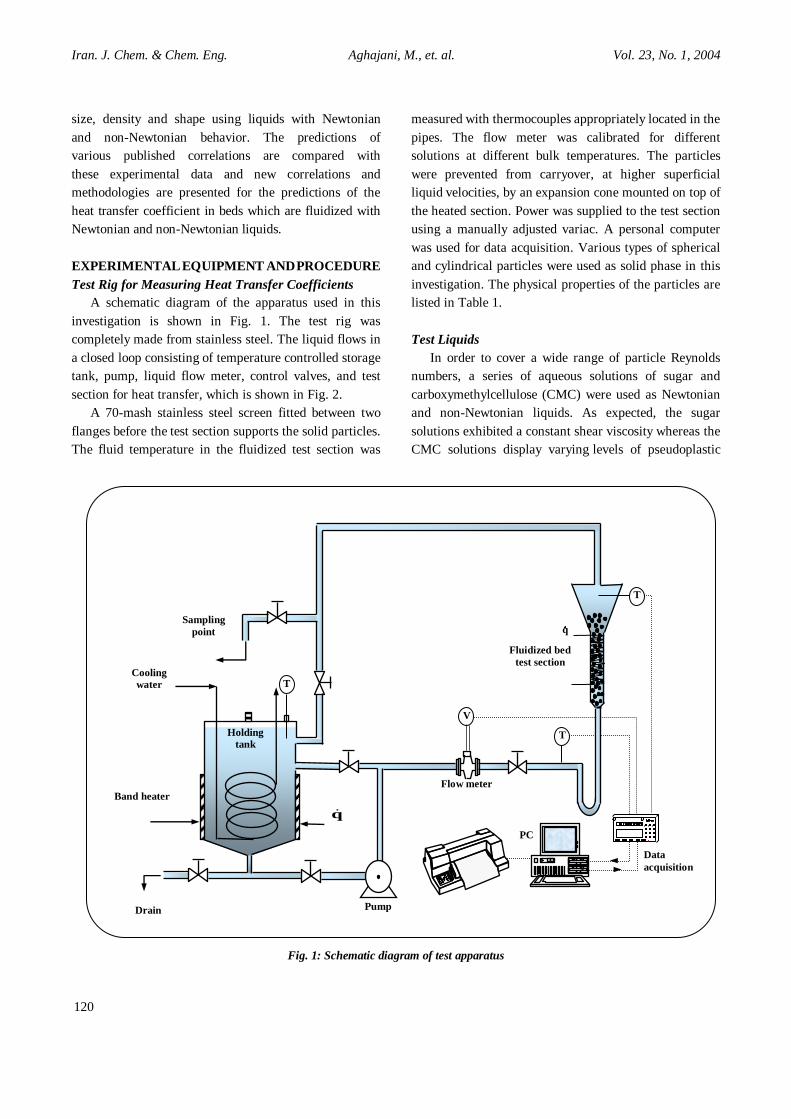
A schematic diagram of the apparatus used in this
investigation is shown in Fig. 1. The test rig was
completely made from stainless steel. The liquid flows in
a closed loop consisting of temperature controlled storage
tank, pump, liquid flow meter, control valves, and test
section for heat transfer, which is shown in Fig. 2.
A 70-mash stainless steel screen fitted between two
flanges before the test section supports the solid particles.
The fluid temperature in the fluidized test section was
measured with thermocouples appropriately located in the
pipes. The flow meter was calibrated for different
solutions at different bulk temperatures. The particles
were prevented from carryover, at higher superficial
liquid velocities, by an expansion cone mounted on top of
the heated section. Power was supplied to the test section
using a manually adjusted variac. A personal computer
was used for data acquisition. Various types of spherical
and cylindrical particles were used as solid phase in this
investigation. The physical properties of the particles are
listed in Table 1.
Test Liquids
In order to cover a wide range of particle Reynolds
numbers, a series of aqueous solutions of sugar and
carboxymethylcellulose (CMC) were used as Newtonian
and non-Newtonian liquids. As expected, the sugar
solutions exhibited a constant shear viscosity whereas the
CMC solutions display varying levels of pseudoplastic
Fig. 1: Schematic diagram of test apparatus
Data
acquisition
Fluidized bed
test section
Flow meter
Pump
Band heater
Cooling
water
Holding
tank
Sampling
point
Drain
q
q
V
T
PC
T
T
120
q
Vol. 23, No. 1, 2004 Heat Transfer of Liquid /… Iran. J. Chem. & Chem. Eng.
Table 1: Physical properties of Solid particles
Type Name
dp or dpe*
[ mm ]
SB
[ - ]
[ - ]
Density
[ kg / m3 ]
Specific heat
[ J/kg K ]
Conductivity
[ W/m K ]
Cylindrical
Aluminium 23 mm
Aluminium 33 mm
Brass 33 mm
Stainless Steel 33 mm
Stainless Steel 22 mm
Tantalum 44 mm
2.62
3.43
3.43
3.43
2.29
4.58
0.40
0.41
0.41
0.41
0.40
0.41
0.86
0.87
0.87
0.87
0.87
0.87
2600
2600
8500
7900
7900
17600
896
896
385
460
460
151
204
204
111
17
17
54.4
Spherical
Glass
Glass
Glass
Lead
Lead
Carbon Steel
Carbon Steel
Stainless Steel
2
3
4
2.9
4
4
3
3.7
0.39
0.39
0.40
0.39
0.40
0.40
0.39
0.40
1
1
1
1
1
1
1
1
2700
2700
2700
11350
11350
7800
7800
8100
840
840
840
130
130
473
473
460
0.87
0.87
0.87
35
35
43
43
13
* dpe = Equivalent diameter for cylindrical particle = Diameter of a sphere having the same volume as the
particle (volume diameter).
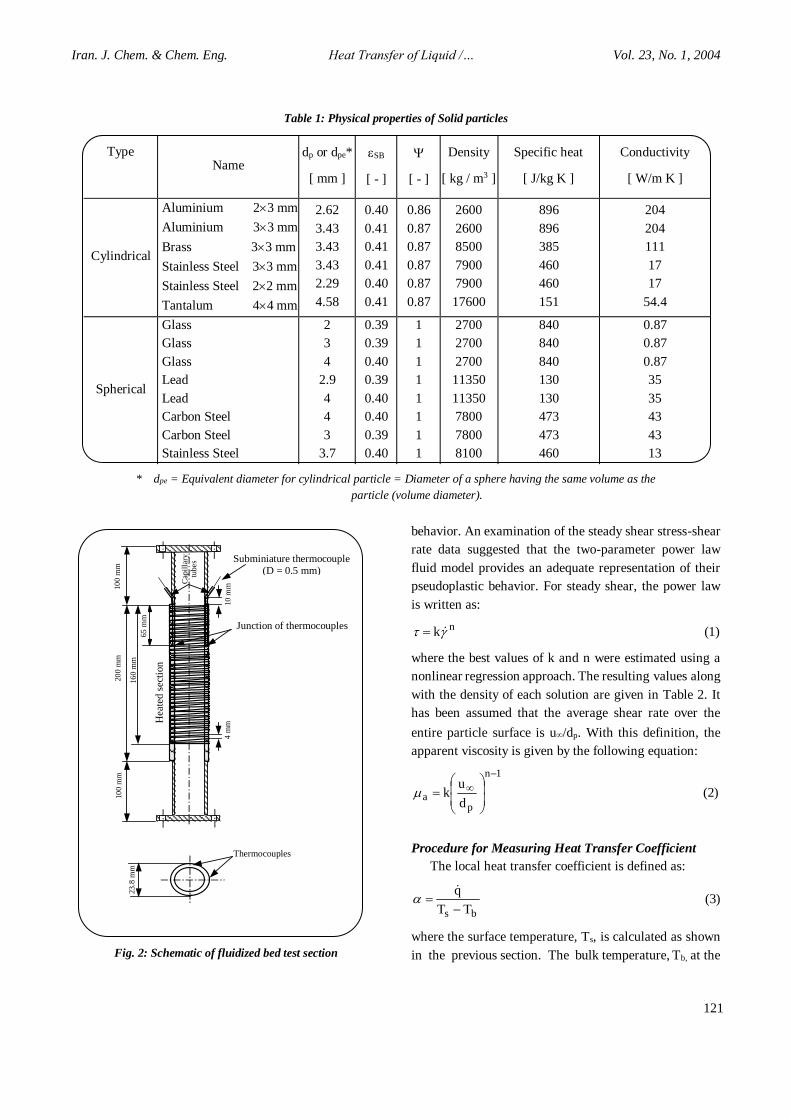
Fig. 2: Schematic of fluidized bed test section
behavior. An examination of the steady shear stress-shear
rate data suggested that the two-parameter power law
fluid model provides an adequate representation of their
pseudoplastic behavior. For steady shear, the power law
is written as:
nk (1)
where the best values of k and n were estimated using a
nonlinear regression approach. The resulting values along
with the density of each solution are given in Table 2. It
has been assumed that the average shear rate over the
entire particle surface is u/dp. With this definition, the
apparent viscosity is given by the following equation:
1n
pa
d
uk
(2)
Procedure for Measuring Heat Transfer Coefficient
The local heat transfer coefficient is defined as:
bs TT
q
(3)
where the surface temperature, Ts, is calculated as shown
in the previous section. The bulk temperature, Tb, at the
23.8
mm
Thermocouples
4 m
m
Cap
illa
ry
tubes
10 m
m
10
0 m
m
Hea
ted
sec
tion
Subminiature thermocouple (D = 0.5 mm)
20
0 m
m
65 m
m
16
0 m
m
10
0 m
m
Junction of thermocouples
121
Thermocouples
Vol. 23, No. 1, 2004 Aghajani, M., et. al. Iran. J. Chem. & Chem. Eng.
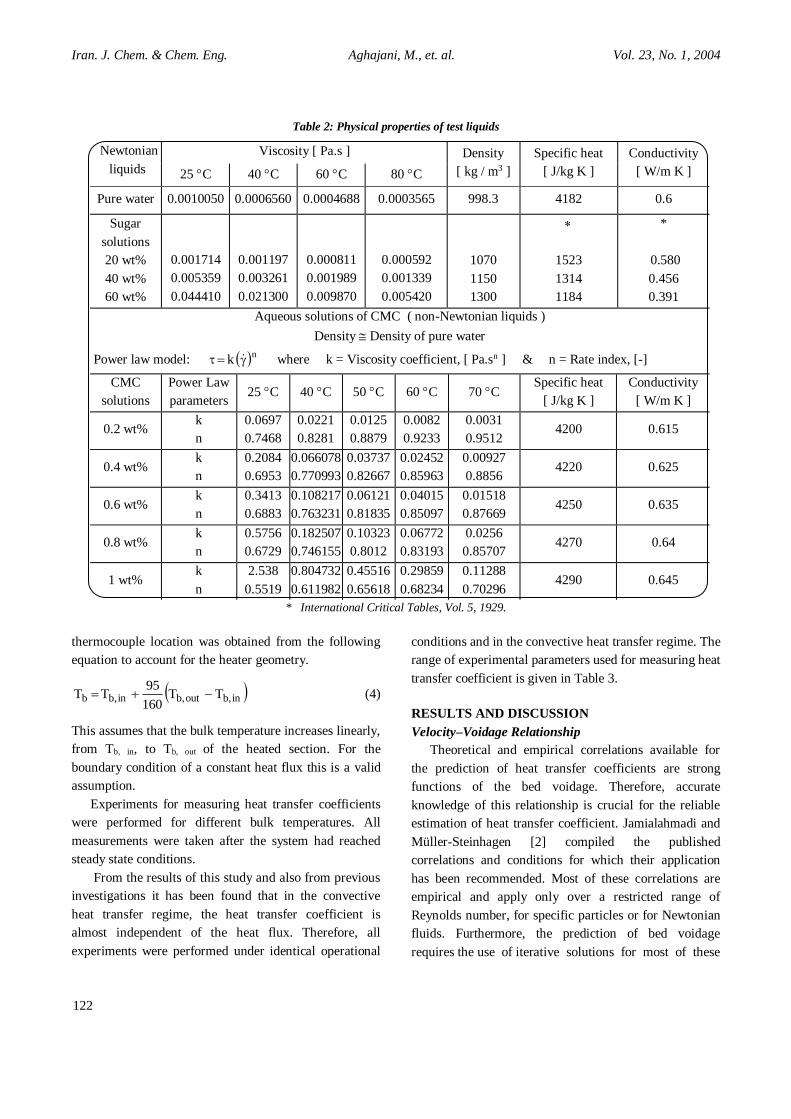
Table 2: Physical properties of test liquids
Newtonian
liquids
Viscosity [ Pa.s ] Density
[ kg / m3 ]
Specific heat
[ J/kg K ]
Conductivity
[ W/m K ] 25 C 40 C 60 C 80 C
Pure water 0.0010050 0.0006560 0.0004688 0.0003565 998.3 4182 0.6
Sugar
solutions
20 wt%
40 wt%
60 wt%
0.001714
0.005359
0.044410
0.001197
0.003261
0.021300
0.000811
0.001989
0.009870
0.000592
0.001339
0.005420
1070
1150
1300
1523
1314
1184
*
0.580
0.456
0.391
Aqueous solutions of CMC ( non-Newtonian liquids )
Density Density of pure water
Power law model: nk where k = Viscosity coefficient, [ Pa.sn ] & n = Rate index, [-]
CMC
solutions
Power Law
parameters 25 C 40 C 50 C 60 C 70 C
Specific heat
[ J/kg K ]
Conductivity
[ W/m K ]
0.2 wt% k
n
0.0697
0.7468
0.0221
0.8281
0.0125
0.8879
0.0082
0.9233
0.0031
0.9512 4200 0.615
0.4 wt% k
n
0.2084
0.6953
0.066078
0.770993
0.03737
0.82667
0.02452
0.85963
0.00927
0.8856 4220 0.625
0.6 wt% k
n
0.3413
0.6883
0.108217
0.763231
0.06121
0.81835
0.04015
0.85097
0.01518
0.87669 4250 0.635
0.8 wt% k
n
0.5756
0.6729
0.182507
0.746155
0.10323
0.8012
0.06772
0.83193
0.0256
0.85707 4270 0.64
1 wt% k
n
2.538
0.5519
0.804732
0.611982
0.45516
0.65618
0.29859
0.68234
0.11288
0.70296 4290 0.645
* International Critical Tables, Vol. 5, 1929.
thermocouple location was obtained from the following
equation to account for the heater geometry.
in,bout,bin,bb TT160
95TT (4)
This assumes that the bulk temperature increases linearly,
from Tb, in, to Tb, out of the heated section. For the
boundary condition of a constant heat flux this is a valid
assumption.
Experiments for measuring heat transfer coefficients
were performed for different bulk temperatures. All
measurements were taken after the system had reached
steady state conditions.
From the results of this study and also from previous
investigations it has been found that in the convective
heat transfer regime, the heat transfer coefficient is
almost independent of the heat flux. Therefore, all
experiments were performed under identical operational
conditions and in the convective heat transfer regime. The
range of experimental parameters used for measuring heat
transfer coefficient is given in Table 3.
RESULTS AND DISCUSSION
Velocity–Voidage Relationship
Theoretical and empirical correlations available for
the prediction of heat transfer coefficients are strong
functions of the bed voidage. Therefore, accurate
knowledge of this relationship is crucial for the reliable
estimation of heat transfer coefficient. Jamialahmadi and
Müller-Steinhagen [2] compiled the published
correlations and conditions for which their application
has been recommended. Most of these correlations are
empirical and apply only over a restricted range of
Reynolds number, for specific particles or for Newtonian
fluids. Furthermore, the prediction of bed voidage
requires the use of iterative solutions for most of these
122
Superficial liquid velocity, us [m/s]
Vol. 23, No. 1, 2004 Heat Transfer of Liquid /… Iran. J. Chem. & Chem. Eng.
Table 3: Range of experimental parameters for the
measurements of heat transfer coefficients
dp / Dh
p
l
l
Rep
Ar
Pr
0.12 to 0.17
2600 to 11350 kg/m3
998 to 1300 kg/m3
0.00036 to 0.14 Pa. s
0.12 to 1570
99 to 3.4 107
1.5 to 900
correlations. Therefore, in this work the bed voidages
were calculated according to a new model that has been
suggested by Aghajani, M., [3].
SBSB
z
1
t
s 1u
u
(5)
The static bed voidage SB in equation (5) can be
calculated by the following equations.
For spherical particles:
033.2d
D ; 38.0
1d
D
15.0
p
h
p
h
SB
(6)
For cylindrical particles:
033.2d
D ; 39.0
1d
D
15.0
p
h
p
h
SB
(7)
and the fluidization index, z can be calculated by the
following equation.
)Re5.01(
)Re5.02(65.0z
65.0p
65.0p
(8)
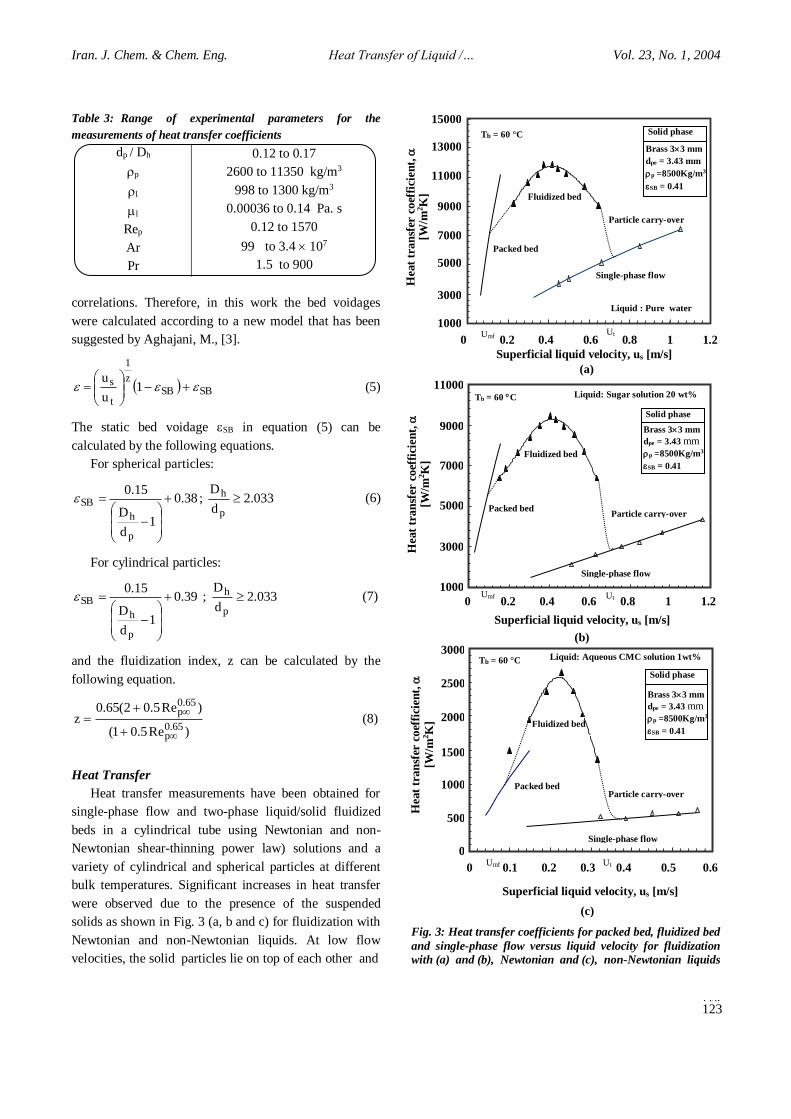
Heat Transfer
Heat transfer measurements have been obtained for
single-phase flow and two-phase liquid/solid fluidized
beds in a cylindrical tube using Newtonian and non-
Newtonian shear-thinning power law) solutions and a
variety of cylindrical and spherical particles at different
bulk temperatures. Significant increases in heat transfer
were observed due to the presence of the suspended
solids as shown in Fig. 3 (a, b and c) for fluidization with
Newtonian and non-Newtonian liquids. At low flow
velocities, the solid particles lie on top of each other and
Fig. 3: Heat transfer coefficients for packed bed, fluidized bed
and single-phase flow versus liquid velocity for fluidization
with (a) and (b), Newtonian and (c), non-Newtonian liquids
0 0
.
1
0
.
2
0
.
3
0
.
4
0
.
5
0
.
6
Solid phase
10
00
30
00
50
00
70
00
90
00
110
00
130
00
0 0.
2 0.
4 0
.
6
0
.
8
1 1.
2
Solid phase
properties Brass 33 mm
dpe = 3.43 mm
p =8500Kg/m3
SB = 0.41
u
t
Superficial liquid
velocity, us [m/s]
Tb = 60 C
Solid phase
properties
Fluidized bed
Packed bed
Particle carry-over
Single-phase flow
Tb = 60 °C
Fluidized bed
Packed bed
Particle carry-over
Single-phase flow
Liquid : Pure water
0 0.2 0.4 0.6 0.8 1 1.2 Umf
Ut
0 0.2 0.4 0.6 0.8 1 1.2 Ut
Umf
15000
13000
11000
9000
7000
5000
3000
1000
11000
9000
7000
5000
3000
1000
Hea
t tr
an
sfer
coef
fici
ent,
[W/m
2K
]
0 0.1 0.2 0.3 0.4 0.5 0.6
Superficial liquid velocity, us [m/s]
Ut
Umf
Superficial liquid velocity, us [m/s]
3000
2500
2000
1500
1000
500
0
Hea
t tr
an
sfer
coef
fici
ent,
[W/m
2K
]
Tb = 60 °C
Brass 33 mm
dpe = 3.43 mm
p =8500Kg/m3
SB = 0.41
Single-phase flow
Particle carry-over
Fluidized bed
Packed bed
Liquid: Aqueous CMC solution 1wt%
Liquid: Sugar solution 20 wt%
123
Brass 33 mm
dpe = 3.43 mm
p =8500Kg/m3
SB = 0.41
(b)
(c)
Hea
t tr
an
sfer
coef
fici
ent,
[W/m
2K
]
Superficial liquid velocity, us [m/s]
(a)
Vol. 23, No. 1, 2004 Aghajani, M., et. al. Iran. J. Chem. & Chem. Eng.
on the porous bottom of the column and the bed is in a
packed bed state. When the superficial liquid velocity
exceeds the minimum fluidization velocity, umf
fluidization starts. By further increase of superficial
liquid velocity, the heat transfer coefficient, increases
up to a maximum value. Then, the heat transfer
coefficient decreases, reaching the single-phase value at
terminal velocity, ut. At high flow velocities the solid
particles are conveyed out of the column. It is found that
heat transfer coefficients for liquid/solid fluidized
bedsare up to 7 times higher than for single-phase flow at
the same velocity. For fluidization with high viscosity
Newtonian or non-Newtonian liquids this increase in heat
transfer coefficient is lower. A Possible reason is low
movement of particles in high viscosity solutions.
Therefore the contribution of this mechanism to
enhancement of heat transfer coefficient becomes lower.
For packed beds in these figures the heat transfer
coefficient is calculated using the Yagi and Wakao [4]
equation:
3/18.0pp PrRe20.0Nu (9)
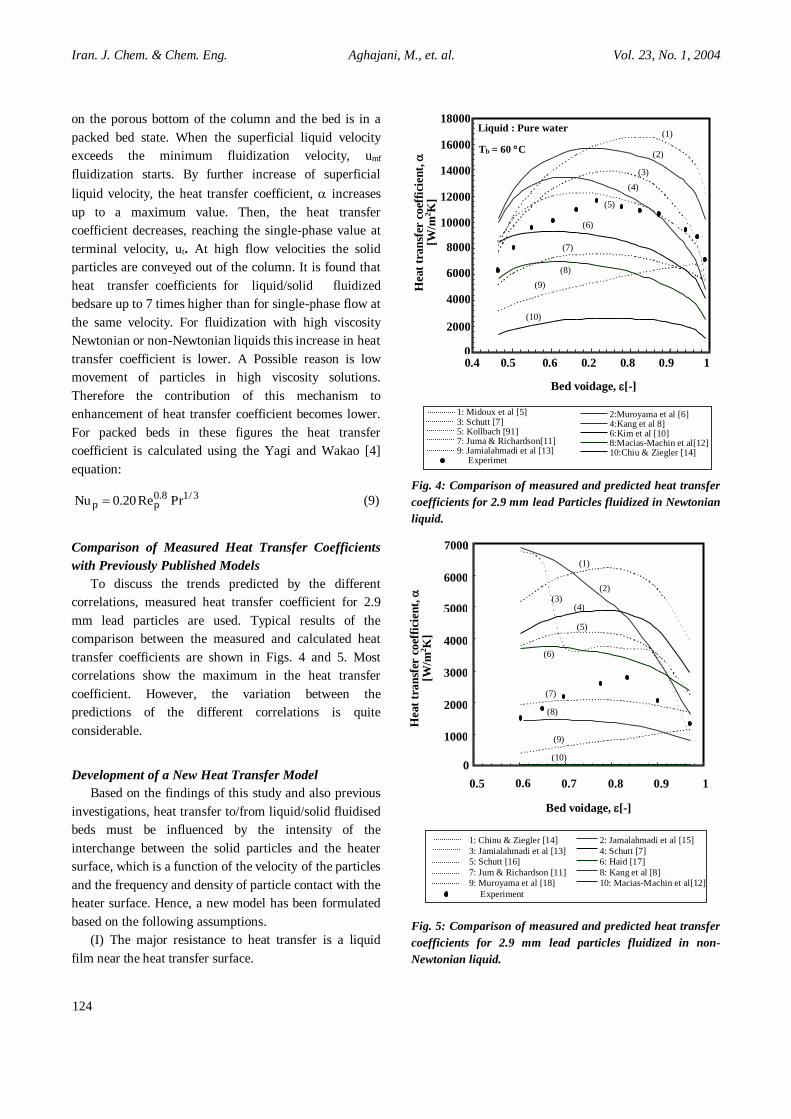
Comparison of Measured Heat Transfer Coefficients
with Previously Published Models
To discuss the trends predicted by the different
correlations, measured heat transfer coefficient for 2.9
mm lead particles are used. Typical results of the
comparison between the measured and calculated heat
transfer coefficients are shown in Figs. 4 and 5. Most
correlations show the maximum in the heat transfer
coefficient. However, the variation between the
predictions of the different correlations is quite
considerable.
Development of a New Heat Transfer Model
Based on the findings of this study and also previous
investigations, heat transfer to/from liquid/solid fluidised
beds must be influenced by the intensity of the
interchange between the solid particles and the heater
surface, which is a function of the velocity of the particles
and the frequency and density of particle contact with the
heater surface. Hence, a new model has been formulated
based on the following assumptions.
(I) The major resistance to heat transfer is a liquid
film near the heat transfer surface.
Fig. 4: Comparison of measured and predicted heat transfer
coefficients for 2.9 mm lead Particles fluidized in Newtonian
liquid.
Fig. 5: Comparison of measured and predicted heat transfer
coefficients for 2.9 mm lead particles fluidized in non-
Newtonian liquid.
0
Tb = 60 C
Liquid : Pure water
0.4 0.5 0.6 0.2 0.8 0.9 1
Bed voidage, [-]
18000
16000
14000
12000
10000
8000
6000
4000
2000
0
Bed voidage, [-]
Hea
t tr
an
sfer
coef
fici
ent,
[W/m
2K
]
(4)
(5)
(6)
(7)
(8)
(9)
(10)
1: Midoux et al [5] 3: Schutt [7] 5: Kollbach [91] 7: Juma & Richardson[11] 9: Jamialahmadi et al [13] Experimet
2:Muroyama et al [6] 4:Kang et al 8] 6:Kim et al [10] 8:Macias-Machin et al[12] 10:Chiu & Ziegler [14]
2: Jamalahmadi et al [15]
4: Schutt [7]
6: Haid [17]
8: Kang et al [8]
10: Macias-Machin et al[12]
1: Chinu & Ziegler [14]
3: Jamialahmadi et al [13]
5: Schutt [16]
7: Jum & Richardson [11]
9: Muroyama et al [18]
Experiment
124
(1)
(2)
(3) (3)
(2)
(1)
Hea
t tr
an
sfer
coef
fici
ent,
[W/m
2K
]
0
1000
2000
3000
4000
5000
6000
7000
0.5 0.6 0.7 0.8 0.9 1
(1)
(2)
(3) (4)
(5)
(6)
(7)
(8)
(9)
(10)
0
7000

Vol. 23, No. 1, 2004 Heat Transfer of Liquid /… Iran. J. Chem. & Chem. Eng.
(II) Due to the movement of solid particles there is a
steady flow of fluid elements from the bulk of the fluid to
the heat transfer surface and vice versa. The fluid
elements reside for a finite time at the surface until they
return to the bulk in the wake of solid particles scouring
the heat transfer surface. In this region heat is transferred
into the fluid by transient heat conduction from the heat
transfer surface. Some heat is also transferred by
conduction to the particles while they are in contact with
the heat transfer surface.
(III) On these parts of the heat transfer surface that are
not in contact with particles, heat is transferred to the
liquid by forced convection.
Therefore heat transfer at any moment is component
of two parallel mechanisms in separate zones of the heat
transfer surface i.e. the surface area affected by particles,
Ap, and the remaining heat transfer area, Ac, in which
heat is transferred by forced convection.
Han and Griffith [19] have shown that the area from
which the hot liquid layer is pumped away by a vapour
bubble leaving the heat transfer surface is 2bd . Since
small bubbles and solid particles behave similarly, the
area of the heat transfer surface affected by a single
particle should also be 2pd . The following approach is
hence analogous to nucleate boiling heat transfer if
"vapour bubble" is replaced by "particle" and "latent heat
transfer" by "particle conduction".
Time-averaged heat transfer coefficients may be
additive if it is assumed that both mechanisms (heat
transfer by fluid convection and heat transfer by transient
heat conduction from the heat transfer surface) coexist
over the entire heat transfer surface. Therefore, the total
heat transfer coefficient is:
= c + p (10)
The local forced convective heat transfer coefficient,
c, can be calculated from the Gnielinski [20] equation
for heat transfer during turbulent flow in pipes if it is
modified to apply for local conditions.
11.0
w
b3/2
3/2i
i
Pr
Pr
X
D
3
11
1Pr8
f7.121
Pr1000Re8
f
Nu
(11)
Based on extensive experimental and numerical
research Jamialahmadi and Müller-Steinhagen [15]
suggested using Re instead of (Re1000) in equation 11.
The friction factor, fi for turbulent flow may be calculated
according to Filonenko [21].
2i 64.1ReLog82.1f
(12)
An average relative error of 5.7% for Newtonian
solutions and 8.6% for non-Newtonian (shear thinning
power law) solutions indicated that there is very good
agreement between the measured data and the predictions
of the modified Gnielinski [20] equation.
Prediction of p
The heat transfer coefficient for the particle-controlled
area, p also includes two parallel heat transfer
coefficients
wpwlp (13)
In the above equation wl is the heat transfer
coefficient from the wall to the adjacent liquid layer and
wp is the heat transfer coefficient from the wall to the
particle. Following the departure of the particle and the
hot liquid layer, the liquid at Tb from the main body of
the fluid flows into the area of influence 2pd and comes
into contact with the heating surface at Tw. Assuming
pure conduction into the liquid and particle in the area of
the influence, this part of problem can be modeled as
conduction to a semi-infinite liquid with a step change in
temperature (T=Tw-Tb) at the surface.
t
Tc
A
qp
(14)
The hot layer is replaced with a frequency f, which is
equal to the frequency of the collision of particles with
the heat transfer surface. Hence, similar to the study of
Mikic and Rohsenow [22] on pool boiling, the average
heat flux over the area of influence would be:
Tfc2q
l,pll
p
(15)
Taking into account the heat transfer to the particles
by conduction when they are in contact with the heat
transfer surface, the equation (15) can be written as:
Tfcdc2
q p,ppp2pl,pllp
(16)
Therefore, the heat transfer coefficient for the
125

Vol. 23, No. 1, 2004 Aghajani, M., et. al. Iran. J. Chem. & Chem. Eng.
particle-controlled area can now be obtained from
thefollowing equation.
fcdc2
p,ppp2pl,pllp
(17)
In the above equations, f is equal to the frequency of
particles approaching the heat transfer surface. By
analogy to the kinetic theory of gases (applied to the
randomly moving solid particles in a fluidized bed)
Martin [23], [24] has shown that:
p
p
c d4
Cu
t
1f (18)
Where C is a constant between 2 and 4 for gas and
liquid fluidizations. Determining the particle velocity, up
in fluidized beds is difficult and would require special
equipment. Many of investigators such as Latif and
Richardson [25] have speculated that in fluidized beds the
particle velocity is proportional to the superficial liquid
velocity and at =SB it must be zero. Therefore, it is
assumed that:
aSBsp muu (19)
Considering that particle contact frequency must be
zero at =1, using equation (19), equation (18) may be
modified to:
baSB
p
s 1d
uKf
(20)
In above equations m, K, a, and b are constants. By
analyzing a huge number of experimental data for both
Newtonian and non-Newtonian liquid-solid fluidized
beds it was found that good agreement with experimental
data was obtained as following:
For Newtonian liquid-solid fluidized beds:
2.0SB
8.1
p
s 1d
u2f
(21)
For non-Newtonian liquid-solid fluidized beds:
6.1SB
8.1
p
s 1d
u9.0f
(22)
In this investigation both particulate and aggregative
fluidization behavior is occurring and from the presented
model it is obvious that the heat transfer coefficient
depends into collision frequency of contacting particles, f
given by equations 21 and 22 and according to these
equations it relates to the bed voidage and hence to the
hydrodynamics of system.
The collision frequency of contacting particles with
heat transfer surfaces, f must increase from zero for a
packed bed up to a maximum value, at some superficial
liquid velocity, before decreasing to zero for single-phase
flow. The collision frequency calculated in the present
model given by equations 21 and 22 is zero for packed or
static beds and for single-phase fluid flow, and generally
reaches a maximum for a bed voidage between 0.65 and
0.85, in accordance with the maximum heat transfer
coefficient. Moreover, it is clear that the contact
frequency is affected by the viscosity of the liquid and as
can be seen in the Fig. 6 for fluidization in highly viscous
liquids (in which the fluidization behavior tends to be
particulate) it significantly decreases.
Comparison of Published Heat Transfer Coefficients
with the Present Model
In the experimental part of this work, a large number
of data over a wide range of possible operating
parameters have been obtained for heat transfer
in liquid/solid fluidized beds with Newtonian and
non-Newtonian liquids. These data have been
complemented by all the published data the authors
could extract from the literature. Checking for
consistency, all data for velocities greater than the
terminal velocity or data sets where the measured In the
experimental part of this work, a large number of data
over a wide range of possible operating parameters have
been obtained for heat transfer in liquid/solid fluidized
beds with Newtonian and non-Newtonian liquids. These
data have been complemented by all the published data
the authors could extract from the literature. Checking for
consistency, all data for velocities greater than the
terminal velocity or data sets where the measured wall
temperatures were outside the fluidised region were
removed.
Typical predictions of the present model for different
particles fluidized in Newtonian and non-Newtonian
solutions are shown in figs. 7 and 8. The calculated trends
are in excellent agreement with the experimental data
of this study and of all previous investigators.
The applicability of the present model for Newtonian
and non-Newtonian liquid/solid fluidized beds is
demonstrated in Figs. 9 and 10 where the experimental
126

Vol. 23, No. 1, 2004 Heat Transfer of Liquid /… Iran. J. Chem. & Chem. Eng.
Fig. 6: Collision frequency, f, as a function of bed voidage
Particles Liquid p (kg/m3) Tb )C(
Stainless steel 22 mm Pure water 7900 94
Glass 3.1 mm Pure water 2500 40
Gravel 1.8 mm Pure water 2670 15
Glass 2.5 mm Pure water 2500 80
Fig. 7: Comparison of measured and predicted heat transfer
coefficients for fluidization in a Newtonian liquid.
data of this study and of various other investigators are
compared with those predicted from the model presented
in this investigation.
Fig. 8: Comparison of measured and predicted heat transfer
coefficients for fluidization in a non-Newtonian liquid
Fig. 9: Comparison of measured and predicted heat transfer
coefficients with values calculated from the present model for
Newtonian liquids
The average relative errors avrel and the standard
deviation of prediction,, of typical correlations used in
this comparison, which are defined as follows, are shown
in Table 4
0
5
1
0
1
5
2
0
2
5
3
0
3
5
4
0
0
.
4
0
.
5
0
.
6
0
.
7
0
.
8
0
.
9
1 Bed
voidage,
[-]
1.2
1
0.8
0.6
0.4
0.2
0
40
35
30
25
20
15
10 5
0 0.4 0.5 0.6 0.2 0.8 0.9 1
Bed voidage, [-]
Coll
isio
n f
req
uen
cy, f
[1/s
]
Solid : Brass 33 mm
Liquid : 20 wt% sugar solution
Liquid : 1 wt% aqueous CMC solution
0
2
0
0
0
4
0
0
0
6
0
0
0
8
0
0
0
10
00
0
12
00
0
14
00
0
16
00
0
18
00
0
0
.
4
0
.
5
0
.
6
0
.
7
0
.
8
0
.
9
1 Bed
voidag
e, [-]
Kollbach [9] Muroyama et al.
[6] Richardson & Smith
[26] Schütt [16]
0.40 0.50 0.60 0.70 0.80 0.90 1.00
Bed voidage, [-]
18000
16000
14000
12000
10000
8000
6000
4000
2000
0
Hea
t tr
an
sfer
coef
fici
ent,
[
W/m
2K
]
0
5
0
0
1
0
0
0
1
5
0
0
2
0
0
0
2
5
0
0
3
0
0
0
0.
4
0
0.
5
0
0.
6
0
0.
7
0
0.
8
0
0.
9
0
1.
00
Hea
t tr
an
sfer
coef
fici
ent,
[
W/m
2K
]
Tb = 60 °C Liquid : 1 wt% aqueous CMC solution
0.4 0.5 0.6 0.7 0.8 0.9 1
Bed voidage, [-]
0
2
0
0
0
4
0
0
0
6
0
0
0
8
0
0
0
10
00
0
12
00
0
14
00
0
16
00
0
0 2
0
0
0
4
0
0
0
6
0
0
0
8
0
0
0
10
00
0
12
00
0
14
00
0
16
00
0
3000
2500
2000
1500
1000
500
0
Hea
t tr
an
sfer
coef
fici
ent,
[
W/m
2K
]
0 2000 4000 6000 8000 10000 12000 14000 16000
Heat transfer coefficient, [W/m2K]
(Experimental)
1600
1400
1200
1000
8000
6000
4000
2000
0
Hea
t tr
an
sfer
coef
fici
ent,
[
W/m
2K
)
(Pre
dic
ted
)
127
Brass 3×3 mm
Carbon stell 3mm
Present model
Present odel

Vol. 23, No. 1, 2004 Aghajani, M., et. al. Iran. J. Chem. & Chem. Eng.
Table 4: Typical comparison of measured data and values predicted by published models.
No. Author
Newtonian Liquids Non-Newtonian Liquids
average
relative
error
(%)
Standard
deviation
(%)
Prediction
average
relative error
(%)
Standard
deviation
(%)
Prediction
1 Kollbach [9] 38.6 15.3 ± 80.2 58.3 + +
2 Schütt [16] 46.8 16.9 ± 94.2 70.7 +
3 Juma & Richardson [11] 41.7 19.6 44 42.2 ±
4 Kang et al. [8] 38.7 21.5 ± 32.2 32.8 ±
5 Kim et al. [10] 30.7 14.5 52.6 57.3 ±
6 Jamialahmadi et al. [15] 35.8 16.3 ± 189 216 ±
7 Muroyama et al. [6] 43 27.3 ± 38.2 34.5 ±
8 Schütt [7] 46 23.2 ± 152.2 93.1 + +
9 Macias-Machin et al. [12] 47 31.7 88.6 4.4
10 Jamialahmadi et al. [13] 39.3 16.7 ± 123 194 + +
11 Chiu & Ziegler [14] 78.6 16.6 249 126 + +
12 Muroyama et al. [18] 45.3 32.2 ± 45.5 48.2 ±
13 Haid [17] 36.7 22.4 ± 135.5 83 + +
14 Grewal & Zimmermann
[27] 38.1 28 ± 138 131 +
15 Present model 12.8 14.5 ± 15.3 14.1 ±
Fig. 10: Comparison of measured and predicted heat transfer
coefficients with values calculated from the present model for
non-Newtonian liquids
Relative error, %expexpcalrel
Average relative error, %nrelavrel
n = number of data sets
Standard deviation, %n5.0
2
avrelrel
n = number of data sets
Comparing the average relative errors and the
standard deviation of predicted values for all published
correlations and of the present model, it is evident that the
model developed in the present investigation provides
better results than all other correlations. This table also
indicates whether correlations tend to underpredict “” or
overpredict “” the measurements. Correlations with “
” or “ ” have a high tendency to underpredict or
overpredict the measurements, and for correlations with
“ ” no clear tendency was found.
Compared with the other correlations, the present
model for Newtonian and non-Newtonian liquids
provides better results than all other models and
correlations.
Hea
t tr
an
sfer
coef
fici
ent,
[
W/m
2K
)
(Pre
dic
ted
)
0
10
00
20
00
30
00
40
00
50
00
60
00
70
00
8
0
0
0
0 1
0
0
0
2
0
0
0
30
00
40
00
50
00
60
00
70
00
80
00
0 1000 2000 3000 4000 5000 6000 7000 8000
Heat transfer coefficient, [W/m2K]
(Experimental)
8000
7000
6000
5000
4000
3000
2000
1000
0
128
Hea
t tr
an
sfer
coef
fici
ent,
[
W/m
2K
)
(Pre
dic
ted
)

Vol. 23, No. 1, 2004 Heat Transfer of Liquid /… Iran. J. Chem. & Chem. Eng.
CONCLUSIONS
New model are presented for heat transfer coefficient
for liquid/solid fluidized beds in vertical pipes. This
mechanistic model takes into consideration the forces
acting on the particles as well as the interaction between
heat transfer surface and fluidized particles. It is
applicable for both Newtonian and non-Newtonian
liquids. Comparison with substantial data bank with data
from various authors indicates that the presented model
outperforms previously published correlations.
Nomenclature
A Heat transfer surface area m2
Ac Surface area affected by forced convection m2
Ap Surface area affected by particle m2
a, b exponents
C Coefficient
CP Heat capacity J/ kg. K
db bubble diameter m
dP Particle diameter m
D Diameter of fluidized bed m
Dh Hydraulic diameter of fluidized bed m
F Collision frequency s-1
fi Friction factor
k Viscosity coefficient Pa.sn
K Coefficient
M Coefficient
N Number of data sets
q Heat flux W/m2
T Temperature K
tc Contact time s
up Particle velocity m/s
us Superficial liquid velocity m/s
ut Particle terminal velocity corrected for
wall effect m/s
u Particle terminal velocity in an infinite fluid m/s
X Length in flow direction m
z Fluidization index
Greek letters
Heat transfer coefficient W/m2. K
Bed voidage
Thermal conductivity W/m. K
Dynamic viscosity kg/m. s
σ Standard deviation
Density kg/m3
Shear stress Pa. Sn
ψ shape factor
Shear rate s-1
a Apparent viscosity kg/m. s
Subscripts-Superscripts
a Apparent
av Average
b Bulk
c Forced convection
cal Calculated
exp Experimental
l Liquid
n Rate index
p Particle
rel Relative
s Solid
SB Static bed
W Wall
Wl Wall to adjacent liquid
Wp Wall to the particle
Dimensionless groups
Ar Archimedes number gdP3 (s -l) l / l
2
Nu Nusselt number D / l
Pr Prandtl number l Cpl / l
Re Reynolds number lUsD/l
Rep Particle terminal Reynolds number u dP / l
In an infinite liquid
Received: 20th July 2003 ; Accepted: 21st October 2003
REFERENCES
[1] Jamialahmadi, M. and Müller-Steinhagen, H.,
Hydrodynamics and Heat Transfer of Liquid
Fluidized Bed Systems, Chem. Eng. Comm., 179,
pp.35-79, (2000).
[2] Jamialahmadi, M. and Müller-Steinhagen, H., Bed
Voidage in Annular Solid-Liquid Fluidized Beds,
Chemical Engineering and Processing, 31, pp. 221-
227, (1992).
[3] Aghajani, M., Studies of Bed Voidage and Heat
Transfer in Solid-Liquid Fluidized Bed Heat
129

Vol. 23, No. 1, 2004 Aghajani, M., et. al. Iran. J. Chem. & Chem. Eng.
Exchangers, PhD thesis, University of Surrey, UK,
(2001).
[4] Yagi, S. and Wakao, N., Heat and Mass Transfer
from Wall to Fluid in Packed Beds, AICHE J., 5, pp.
79-85, (1959).
[5] Midoux, N., Wild, J., Purwasamita, M., Chapentier,
J. C. and Martin, H., Zum Flüssigkeitsinhalt und
zum Wärmeübergang in Rieselbettreaktoren bei
boher Wechselwirkung des Gases und der
Flüssigkeit, Chem. Eng. Tech., 58, pp. 142-143,
MS1445/86, (1986).
[6] Murayama, K., Fuluma, M. and Yasunishi, A., Wall-
to-Bed Heat Transfer in Liquid-Solid and Gas-
Liquid-Solid Fluidized Beds, Can. J. Chem. Eng.,
64, pp. 399-408, (1986).
[7] Schütt, U., Wärmeübertragung in der
Flüssigkeitswirbelschicht mit senkrechten Rohren,
Wiss Zeitung der Techn. Hochschule Magdeburg,
26, pp. 71-74, (1982).
[8] Kang, Y., Fan, L.T. and Kim, S. D., Immersed
Heater-Type Bed Heat Transfer in Liquid-Solid
Fluidized Beds, AIChE J., 37, pp. 1101-1106, (1991).
[9] Kollbach, J., Ph. D. Thesis, Universität Achen,
Achen, (1987).
[10] Kim, S. D., Kang, Y. and Kwon, H. K., Heat
Transfer Characteristics in Two and Three Phase
Slurry Fluidized Beds, AIChE J., 32, pp. 1397-1400,
(1986).
[11] Juma, A. K. A. and Richardson, J.F., Heat Transfer
to Cylinders from Segregating Liquid-Solid
Fluidized Beds, Chemical Engineering Science, 40,
pp. 687-694, (1985).
[12] Macias-Machin, A., Oufer, L. and Wannenmacher,
N., Heat Transfer between an Immersed Wire and a
Liquid Fluidized Bed, Powder Technology, 66, pp.
281-284, (1991).
[13] Jamialahmadi, M., Malayeri, M. R., and Mülller-
Steinhagen, H., A Unified Correlation for the
Prediction of Heat Transfer Coefficients in Liquid-
Solid Fluidized Bed Systems, Journal of Heat
Transfer, 118, pp. 952-959, (1996).
[14] Chiu, T. M. and Ziegler, E. N., Liquid Hold-up and
Heat transfer Coefficient in Liquid-Solid and Three-
Phase Fluidized Bed, AIChE J., 31, pp.1504-
1509,(1985).
[15] Jamialahmadi, M. and Müller-Steinhagen, H.,
“Forced Convective and Subcooled Flow Boiling
Heat Transfer to Spent Bayer liquor”, Light Metals,
pp. 141-150, (1992).
[16] Schütt, U., Wärmeübertragung in der
Flüssigkeitswirbelschicht mit senkrechten Rohren,
Ph. D. Thesis, Universität Magdeburg, (1983).
[17] Haid, M., Martin, H. and Müller-Steinhagen, H.,
Heat Transfer to Liquid-Solid Fluidized Beds,
Chem. Eng. and Processing, 33, pp. 211-225, (1994).
[18] Murayama, K., Fuluma, M. and Yasunishi, A., Wall-
to-Bed Heat Transfer in Gas- Liquid-Solid
Fluidized Beds, Can. J. Chem. Eng., 62, pp. 199-
208, (1984).
[19] Han, C. Y., and Griffith, P., The Mechanism of Heat
Transfer in Nucleate Pool Boiling, Part I and II, int.
J. Heat and Mass Transfer, 8, pp. 887-917, (1965).
[20] Gnielinski, V., “Wärmeübergang in Rohren”, VDI-
Wärmeatlas, 5th ed., VDI-Verlag, Düsseldorf,
(1986).
[21] Filonenko, G. K., Hydraulic Resistance in Pipes,
Teploenergetika, 1, pp. 40-44, (1954).
[22] Mickic, B. B., and Rohsenoe, W. M., A New
Correlation of Pool Boiling Data Including the
Effect of Heat Surface Characteristics, J. Heat
Transfer, 5, pp.245-250 , (1969).
[23] Martin, H., Fluid Bed Heat Exchangers- A New
Model for Particle Convection Energy Transfer,
Chem. Eng. Commun., 13, pp. 1-16, (1981).
[24] Martin, H., “ Fluidized Beds”, Heat Exchanger
Design Handbook, Hemisphere Publishing
Corporation, Washington DC, pp. 2.8.4.1-2.8.4.14,
(1990).
[25] Latif, B. A. J. and Richardson, J. F., Circulation
Patterns and Velocity Distributions for Particles in a
Liquid Fluidized Bed, Chem. Eng. Sci., 72, pp.
1933-1949, (1972).
[26] Richardson, J. F. and Smith, J. W., Heat Transfer to
Liquid-Fluidized Systems and to Suspensions of
Coarse Particles in Vertical Transport, Trans. Inst.
Chem. Eng., 40, pp.13-22, (1962).
[27] Grewal, N. S. and Zimmerman, A. T., Heat Transfer
from Tube Immersed in a Liquid-Solid Fluidized
Bed, Powder Technology, 54, pp. 137-145, (1988).
130