HEAT TRANSFER ENHAN(REV7)
24
1 EXPERIMENTAL STUDY OF VIBRATION EFFECTS ON HEAT TRANSFER DURING SOLIDIFICATION OF PARAFFIN IN A SPHERICAL SHELL Johnathan J. Vadasz (1) , Josua P. Meyer (1) , Saneshan Govender (1,2) , Gennady Ziskind (3) (1) Department of Mechanical and Aeronautical Engineering, University of Pretoria e-mail: [email protected] Corresponding Author (1) e-mail: [email protected] (1,2) Gas Division EED, ESKOM e-mail: [email protected] (3) Department of Mechanical Engineering, Ben-Gurion University e-mail: [email protected] ABSTRACT Two effects that have been observed when metals and metal alloys are vibrated during solidification are a decrease in dendritic spacing, which directly affects density, and faster cooling rates and associated solidification times. Because these two effects happen simultaneously during solidification it is challenging to determine the one effect independently from the other. Most previous studies were on metals and metal alloys. In these studies, the one effect, i.e. the decrease in dendritic spacing, might influence the other, i.e. the faster cooling rates, and vice versa. The direct link between vibration and heat transfer has not yet been studied independently. The purpose of this study was to experimentally investigate the effect of vibration only on heat transfer and thus solidification rate. Experiments were conducted on paraffin wax, because it had a clearly defined macroscopic crystal structure consisting of mostly large straight-chain hydrocarbons. The advantage of the large straight-chain hydrocarbons was that the dendritic spacing was not affected by the cooling rate. Experiments were done with paraffin wax inside hollow plastic spheres of 40 mm
Transcript of HEAT TRANSFER ENHAN(REV7)
1
EXPERIMENTAL STUDY OF VIBRATION EFFECTS ON HEAT
TRANSFER DURING SOLIDIFICATION OF PARAFFIN IN A
SPHERICAL SHELL
Johnathan J. Vadasz(1) , Josua P. Meyer(1) , Saneshan Govender(1,2), Gennady
Ziskind(3)
(1)Department of Mechanical and Aeronautical Engineering, University of Pretoria e-mail: [email protected]
Corresponding Author
(1)e-mail: [email protected]
(1,2) Gas Division EED, ESKOM e-mail: [email protected]
(3)Department of Mechanical Engineering, Ben-Gurion University
e-mail: [email protected]
ABSTRACT
Two effects that have been observed when metals and metal alloys are vibrated during
solidification are a decrease in dendritic spacing, which directly affects density, and
faster cooling rates and associated solidification times. Because these two effects
happen simultaneously during solidification it is challenging to determine the one
effect independently from the other. Most previous studies were on metals and metal
alloys. In these studies, the one effect, i.e. the decrease in dendritic spacing, might
influence the other, i.e. the faster cooling rates, and vice versa. The direct link
between vibration and heat transfer has not yet been studied independently. The
purpose of this study was to experimentally investigate the effect of vibration only on
heat transfer and thus solidification rate. Experiments were conducted on paraffin
wax, because it had a clearly defined macroscopic crystal structure consisting of
mostly large straight-chain hydrocarbons. The advantage of the large straight-chain
hydrocarbons was that the dendritic spacing was not affected by the cooling rate.
Experiments were done with paraffin wax inside hollow plastic spheres of 40 mm
2
diameter with 1 mm wall thickness. The paraffin wax was initially in a liquid state at
a uniform temperature of 60°C and then submerged into a thermal bath at a uniform
constant temperature of 15°C, which was approximately 20°C below the mean
solidification temperature of the wax. Experiments were conducted in approximately
300 samples, with and without vibration at frequencies varying from 10 – 300 Hz.
The first set of experiments were conducted to determine the solidification times. In
the second set of experiments, the mass of wax solidified was determined at discrete
time steps, with and without vibration. The results showed that paraffin wax had
vibration independent of solid density contrary to other materials, eg. metals and
metal alloys. Enhancement of heat transfer resulted in quicker solidification times and
possible control over the heat transfer rate. The increase in heat transfer leading to
faster solidifcation times was observed to first occur, as frequency increased and then
to decrease.
KEYWORDS: solidification, sphere, frequency, vibration.
3
NOMENCLATURE
a amplitude
f frequency
g gravity
Gr Grashof number
h characteristic height
H height of the porous layer
k permeability of the porous domain
m mass
r inner radius of plastic container
R scaled Rayleigh number = Ra/4π2
Rv enhancement ratio Grv/Gr = aω2/g
Ra porous media Rayleigh number = βTΔTcgkH/αeν
t time
tΔ (tS - tSV)/tS
T temperature
Vparaffin_wax volume of solid paraffin wax in plastic container
VTotal total volume of plastic container
Vwater volume of water
Greek Symbols
αe effective thermal diffusivity
βT thermal expansion coefficient
ΔT temperature difference
ΔTc characteristic temperature difference
λ Lyapunov exponent
v kinematic viscosity
ρ density
ω angular velocity = 2⋅π⋅f
Subscripts
S solidification without vibration
SV solidification under vibration
V vibration
water water at 15°C

4
INTRODUCTION
The solidification of metals, such as binary alloys, has a wide range of applications
because it constitutes the fundamental process in the production of such solid alloys.
For a solidification process that occurs via planar solidification from a solid boundary,
one may consider the presence of three distinct regions often identified as horizontal
layers, i.e. a fluid binary mixture (the melt), the solid layer and a two-phase (fluid-
solid) mushy layer, separating the other two.
The mushy layer is practically a porous medium consisting of an interconnected solid
phase and having its voids filled with the melt binary fluid. Channelling in the mushy
layer and the creating of freckles are considered the main reasons for non-
homogeneous solidification and the production of defects in the resulting solid
product, as indicated by Peppin et al. [1]. The formation of defects adversely affects
the mechanical properties of the solid product, leading to undesirable constraints on
its industrial use.
It appears that ultrasonic vibration for metallurgical applications aiming at improving
the cast metal quality dates back to 1878, as indicated by Jian et al. [2]. This suggests
that the “injection of ultrasonic energy into molten alloys brings about nonlinear
effects such as cavitation, acoustic streaming, emulsification, and radiation pressure,
which are used to refine microstructures, reduce segregation, and improve secondary
phase formation and distribution”.
In general, there is a large volume of both theoretical as well as experimental work
attempting to determine the effect of vibrations on the solidification process. An
attempt to link experimental results and theory was presented, for example, by Li et
al. [3]. Mathematical modelling of convection-induced oscillatory structure formation
in peritectic alloys was presented by Mazumder et al. [4]. This solved the convection
equations numerically and predicted a band structure for the solid composition
oscillating between two distinct values. Controlling the microstructure that results
from the casting process is considered one of the main contemporary challenges of the
foundry industry. Promoting fine microstructures in the cast is desirable because of its
resulting favourable mechanical properties of strength, and ductility, as well as low
susceptibility to microporosity and crack formation.
5
Chirita et al. [5] indicate that mechanical, sonic and ultrasonic vibrations may
promote “grain refinement, increased density, degassing, low shrinkage porosities,
and changing the shape, size and distribution of the second phase”. They investigated
the influence of vibrations on aluminium-silicon alloys. Their experimental results
show that mechanical properties were substantially affected by the level of applied
frequency. Consequently, the tensile strength was improved for low vibration
frequencies but decreased for high frequencies, as compared with gravity castings
without vibration. Chirita et al. [5] mention that “a heat-transfer mechanism, that is
acceleration dependent, seems to be responsible for the shift in mechanical properties’
response to the vibration effect”.
According to Jian et al. [2], “ultrasonic treatment of aluminium alloys, in general, has
been studied extensively and it has been shown that the introduction of high intensity
ultrasonic vibration into the melt can eliminate columnar dendritic structure, refine
the equiaxed grains, and under some conditions, produce globular non-dendritic
grains”.
Mechanisms for grain refinement under ultrasonic vibrations have been proposed, for
example, by Eskin [6] and Abramov et al. [7]. “They are related to ultrasonically
induced cavitations, which produce large instantaneous pressure and temperature
fluctuations in the melt. These pressure and temperature fluctuations are likely to
induce heterogeneous nucleation in the melt. They are also likely to promote dendrite
fragmentation by enhancing solute diffusion through acoustic streaming.” Jian et al.
[2], on the other hand, argue that there is no convincing evidence as to which
mechanism, i.e. heterogeneous nucleation or dendrite fragmentation, is more
important for grain refinement under ultrasonic vibrations.
Thus, previous work [2, 3, 4, 5, 6, 7] show two effects – a decrease in dendritic
spacing and an increase in cooling rate with vibration during solidification. However,
very limited experimental work if any was done on the effects of vibration during
solidification on the cooling rate independent of any other effects. One such work
(although numerical) was by Vadasz et al. [8] which studied the porous region under
forced vibrations and the results showed that vibration influenced the heat transfer.
6
Furthermore, because the numerical model was void of any metallurgical effects, such
as dendritic spacing, it only considered the effects on heat transfer, or cooling rate,
independently of any other effects. However, no experimental work has been done to
verify this. Therefore, the purpose of this study is to experimentally study the
vibration effects on heat transfer during solidification.
EXPERIMENTAL METHODS AND PROCEDURE
Paraffin wax, commercially referred to as RT35, was used as a medium on which to
conduct experiments because it had a clearly defined macroscopic crystal structure
consisting of mostly large straight-chain hydrocarbons. The advantage of the large
straight-chain hydrocarbons was that the dendritic spacing was not affected by the
cooling rate. The properties of the paraffin wax used were: a melting temperature of
29°C to 36°C; a solidification temperature of 36°C to 31°C (typically 35°C); with a
density of 860 kg/m3 at 15°C; and with a flashpoint of 167°C.
Experiments were conducted with spherical geometries because a comparison
(although limited) could be made to work presented by Assis et al. [9], which studied
the numerical and experimental solidification of paraffin wax, however, without
vibration. One of the diameters studied was the same as in this study and therefore
used for verification purposes. The spherical samples were generated from pouring
liquid paraffin wax into a plastic container with an inner diameter of 40 mm and a
wall thickness of 1 mm. The geometries of the plastic container were measured with a
vernier caliper.
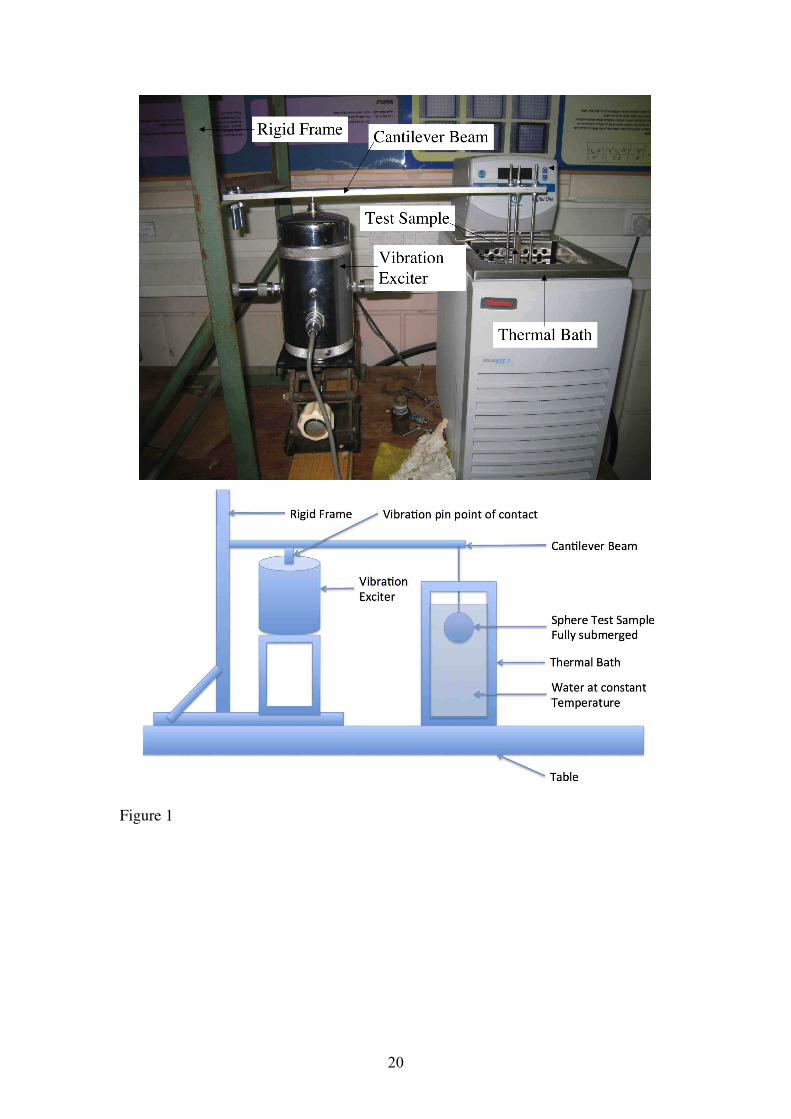
Figure 1 shows the experimental set-up that was developed on which paraffin wax
solidification experiments can be conducted, with and without vibration. The set-up
consisted of a frame, a thermal bath with deionized water in the tank, a digital scale
for weight measurements, a hot plate for melting of the paraffin wax, a data logger
thermometer with K-type thermocouple for temperature measurements of the ambient
air and molten paraffin wax, and an infrared thermometer to measure the temperature
of the solidified paraffin wax.
Liquid paraffin wax, heated to 60°C, was injected into the plastic spherical container.
It was weighed to determine the mass and was suspended into the water in the thermal
bath. The time from injection until it was placed into the water was less than 30
7
seconds. As the ambient temperature was constant at 19°C ± 2°C, the 30 seconds was
negligible in comparison with the solidification time that was measured.
A thermal bath was used to cool the paraffin wax samples. The water temperature in
the bath was maintained at 15°C ± 0.1°C. The digital scale was accurate up to 1/100th
of a gram. The hot plate was a standard 1000 W kitchen appliance. A data logger
thermometer was used with a thermocouple to measure the temperature of the paraffin
wax with accuracy up to 0.1ºC. The infrared thermometer measured ambient
temperature of 19ºC ± 2ºC.
The frame in Figure 1 was used to suspend the sample spheres inside the water tank
of the thermal bath. The frame was also used to vibrate the samples by vibrating the
cantilever beam, which suspended the samples. The cantilever beam was vibrated by
a vibration exciter, which was placed underneath it and controlled by an amplifier and
signal generator set at a frequency range between 10 – 300 Hz. The vibration exciter
had a pin, which vibrated by means of electromagnetic forces pulling it back and
forth. To avoid any slippage of the pin at the contact point with the cantilever beam, a
small recess was drilled into the beam where the pin rested. A seismometer computer
program measured the frequency and amplitude of the sample sphere by means of an
accelerometer sensor, where the amplitude was always 7.95 mm ± 0.15 mm.
Two different sets of experiments were conducted. In both sets, after the samples
were cut into two halves they were photographed.
The first set of experiments had the paraffin wax completely solidify. The
solidification time for samples, without vibration and with vibration at each
frequency, was determined by iteration. The samples were cut into two pieces and the
temperature of the paraffin wax was measured. When the temperature was measured
at 15°C ± 0.1°C, the solidification time was recorded. The mass of the solidified
paraffin wax was measured. The average density was also determined after the
paraffin wax completely solidified.
The second set of experiments removed the samples at three time steps before the
paraffin wax completely solidified. At each time step the sample was cut into two
8
halves and the remaining liquid paraffin wax was poured out. The remaining paraffin
wax was weighed and measurements of wall thickness and void size were recorded.
DATA REDUCTION
For the evaluation of the vibration effects on the solidification and thus heat transfer
rate of the paraffin wax, three variables were needed. The first was the average
density of the paraffin wax, the second was the Grashof number ratio Rv, and the third
was the solidification time improvement tΔ.
After the liquid paraffin wax inside the plastic container was submerged in the
thermal bath for a long enough period, the completely solidified paraffin wax samples
were removed from the thermal bath. The average density of the paraffin wax
completely solidified was then determined as:
ρparaffin_wax =mparaffin_wax
Vparaffin_wax
=mparaffin_wax
VTotal −Vwater=
mparaffin_wax
43πr3 − mwater
ρwater
(1)
The mass of the completely solidified paraffin wax, mparaffin_wax, and water, mwater,
which was poured into sample spheres to fill the void, were determined using the
digital scale. The density of water, ρwater, is known as 999.2 kg/m3 [10] at a
temperature of 15°C.
The other variable that needs to be determined is the ratio between the vibration
Grashof number ( GrV = aω 2βTΔTh3 /ν 2 ), with vibration presented by Bardan and
Mojtabi [11], and the Grashof number, ( Gr = gβTΔTh3 /ν 2 ), without vibration at the
paraffin wax.
Rv =GrvGr
= aω2
g (2)
The enhancement ratio, Rv, of the Grashof numbers in Equation 2 takes into
consideration the enhancement of vibration on the Grashof number, Gr. If this
9
enhancement is more than one, then it shows that vibration affected the heat transfer
during solidification. The rate of heat transfer, which is represented in a non-
dimensional form by the Nusselt number, is in general a function of the Reynolds
number, Prandtl number and Grashof number. The Grashof number is in general the
only non-dimensional group that is relevant in this study as it identifies a direct
relation to the effects of vibration as presented in Equation 2 by the enhancement
ratio. The enhancement ratio is directly proportional to the amplitude, a, and the
square of the angular velocity, ω, which is directly related to the square of the
frequency of vibrations.
The solidification time improvement was determined as
tΔ = (tS - tSV)/tS (3)
where ts was the measured time to solidification without vibration, and tsv the time to
solidifcation with vibration.
RESULTS AND DISCUSSION
The results from experiements on approximately 300 samples are presented in four
parts. The first part is to determine the density of the solidified paraffin wax. The
second part is to determine the solidification times. The third part is to determine the
effects the vibrations had on the solidification time. The fourth part is to compare the
results presented in the current study with the numerical results presented by Vadasz
et al. [8].
10
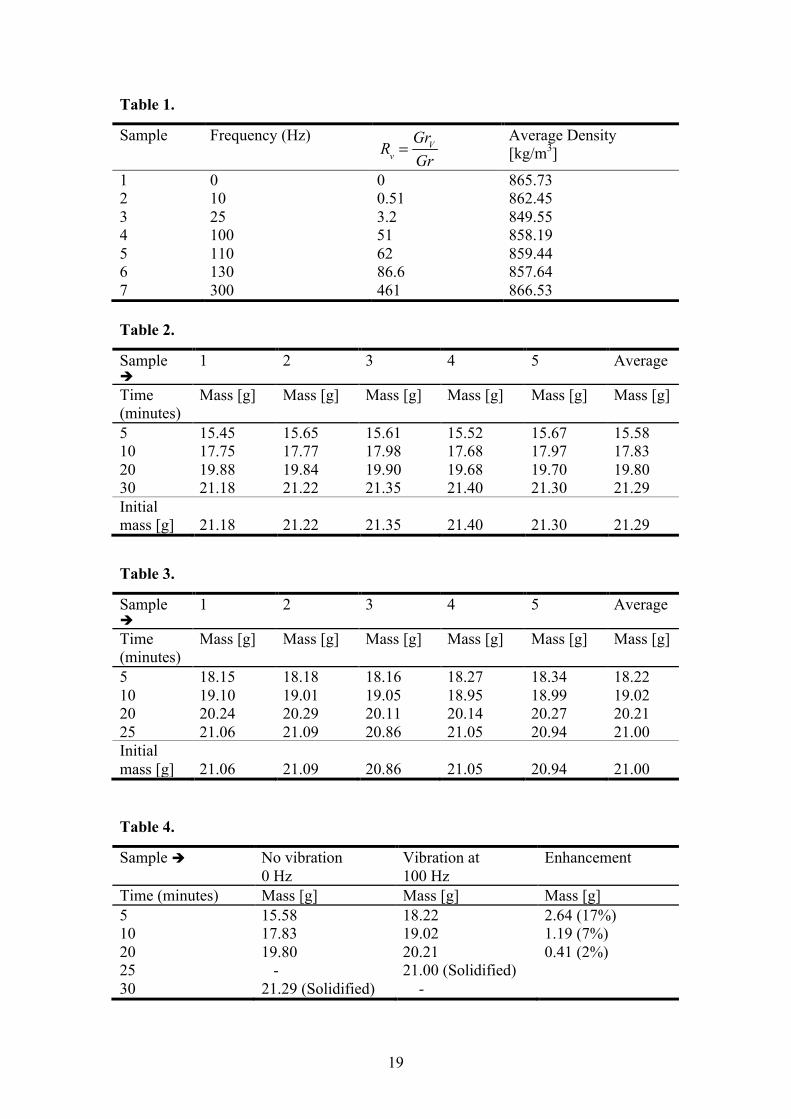
Densities
The average densities of the samples versus frequency are shown in Table 1. It was
found that for every sample of five experiments, the average densities of the
experiments varied by less than 1%. The first set of samples at a frequency of 0 Hz
shows the results for no vibration. The other six sets of samples show the frequency
ranges from 10 Hz to 300 Hz. The results show that as the enhancement ratio
increased from 0 to 461, the average densities remained constant. The average density
of all samples in Table 1 was calculated to be 859.93 kg/m3, and the highest deviation
was 1.2% from this average. Therefore, for the purpose of this study it was deduced
that the density of the solidified paraffin wax was a constant. This value compares
well with the 860 kg/m3 provided by the supplier of the paraffin wax.
Solidification times
The solidification time of samples without vibration is shown in Table 2 and with
vibration in Table 3. From Table 2, it can be concluded that the paraffin wax
solidified mass increased at each of the four time steps for all five samples without
vibration, and Table 3, with vibration frequency of 100 Hz.
Table 2 shows that all the samples of paraffin wax completely solidified at 30
minutes, and 25 minutes in Table 3. The experiments presented by Table 2 show the
solidified paraffin wax was at 15ºC at it’s centre where the time of 30 minutes was
recorded, and similarly, 25 minutes was recorded in Table 3. An iterative process of
experiments led to these results. The 100 Hz frequency, shown in Table 3, was found
to be the optimum frequency where the vibration had most affected the solidification
time. This optimum frequency was used for all other experiments in the study. The
solidification time result of 30 minutes without vibration shown in Table 2 compares
well with the numerical and experimental results presented by Assis et al. [9], where
the solidification time shown for 40 mm paraffin wax samples without vibration was
approximately 36 minutes. The difference of 6 minutes may be due to the paraffin
wax that was used by Assis et al. [9], having had a lower solidfication temperature
than the one used in this study by a difference of about 7°C.
11
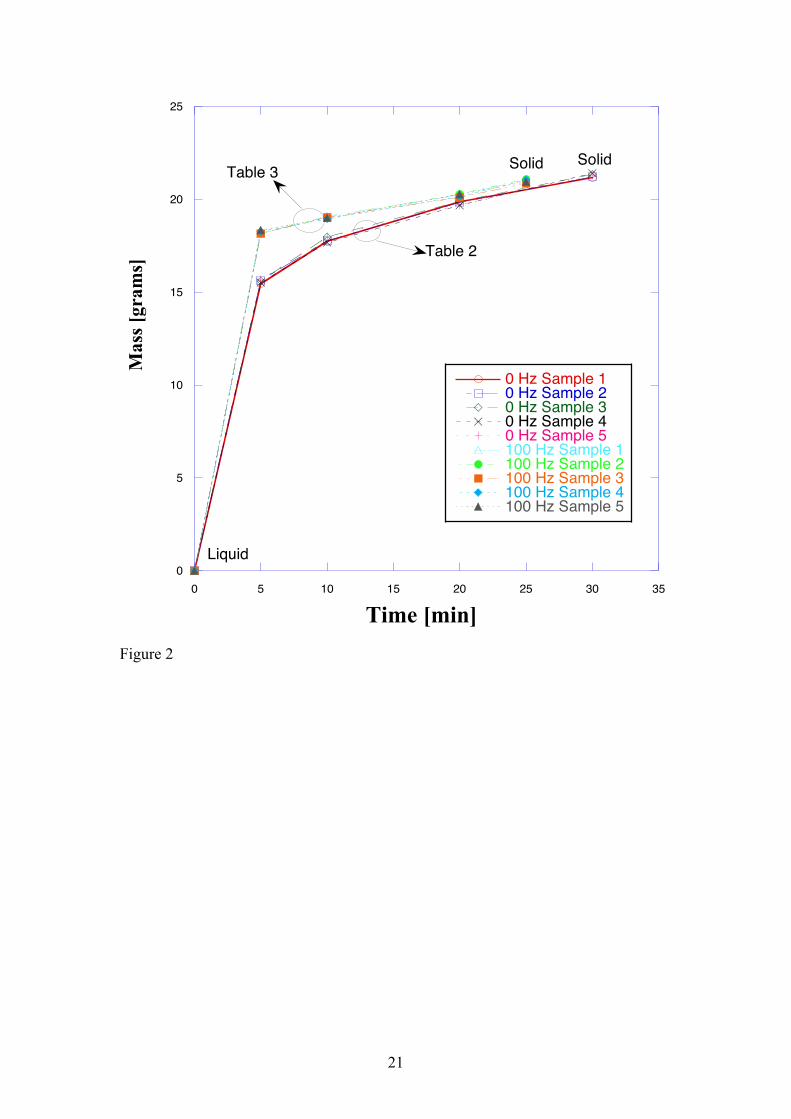
Effect of vibration on solidification times
Each one of the five sets of samples, from Table 2 and Table 3, is shown in Figure 2.
The mass of the samples without vibration (Table 2) and the samples with vibration
(Table 3) each varied by less than 1%. Furthermore, the results show that the mass
solidified with vibration was always higher then the mass solidified without vibration.
The averaged results (in the last columns) from Table 2 and Table 3 are presented in
Table 4.
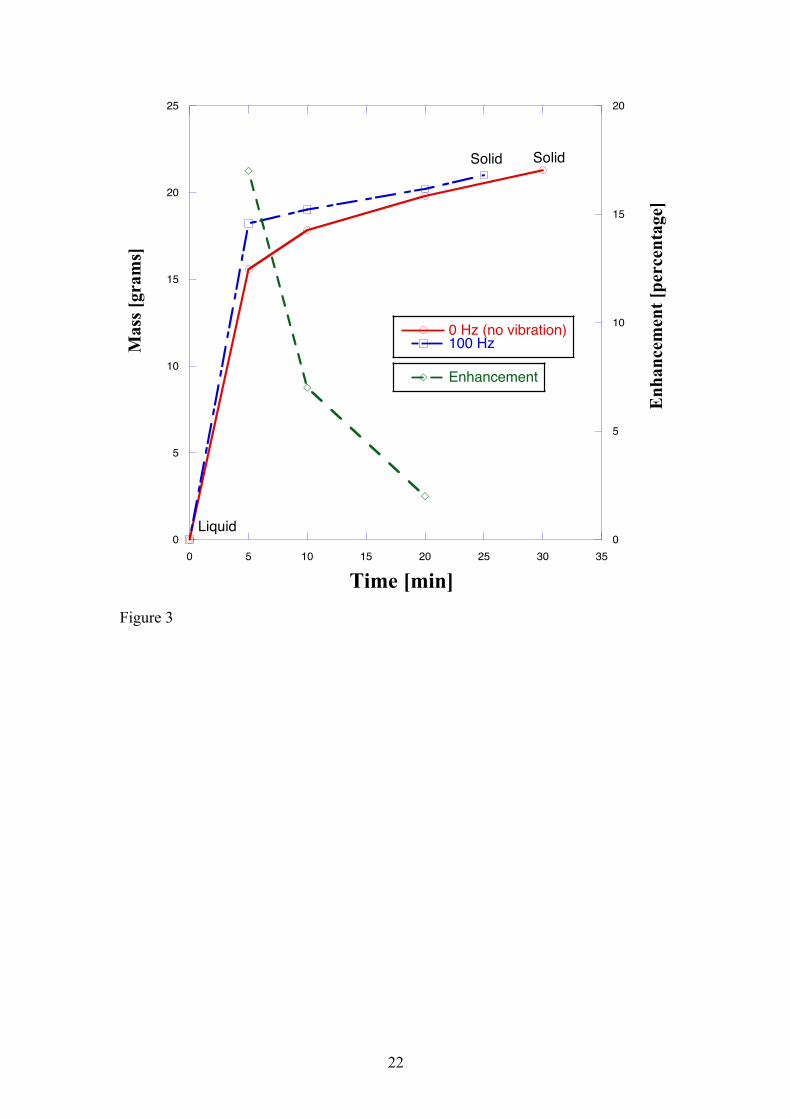
It is shown that at 5 minutes, more solidified paraffin wax was formed under vibration
comparing the 18.22 g with the 15.58 g under no vibration. This result shows a 2.64 g
of extra paraffin wax that solidified with a vibration frequency of 100 Hz at 5
minutes, which is 17% higher than that without vibration. Table 4 is presented on a
graph in Figure 3, which also shows how the line for solidification under vibration
frequency of 100 Hz is always above that of the line representing no vibration for
each time step above 0 minutes and below 25 minutes.
In Figure 3, the enhancement line shows the difference between the mass formed with
and without vibration, presented in the last column of Table 4. The results from Table
4 show there was more heat transfer with vibration, and an overall 17% improvement
in solidification time calculated using Equation 3 and the final solidification times.
In Table 4 it is also shown how the enhancement decreased per time step, which is
also clear from Figure 3 because as the two lines representing solidification under
vibration and without vibration get closer. The final difference between the two
solidified masses of 21.29 g and 21.00 g, which is 0.29 g, shown in Table 4, is due to
the initial amounts of liquid paraffin wax that were not exactly the same.
As the enhancement decays show in Table 4 and Figure 3, it never reaches zero. This
means there is always more solidified paraffin wax formed under vibration than
without. The significance of the decay may be attributed to the amount of liquid and
solid in the sample. There are two suggested reasons for the decay. The first reason is
because more solid was formed, the wall temperature had to be higher or equal than
the thermal bath because it has only reached solid state, and also the liquid surface
boundary was reduced, further decreasing heat transfer to the surroundings. The
12
second considers the three layers during solidification, the solid, the liquid and the
mushy layer. During solidification the solid layer increases, and thus the other two
layers, the liquid and mushy layer, decrease. Since the effects of vibration happen in
the liquid and mushy layer, it would make sense that as these layers get smaller the
decay would also be affected.
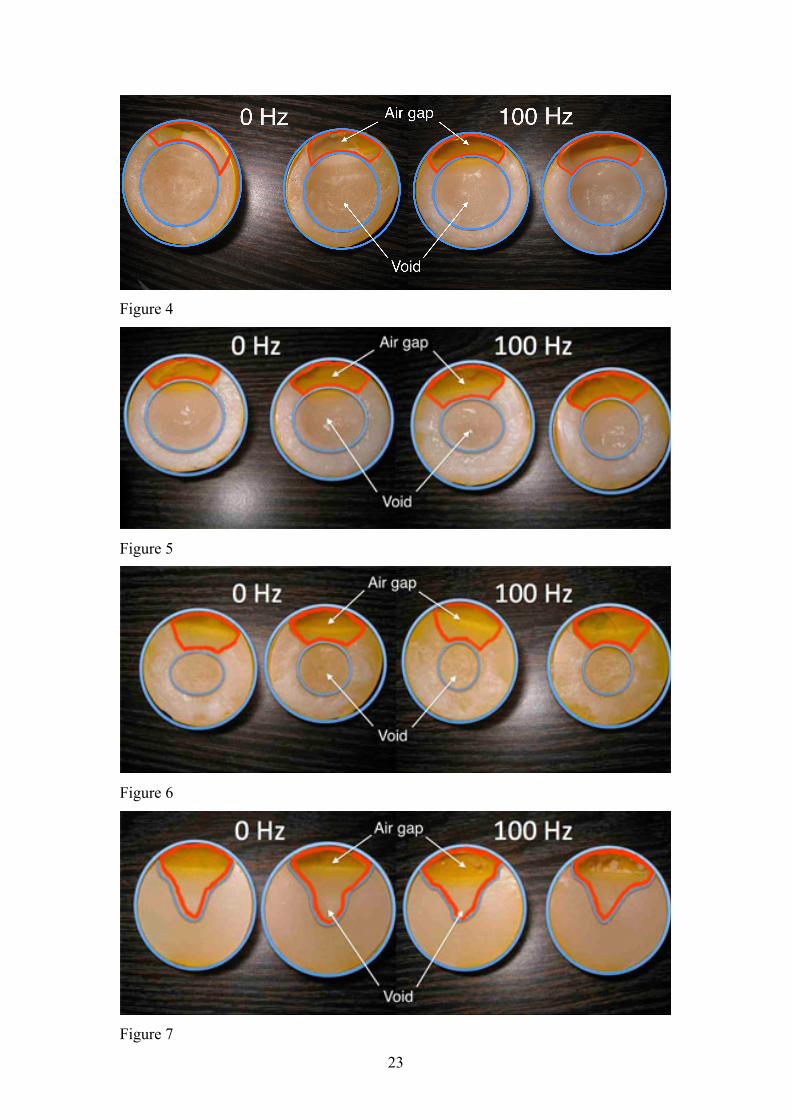
Figure 4 shows the paraffin wax solidified after 5 minutes without vibration and with
a vibration frequency of 100 Hz. The outside blue line indicates the plastic sphere
boundary, and the inside blue line indicates the void in the centre. The paraffin wax
solidified between the two blue lines is shown, excluding the air gap at the top
identified with a red line. Measurements of the average wall thickness of the
solidified paraffin wax were taken and the results show approximately 2 – 3 mm ± 0.1
mm difference between the two samples, with the larger average wall thickness being
that of the vibrated sample at 100 Hz.
Figures 5 and 6 show the paraffin wax solidified after 10 minutes and 20 minutes
without vibration and with a vibration frequency of 100 Hz respectivaly.
Measurements of the average wall thickness of the solidified paraffin wax were taken
and the results show a difference of approximately 2 – 2.5 mm ± 0.1 mm after 10
minutes (Figure 5) and 1.5 – 2 mm ± 0.1 mm after 20 minutes (Figure 6) between the
two samples, with the larger average wall thickness being that of the vibrated sample
at 100 Hz.
The final solidification time shown in Figure 7 shows the samples after 30 minutes
without vibration and 25 minutes with vibration frequency of 100 Hz. It can be
observed that although the void was still present in Figure 7 when there was vibration,
it is very similar to the void formed without vibration. This is confirmed by the
density calculations done in Table 1. This means that the voids were geometrically of
the same size.
The samples in Figures 4 – 7 are one set of five done. The other four sets of
experiments were done to check for repeatability. These results are shown in Table 2
and Table 3 for five samples each.
13
Comparison with numerical results
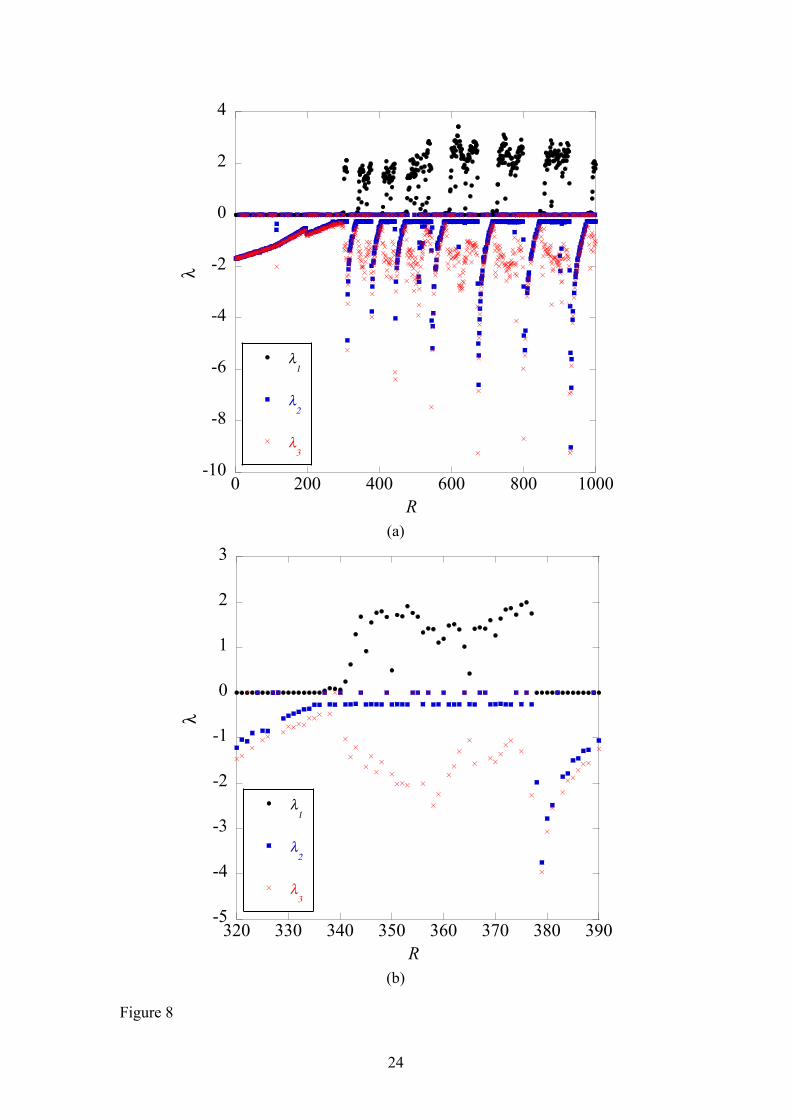
The numerical results presented by Vadasz et al. [8] considered the vibration effects
in a porous medium and were therefore used for comparison purposes. Figure 8 shows
a graphical representation of the Lyapunov exponents as a function of the scaled
Rayleigh number. A quantitative comparison of the experimental results of this study
with the numerical work of Vadasz et al. [8] was not possible. The reason was that the
numerical work solved the porous medium equations with vibration, whereas the
current study considered the solidification process with vibration where the porous
medium conditions could not be measured. However, qualitatively, a comparison
could be made. The reason was that the effects of vibration were in the porous layer,
as stated earlier. This meant that any effect in the porous layer would further affect
the solidification process.
In Figure 8 (a), a chaotic orbit is observed at a scaled Rayleigh number when there is
one or more positive Lyapunov exponents, a quasi-periodic orbit is observed when
there is one negative Lyapunov exponent and two equal to zero, a periodic orbit is
observed when there are two negative Lyapunov exponents and one equal to zero, and
a fixed point is observed when all Lyapunov exponents are negative. Figure 8 (a)
shows chaotic “bursts” at specific values of the scaled Raleigh number. This
behaviour is quite distinct from the case without forced vibrations, when the chaotic
solution occupies a wide range of scaled Rayleigh number values, interrupted only by
periodic “bursts” in Vadasz et al. [8]. This result shows that the vibrations affect the
heat transfer in a porous medium, yet what that effect is, is still to be determined.
Figure 8 (b) shows a zoomed-in section of Figure 8 (a) for a smaller range of the
scaled Rayleigh number. It can clearly be observed how many positive, negative and
zero values are present in the Lyapunov exponents. Depending on the scaled Rayleigh
number range of interest, a graph can be used to determine the exact values where a
chaotic orbit changes to periodic, and back to chaotic.
In the current study, it was shown experimentally that the rate of solidification is
increased when vibrations were introduced during the solidification process. Since the
effects of vibration would only affect the porous section and/or liquid we can assume
that the results presented by Vadasz et al. [8] in the porous medium might be linked to
the results seen in the current study of solidification. It is also clear that vibrations do
14
have an effect on the porous medium section as presented by Vadasz et al. [8] for
Prandtl number in the range representing paraffin wax. Therefore, as a qualitative
comparison, the results in the current study showing vibration having an effect on
solidification may be due to the effects in the porous medium as seen in Vadasz et al.
[8].
CONCLUSIONS
The direct link between vibration and heat transfer has not yet been studied
independently. The purpose of this study was to experimentally investigate the effect
of vibration only on heat transfer and thus solidification rate. Experiments were
conducted on paraffin wax, because it had a clearly defined macroscopic crystal
structure consisting of mostly large straight-chain hydrocarbons. The advantage of the
large straight-chain hydrocarbons was that the dendritic spacing was not affected by
the cooling rate.
It was found from experiments that the average densities of the paraffin wax samples
were not affected by vibration during solidification. The average deviation between
samples varied by less than 1.2%, therefore, the density of the solidified paraffin wax
was a considered constant. The experimental results indicated a decrease in
solidification time of 17% (or increase in heat transfer) during solidification process
with vibration when compared with to that without. This result was observed at an
optimal vibration frequency of 100 Hz. The decay in the increased rate of
solidification under vibration could also be seen in this study. The decay shown by the
decrease in mass enhancement from 17% down to 2% suggests a possible oscillatory
decay. The enhancement ratio shown to increase from a value of 0 – 461, with
increase in frequency from 0 – 300 Hz, presents no effects on the average solid
density of the paraffin wax. Therefore, the current study has showed an independent
relationship between the mechanical vibration properties and heat transfer (related to
solidification time) during solidification, where the microstructure and material
properties, such as dendritic spacing and denstiy, did not affect the cooling rate in the
experiments. The numerical work referenced observed that vibration affected the
porous media over a scaled Rayleigh number covering the range where paraffin wax
15
would be. Qualititively, the comparsion with the numerical work obsereved that there
was an effect on the solidification process due to vibration.
Further investigation will need to be conducted to understand better the effects seen in
this paper and to look at the possible oscillatory decay or growth. More resolution in
terms of the results, especially during the early parts of solidification, may give a
better picture of how vibrations affect the cooling rate or solidification time.
ACKNOWLEDGEMENTS
The University of Pretoria and Prof JP Meyer gave much support for this project, both
financial and intellectual. Also Ben-Gurion University, Prof G Ziskind and Prof A
Levi provided much input into the project and supplied the equipment and facilities to
run the project.
REFERENCES
1. S. S. L. Peppin, P. Aussillous, H. E. Huppert and M. Grae Worster, Steady-state
mushy layers: experiments and theory, Journal of Fluid Mechanics, 570, 69-77,
2007.
2. X. Jian, H. Xu, T. T. Meek and Q. Han, Effect of power ultrasound on
solidification of aluminum A356 alloy, Materials Letters, 59, 190–193, 2005.
3. M. Li, T. Tamura and K. Miwa, Controlling microstructures of AZ31 magnesium
alloys by an electromagnetic vibration technique during solidification: from
experimental observation to theoretical understanding, Acta Materialia, 55,
4635–4643, 2007.
4. P. Mazumder, R. Trivedi and A. Karma, A Model of Convection-Induced
Oscillatory Structure Formation in Peritectic Alloys, Metallurgical and Materials
Transactions A, 31A, 1233-1246, 2000.
5. G. Chirita, I. Stefanescu, D. Soares and F. S. Silva, Influence of vibration on the
solidification behaviour and tensile properties of an Al–18 wt%Si alloy,
Materials and Design, 30, 1575–1580, 2009.
6. G. I. Eskin, Influence of cavitation treatment of melts on the processes of
nucleation and growth of crystals during solidification of ingots and castings
from light alloys, Ultrasonics Sonochemistry, 1 (1), S59-S63, 1994.
16
7. V. Abramov, O. Abramov, V. Bulgakov and F. Sommer, Solidification of
aluminium alloys under ultrasonic irradiation using water-cooled resonator,
Materials Letters, 37 (1-2), 27-34, 1998.
8. J. Vadasz, J. P. Meyer and S. Govender, Chaotic and Periodic Natural
Convection for Moderate and High Prandtl Numbers in a Porous Layer subject to
Vibrations, Transport in Porous Media Journal, 103 (2), 279-294, 2014.
9. E. Assis, G. Ziskind and R. Letan, Numerical and Experimental Study of
Solidification in a Spherical Shell, J. of Heat Transfer, 131 (2), 024502, 2008.
10. M. J. Moran, H. N. Shapiro, et al., Fundamentals of Engineering
Thermodynamics 7th edition, John Wiley& Sons, Inc., 2011.
11. G. Bardan and A. Mojtabi, On the Horton – Rogers – Lapwood convective
instability with vertical vibration: Onset of convection, Physics of Fluids, 12 (11),
2723–2731, 2000.
17
LIST OF TABLES:
Table 1. Samples showing the relationship between the enhancement ratio Grv/Gr
and the average density of solidified paraffin wax. Every sample is the
average of five samples.
Table 2. Measured mass of solidified paraffin wax at different times under no
vibration for five samples.
Table 3. Measured mass of solidified paraffin wax at different times under a
vibration frequency of 100 Hz for five samples.
Table 4. Average calculated mass of solidified paraffin wax at different times for no
vibration and vibration at frequency of 100 Hz. The results are the average
results in the last columns of Tables 2 and 3.
18
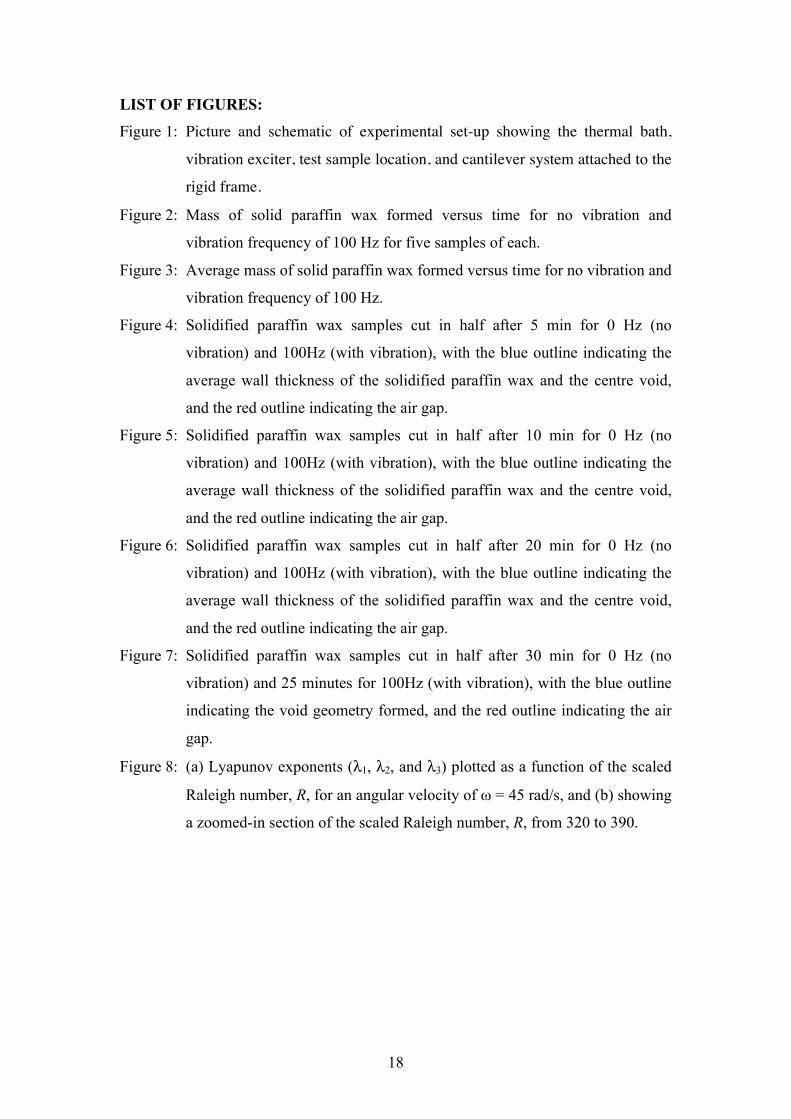
LIST OF FIGURES:
Figure 1: Picture and schematic of experimental set-up showing the thermal bath,
vibration exciter, test sample location, and cantilever system attached to the
rigid frame.
Figure 2: Mass of solid paraffin wax formed versus time for no vibration and
vibration frequency of 100 Hz for five samples of each.
Figure 3: Average mass of solid paraffin wax formed versus time for no vibration and
vibration frequency of 100 Hz.
Figure 4: Solidified paraffin wax samples cut in half after 5 min for 0 Hz (no
vibration) and 100Hz (with vibration), with the blue outline indicating the
average wall thickness of the solidified paraffin wax and the centre void,
and the red outline indicating the air gap.
Figure 5: Solidified paraffin wax samples cut in half after 10 min for 0 Hz (no
vibration) and 100Hz (with vibration), with the blue outline indicating the
average wall thickness of the solidified paraffin wax and the centre void,
and the red outline indicating the air gap.
Figure 6: Solidified paraffin wax samples cut in half after 20 min for 0 Hz (no
vibration) and 100Hz (with vibration), with the blue outline indicating the
average wall thickness of the solidified paraffin wax and the centre void,
and the red outline indicating the air gap.
Figure 7: Solidified paraffin wax samples cut in half after 30 min for 0 Hz (no
vibration) and 25 minutes for 100Hz (with vibration), with the blue outline
indicating the void geometry formed, and the red outline indicating the air
gap.
Figure 8: (a) Lyapunov exponents (λ1, λ2, and λ3) plotted as a function of the scaled
Raleigh number, R, for an angular velocity of ω = 45 rad/s, and (b) showing
a zoomed-in section of the scaled Raleigh number, R, from 320 to 390.
19
Table 1.
Sample Frequency (Hz)
Rv =
GrV
Gr
Average Density [kg/m3]
1 0 0 865.73 2 10 0.51 862.45 3 25 3.2 849.55 4 100 51 858.19 5 110 62 859.44 6 130 86.6 857.64 7 300 461 866.53 Table 2.
Sample
1 2 3 4 5 Average
Time (minutes)
Mass [g] Mass [g] Mass [g] Mass [g] Mass [g] Mass [g]
5 15.45 15.65 15.61 15.52 15.67 15.58 10 17.75 17.77 17.98 17.68 17.97 17.83 20 19.88 19.84 19.90 19.68 19.70 19.80 30 21.18 21.22 21.35 21.40 21.30 21.29 Initial mass [g]
21.18
21.22
21.35
21.40
21.30
21.29
Table 3.
Sample
1 2 3 4 5 Average
Time (minutes)
Mass [g] Mass [g] Mass [g] Mass [g] Mass [g] Mass [g]
5 18.15 18.18 18.16 18.27 18.34 18.22 10 19.10 19.01 19.05 18.95 18.99 19.02 20 20.24 20.29 20.11 20.14 20.27 20.21 25 21.06 21.09 20.86 21.05 20.94 21.00 Initial mass [g]
21.06
21.09
20.86
21.05
20.94
21.00
Table 4.
Sample No vibration 0 Hz
Vibration at 100 Hz
Enhancement
Time (minutes) Mass [g] Mass [g] Mass [g] 5 15.58 18.22 2.64 (17%) 10 17.83 19.02 1.19 (7%) 20 19.80 20.21 0.41 (2%) 25 - 21.00 (Solidified) 30 21.29 (Solidified) -
20
Figure 1
21
Figure 2
0
5
10
15
20
25
0 5 10 15 20 25 30 35
0 Hz Sample 10 Hz Sample 20 Hz Sample 30 Hz Sample 40 Hz Sample 5100 Hz Sample 1100 Hz Sample 2100 Hz Sample 3100 Hz Sample 4100 Hz Sample 5
Mas
s [gr
ams]
Time [min]
Solid Solid
Liquid
Table 3
Table 2
22
Figure 3
0
5
10
15
20
25
0
5
10
15
20
0 5 10 15 20 25 30 35
0 Hz (no vibration)100 Hz
Enhancement
Time [min]
Mas
s [gr
ams]
Enh
ance
men
t [pe
rcen
tage
]
Solid Solid
Liquid
23
Figure 4
Figure 5
Figure 6
Figure 7
24
(a)
(b)
Figure 8
-10
-8
-6
-4
-2
0
2
4
0 200 400 600 800 1000
λ1
λ2
λ3
R
λ
-5
-4
-3
-2
-1
0
1
2
3
320 330 340 350 360 370 380 390
λ1
λ2
λ3
R
λ